
Evolutionary Method of Heterogeneous Combat Network Based on Link Prediction


Abstract
:1. Introduction
2. Related Work
3. Link Prediction Based on Frequent Subgraphs
3.1. Link Prediction Index Design
| Algorithm 1 Link prediction based on frequent subgraphs (LPFS) |
Input: G, , Output: 1: 2: for in do 3: if then 4: 5: 6: end if 7: end for 8: return |
3.2. Link Prediction Evaluation Indicator
4. Evolution of Heterogeneous Combat Networks
4.1. Heterogeneous Combat Network Operational Capabilities
| Algorithm 2 Calculate operational networks ability (Cal_ability) |
Input: G, Output: 1: 2: 3: 4: for s in S do 5: for i in I do 6: for do 7: if then 8: 9: end if 10: end for 11: end for 12: end for 13: return |
4.2. Evolution of Heterogeneous Combat Networks
| Algorithm 3 Heterogeneous Combat Networks Evolution (HCNE) add_edge |
Input: Output: 1: 2: 3: for i in do 4: for in do 5: node1,node2,edge_type= scores.key() 6: if then 7: 8: 9: 10: 11: break 12: end if 13: end for 14: end for 15: return |
| Algorithm 4 Heterogeneous Combat Networks Evolution (HCNE) add_node |
Input: Output: 1: 2: 3: for in do 4: 5: for i in do 6: for in do 7: 8: if then 9: 10: 11: break 12: end if 13: if then 14: 15: 16: break 17: end if 18: 19: 20: end for 21: end for 22: end for 23: return |
5. Experiments
5.1. Link Prediction
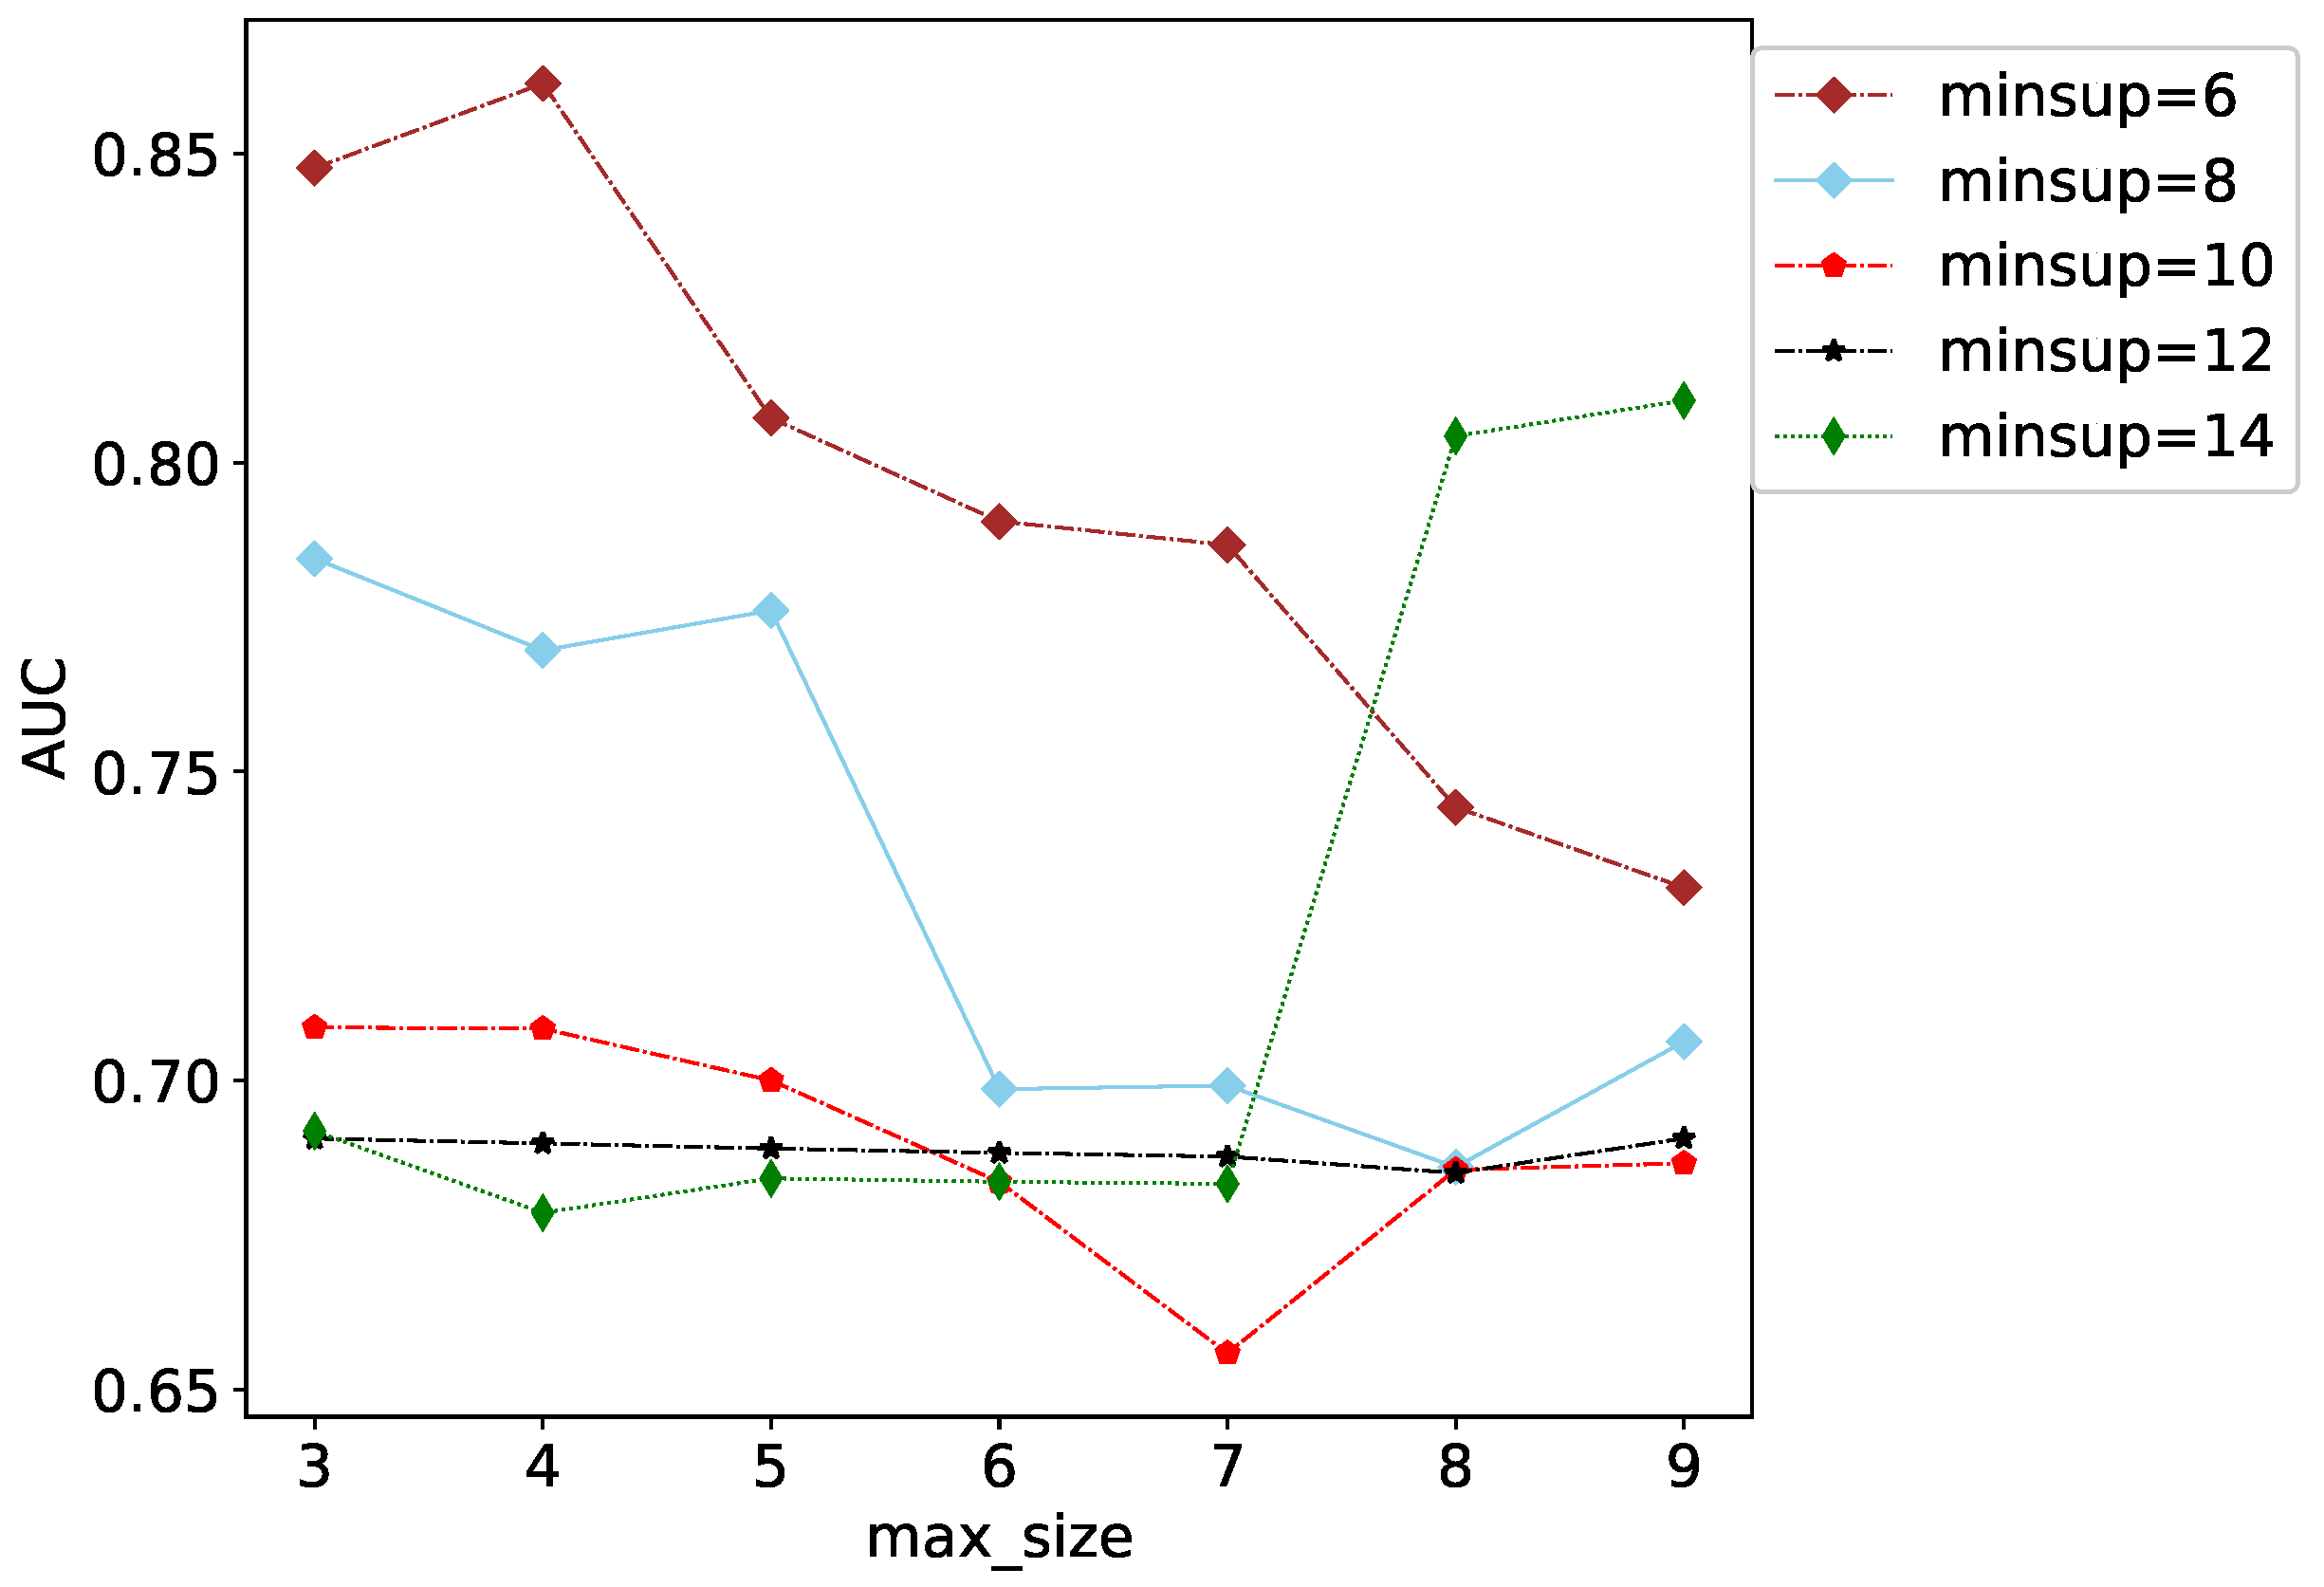
Parameter Discussion
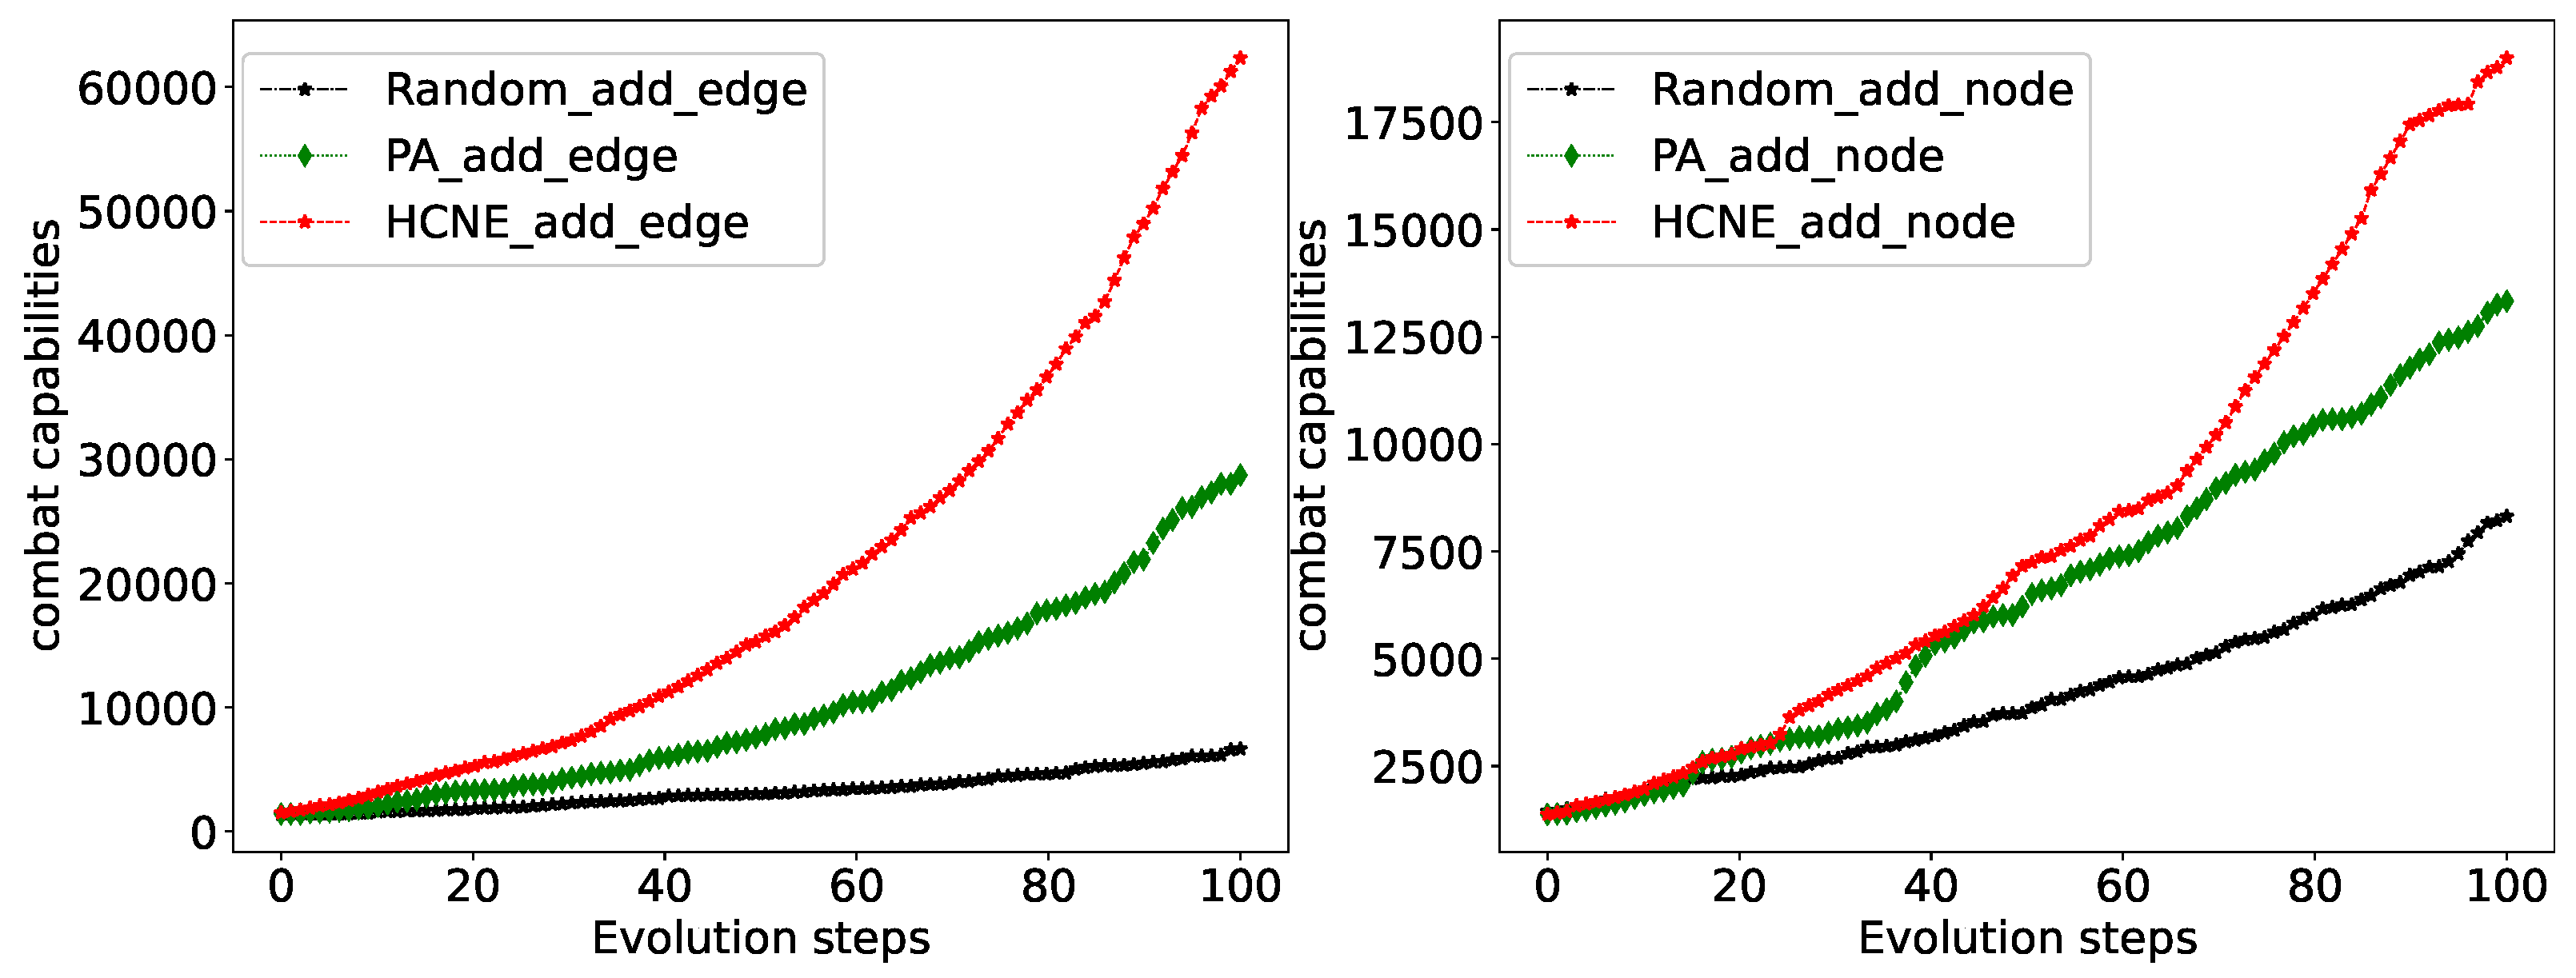
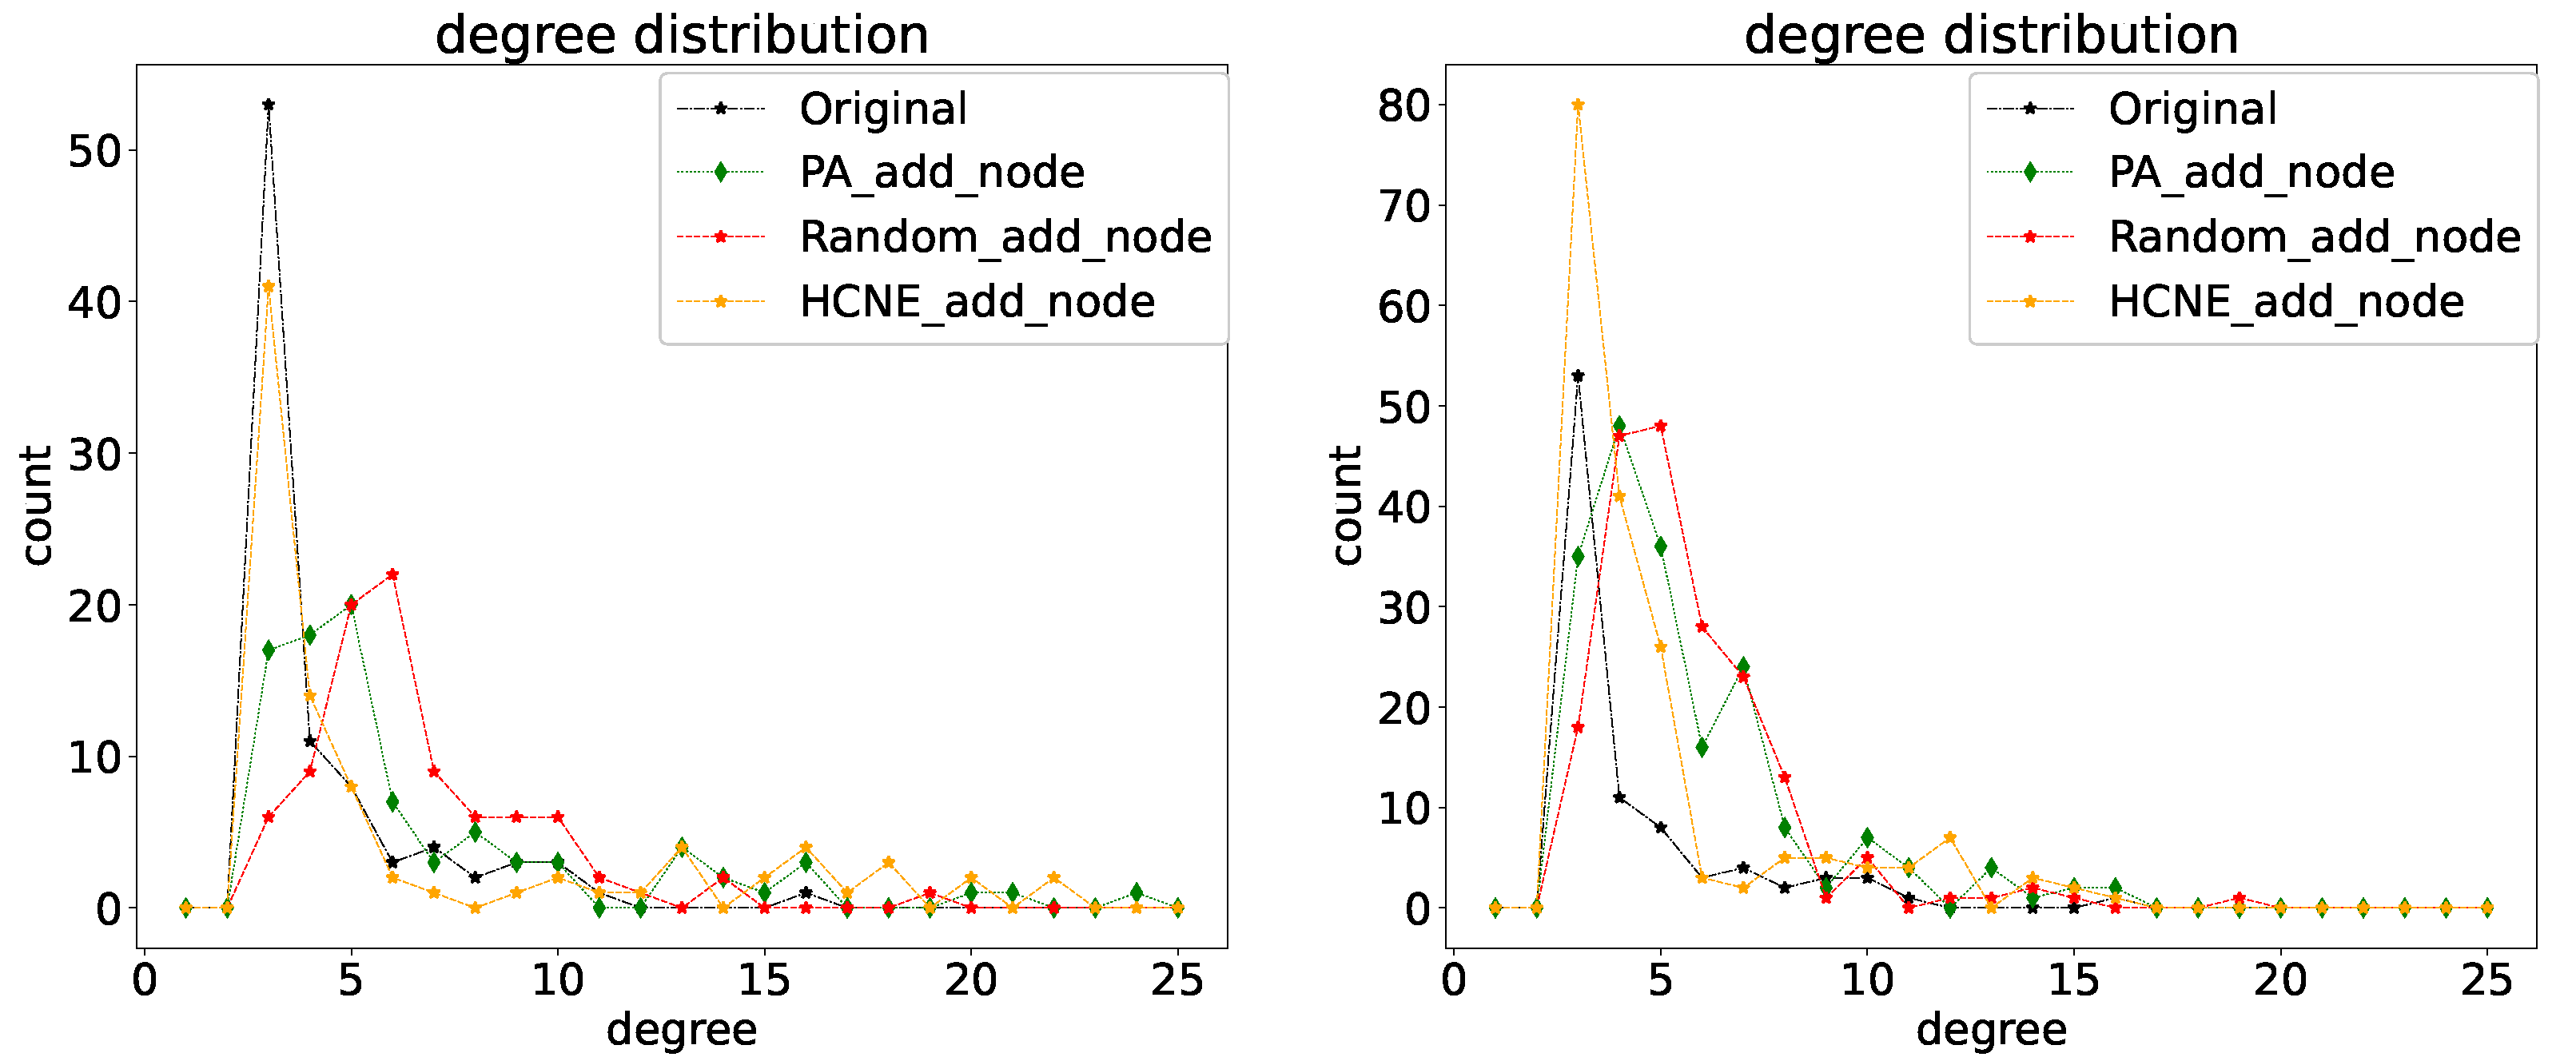
5.2. Evolution of Heterogeneous Combat Networks
6. Summary and Analysis
Author Contributions
Funding
Data Availability Statement
Acknowledgments
Conflicts of Interest
References
- AbuOda, G.; De Francisci Morales, G.; Aboulnaga, A. Link prediction via higher-order motif features. In Proceedings of the Machine Learning and Knowledge Discovery in Databases: European Conference, Würzburg, Germany, 16–20 September 2019; Part I. Springer International Publishing: Cham, Switzerland, 2020; pp. 412–429. [Google Scholar]
- Zhao, F.; Zhang, Y.; Lu, J.; Shai, O. Measuring academic influence using heterogeneous author-citation networks. Scientometrics 2019, 118, 1119–1140. [Google Scholar] [CrossRef]
- Weng, L.; Zhang, Q.; Lin, Z.; Wu, L. Harnessing heterogeneous social networks for better recommendations: A grey relational analysis approach. Expert Syst. Appl. 2021, 174, 114771. [Google Scholar] [CrossRef]
- Zañudo, J.G.T.; Yang, G.; Albert, R. Structure-based control of complex networks with nonlinear dynamics. Proc. Natl. Acad. Sci. USA 2017, 114, 7234–7239. [Google Scholar] [CrossRef] [PubMed]
- Cares, J.R. An Information Age Combat Model; Alidade Incorporated: Newport, RI, USA, 2005. [Google Scholar]
- Dekker, A.H. Network topology and military performance. In MODSIM 2005 International Congress on Modelling and Simulation; Modelling and Simulation Society of Australia and New Zealand Inc.: Wageningen, The Netherlands, 2005; pp. 2174–2180. [Google Scholar]
- Li, J.; Tan, Y.; Yang, K.; Zhang, X.; Ge, B. Structural robustness of combat networks of weapon system-of-systems based on the operation loop. Int. J. Syst. Sci. 2017, 48, 659–674. [Google Scholar] [CrossRef]
- Li, J.; Zhao, D.; Jiang, J.; Yang, K.; Chen, Y. Capability oriented equipment contribution analysis in temporal combat networks. IEEE Trans. Syst. Man Cybern. Syst. 2018, 51, 696–704. [Google Scholar] [CrossRef]
- Chen, K.; Lu, Y.; Guo, L.; Zheng, X.; Wu, J.; Zhao, L. A Genetic Algorithm-Based Methodology for Analyzing the Characteristics of High-Operational-Capability Combat Networks. IEEE Access 2022, 10, 14717–14730. [Google Scholar] [CrossRef]
- Lü, L.; Zhou, T. Link prediction in complex networks: A survey. Phys. A Stat. Mech. Appl. 2011, 390, 1150–1170. [Google Scholar] [CrossRef]
- Kumar, A.; Singh, S.S.; Singh, K.; Biswas, B. Link prediction techniques, applications, and performance: A survey. Phys. A Stat. Mech. Appl. 2020, 553, 124289. [Google Scholar] [CrossRef]
- Wang, X.; Chai, Y.; Li, H.; Wu, D. Link prediction in heterogeneous information networks: An improved deep graph convolution approach. Decis. Support Syst. 2021, 141, 113448. [Google Scholar] [CrossRef]
- Fan, C.; Liu, Z.; Lu, X.; Xiu, B.; Chen, Q. An efficient link prediction index for complex military organization. Phys. A Stat. Mech. Appl. 2017, 469, 572–587. [Google Scholar] [CrossRef]
- Li, J.; Ge, B.; Yang, K.; Chen, Y.; Tan, Y. Meta-path based heterogeneous combat network link prediction. Phys. A Stat. Mech. Appl. 2017, 482, 507–523. [Google Scholar] [CrossRef]
- Li, J.; Zhao, D.; Ge, B.; Yang, K.; Chen, Y. A link prediction method for heterogeneous networks based on BP neural network. Phys. A Stat. Mech. Appl. 2018, 495, 1–17. [Google Scholar] [CrossRef]
- Dorogovtsev, S.N.; Mendes, J.F.F. Evolution of networks. Adv. Phys. 2002, 51, 1079–1187. [Google Scholar] [CrossRef]
- Lin, D.; Wu, J.; Xuan, Q.; Tse, C.K. Ethereum transaction tracking: Inferring evolution of transaction networks via link prediction. Phys. A Stat. Mech. Appl. 2022, 600, 127504. [Google Scholar] [CrossRef]
- Elseidy, M.; Abdelhamid, E.; Skiadopoulos, S.; Kalnis, P. Grami: Frequent subgraph and pattern mining in a single large graph. Proc. VLDB Endow. 2014, 7, 517–528. [Google Scholar] [CrossRef]
- Yan, X.; Han, J. gSpan: Graph-based substructure pattern mining. In Proceedings of the IEEE International Conference on Data Mining, Maebashi City, Japan, 9–12 December 2002; pp. 721–724. [Google Scholar]
- Richards, C. Boyd’s OODA loop. Necesse 2020, 5, 142–165. [Google Scholar]
- Dekker, A.H. Measuring the agility of networked military forces. J. Battlef. Technol. 2006, 9, 19–24. [Google Scholar]
- Chen, L.; Wang, C.; Zeng, C.; Wang, L.; Liu, H.; Chen, J. A novel method of heterogeneous combat network disintegration based on deep reinforcement learning. Front. Phys. 2022, 10, 1021245. [Google Scholar] [CrossRef]


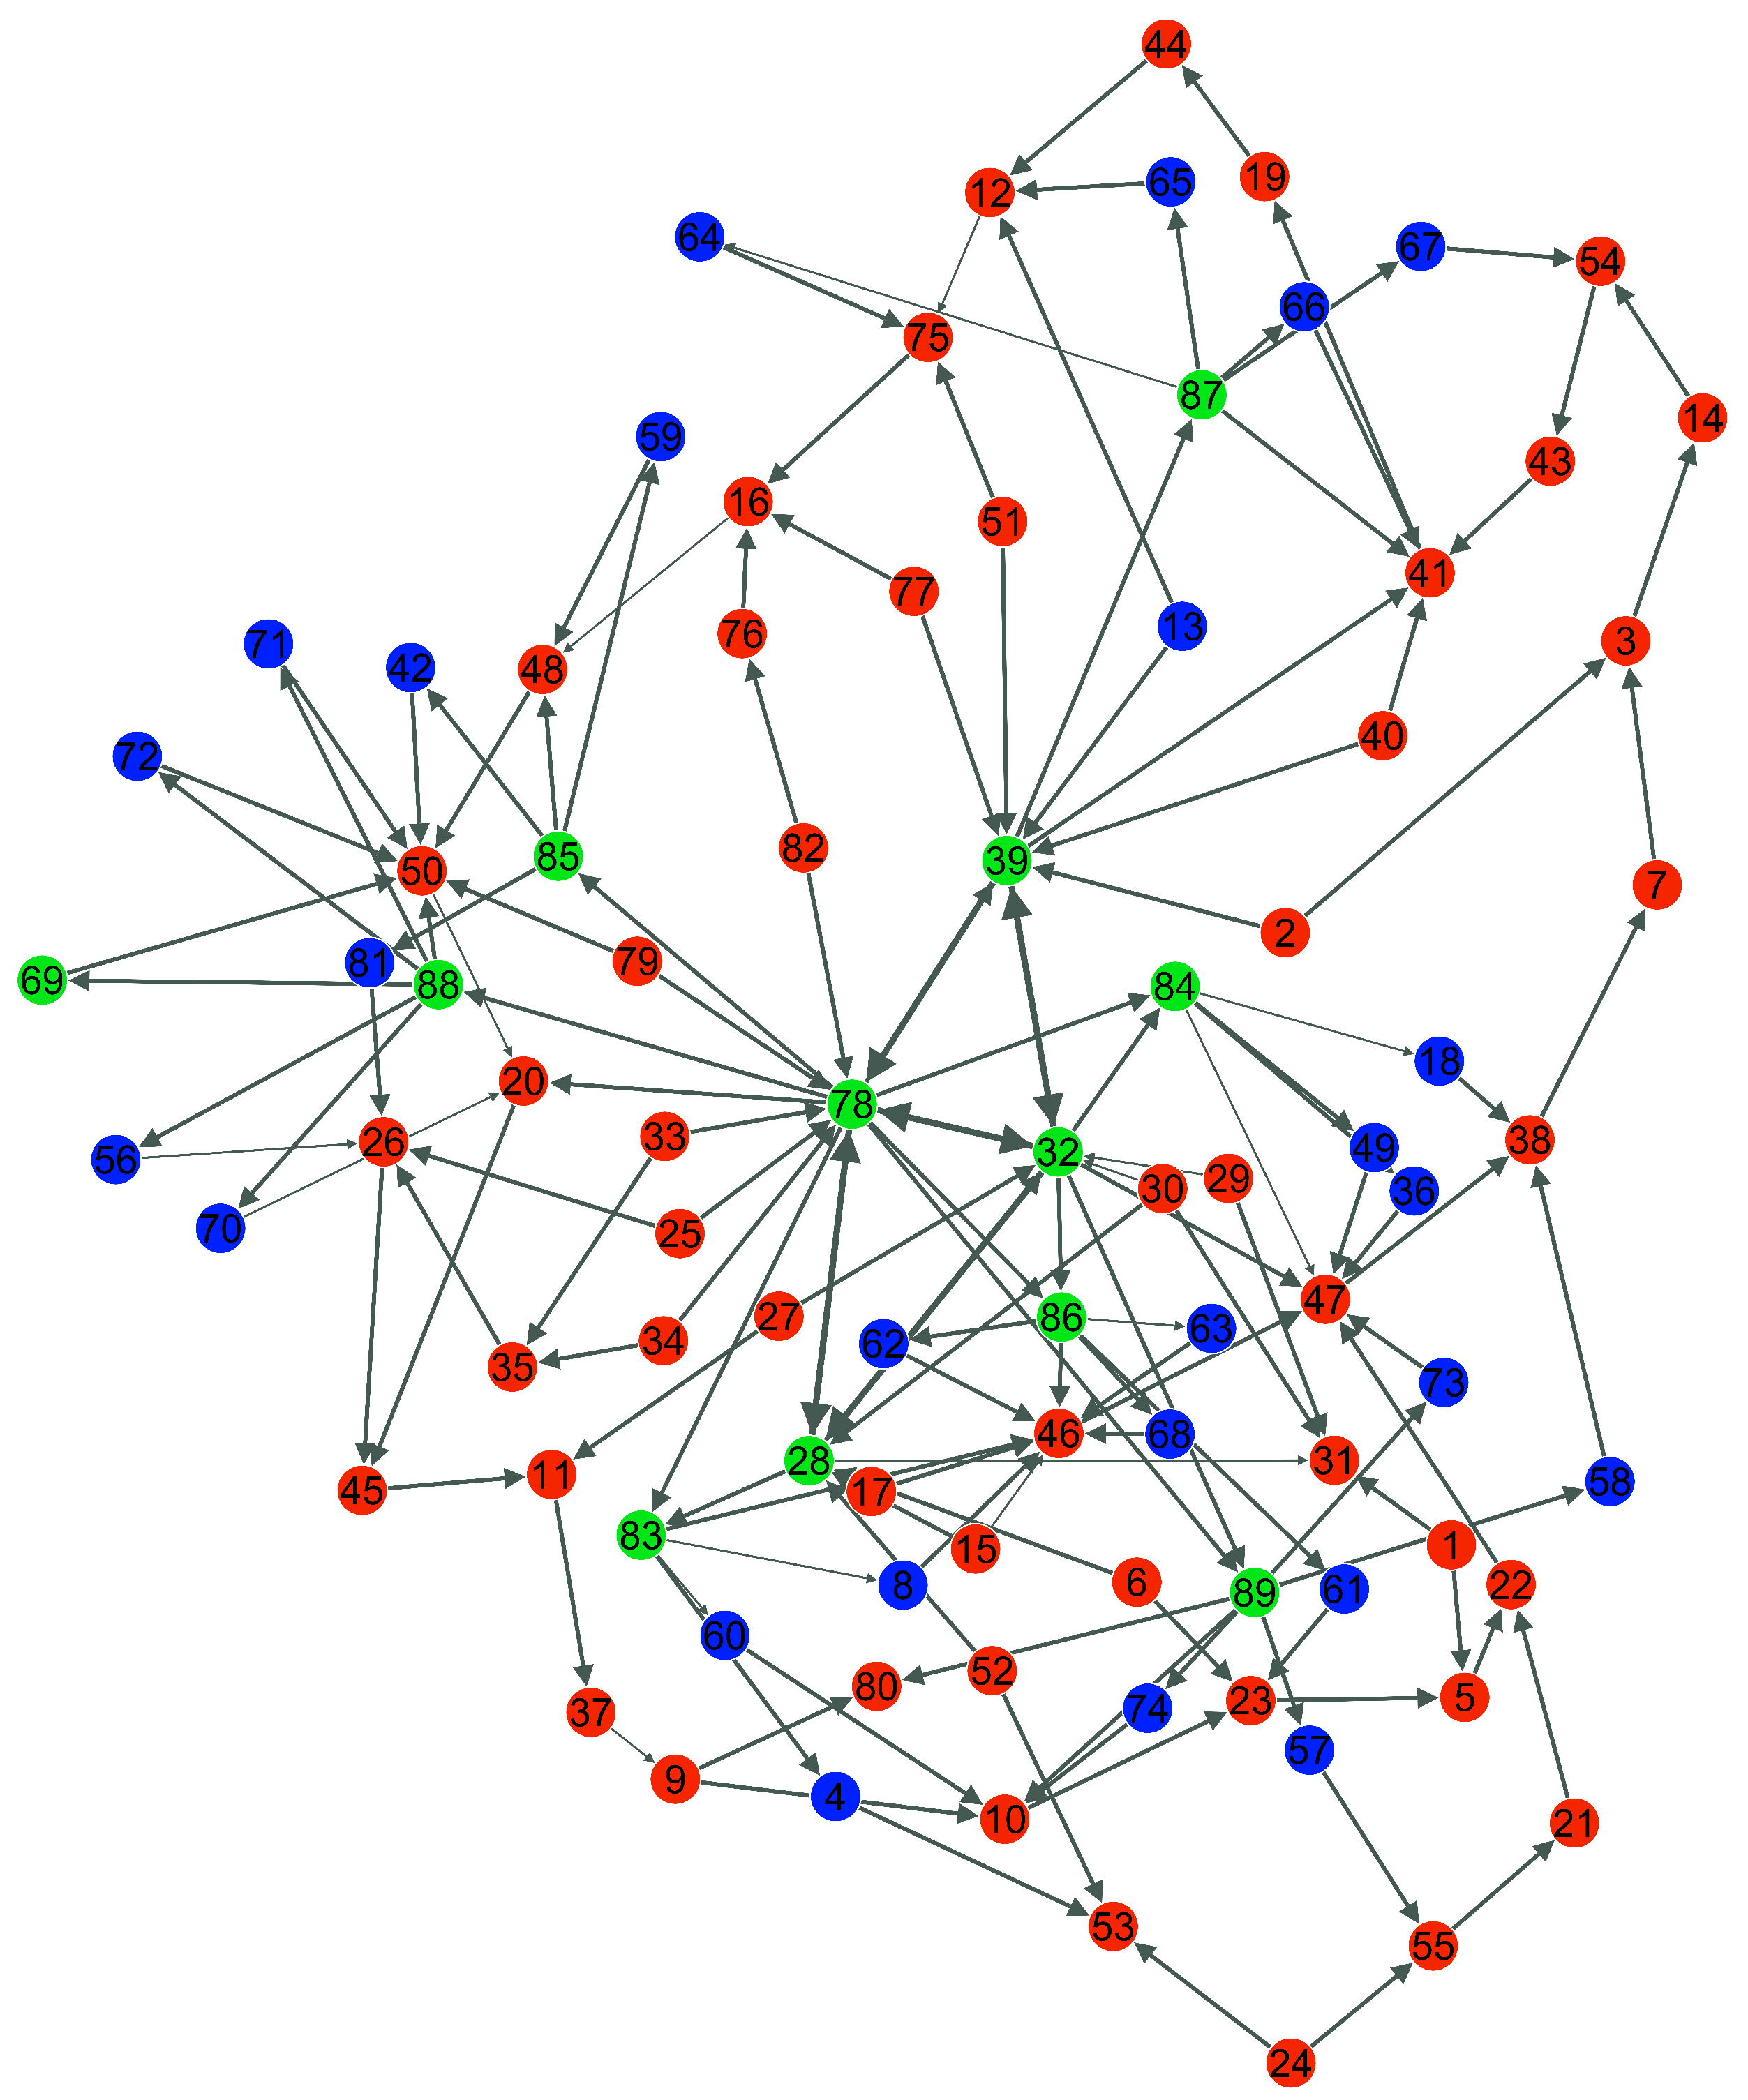
| |V| | |E| | |S| | |D| | |I| | <k> | <d> |
|---|---|---|---|---|---|---|
| 89 | 150 | 26 | 51 | 12 | 3.483 | 8.113 |
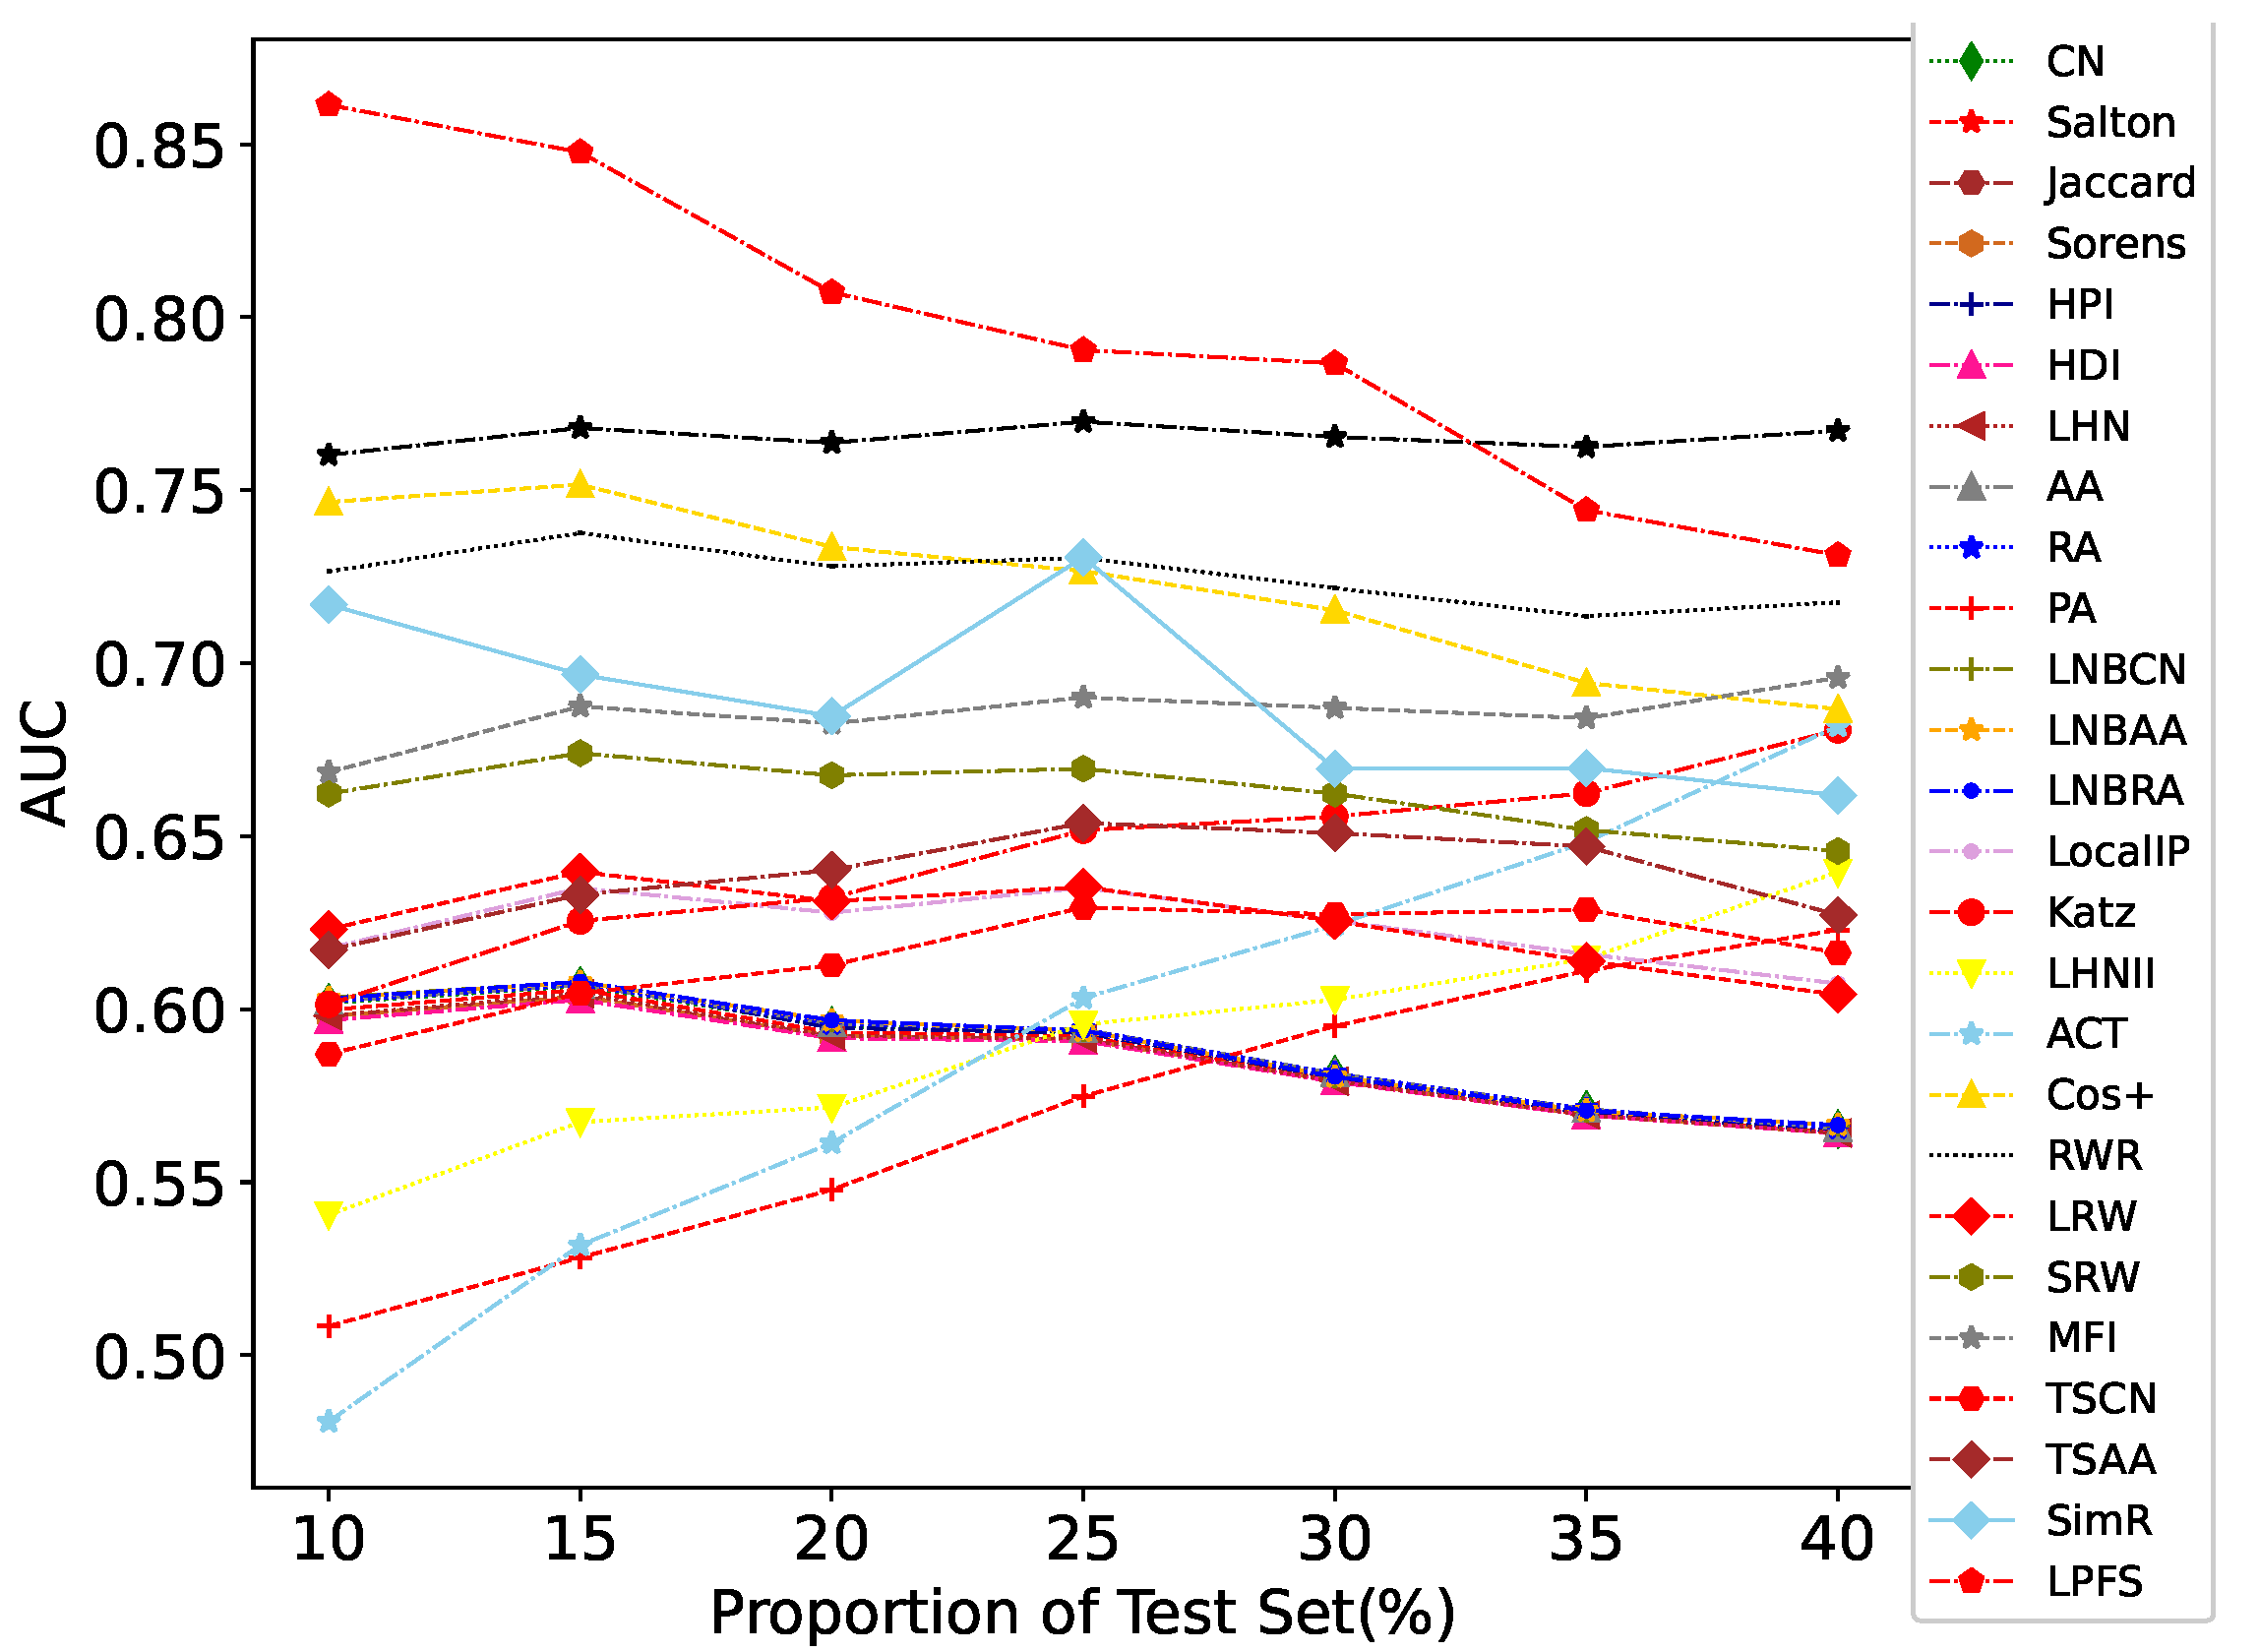
| Index | LR | CN | Salton | Jaccard | Sorens | HPI | HDI | LHN | AA |
| AUC | 0.7771 | 0.6129 | 0.6118 | 0.6093 | 0.6093 | 0.615 | 0.6079 | 0.6105 | 0.613 |
| Var | 0.0025 | 0.0038 | 0.0038 | 0.0036 | 0.0036 | 0.0039 | 0.0036 | 0.0037 | 0.0038 |
| Index | RA | PA | LNBCN | LNBAA | LNBRA | LocalP | Katz | LHNII | ACT |
| AUC | 0.613 | 0.5144 | 0.6091 | 0.6091 | 0.6091 | 0.6324 | 0.6235 | 0.5632 | 0.4942 |
| Var | 0.0038 | 0.0037 | 0.0039 | 0.0039 | 0.004 | 0.0046 | 0.0054 | 0.0049 | 0.0053 |
| Index | CosPlus | RWR | SimR | LRW5 | SRW | MFI | TSCN | TSAA | LPFS |
| AUC | 0.7686 | 0.7549 | 0.7355 | 0.7027 | 0.6995 | 0.6944 | 0.606 | 0.6375 | 0.86135 |
| Var | 0.0020 | 0.0030 | 0.0028 | 0.0036 | 0.0040 | 0.0033 | 0.0057 | 0.0054 | 0.00037 |
Disclaimer/Publisher’s Note: The statements, opinions and data contained in all publications are solely those of the individual author(s) and contributor(s) and not of MDPI and/or the editor(s). MDPI and/or the editor(s) disclaim responsibility for any injury to people or property resulting from any ideas, methods, instructions or products referred to in the content. |
© 2023 by the authors. Licensee MDPI, Basel, Switzerland. This article is an open access article distributed under the terms and conditions of the Creative Commons Attribution (CC BY) license (https://creativecommons.org/licenses/by/4.0/).
Share and Cite
Qiu, S.; Chen, F.; Wang, Y.; Zhao, J. Evolutionary Method of Heterogeneous Combat Network Based on Link Prediction. Entropy 2023, 25, 812. https://doi.org/10.3390/e25050812
Qiu S, Chen F, Wang Y, Zhao J. Evolutionary Method of Heterogeneous Combat Network Based on Link Prediction. Entropy. 2023; 25(5):812. https://doi.org/10.3390/e25050812
Chicago/Turabian StyleQiu, Shaoming, Fen Chen, Yahui Wang, and Jiancheng Zhao. 2023. "Evolutionary Method of Heterogeneous Combat Network Based on Link Prediction" Entropy 25, no. 5: 812. https://doi.org/10.3390/e25050812