
Failure Mode and Effects Analysis on the Air System of an Aero Turbofan Engine Using the Gaussian Model and Evidence Theory

Abstract
:1. Introduction
2. Preliminaries
2.1. Dempster–Shafer Evidence Theory
2.2. Risk Priority Number in FMEA
2.3. Gaussian Distribution
3. Improved FMEA Method Based on the Gaussian Model and Evidence Theory
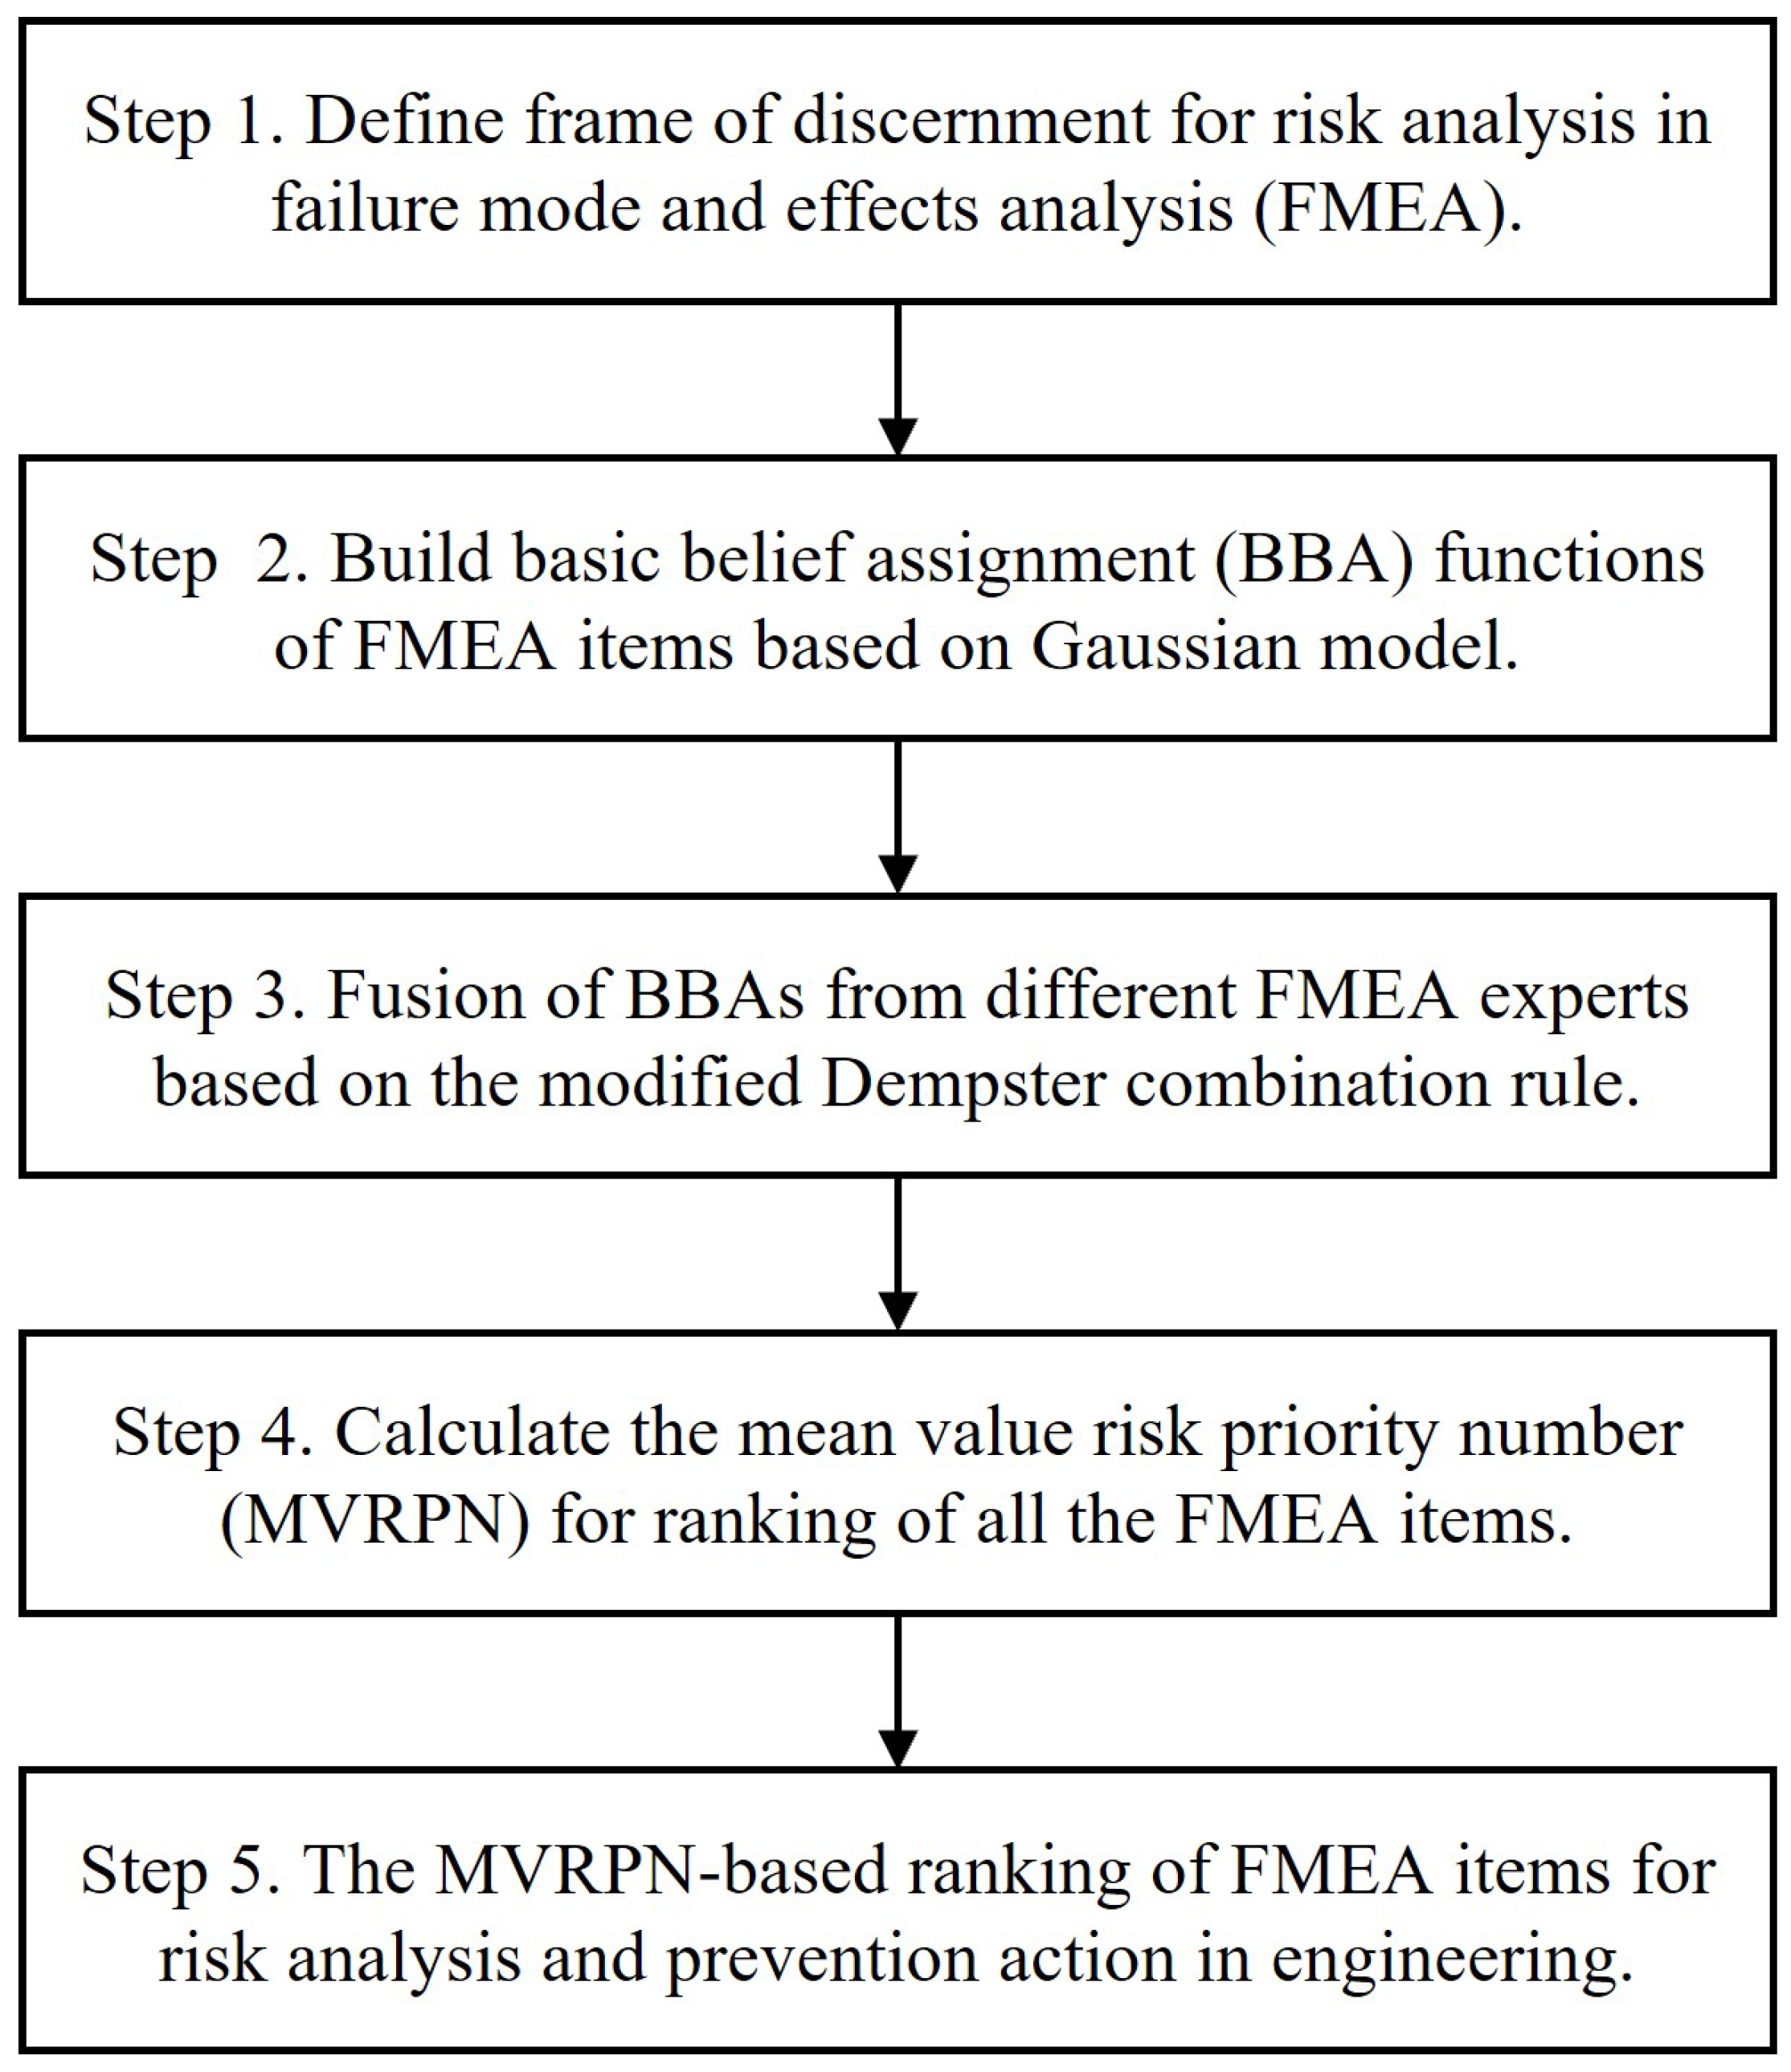
- Step 1
- The frame of discernment is defined for risk analysis in failure mode and effects analysis (FMEA).The frame of discernment is defined for uncertain information modelling with the basic belief assignment as the first step of applying D-S evidence theory. For FMEA, each risk factor includes 10 levels in the risk assessment and the risk levels are defined in the frame of discernment.Suppose that there are L experts (, …,) and N failure modes in FMEA. Then, the frame of discernment is as follows: , , . We simplified the frame of discernment as: , where and refer to the minimum and maximum values of the assessments made by L experts on the ith risk factors () of the Nth failure modes, respectively. With the simplified frame of discernment, we can avoid useless calculations.
- Step 2
- Basic belief assignment (BBA) functions of FMEA items are built based on the Gaussian model.It can be seen from the above that the risk level is usually divided into 10 levels ranging from 1 to 10.If an expert is greatly influenced by other experts (strong correlation), it means that they are less confident in their own evaluation and willing to follow other evaluations. The higher the degree of correlation, the higher the corresponding degree of generalization. Therefore, by generalizing the evaluation opinions, the opinions of experts cannot be completely opposed. Furthermore, the problem of highly conflicting evidence fusion can be solved.Combined with the characteristics of the Gaussian distribution, we can define three kinds of correlation situations, namely, weak, moderate and strong correlation. The corresponding values of the Gaussian distribution are shown in Table 2.
- Step 3
- Fusion of BBAs from different FMEA experts based on the modified Dempster combination rule.The belief degree of each FMEA expert is different in a risk assessment, so the weight of each expert’s assessment in data fusion should be modelled.is a weight factor representing the relative weight on the importance of the jth expert to the ith risk factor (. Based on the classical Dempster combination rule, we multiply the calculated result by to make the fusion result be more reasonable. The new BBA function is recorded as .where , , N refers to the number of FMEA items, and refers to the weight of the jth expert for the ith risk factor. Using these definitions and modifications on the classical combination rule, we obtain a modified Dempster combination rule for the fusion of BBAs from different FMEA experts:With Equations (9) and (10), the assessments of two experts can be fused. For all L FMEA experts (, …,), the fusion formula is as follows:In this paper, we default to using equal weights, that is: = 1.
- Step 4
- The mean value risk priority number (MVRPN) is calculated to rank all the FMEA items.After information fusion of FMEA expert assessments, we calculate the RPN. However, the evaluation of each risk factor is represented by a belief function, so we need the mean value of the RPN (MVRPN) to compare the overall risk of each failure mode.Assume that the RPN level corresponding to the ith failure mode is , , …, with respect to the belief degrees of different FMEA experts (, …, ) defined as:where , , and the is defined in Equation (9).Then,Therefore, the ultimate RPN according to Equation (4) can be obtained:
- Step 5
- The FMEA items are ranked based on the MVRPN for risk analysis and prevention action in engineering.In practical engineering, such as the air system of an aero turbofan engine, after ranking results of all the FMEA items, the limited resources should be used to take actions to prevent the risk of FMEA items with higher MVRPN values. In this way, the risk level can be decreased to an acceptable level and quality can be guaranteed.
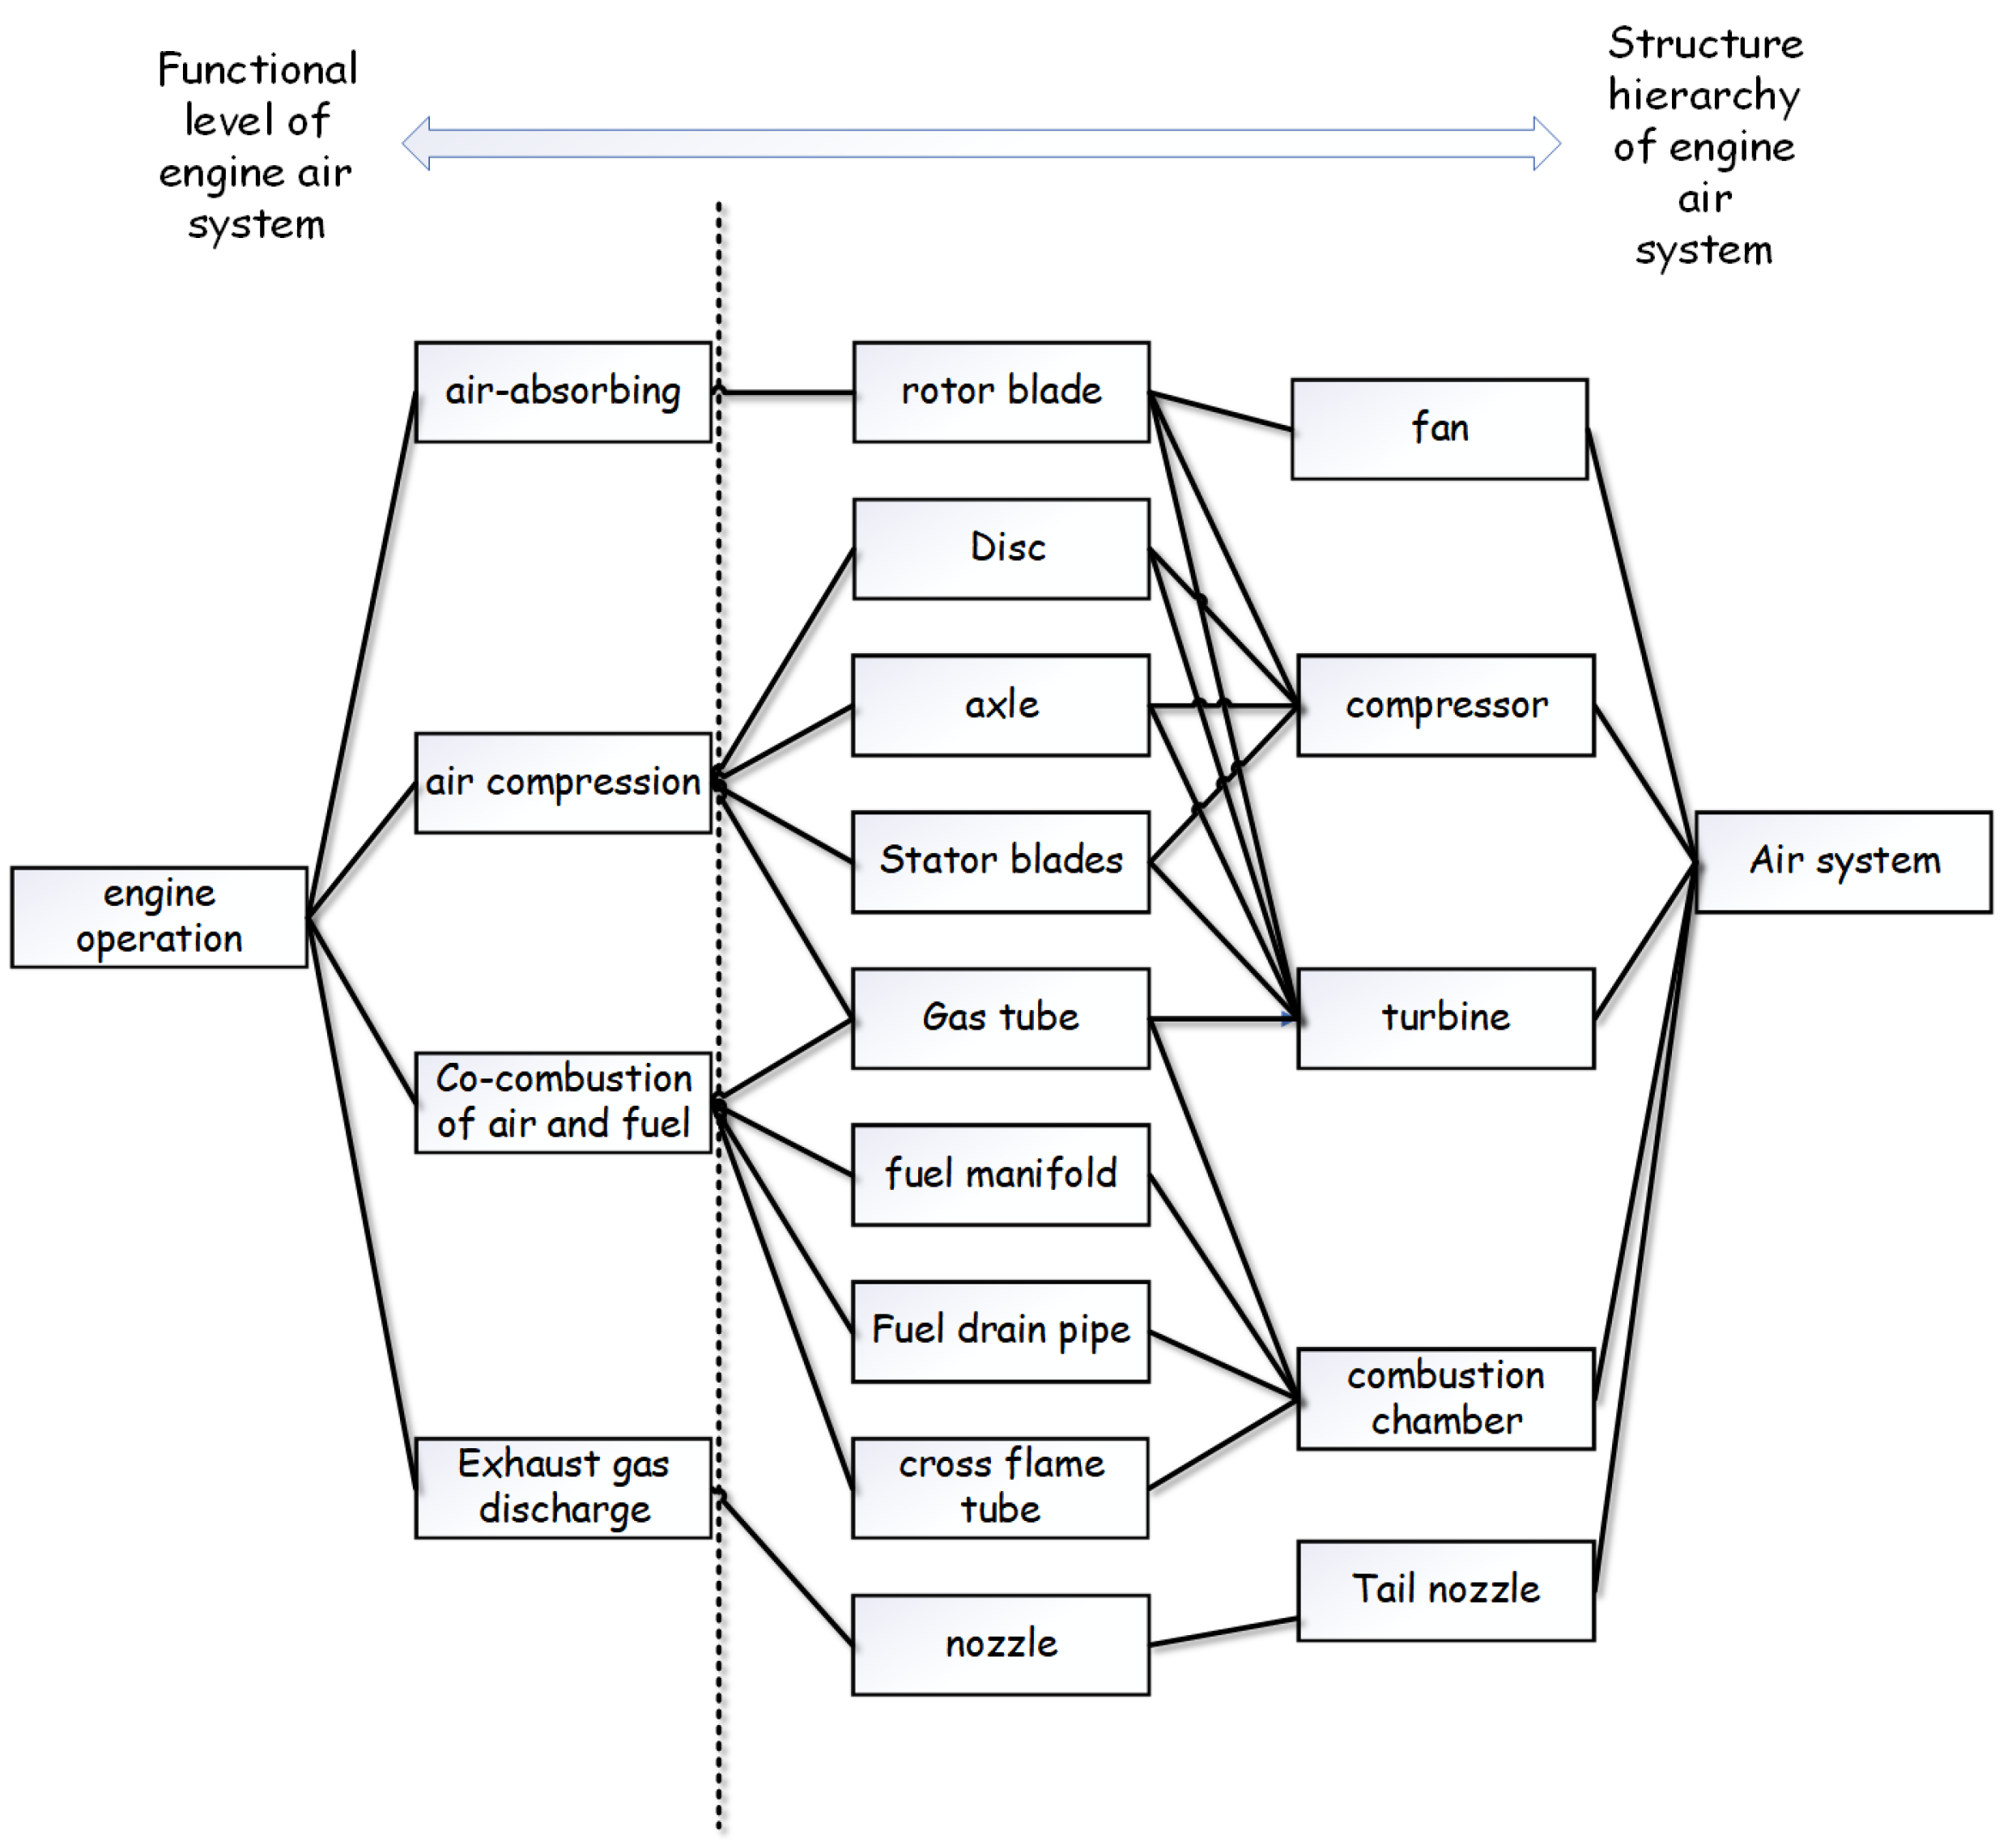
4. Application in the Air System of an Aero Turbofan Engine
4.1. Background of the Aero Turbofan Engine
4.2. Experiment
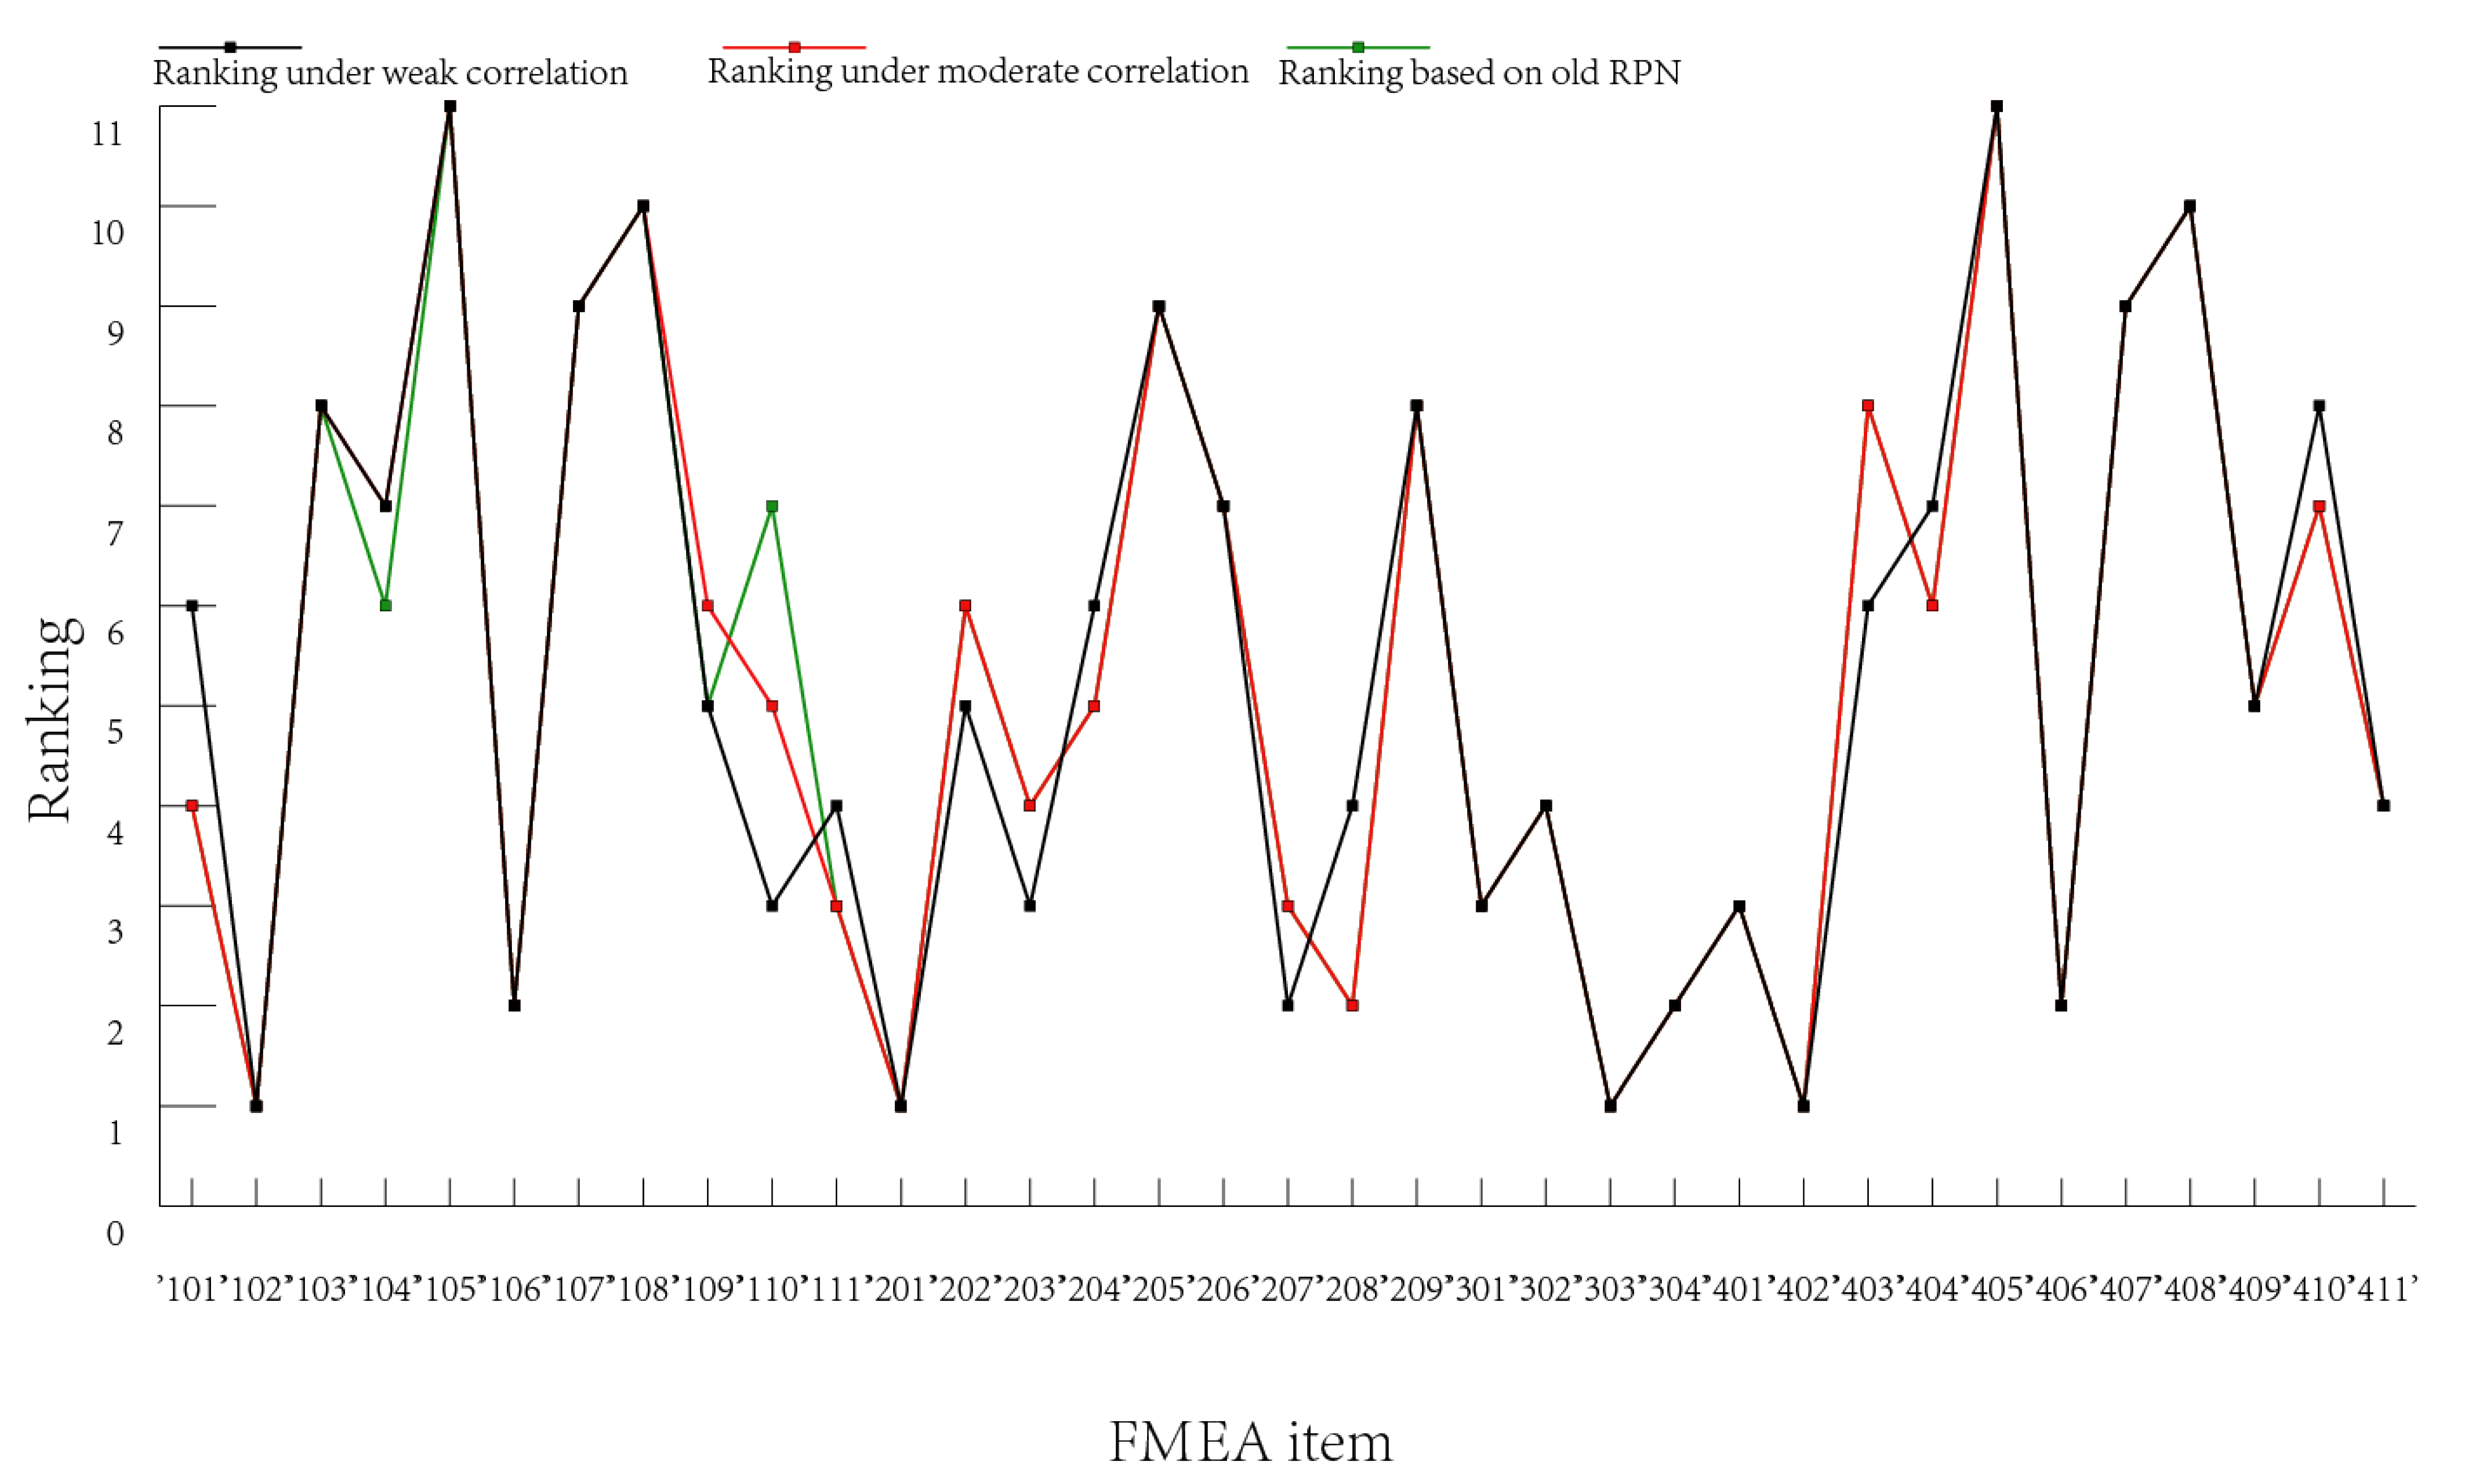
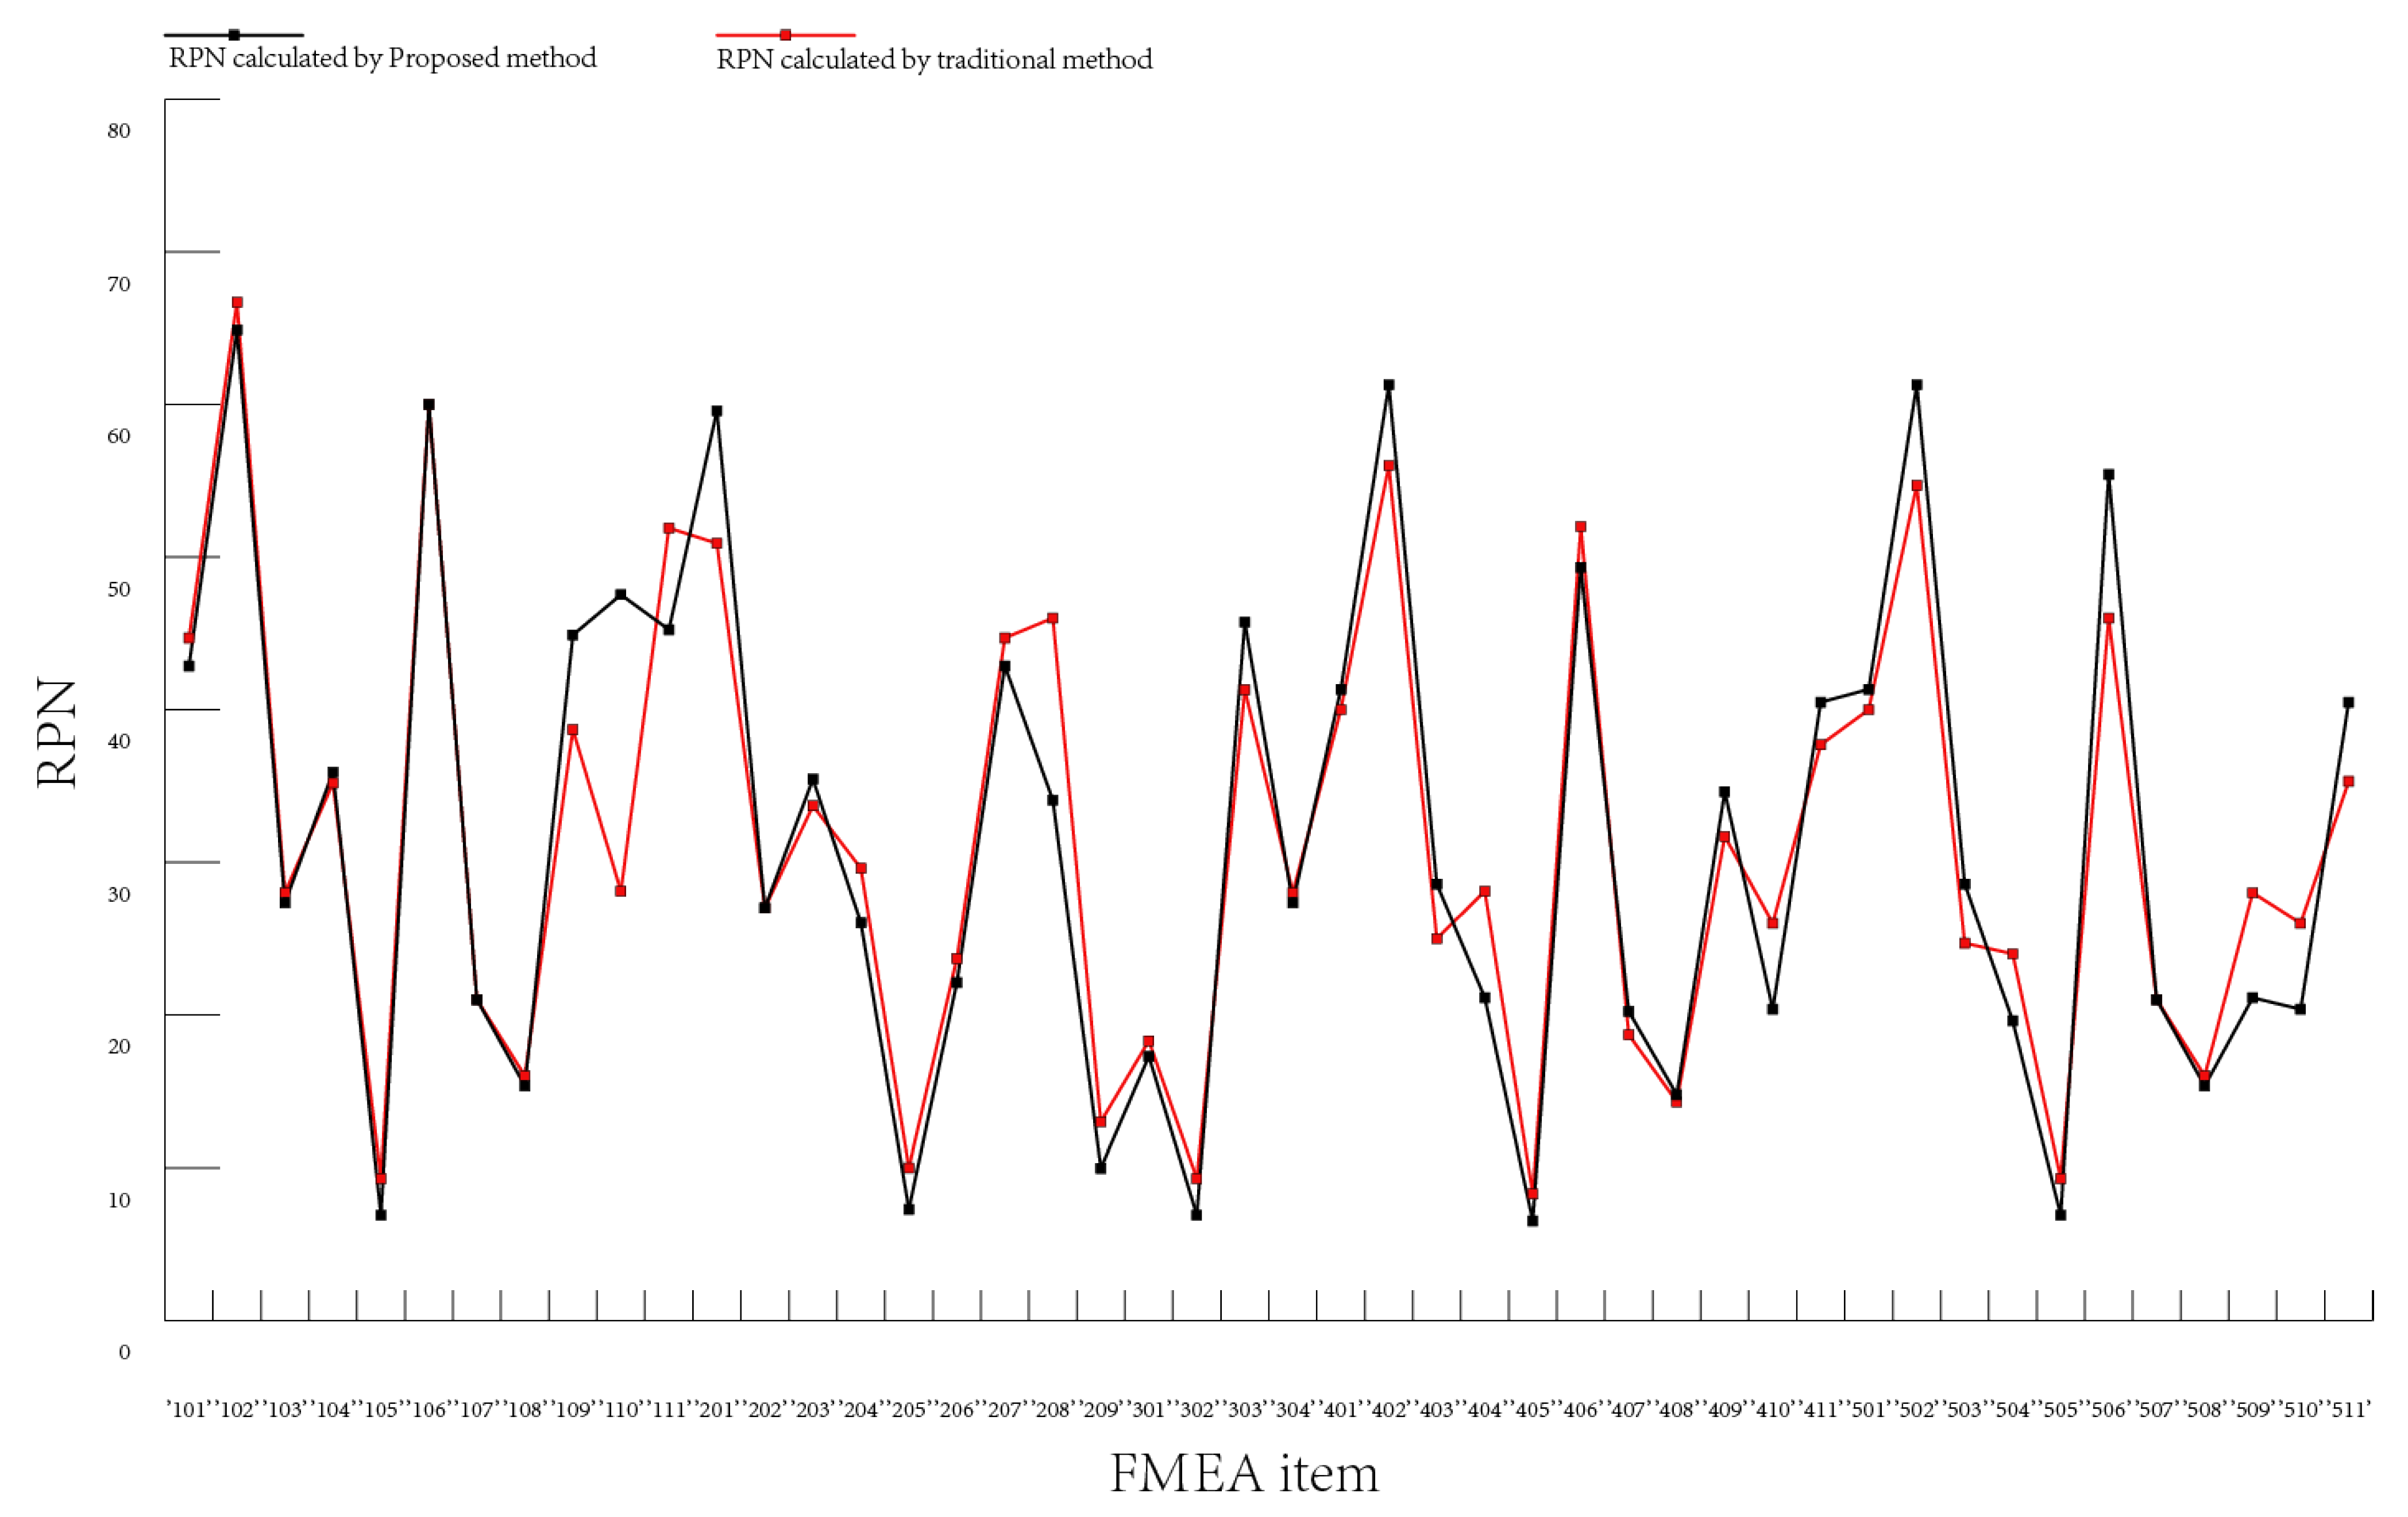
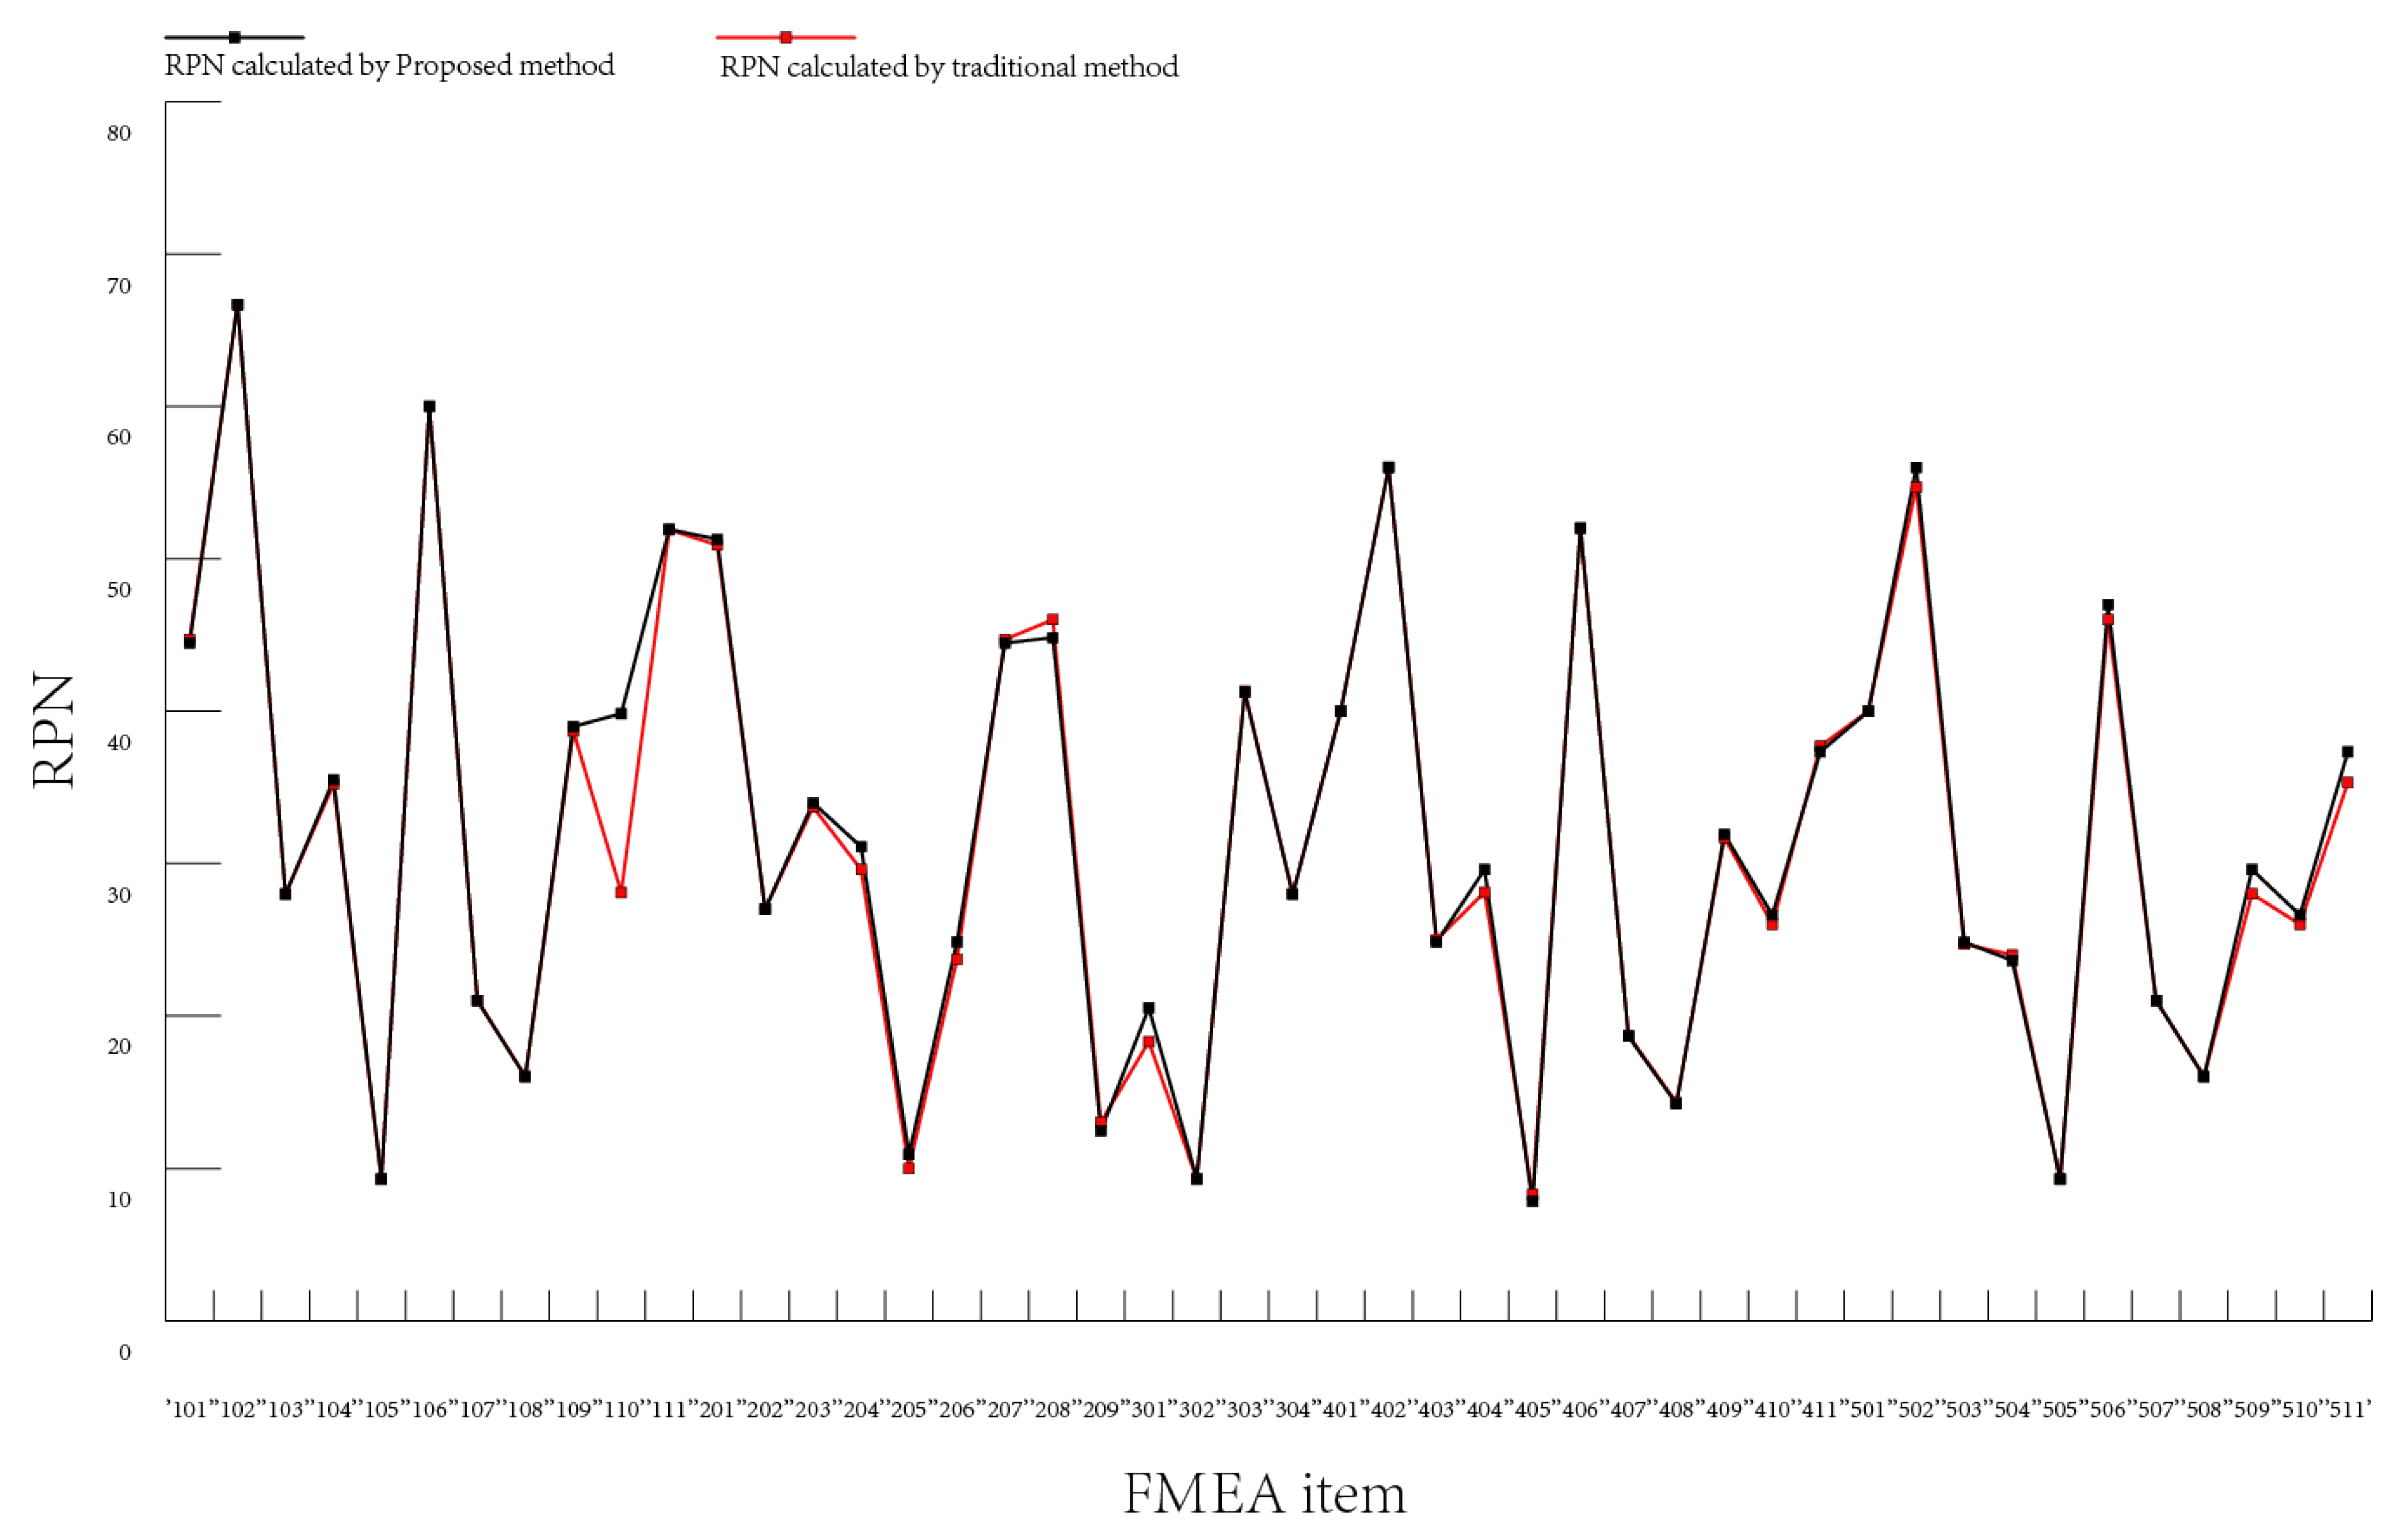
4.3. Result and Discussion
5. Conclusions
Supplementary Materials
Author Contributions
Funding
Institutional Review Board Statement
Data Availability Statement
Conflicts of Interest
References
- Korba, P.; Huňady, R.; Hovanec, M.; Racek, B.; Pavelka, P. Fatigue life analysis of an aircraft brake component to prevent damage and ensure operational safety. Eng. Fail. Anal. 2021, 129, 105653. [Google Scholar] [CrossRef]
- Korba, P.; Balli, O.; Caliskan, H.; Al-Rabeei, S.; Kale, U. Energy, exergy, economic, environmental, and sustainability assessments of the CFM56-3 series turbofan engine used in the aviation sector. Energy 2023, 269, 126765. [Google Scholar] [CrossRef]
- Garcia-Bracamonte, J.E.; Ramirez-Cortes, J.M.; de Jesus Rangel-Magdaleno, J.; Gomez-Gil, P.; Peregrina-Barreto, H.; Alarcon-Aquino, V. An approach on MCSA-based fault detection using independent component analysis and neural networks. IEEE Trans. Instrum. Meas. 2019, 68, 1353–1361. [Google Scholar] [CrossRef]
- Aguayo-Tapia, S.; Avalos-Almazan, G.; Rangel-Magdaleno, J.d.J.; Paternina, M.R. Broken Bar Fault Detection Using Taylor–Fourier Filters and Statistical Analysis. Entropy 2023, 25, 44. [Google Scholar] [CrossRef]
- Li, H.; Diaz, H.; Soares, C.G. A developed failure mode and effect analysis for floating offshore wind turbine support structures. Renew. Energy 2021, 164, 133–145. [Google Scholar] [CrossRef]
- Akram, M.; Luqman, A.; Alcantud, J.C.R. Risk evaluation in failure modes and effects analysis: Hybrid TOPSIS and ELECTRE I solutions with Pythagorean fuzzy information. Neural Comput. Appl. 2021, 33, 5675–5703. [Google Scholar] [CrossRef]
- Zhang, H.; Dong, Y.; Xiao, J.; Chiclana, F.; Herrera-Viedma, E. Consensus and opinion evolution-based failure mode and effect analysis approach for reliability management in social network and uncertainty contexts. Reliab. Eng. Syst. Saf. 2021, 208, 107425. [Google Scholar] [CrossRef]
- Wu, J.Y.; Hsiao, H.I. Food quality and safety risk diagnosis in the food cold chain through failure mode and effect analysis. Food Control 2021, 120, 107501. [Google Scholar] [CrossRef]
- Yanjun, Z.; Youchao, S.; Fengchan, W.; Haijun, Z. Method of aircraft fuel tank system ignition source fail-safe feature analysis. Procedia Eng. 2011, 17, 638–644. [Google Scholar] [CrossRef]
- Ahn, J.; Noh, Y.; Park, S.H.; Choi, B.I.; Chang, D. Fuzzy-based failure mode and effect analysis (FMEA) of a hybrid molten carbonate fuel cell (MCFC) and gas turbine system for marine propulsion. J. Power Sources 2017, 364, 226–233. [Google Scholar] [CrossRef]
- Liu, S.; Guo, X.; Zhang, L. An improved assessment method for FMEA for a shipboard integrated electric propulsion system using fuzzy logic and DEMATEL theory. Energies 2019, 12, 3162. [Google Scholar] [CrossRef]
- Daneshvar, S.; Yazdi, M.; Adesina, K.A. Fuzzy smart failure modes and effects analysis to improve safety performance of system: Case study of an aircraft landing system. Qual. Reliab. Eng. Int. 2020, 36, 890–909. [Google Scholar] [CrossRef]
- Filz, M.A.; Langner, J.E.B.; Herrmann, C.; Thiede, S. Data-driven failure mode and effect analysis (FMEA) to enhance maintenance planning. Comput. Ind. 2021, 129, 103451. [Google Scholar] [CrossRef]
- Qin, J.; Xi, Y.; Pedrycz, W. Failure mode and effects analysis (FMEA) for risk assessment based on interval type-2 fuzzy evidential reasoning method. Appl. Soft Comput. 2020, 89, 106134. [Google Scholar] [CrossRef]
- Nicolin, I.; Nicolin, B.A. Failure Mode and Effect Analysis for a military nose landing gear project. INCAS Bull. 2021, 13, 205–212. [Google Scholar] [CrossRef]
- Dwianda, Y. Failure mode and effect analysis (FMEA) of pneumatic system of cnc milling machine. J. Ocean. Mech. Aerosp.-Sci. Eng. 2021, 65, 14–18. [Google Scholar] [CrossRef]
- Fidan, M.A.; Gürgül, U.; Akın, Z.E. FMEA-FMECA the application of analysis on electronic circuit. In Proceedings of the 2020 7th International Conference on Electrical and Electronics Engineering (ICEEE), Antalya, Turkey, 14–16 April 2020; pp. 17–22. [Google Scholar]
- Gul, M.; Ak, M.F. A modified failure modes and effects analysis using interval-valued spherical fuzzy extension of TOPSIS method: Case study in a marble manufacturing facility. Soft Comput. 2021, 25, 6157–6178. [Google Scholar] [CrossRef]
- Ilbahar, E.; Kahraman, C.; Cebi, S. Risk assessment of renewable energy investments: A modified failure mode and effect analysis based on prospect theory and intuitionistic fuzzy AHP. Energy 2022, 239, 121907. [Google Scholar] [CrossRef]
- Yazdi, M.; Daneshvar, S.; Setareh, H. An extension to fuzzy developed failure mode and effects analysis (FDFMEA) application for aircraft landing system. Saf. Sci. 2017, 98, 113–123. [Google Scholar] [CrossRef]
- Fan, J.; Wang, S.; Wu, M. An integrated FMEA approach using Best-Worst and MARCOS methods based on D numbers for prioritization of failures. J. Intell. Fuzzy Syst. 2021, 41, 2833–2846. [Google Scholar] [CrossRef]
- Huang, J.; Xu, D.H.; Liu, H.C.; Song, M.S. A new model for failure mode and effect analysis integrating linguistic Z-numbers and projection method. IEEE Trans. Fuzzy Syst. 2019, 29, 530–538. [Google Scholar] [CrossRef]
- Bhattacharjee, P.; Dey, V.; Mandal, U. Risk assessment by failure mode and effects analysis (FMEA) using an interval number based logistic regression model. Saf. Sci. 2020, 132, 104967. [Google Scholar] [CrossRef]
- Li, H.; Díaz, H.; Soares, C.G. A failure analysis of floating offshore wind turbines using AHP-FMEA methodology. Ocean Eng. 2021, 234, 109261. [Google Scholar] [CrossRef]
- Gholizadeh, H.; Javadian, N.; Fazlollahtabar, H. An integrated fuzzy-genetic failure mode and effect analysis for aircraft wing reliability. Soft Comput. 2020, 24, 13401–13412. [Google Scholar] [CrossRef]
- Ouyang, L.; Zheng, W.; Zhu, Y.; Zhou, X. An interval probability-based FMEA model for risk assessment: A real-world case. Qual. Reliab. Eng. Int. 2020, 36, 125–143. [Google Scholar] [CrossRef]
- Deng, Y. Generalized evidence theory. Appl. Intell. 2015, 43, 530–543. [Google Scholar] [CrossRef]
- Xu, X.; Weng, X.; Xu, D.; Xu, H.; Hu, Y.; Li, J. Evidence updating with static and dynamical performance analyses for industrial alarm system design. ISA Trans. 2020, 99, 110–122. [Google Scholar] [CrossRef]
- Yang, Y.; Han, D.; Dezert, J. Basic belief assignment approximations using degree of non-redundancy for focal element. Chin. J. Aeronaut. 2019, 32, 2503–2515. [Google Scholar] [CrossRef]
- Jiroušek, R.; Shenoy, P.P. On properties of a new decomposable entropy of Dempster-Shafer belief functions. Int. J. Approx. Reason. 2020, 119, 260–279. [Google Scholar] [CrossRef]
- Deng, Y. Uncertainty measure in evidence theory. Sci. China Inf. Sci. 2020, 63, 1–19. [Google Scholar] [CrossRef]
- Liu, Z.; Zhang, X.; Niu, J.; Dezert, J. Combination of Classifiers With Different Frames of Discernment Based on Belief Functions. IEEE Trans. Fuzzy Syst. 2021, 29, 1764–1774. [Google Scholar] [CrossRef]
- Xu, X.; Zhang, D.; Bai, Y.; Chang, L.; Li, J. Evidence reasoning rule-based classifier with uncertainty quantification. Inf. Sci. 2020, 516, 192–204. [Google Scholar] [CrossRef]
- Liu, Z.G.; Huang, L.Q.; Zhou, K.; Denoeux, T. Combination of Transferable Classification With Multisource Domain Adaptation Based on Evidential Reasoning. IEEE Trans. Neural Netw. Learn. Syst. 2021, 32, 2015–2029. [Google Scholar] [CrossRef]
- Zhou, K.; Martin, A.; Pan, Q.; Liu, Z. SELP: Semi–supervised evidential label propagation algorithm for graph data clustering. Int. J. Approx. Reason. 2018, 92, 139–154. [Google Scholar] [CrossRef]
- Meng, J.; Fu, D.; Tang, Y. Belief-peaks clustering based on fuzzy label propagation. Appl. Intell. 2020, 50, 1259–1271. [Google Scholar] [CrossRef]
- Jiao, L.; Wang, F.; ga Liu, Z.; Pan, Q. TECM: Transfer learning-based evidential c-means clustering. Knowl.-Based Syst. 2022, 257, 109937. [Google Scholar] [CrossRef]
- Fu, C.; Hou, B.; Chang, W.; Feng, N.; Yang, S. Comparison of evidential reasoning algorithm with linear combination in decision making. Int. J. Fuzzy Syst. 2020, 22, 686–711. [Google Scholar] [CrossRef]
- Fu, C.; Chang, W.; Xue, M.; Yang, S. Multiple criteria group decision making with belief distributions and distributed preference relations. Eur. J. Oper. Res. 2019, 273, 623–633. [Google Scholar] [CrossRef]
- Xiong, L.; Su, X.; Qian, H. Conflicting evidence combination from the perspective of networks. Inf. Sci. 2021, 580, 408–418. [Google Scholar] [CrossRef]
- Song, Y.; Zhu, J.; Lei, L.; Wang, X. Self-adaptive combination method for temporal evidence based on negotiation strategy. Sci. China Inf. Sci. 2020, 63, 1–13. [Google Scholar] [CrossRef]
- Tang, Y.; Chen, Y.; Zhou, D. Measuring Uncertainty in the Negation Evidence for Multi-Source Information Fusion. Entropy 2022, 24, 1596. [Google Scholar] [CrossRef]
- Fei, L.; Lu, J.; Feng, Y. An extended best-worst multi-criteria decision-making method by belief functions and its applications in hospital service evaluation. Comput. Ind. Eng. 2020, 142, 106355. [Google Scholar] [CrossRef]
- Núnez, R.C.; Dabarera, R.; Scheutz, M.; Briggs, G.; Bueno, O.; Premaratne, K.; Murthi, M.N. DS-based uncertain implication rules for inference and fusion applications. In Proceedings of the 16th International Conference on Information FUSION, Istanbul, Turkey, 9–12 July 2013; pp. 1934–1941. [Google Scholar]
- Liu, D.; Wang, S.; Tomovic, M.M.; Zhang, C. An evidence theory based model fusion method for degradation modeling and statistical analysis. Inf. Sci. 2020, 532, 33–60. [Google Scholar] [CrossRef]
- Wang, C.; Matthies, H.G. Evidence theory-based reliability optimization design using polynomial chaos expansion. Comput. Methods Appl. Mech. Eng. 2018, 341, 640–657. [Google Scholar] [CrossRef]
- Hui, K.H.; Lim, M.H.; Leong, M.S.; Al-Obaidi, S.M. Dempster-Shafer evidence theory for multi-bearing faults diagnosis. Eng. Appl. Artif. Intell. 2017, 57, 160–170. [Google Scholar] [CrossRef]
- Wang, C.; Matthies, H.G.; Xu, M.; Li, Y. Evidence-theory-based model validation method for heat transfer system with epistemic uncertainty. Int. J. Therm. Sci. 2018, 132, 618–627. [Google Scholar] [CrossRef]
- Zhang, Y.; Liu, Y.; Zhang, Z.; Zhao, N. Collaborative Fusion for Distributed Target Classification Using Evidence Theory in IOT Environment. IEEE Access 2018, 6, 62314–62323. [Google Scholar] [CrossRef]
- Lin, Y.; Li, Y.; Yin, X.; Dou, Z. Multisensor fault diagnosis modeling based on the evidence theory. IEEE Trans. Reliab. 2018, 67, 513–521. [Google Scholar] [CrossRef]
- Yu, X.; Zhang, F.; Zhou, L.; Liu, Q. Novel data fusion algorithm based on event-driven and Dempster–Shafer evidence theory. Wirel. Pers. Commun. 2018, 100, 1377–1391. [Google Scholar] [CrossRef]
- Li, L.; Jiang, P.; Xu, H.; Lin, G.; Guo, D.; Wu, H. Water quality prediction based on recurrent neural network and improved evidence theory: A case study of Qiantang River, China. Environ. Sci. Pollut. Res. 2019, 26, 19879–19896. [Google Scholar] [CrossRef]
- Zhang, Z.; Ruan, X.; Duan, M.; Jiang, C. An efficient epistemic uncertainty analysis method using evidence theory. Comput. Methods Appl. Mech. Eng. 2018, 339, 443–466. [Google Scholar] [CrossRef]
- Wen, K.; Song, Y.; Wu, C.; Li, T. A novel measure of uncertainty in the Dempster-Shafer theory. IEEE Access 2020, 8, 51550–51559. [Google Scholar] [CrossRef]
- Mao, C.; Zhang, D.; Pu, L.; Wang, X.; Liu, Q.; Yang, R. The Application of Uncertainty Algorithm in Electric Power System. In Proceedings of the 2018 International Conference on Power System Technology (POWERCON), Guangzhou, China, 6–8 November 2018; pp. 4596–4602. [Google Scholar]
- Certa, A.; Hopps, F.; Inghilleri, R.; La Fata, C.M. A Dempster-Shafer Theory-based approach to the Failure Mode, Effects and Criticality Analysis (FMECA) under epistemic uncertainty: Application to the propulsion system of a fishing vessel. Reliab. Eng. Syst. Saf. 2017, 159, 69–79. [Google Scholar] [CrossRef]
- Wang, H.; Deng, X.; Zhang, Z.; Jiang, W. A new failure mode and effects analysis method based on Dempster–Shafer theory by integrating evidential network. IEEE Access 2019, 7, 79579–79591. [Google Scholar] [CrossRef]
- Sezer, S.I.; Ceylan, B.O.; Akyuz, E.; Arslan, O. DS evidence based FMECA approach to assess potential risks in ballast water system (BWS) on-board tanker ship. J. Ocean. Eng. Sci. 2022. [Google Scholar] [CrossRef]
- Tang, Y.; Tan, S.; Zhou, D. An Improved Failure Mode and Effects Analysis Method Using Belief Jensen–Shannon Divergence and Entropy Measure in the Evidence Theory. Arab. J. Sci. Eng. 2023, 48, 7163–7176. [Google Scholar] [CrossRef]
- Dempster, A.P. Upper and Lower Probabilities Induced by a Multi-valued Mapping. Ann. Math. Stat. 1967, 38, 325–339. [Google Scholar] [CrossRef]
- Shafer, G. A Mathematical Theory of Evidence; Princeton University Press: Princeton, NJ, USA, 1976. [Google Scholar]
- Liu, H.C.; Liu, L.; Liu, N. Risk evaluation approaches in failure mode and effects analysis: A literature review. Expert Syst. Appl. 2013, 40, 828–838. [Google Scholar] [CrossRef]
- Liu, H.C.; Chen, X.Q.; Duan, C.Y.; Wang, Y.M. Failure mode and effect analysis using multi-criteria decision making methods: A systematic literature review. Comput. Ind. Eng. 2019, 135, 881–897. [Google Scholar] [CrossRef]
- Carmignani, G. An integrated structural framework to cost-based FMECA: The priority-cost FMECA. Reliab. Eng. Syst. Saf. 2009, 94, 861–871. [Google Scholar] [CrossRef]
- Jaynes, E.T. Probability Theory: The Logic of Science; Cambridge University Press: Cambridge, UK, 2003. [Google Scholar]
- Wu, X.H.; Wen, D.; Li, R.G.; Chen, Z.Z.; Huang, H.Z.; Lv, Z. A model to predict the residual life of aero-engine based upon Support Vector Machine. In Proceedings of the 2013 International Conference on Quality, Reliability, Risk, Maintenance, and Safety Engineering (QR2MSE), Chengdu, China, 15–18 July 2013; pp. 1880–1882. [Google Scholar]
- Wen, D.; Wu, X.H.; Ling, D.; Chen, Z.Z.; Wang, H. Application of dempster-shafer evidence theory in fault diagnosis of aero-engine gas path. In Proceedings of the 2013 International Conference on Quality, Reliability, Risk, Maintenance, and Safety Engineering (QR2MSE), Chengdu, China, 15–18 July 2013; pp. 1871–1873. [Google Scholar]
- Mangeli, M.; Shahraki, A.; Saljooghi, F.H. Improvement of risk assessment in the FMEA using nonlinear model, revised fuzzy TOPSIS, and support vector machine. Int. J. Ind. Ergon. 2019, 69, 209–216. [Google Scholar] [CrossRef]


| Frequent the Occurrence | Risk Level |
|---|---|
| Exceedingly high | 10 |
| Definitely high | 9 |
| Very high | 8 |
| High | 7 |
| Moderate high | 6 |
| Moderate low | 5 |
| Low | 4 |
| Very low | 3 |
| Definitely low | 2 |
| Exceeding ly low | 1 |
| Related Situation | Standard Deviation | Variance | Generalized Scaling |
|---|---|---|---|
| Strong Correlation | = 1.2 | = 1.44 | 7 |
| Moderate Correlation | = 1 | = 1 | 5 |
| Weak Correlation | = 0.5 | = 0.25 | 3 |
| Component | Failure Modes | Component | Failure Modes |
|---|---|---|---|
| Rotor blade | deformation, flexural, corrosion, rustiness, Scaling, creep, scuff, crack, fracture, wear, slide rail block falling | Turbine nozzle | deformation, flexural, corrosion, rustiness, Scaling, creep, scuff, crack, fracture, wear, slide rail block falling |
| Disc | crack, fracture, burst, surge, Stall, Flutter, deformation, buckling, over-speed | Diffuser | blow-by, crush, Indentation |
| Axle | abnormal sound, wear, bending, fracture | Fuel nozzles | Carbon Deposition, corrosion, Ablation, blockage |
| Stator blades | deformation, flexural, corrosion, rustiness, Scaling, creep, scuff, crack fracture, wear, slide rail block falling | Flame tube | Ablation, crack, deformation burn crack, burned-through, over-temperature, smoking, falling block |
| Nozzle | crack, blockage, exhaust temperature overrun |
| Key Comp. | Failure Mode | O | S | D | New RPN | Old RPN | RPN Difference | |
|---|---|---|---|---|---|---|---|---|
| ID | Description | Fused Value | Fused Value | Fused Value | The Weights Are the Same | |||
| Rotor blade | 101 | deformation | 3.111 | 6.889 | 2.000 | 42.863 | 44.7 | −1.837 |
| 102 | crack | 2.000 | 8.111 | 4.000 | 64.888 | 66.7 | −1.812 | |
| 103 | fracture | 1.000 | 9.111 | 3.000 | 27.333 | 28.0 | −0.667 | |
| 104 | corrosion | 1.889 | 6.111 | 3.111 | 35.912 | 35.2 | 0.712 | |
| 105 | wear | 1.111 | 3.111 | 2.000 | 6.913 | 9.3 | −2.387 | |
| 106 | flexural | 2.000 | 6.000 | 5.000 | 60.000 | 60.0 | 0.000 | |
| 107 | slide block fall | 1.000 | 7.000 | 3.000 | 21.000 | 21.0 | 0.000 | |
| 108 | scuff | 3.000 | 5.111 | 1.000 | 15.333 | 16.0 | −0.667 | |
| 109 | rustiness | 1.889 | 6.111 | 3.889 | 44.893 | 38.7 | 6.193 | |
| 110 | scaling | 2.000 | 6.111 | 3.889 | 47.531 | 28.1 | 19.431 | |
| 111 | creep | 3.111 | 6.889 | 2.111 | 45.242 | 51.9 | −6.658 | |
| Disc | 201 | crack | 1.889 | 8.111 | 3.889 | 59.586 | 50.9 | 8.686 |
| 202 | fracture | 1.000 | 9.000 | 3.000 | 27.000 | 27.0 | 0.000 | |
| 203 | burst | 1.889 | 8.889 | 2.111 | 35.446 | 33.7 | 1.746 | |
| 204 | surge | 2.889 | 8.111 | 1.111 | 26.034 | 29.6 | −3.566 | |
| 205 | Stall | 3.111 | 2.111 | 1.111 | 7.296 | 10.0 | −2.704 | |
| 206 | flutter | 2.889 | 6.889 | 1.111 | 22.111 | 23.7 | −1.589 | |
| 207 | deformation | 3.111 | 6.889 | 2.000 | 42.863 | 44.7 | −1.837 | |
| 208 | buckling | 1.111 | 6.000 | 5.111 | 34.070 | 46.0 | −11.930 | |
| 209 | overspeed | 3.111 | 2.889 | 1.111 | 9.985 | 13.0 | −3.015 | |
| axle | 301 | abnormal sound | 4.000 | 3.889 | 1.111 | 17.283 | 18.3 | −1.017 |
| 302 | wear | 1.111 | 3.111 | 2.000 | 6.913 | 9.3 | −2.387 | |
| 303 | bending | 1.889 | 5.889 | 4.111 | 45.732 | 41.3 | 4.432 | |
| 304 | fracture | 1.000 | 9.111 | 3.000 | 27.333 | 28.0 | −0.667 | |
| Key Comp. | Failure Mode | O | S | D | New RPN | Old RPN | RPN Difference | |
|---|---|---|---|---|---|---|---|---|
| ID | Description | Fused Value | Fused Value | Fused Value | The Weights Are the Same | |||
| Rotor blade | 101 | deformation | 3.336 | 6.664 | 2.000 | 44.462 | 44.7 | −0.238 |
| 102 | crack | 2.000 | 8.336 | 4.000 | 66.688 | 66.7 | −0.012 | |
| 103 | fracture | 1.000 | 9.321 | 3.000 | 27.963 | 28.0 | −0.037 | |
| 104 | corrosion | 1.679 | 6.336 | 3.336 | 35.489 | 35.2 | 0.289 | |
| 105 | wear | 1.400 | 3.336 | 2.000 | 9.341 | 9.3 | 0.041 | |
| 106 | flexural | 2.000 | 6.000 | 5.000 | 60.000 | 60.0 | 0.000 | |
| 107 | slide block fall | 1.000 | 7.000 | 3.000 | 21.000 | 21.0 | 0.000 | |
| 108 | scuff | 3.000 | 5.336 | 1.000 | 16.008 | 16.0 | 0.008 | |
| 109 | rustiness | 1.679 | 6.336 | 3.664 | 38.978 | 38.7 | 0.278 | |
| 110 | scaling | 1.716 | 6.336 | 3.664 | 39.837 | 28.1 | 11.737 | |
| 111 | creep | 3.336 | 6.664 | 2.336 | 51.932 | 51.9 | 0.032 | |
| Disc | 201 | crack | 1.679 | 8.336 | 3.664 | 51.282 | 50.9 | 0.382 |
| 202 | fracture | 1.000 | 9.000 | 3.000 | 27.000 | 27.0 | 0.000 | |
| 203 | burst | 1.679 | 8.664 | 2.336 | 33.981 | 33.7 | 0.281 | |
| 204 | surge | 2.664 | 8.336 | 1.400 | 31.090 | 29.6 | 1.490 | |
| 205 | Stall | 3.336 | 2.336 | 1.400 | 10.910 | 10.0 | 0.910 | |
| 206 | flutter | 2.664 | 6.664 | 1.400 | 24.854 | 23.7 | 1.154 | |
| 207 | deformation | 3.336 | 6.664 | 2.000 | 44.462 | 44.7 | −0.238 | |
| 208 | buckling | 1.400 | 6.000 | 5.336 | 44.822 | 46.0 | −1.178 | |
| 209 | overspeed | 3.336 | 2.664 | 1.400 | 12.442 | 13.0 | −0.558 | |
| axle | 301 | abnormal sound | 4.000 | 3.664 | 1.400 | 20.518 | 18.3 | 2.218 |
| 302 | wear | 1.400 | 3.336 | 2.000 | 9.341 | 9.3 | 0.041 | |
| 303 | bending | 1.679 | 5.664 | 4.336 | 41.235 | 41.3 | −0.065 | |
| 304 | fracture | 1.000 | 9.321 | 3.000 | 27.963 | 28.0 | −0.037 | |
Disclaimer/Publisher’s Note: The statements, opinions and data contained in all publications are solely those of the individual author(s) and contributor(s) and not of MDPI and/or the editor(s). MDPI and/or the editor(s) disclaim responsibility for any injury to people or property resulting from any ideas, methods, instructions or products referred to in the content. |
© 2023 by the authors. Licensee MDPI, Basel, Switzerland. This article is an open access article distributed under the terms and conditions of the Creative Commons Attribution (CC BY) license (https://creativecommons.org/licenses/by/4.0/).
Share and Cite
Tang, Y.; Zhou, Y.; Zhou, Y.; Huang, Y.; Zhou, D. Failure Mode and Effects Analysis on the Air System of an Aero Turbofan Engine Using the Gaussian Model and Evidence Theory. Entropy 2023, 25, 757. https://doi.org/10.3390/e25050757
Tang Y, Zhou Y, Zhou Y, Huang Y, Zhou D. Failure Mode and Effects Analysis on the Air System of an Aero Turbofan Engine Using the Gaussian Model and Evidence Theory. Entropy. 2023; 25(5):757. https://doi.org/10.3390/e25050757
Chicago/Turabian StyleTang, Yongchuan, Yonghao Zhou, Ying Zhou, Yubo Huang, and Deyun Zhou. 2023. "Failure Mode and Effects Analysis on the Air System of an Aero Turbofan Engine Using the Gaussian Model and Evidence Theory" Entropy 25, no. 5: 757. https://doi.org/10.3390/e25050757