


An Approach to Canonical Correlation Analysis Based on Rényi’s Pseudodistances

Abstract
:1. Introduction
2. Rényi’s Pseudodistance Canonical Correlation Analysis
3. Consistency
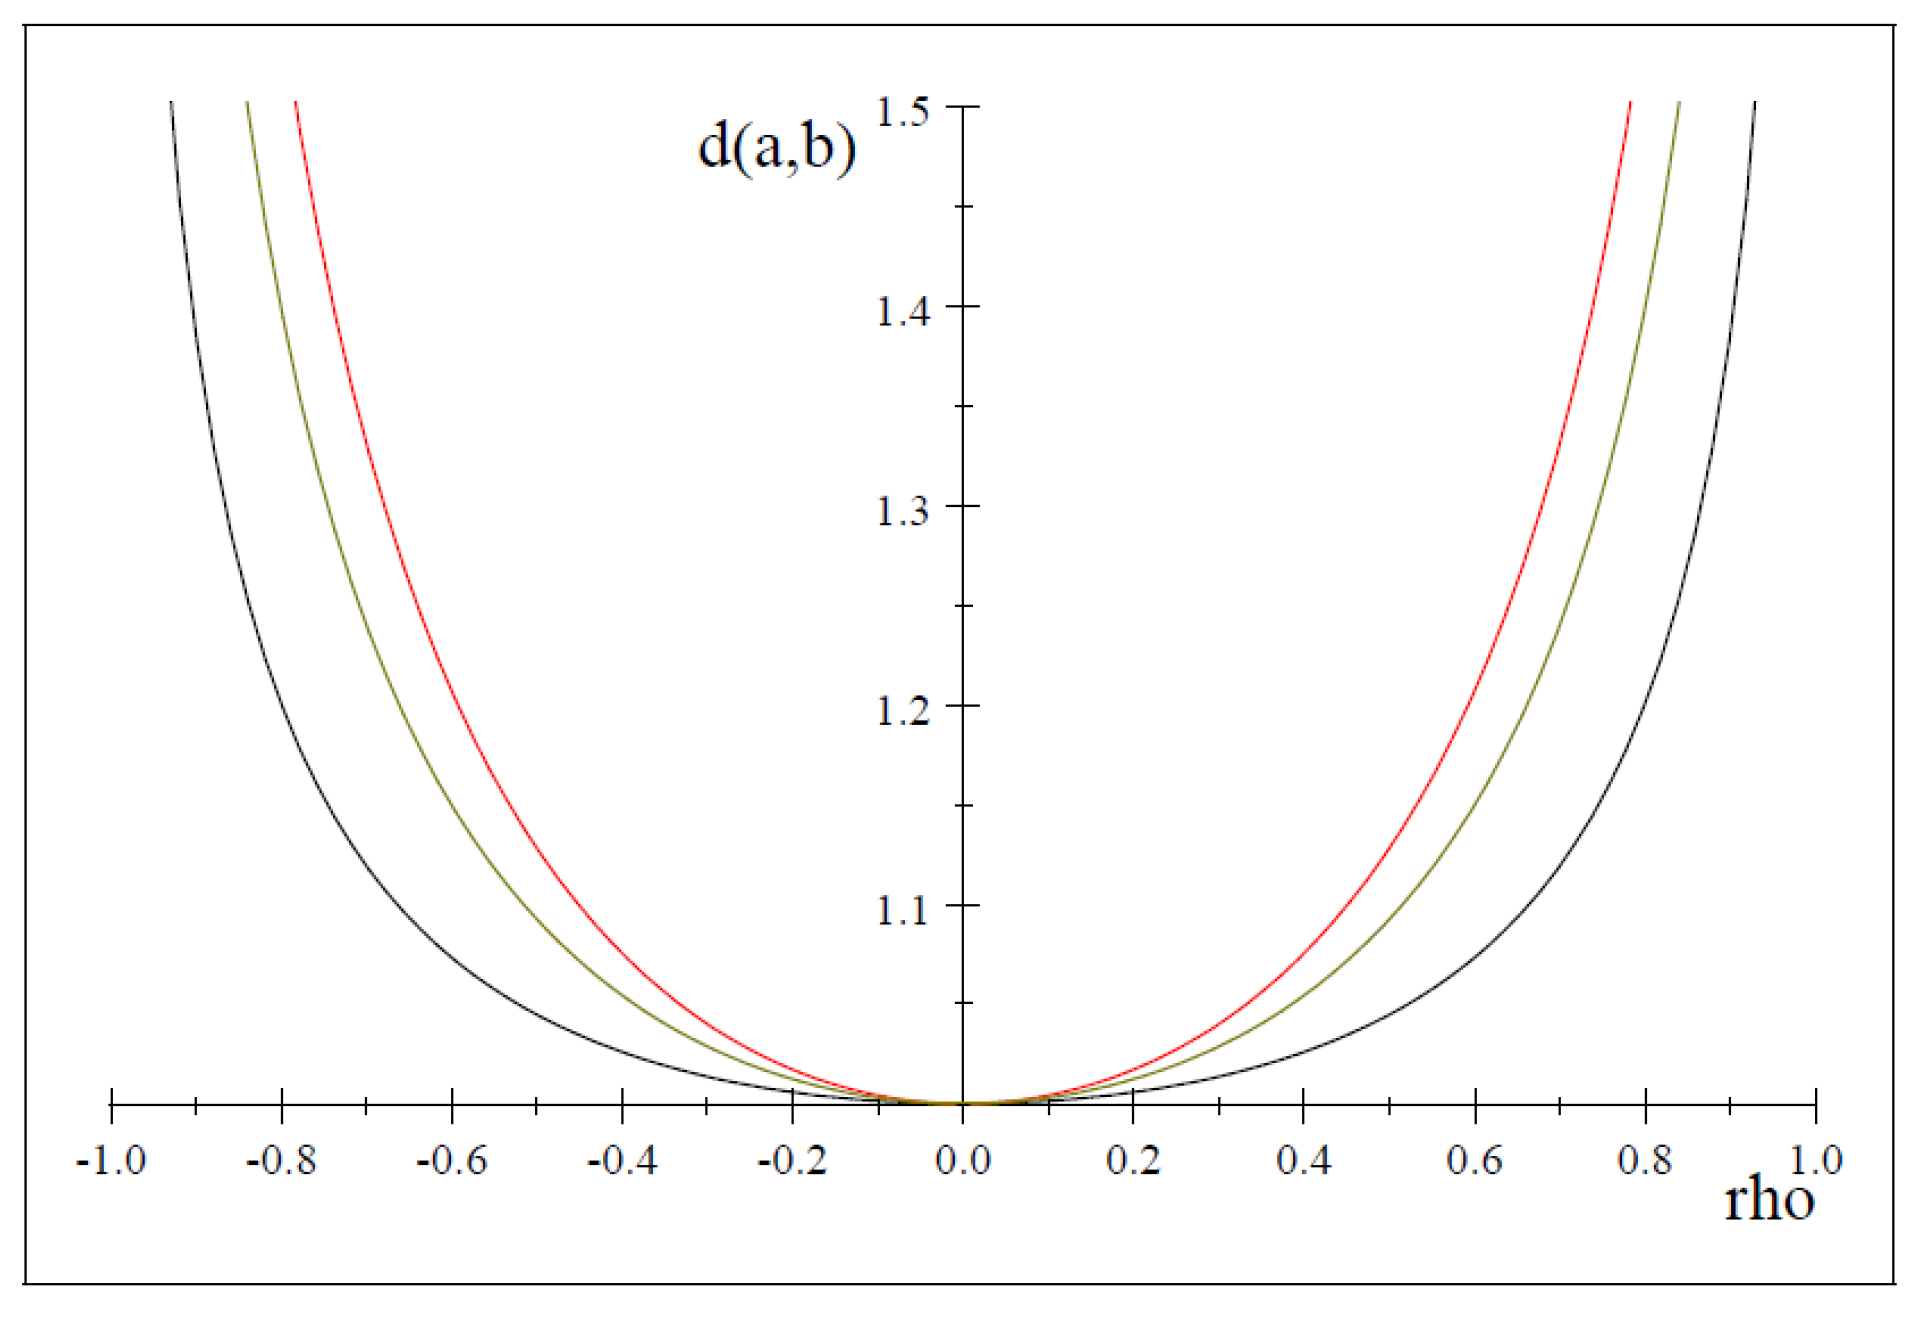
4. Robustness
5. Testing to Determine the Number of Pairs
6. Simulation Study
6.1. Computational Methods
6.2. Monte Carlo Simulation
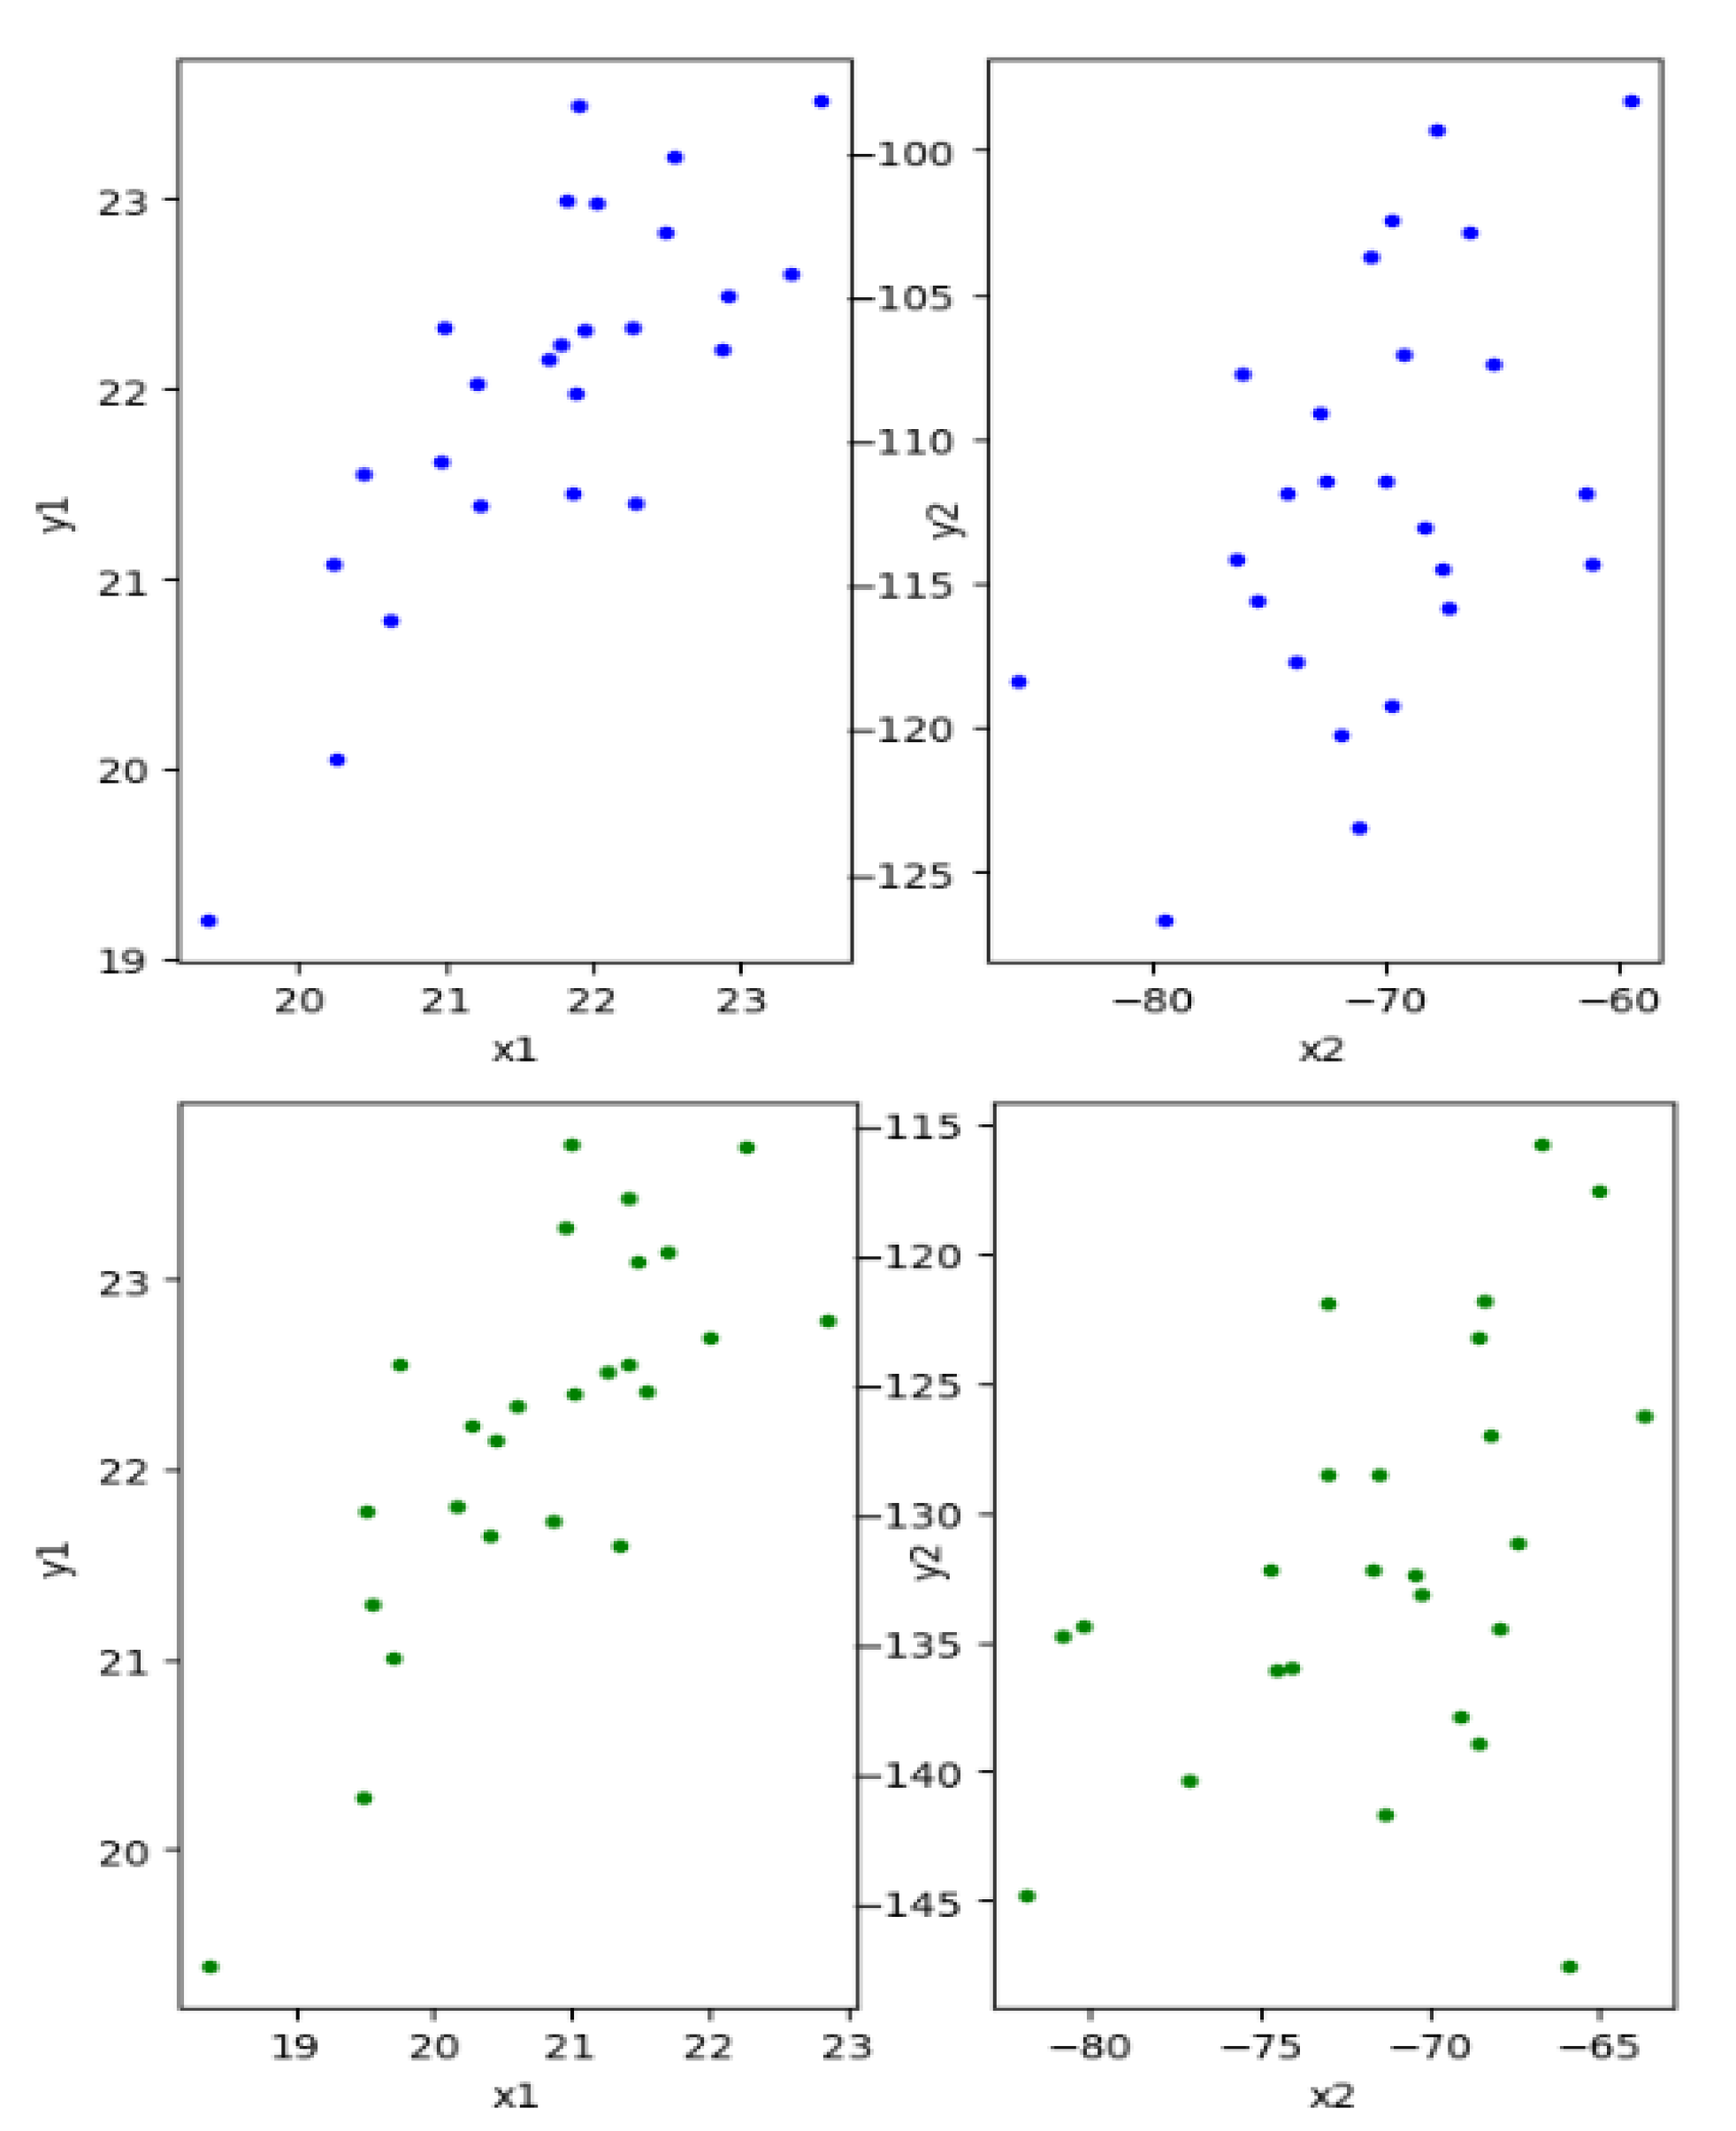
6.3. Real Data Application
7. Conclusions
Author Contributions
Funding
Institutional Review Board Statement
Data Availability Statement
Acknowledgments
Conflicts of Interest
Abbreviations
| CCA | Canonical Analysis |
| ICCA | Informational Canonical Analysis |
| RP | Rényi Pseudodistance |
| RPCCA | Rényi Pseudodistance Canonical Analysis |
References
- Hotelling, H. Relations between two sets of variables. Biometrika 1936, 28, 321–377. [Google Scholar] [CrossRef]
- Mardia, K.; Kent, J.; Bibby, J. Multivariate Analysis; Academic Press: New York, NY, USA, 1979. [Google Scholar]
- Rencher, A.C.; Christensen, W.F. Methods of Multivariate Analysis, 3rd ed.; John Wiley & Sons: Hoboken, NJ, USA, 2012. [Google Scholar]
- Ouali, D.; Chebana, F.; Ouarda, T.B.M.J. Non-linear canonical correlation analysis in regional frequency analysis. Stoch. Environ. Res. Risk Assess 2016, 30, 449–462. [Google Scholar] [CrossRef]
- Cannon, A.J.; Hsieh, W.W. Robust nonlinear canonical correlation analysis: Application to seasonal climate forecasting. Nonlinear Process. Geophys. 2008, 15, 221–232. [Google Scholar] [CrossRef]
- Iaci, R.; Sriram, T.N. Robust multivariate association and dimension reduction using density divergences. J. Multivar. Anal. 2013, 117, 281–295. [Google Scholar] [CrossRef]
- Gifi, A. Nonlinear Multivariate Analysis; Wiley-Blackwell: Hoboken, NJ, USA, 1990. [Google Scholar]
- Breiman, L.; Friedman, J.H. Estimating optimal transformations for multiple regression and correlation. J. Am. Stat. Assoc. 1985, 80, 580–598. [Google Scholar] [CrossRef]
- Lai, P.L.; Fyfe, C. Kernel and nonlinear canonical correlation analysis. Int. J. Neural Syst. 2000, 10, 365–377. [Google Scholar] [CrossRef] [PubMed]
- Painsky, A.; Feder, M.; Tishby, N. Nonlinear canonical correlation analysis: A compressed representation approach. Entropy 2020, 22, 208. [Google Scholar] [CrossRef] [PubMed]
- Van Der Burg, E.; de Leeuw, J. Non-linear canonical correlation. Br. J. Math. Stat. Psychol. 1983, 36, 54–80. [Google Scholar] [CrossRef]
- Yin, X. Canonical correlation analysis based on information theory. J. Multivar. Anal. 2004, 91, 161–176. [Google Scholar] [CrossRef]
- Pardo, L. Statistical Inference Based on Divergence Measures; Chapman and Hall: Boca Raton, FL, USA, 2006. [Google Scholar]
- Mandal, A.; Cichocki, A. Non-Linear Canonical Correlation Analysis Using Alpha-Beta Divergence. Entropy 2013, 15, 2788–2804. [Google Scholar] [CrossRef]
- Cichocki, A.; Cruces, S.; Amari, S.I. Generalized alpha-beta divergences and their application to robust nonnegative matrix factorization. Entropy 2011, 13, 134–170. [Google Scholar] [CrossRef]
- Basu, A.; Harris, I.R.; Hjort, N.L.; Jones, M.C. Robust and efficient estimation by minimising a density power divergence. Biometrika 1998, 85, 549–559. [Google Scholar] [CrossRef]
- Karasuyama, M.; Sugiyama, M. Canonical dependence analysis based on squared-loss mutual information. Neural Netw. 2012, 34, 46–55. [Google Scholar] [CrossRef] [PubMed]
- Nielsen, A.; Vestergaard, J.S. Canonical analysis based on mutual information. In Proceedings of the 2015 IEEE International Geoscience and Remote Sensing Symposium (IGARSS), Milan, Italy, 26–31 July 2015; pp. 1068–1071. [Google Scholar]
- Romanazzi, M. Influence in canonical correlaion analysis. Psychometrika 1992, 57, 237–259. [Google Scholar] [CrossRef]
- Sakar, C.O.; Kursun, O. An hybrid method for feature selection based on mutual information and canonical correlation analysis. In Proceedings of the 20th International Conference on Pattern Recognition, Istambul, Turkey, 23–26 August 2010. [Google Scholar]
- Sakar, C.O.; Kursun, O. A method for combining mutual information and canonical correlation analysis: Predictive mutual information and its use in feature selection. Expert Syst. Appl. 2012, 39, 3333–3344. [Google Scholar] [CrossRef]
- Wang, Y.; Cang, S.; Yu, H. Mutual information inspired on feature selection using kernel canonical correlation analysis. Expert Syst. 2019, 4, 100014. [Google Scholar] [CrossRef]
- Bell, C.B. Mutual information and maximal correlation as measures of dependence. Ann. Math. Stat. 1962, 33, 587–595. [Google Scholar] [CrossRef]
- Iaci, R.; Yin, X.; Sriram, T.N.; Klingerberg, C.P. An informational measure of association and dimension reduction for multiple sets and groups with applications in morphometric analysis. J. Am. Stat. Assoc. 2008, 103, 1166–1176. [Google Scholar] [CrossRef]
- Jones, M.C.; Hjort, N.L.; Harris, I.R.; Basu, A. A comparison of related density-based minimum divergence estimators. Biometrika 2001, 88, 865–873. [Google Scholar] [CrossRef]
- Broniatowski, M.; Toma, A.; Vajda, I. Decomposable pseudodistance and applications in statistical estimation. J. Stat. Plan. Inference 2012, 142, 2574–2585. [Google Scholar] [CrossRef]
- Castilla, E.; Martín, N.; Muñoz, S.M.; Pardo, L. Robust Wald-type tests based on minimum Rényi pseudodistances estimators for the multiple regresion model. J. Stat. Comput. Simul. 2020, 90, 2655–2680. [Google Scholar] [CrossRef]
- Castilla, E.; Jaenada, M.; Pardo, L. Estimation and testing on independent not identically distributed observations based on Rényi’s pseudodistances. IEEE Trans. Inf. Theory 2022, 68, 4588–4609. [Google Scholar] [CrossRef]
- Rényi, A. On measures of entropy and information. In Proceeding of the 4th Symposium on Probability and Statistics; University of California Press: Berkeley, CA, USA, 1961; pp. 547–561. [Google Scholar]
- Toma, A.; Leoni-Aubin, S. Optimal robust M-estimators using Rényi pseudodistances. J. Multivar. Anal. 2013, 115, 259–273. [Google Scholar] [CrossRef]
- Toma, A.; Karagrigoriou, A.; Trentou, P. Robust model selection criteria based on pseudodistances. Entropy 2020, 22, 304. [Google Scholar] [CrossRef] [PubMed]
- Jaenada, M.; Pardo, L. The minimum Renyi’s Pseudodistances estimators for Generalized Linear Models. In Data Analysis and Related Applications: Theory and Practice; Proceeding of the ASMDA; Wiley: Athens, Greece, 2021. [Google Scholar]
- Jaenada, M.; Pardo, L. Robust statistical inference in generalized linear models based on minimum Renyi pseudistance estimators. Entropy 2022, 24, 123. [Google Scholar] [CrossRef] [PubMed]
- Castilla, E.; Jaenada, M.; Martín, N.; Pardo, L. Robust approach for comparing two dependent normal populations through Wald-type tests based on Rényi’s pseudodistance estimators. Stat. Comput. 2023, 32, 100. [Google Scholar] [CrossRef]
- Jaenada, M.; Miranda, P.; Pardo, L. Robust Test Statistics Based on Restricted Minimum Rényi’s Pseudodistance Estimators. Entropy 2022, 24, 616. [Google Scholar] [CrossRef]
- Fujisawa, H.; Eguchi, S. Robust parameter estimation with a small bias against heavy contamination. J. Multivar. Anal. 2008, 99, 2053–2081. [Google Scholar] [CrossRef]
- Silverman, B.W. Density Estimation for Statistics and Data Analysis; Chapman and Hall: London, UK, 1986. [Google Scholar]
- Kim, J.S.; Scott, C. Robust kernel density estimation. J. Mach. Learn. Res. 2012, 13, 2529–2565. [Google Scholar]
- Scott, D.W. Multivariate Density Estimation: Theory, Practice, and Visualization; Wiley: New York, NY, USA, 1992; Volume 1. [Google Scholar]
- Rüschendorf, L. Consistency of estimators for multivariate density functions and for the mode. Sankhya Ser. A 1977, 39, 243–250. [Google Scholar]
- Davison, A.C.; Hinkley, D.V. Bootstrap Methods and Their Application; Cambridge University Press: Cambridge, UK, 1997; Volume 1. [Google Scholar]
- Efron, B.; Tibshirani, R.J. An Introduction to the Bootstrap; Chapman & Hall/CRC: New York, NY, USA, 1993; Volume 57. [Google Scholar]
- Frets, G.P. Heredity of head form in man. Genetica 1921, 3, 193–384. [Google Scholar] [CrossRef]


| 0 | 0.1 | 0.2 | 0.3 | 0.4 | 0.5 | 0.6 | 0.7 | 0.8 | |
|---|---|---|---|---|---|---|---|---|---|
| Pure data | |||||||||
| 0.92878 | 0.96111 | 0.95505 | 0.97044 | 0.97099 | 0.98082 | 0.97090 | 0.98256 | 0.98606 | |
| 0.99908 | 0.99907 | 0.99893 | 0.99877 | 0.99856 | 0.99831 | 0.99799 | 0.99767 | 0.99728 | |
| 0.99946 | 0.99951 | 0.99933 | 0.99938 | 0.99936 | 0.99931 | 0.99906 | 0.99916 | 0.99899 | |
| 5% contamination | |||||||||
| 0.65796 | 0.68689 | 0.71486 | 0.75556 | 0.76384 | 0.80646 | 0.80876 | 0.81990 | 0.81201 | |
| 0.99801 | 0.99815 | 0.99805 | 0.99786 | 0.99749 | 0.99645 | 0.99353 | 0.98368 | 0.96927 | |
| 0.99548 | 0.99571 | 0.99531 | 0.99538 | 0.99461 | 0.99345 | 0.99084 | 0.97936 | 0.96222 | |
| 0.41125 | 0.38246 | 0.36111 | 0.31247 | 0.30856 | 0.25109 | 0.25272 | 0.22822 | 0.23050 | |
| 0.35685 | 0.32477 | 0.31442 | 0.27277 | 0.26949 | 0.22345 | 0.22962 | 0.20914 | 0.21654 | |
| 0.56677 | 0.52712 | 0.49669 | 0.42880 | 0.42197 | 0.33991 | 0.34109 | 0.30249 | 0.30241 | |
| 0.41496 | 0.37628 | 0.36696 | 0.31681 | 0.31561 | 0.26241 | 0.27298 | 0.24999 | 0.26391 | |
| 10% contamination | |||||||||
| 0.41963 | 0.43878 | 0.46604 | 0.49193 | 0.53443 | 0.56155 | 0.57944 | 0.59613 | 0.60565 | |
| 0.99698 | 0.99714 | 0.99712 | 0.99686 | 0.99563 | 0.99225 | 0.98450 | 0.96631 | 0.95789 | |
| 0.99054 | 0.99018 | 0.98974 | 0.98968 | 0.98719 | 0.98401 | 0.97274 | 0.95167 | 0.93961 | |
| 0.68137 | 0.65989 | 0.63978 | 0.60585 | 0.57014 | 0.53623 | 0.51301 | 0.48214 | 0.47437 | |
| 0.56499 | 0.54370 | 0.53006 | 0.51765 | 0.48283 | 0.46007 | 0.44608 | 0.43238 | 0.43151 | |
| 0.94237 | 0.91248 | 0.88343 | 0.83560 | 0.78292 | 0.73427 | 0.69877 | 0.64896 | 0.63289 | |
| 0.63783 | 0.61685 | 0.60406 | 0.59298 | 0.55556 | 0.53199 | 0.52065 | 0.51211 | 0.51843 | |
| 15% contamination | |||||||||
| 0.26726 | 0.29776 | 0.32650 | 0.34987 | 0.40472 | 0.42547 | 0.43099 | 0.43524 | 0.45246 | |
| 0.99662 | 0.99682 | 0.99670 | 0.99631 | 0.99405 | 0.98763 | 0.97539 | 0.95782 | 0.93472 | |
| 0.98740 | 0.98702 | 0.98627 | 0.98541 | 0.98364 | 0.97541 | 0.95686 | 0.93536 | 0.91078 | |
| 0.83673 | 0.81093 | 0.78650 | 0.75948 | 0.70320 | 0.68752 | 0.68190 | 0.67188 | 0.64529 | |
| 0.67519 | 0.65622 | 0.64107 | 0.62355 | 0.58194 | 0.57677 | 0.58054 | 0.58166 | 0.57108 | |
| 1.16074 | 1.12367 | 1.08848 | 1.04925 | 0.96766 | 0.94157 | 0.92937 | 0.90983 | 0.86243 | |
| 0.75424 | 0.73561 | 0.72109 | 0.70581 | 0.66064 | 0.66160 | 0.67484 | 0.68431 | 0.68025 | |
| 20% contamination | |||||||||
| 0.19852 | 0.21736 | 0.22524 | 0.23800 | 0.27663 | 0.28001 | 0.30514 | 0.32119 | 0.31858 | |
| 0.99661 | 0.99683 | 0.99652 | 0.99593 | 0.99429 | 0.99003 | 0.96500 | 0.94362 | 0.90237 | |
| 0.98527 | 0.98503 | 0.98336 | 0.98251 | 0.97950 | 0.97282 | 0.94210 | 0.91641 | 0.86912 | |
| 0.90198 | 0.90524 | 0.89112 | 0.89756 | 0.85384 | 0.85092 | 0.82023 | 0.80367 | 0.79283 | |
| 0.72434 | 0.71723 | 0.71807 | 0.72166 | 0.69817 | 0.70049 | 0.69510 | 0.69435 | 0.70935 | |
| 0.45211 | 0.45326 | 0.44686 | 0.45094 | 0.42851 | 0.42746 | 0.41497 | 0.41101 | 0.41076 | |
| 0.61339 | 0.61723 | 0.60407 | 0.60759 | 0.59650 | 0.59591 | 0.58441 | 0.59536 | 0.59885 | |
| 0 | 0.1 | 0.2 | 0.3 | 0.4 | 0.5 | 0.6 | 0.7 | 0.8 | |
|---|---|---|---|---|---|---|---|---|---|
| Pure data | |||||||||
| 0.22829 | 0.19656 | 0.20033 | 0.18556 | 0.18386 | 0.17334 | 0.17650 | 0.16407 | 0.15426 | |
| 0.99687 | 0.99704 | 0.99514 | 0.99387 | 0.98976 | 0.96917 | 0.94815 | 0.93493 | 0.88471 | |
| 0.99464 | 0.99490 | 0.99122 | 0.98980 | 0.98375 | 0.96336 | 0.93706 | 0.91885 | 0.85931 | |
| 5% contamination | |||||||||
| 0.30303 | 0.29521 | 0.27510 | 0.24815 | 0.24522 | 0.21903 | 0.22096 | 0.19770 | 0.20928 | |
| 0.91167 | 0.92137 | 0.91977 | 0.91112 | 0.91556 | 0.90693 | 0.88127 | 0.84600 | 0.82650 | |
| 0.88049 | 0.89166 | 0.88662 | 0.88904 | 0.89241 | 0.88801 | 0.87192 | 0.83197 | 0.80588 | |
| 0.41815 | 0.38347 | 0.36114 | 0.32231 | 0.31958 | 0.29261 | 0.33041 | 0.32611 | 0.36974 | |
| 0.44509 | 0.41272 | 0.40340 | 0.36543 | 0.36662 | 0.33627 | 0.36107 | 0.34812 | 0.36182 | |
| 0.56221 | 0.51686 | 0.48609 | 0.43221 | 0.42597 | 0.38524 | 0.42792 | 0.41586 | 0.46555 | |
| 0.54952 | 0.50631 | 0.48727 | 0.43321 | 0.43065 | 0.38858 | 0.41934 | 0.39996 | 0.41901 | |
| 10% contamination | |||||||||
| 0.31085 | 0.29651 | 0.28563 | 0.28324 | 0.25836 | 0.24660 | 0.25507 | 0.23689 | 0.22360 | |
| 0.76633 | 0.76784 | 0.77030 | 0.77828 | 0.75962 | 0.77061 | 0.78303 | 0.75727 | 0.71201 | |
| 0.77035 | 0.75135 | 0.75242 | 0.75593 | 0.74394 | 0.75508 | 0.74693 | 0.74538 | 0.70453 | |
| 0.69844 | 0.67264 | 0.64760 | 0.62480 | 0.58957 | 0.56764 | 0.57146 | 0.56234 | 0.60946 | |
| 0.70333 | 0.68232 | 0.65851 | 0.63732 | 0.60797 | 0.57351 | 0.55445 | 0.54736 | 0.53981 | |
| 0.94522 | 0.91180 | 0.87884 | 0.84254 | 0.79453 | 0.76052 | 0.75866 | 0.73627 | 0.79154 | |
| 0.87344 | 0.84137 | 0.80061 | 0.76733 | 0.72179 | 0.67148 | 0.64907 | 0.64158 | 0.63347 | |
| 15% contamination | |||||||||
| 0.29041 | 0.26604 | 0.25341 | 0.24867 | 0.22370 | 0.22678 | 0.22668 | 0.21698 | 0.20791 | |
| 0.62670 | 0.62511 | 0.62775 | 0.63798 | 0.63931 | 0.67347 | 0.66306 | 0.63881 | 0.61437 | |
| 0.67113 | 0.65281 | 0.63298 | 0.64345 | 0.64183 | 0.66804 | 0.66294 | 0.66655 | 0.64393 | |
| 0.86840 | 0.83480 | 0.80722 | 0.78144 | 0.73384 | 0.71580 | 0.71970 | 0.73208 | 0.73667 | |
| 0.83973 | 0.81076 | 0.78283 | 0.74695 | 0.69787 | 0.68081 | 0.65889 | 0.63941 | 0.61576 | |
| 1.17901 | 1.13476 | 1.09703 | 1.06197 | 0.99294 | 0.96654 | 0.96359 | 0.97065 | 0.96509 | |
| 1.04721 | 1.00181 | 0.95442 | 0.89936 | 0.83020 | 0.80219 | 0.77413 | 0.74676 | 0.72249 | |
| 20% contamination | |||||||||
| 0.23981 | 0.23457 | 0.22347 | 0.22122 | 0.21361 | 0.20732 | 0.20959 | 0.19139 | 0.20603 | |
| 0.51483 | 0.51794 | 0.52276 | 0.53520 | 0.54956 | 0.53813 | 0.56693 | 0.54726 | 0.56153 | |
| 0.62369 | 0.59115 | 0.56066 | 0.56134 | 0.58636 | 0.58110 | 0.60681 | 0.61363 | 0.63613 | |
| 0.94170 | 0.92377 | 0.91740 | 0.90923 | 0.86834 | 0.86758 | 0.83873 | 0.82330 | 0.83708 | |
| 0.89672 | 0.87587 | 0.85688 | 0.82781 | 0.78143 | 0.75837 | 0.72490 | 0.70158 | 0.69711 | |
| 0.47541 | 0.46413 | 0.46168 | 0.45820 | 0.43798 | 0.43988 | 0.43203 | 0.42330 | 0.43539 | |
| 0.76644 | 0.73624 | 0.72641 | 0.69977 | 0.67411 | 0.63579 | 0.61011 | 0.61020 | 0.59094 | |
| 0 | 0.5 | |
|---|---|---|
| 0.222 | 0.064 | |
| 0.131 | 0.059 | |
| 0.224 | 0.064 | |
| 1.995 | 0.059 |
Disclaimer/Publisher’s Note: The statements, opinions and data contained in all publications are solely those of the individual author(s) and contributor(s) and not of MDPI and/or the editor(s). MDPI and/or the editor(s) disclaim responsibility for any injury to people or property resulting from any ideas, methods, instructions or products referred to in the content. |
© 2023 by the authors. Licensee MDPI, Basel, Switzerland. This article is an open access article distributed under the terms and conditions of the Creative Commons Attribution (CC BY) license (https://creativecommons.org/licenses/by/4.0/).
Share and Cite
Jaenada, M.; Miranda, P.; Pardo, L.; Zografos, K. An Approach to Canonical Correlation Analysis Based on Rényi’s Pseudodistances. Entropy 2023, 25, 713. https://doi.org/10.3390/e25050713
Jaenada M, Miranda P, Pardo L, Zografos K. An Approach to Canonical Correlation Analysis Based on Rényi’s Pseudodistances. Entropy. 2023; 25(5):713. https://doi.org/10.3390/e25050713
Chicago/Turabian StyleJaenada, María, Pedro Miranda, Leandro Pardo, and Konstantinos Zografos. 2023. "An Approach to Canonical Correlation Analysis Based on Rényi’s Pseudodistances" Entropy 25, no. 5: 713. https://doi.org/10.3390/e25050713