Article

Bibliometric Analysis of Granger Causality Studies

1
Department of Physical and Mathematical Science, Faculty of Science, Kampar Campus, Universiti Tunku Abdul Rahman, Jalan Universiti, Bandar Barat, Kampar 31900, Perak, Malaysia
2
Department of Mathematical Sciences, Faculty of Science and Technology, Universiti Kebangsaan Malaysia (UKM), Bangi 43600, Selangor, Malaysia
*
Authors to whom correspondence should be addressed.
Entropy 2023, 25(4), 632; https://doi.org/10.3390/e25040632
Submission received: 25 February 2023 / Revised: 26 March 2023 / Accepted: 3 April 2023 / Published: 7 April 2023
(This article belongs to the Special Issue Granger Causality and Transfer Entropy for Financial Networks)

Abstract

:
Granger causality provides a framework that uses predictability to identify causation between time series variables. This is important to policymakers for effective policy management and recommendations. Granger causality is recognized as the primary advance on the causation problem. The objective of this paper is to conduct a bibliometric analysis of Granger causality publications indexed in the Web of Science database. Harzing’s Publish or Perish and VOSviewer were used for performance analysis and science mapping. The first paper indexed was published in 1981 and there has been an upward trend in the annual publication of Granger causality studies which are shifting towards the areas of environmental science, energy, and economics. Most of the publications are articles and proceeding papers under the areas of business economics, environmental science ecology, and neurosciences/neurology. China has the highest number of publications while the United States has the highest number of citations. England has the highest citation impact. This paper also constructed country co-authorship, co-analysis of cited references, cited sources, and cited authors, keyword co-occurrence, and keyword overlay visualization maps.

1. Introduction

Identifying causal network problems is important for effective policy and management, and recommendations on climate, epidemiology, and financial regulations. Identifying causality in complex systems can be difficult. Granger causality is an approach that uses predictability as opposed to correlation to identify causation between time series variables [1]. Variable X is said to “Granger cause” Y if the predictability of Y declines when X is removed from the universe of all possible causative variables. The key requirement of Granger causality is separability, namely that information about a causative factor is independently unique to that variable and can be removed by eliminating that variable from the model.
In statistics, Granger causality analyses the information flow between time series. Granger causality was proposed and named after the developer, Clive W. J. Granger in 1969 as a linear vector autoregressive (VAR) model in econometric time series analysis [1,2,3]. In Granger causality, a cause shall precede its effect while the understanding of a cause will help to increase the accuracy to predict the effect [4,5]. In a Granger causality test, a variable may be defined in two ways, namely Granger-cause and fail to Granger-cause. If a variable is identified as a Granger-cause, the variable brings down the forecasting error in the model. On the other hand, a variable will fail to Granger-cause other variables when its historical value cannot significantly predict the future value or when there is no statistical significance in the lagged values of the equation [6]. Therefore, a time series x m , t is a Granger-cause of another time series x n , t if the history of the time series x m enhances the prediction of x n over the time of x n alone. In year 2000, Schreiber [7] introduced the transfer entropy measure to quantify the statistical coherence between processes evolving over time.
With the availability of optimal estimation algorithms of VAR models, Granger causality has attracted the attention of researchers in several prominent research areas. VAR models also do not require any assumption on the physical mechanism for application. Moreover, permutation or bootstrapping are not needed to test the significance in Granger causality when the sample size is large. The result of a Granger causality test shall also remain consistent regardless of the overall signal strength [8,9,10]. Granger causality has been widely applied in several prominent areas. In neuroscience, Granger causality has been applied to functional magnetic resonance imaging (FMRI) [11,12,13], magnetoencephalography (MEG) [14,15,16], and local field potentials (LFP) [17,18,19]. Abdalbari et al. [20] used Granger causality for sleep data analysis to capture the physiological mechanisms during wakefulness and sleep. Hartmann et al. [21] studied the brain–heart interaction during sleep by using Granger causality to examine the electroencephalography (EEG) frequency bands with cortical and cardiovascular activities. Gao et al. [22] improved the classification of emotional states when Granger causality was applied with the Histogram of Oriented Gradient.
In finance, Granger causality has been used to determine the causal relationship between the financial development and economic growth in African countries [23]. The financial development and economic growth relationship has also been studied in the Middle East and North Africa (MENA) region [24]. Amano [25] studied the finance–development relationship during pre-war and post-war period in the United States, United Kingdom, and Japan. Fahimi et al. [26] investigated the globalization-driven energy consumption in Mexico, India, Nigeria, and Turkey. Candelon and Tokpavi [27] applied Granger causality in the European stock markets for spill over analysis. Coronado et al. [28] studied the cause–effect of COVID-19 news and stock market reactions in the United States and Latin America using Granger causality based on transfer entropy. Zuhud et al. [29] analysed the Malaysian stock market using Granger causality and transfer entropy. Granger causality has also been used to assess the dependency between different sectors with past time series [30]. Past studies have also used Granger causality to study Twitter sentiments’ effects on stock prices [31,32]. Granger causality has also been accepted in the areas of business, management, accounting, and economics [33,34,35,36,37,38,39,40,41]. The contribution of Granger causality has also been noticed in computer science [42,43,44,45,46] and engineering [47,48,49,50,51].
The popularity of Granger causality in these notable areas encourages further research and publications. To date, no bibliometric analysis has been done on Granger causality. Therefore, this paper aims to perform a bibliometric analysis on Granger causality using the Web of Science database. With the increasing availability of scientific databases and bibliometric software, bibliometric analysis has been used to assess scientific data and their research impact [52,53,54]. The research impact of the Granger causality publications obtained from the citation metrics, keywords, and authorships reflect the contribution of the publications in research and the industry. The research impacts, which are factual and objective, also show the practicality and popularity of a research area in current and future research.
This paper also examines the emerging trends in the papers, publication titles, research areas, and collaborations on Granger causality. From the emerging trends obtained from the bibliometric analysis, researchers may identify the hotspots of their research areas and determine the gaps for future works. The results of this bibliometric analysis of Granger causality are both objective and subjective. Performance analysis that shows the citation metrics of the documents and journals are objective findings while the scientific mapping that displays networks of relationships are subjective in nature [55,56]. This bibliometric analysis of Granger causality hopes to provide a comprehensive coverage on the publications of Granger causality and identify the research gaps to allow researchers to acquire ground-breaking ideas and position them to expand and enhance the application of Granger causality.
Section 2 continues with the literature review on the applications of Granger causality. Section 3 discusses the materials and methods used in the bibliometric analysis of Granger causality. Section 4 presents the results of the bibliometric analysis. Section 5 summarizes this paper with suggestions on future trends.

2. Literature Review on the Application of Granger Causality

Granger causality is applied in many areas such as business economics, environmental sciences, neurosciences, and computer sciences. This section shall review the literature on the application of Granger causality.

2.1. Business Economics

In business economics, Granger causality has been applied to perform a causality analysis on foreign direct investment (FDI), Islamic bank, and the capital market.
Zhang and Zhang [57] studied the impacts of gross domestic product, trade structure, exchange rates, and FDI inflow on carbon emissions in China. This paper found that FDI inflow positively affected the carbon emission rate in the country. Three policy implications were made in this paper. Firstly, the authors suggested that China should improve its high value-added low carbon-intensive areas such as the advertising, maintenance, and finance sectors. Secondly, the stability of the Chinese Yuan exchange rate could be promoted to lower carbon emissions as it will affect carbon demand and trigger price fluctuation. Thirdly, the government can direct FDI into low-carbon industries or high-tech sectors.
Jebli et al. [58] studied the causality among renewable energy usage, number of tourists, trade openness, economic growth, FDI, and carbon emissions in Central and South America. This paper concluded that tourism, renewable energy, and FDI reduced carbon emissions while trade and economic growth increased carbon emissions. Therefore, this paper proposed that policies such as FDI, usage of renewable energy, and developing green tourism could benefit the environment.
Granger causality was applied to identify the direction of causality to evaluate FDI, export, and economic growth in South Africa [59]. This paper confirmed that FDI and exports contributed to economic growth as there were unidirectional relationships from FDI to economic growth and FDI to exports. There was a bidirectional relationship between economic growth and export activities. The policy implications in this paper included the stimulation of FDI with investor incentives, developing a fair macroeconomic environment, and wise application of loose monetary policy in South Africa.
Arogundade et al. [60] analysed the human capital, institutional quality, FDI, and poverty in sub-Saharan Africa. This paper deduced that FDI had no direct relationship on the occurrence and level of poverty. FDI had negative effects on the absorptive capacity of the host country. This paper proposed several policies such as to invest in human capital and perform public sector reform to reduce corruption and improve political stability.
Farooqi and O’Brien [61] studied the effects of Basel standards on Islamic and conventional banks in the Gulf region. This paper concluded that the proposal of a market-based measure of bank stress led the accounting-based Tier-1 ratio and was in accordance to the Basel regulation’s Pillar 3. Therefore, the use of a measure to signal bank stress can be used to identify oncoming challenges before they escalate.
Setyowati [62] investigated the factors that affected saving and financing in Islamic banks in Indonesia. This paper found that there was a long-running cointegrating relationship in saving and financing to the consumer price index (CPI), manufacturing, interest rate, exchange rate, and Jakarta Islamic Index. Structural breaks occurred around January 2006 to April 2007 to signal financial crisis. There were bidirectional relationships between deposits and manufacturing, and between CPI and financing. Real activity, which was manufacturing, also affected Islamic bank financing. The policy implications in this paper were to provide incentives to encourage real activity such as production and manufacturing to allow Islamic banks to fulfil their intermediary roles and to implement an effective monetary policy on inflation to stabilize the market.
Samad [63] studied the relationship between Islamic banks’ return on depositors and conventional banks’ deposit interest in Bahrain. This paper found that there was a bidirectional relationship between Islamic banks’ returns on depositors and conventional banks’ interest rates.
Sharif et al. [64] assessed the time–frequency relationship between COVID-19 pandemic, oil prices, geopolitical risks, economic uncertainty, and the US stock market. This paper noted that the pandemic had a larger impact on the geopolitical risks and economic uncertainty compared to the US stock market. Oil was leading the US stock market regardless of the frequency. This paper suggested including a geopolitical risk index to analyse the financial impact of the pandemic. The US government should also design and implement a coherent economic strategy during and after the pandemic to foster market opening. Asset managers and investors should reassess the risk management framework to deal with the pandemic risks.
Wang et al. [65] studied the risk spill over effect from the US economic policy uncertainty (EPU) index, equity market uncertainty index, and Chicago Board Options Exchange’s CBOE Volatility Index (VIX) to Bitcoin. The authors found negligible risk spill over effects from these indices to Bitcoin. This study is beneficial to the investors when performing asset portfolio investment as Bitcoin diversifies extreme market shocks. This paper suggested that future studies could check if the cryptocurrency market is immune from EPU shocks.
Robiyanto et al. [66] measured the effectiveness of ASEAN-5 initiative from the portfolio perspective. The results showed weak integration into the equity markets in ASEAN-5. However, the ASEAN-5 initiative had an effect on the capital markets. This paper then suggested that investors in Malaysia, Singapore, and the Philippines should not invest excessively in Indonesia and Thailand equities when the market was unstable because Indonesia and Thailand were the net contributors to the volatility.
Athari and Bahreini [67] investigated the effects of economic policy uncertainty on travel and leisure companies’ debts in western Europe. Economic policy uncertainty had adverse effects on travel and leisure companies’ debt level. Countries with high economic policy uncertainty had lower debt ratios. The policy implications included the monitoring of the rise of economic policy uncertainty to stabilize cash flow for expansion and investment of travel and leisure companies, to perform portfolio diversification to reduce the adverse effects of economic policy uncertainty, and to consider firm and country-level matrices prior to setting debt ratios.
Athari [68] examined the causal relationship between financial inclusion and domestic political risk on the banking sector around the world. There were positive causal relationships from capital deregulation, credit risk inefficiency, market power, and indices in financial inclusion, political risk, and economic risk to banking stability. This paper suggested that countries should increase their stability by raising financial inclusion to offer stable environments for the economy and politics.

2.2. Environmental Sciences

In environmental sciences, Granger causality has been applied to assess ecological footprints, resource management, renewable energy, and carbon emissions.
Zafar et al. [69] investigated the relationship between natural resources, human capital, and FDI on the ecological footprint in the United States. Human capital and natural resources lowered the ecological footprint while economic growth and FDI elevated the ecological footprint. Several policy recommendations were given in this paper. Firstly, the government should monitor and control the excessive use of natural resources by encouraging its residents to reduce their consumption and adopt efficient products. The government should also encourage sustainable consumption and sustainable infrastructure for FDI. The United States should also attract high-tech FDI that does not make a large contribution to the ecological footprint. The country should also attract investments for renewable energy sources, infrastructure, and technology to improve bio-productivity.
Philip et al. [70] to study the best policies for Malaysia to achieve the 2030 climate goal to curb carbon emissions. This paper found that in the beginning of the economic growth, economic activities posed negative effects to the environment. However, the relationship was reversed at a later stage. Hence, this paper recommended the deregulation of the renewable energy sector to include private and public players. The government can also offer tax reductions and credits and encourage financial institutions to support the investment in renewable energy.
Xie et al. [71] studied the effects of mineral and forestry resource volatility on the economic performances around the world from 1985 to 2021. This paper found that mineral resources and forestry resources have a unidirectional causality to economic performances. However, the authors also argued that oversupply of natural resources is detrimental to the economy of a country. Renewable energy sources should be adequate to meet output objectives. Countries also need to practice efficient use of renewable energy resources to meet sustainability goals.
Adebayo [72] investigated the environmental consequences of fossil fuels in Spain. Fossil fuels lowered the environmental quality in the short and medium term, but renewable energy improved the quality of the environment. FDI enhanced the environmental quality, but economic complexity had detrimental effects on the quality of the environment. Based on outcome, the government can carry out schemes to attract FDI and multinational players to invest in green technologies. The government can also implement and tighten the environmental regulations for multinational companies currently operating in the country. Subsidies and tax reliefs for clean technologies can be introduced. The government should also encourage the shift to an energy mix to reduce reliance on fossil fuels and increase investment in renewable energy. Economic structural change can also be accelerated to improve the knowledge intensive sectors and production input mix for efficient performances.
Huang et al. [73] measured the causality between economic policies and carbon dioxide emissions in the European Union. This study aimed to find out the relationship between macroeconomic policies, national expenditure, non-renewable energy use, renewable energy use, and carbon dioxide emissions. Monetary tools had harmful effects on carbon emissions. The tightening of monetary policy could reduce the adverse effects of carbon emissions. Policy assessment also had a unidirectional relationship with energy use.
Nketiah et al. [74] studied the impacts of tourism, renewable energy, and biocapacity in enhancing or restricting the ecological footprints in West Africa. Human capital, natural resources, tourism, and real income had positive effects on the ecological footprints in West Africa. There was unidirectional causality from ecological footprints to renewable energy usage, human capital and urbanization. A bidirectional relationship was observed between biocapacity and real income. This paper suggested that countries in West Africa implement policies to deter increasing ecological footprints per capita and reduce overexploitation of natural resources.

2.3. Neurosciences

Granger causality has wide application in neurosciences such as cognitive, computational, and clinical neurosciences. Pesaran et al. [18] investigated large-scale brain dynamics. Granger causality was used because it was easy to apply to identify the direction of influence for temporal predictions in stochastic processes. Granger causality can also differentiate between direct and indirect influences. Wang et al. [75] studied the interacting brain networks when robot-assisted training and simulation were used. Granger causality was used to study the effective connectivity of the brain networks when while performing rehabilitation training tasks with a robotic device under various feedback conditions. Du et al. [76] aimed to find out whether a vibrotactile enhanced hand rehabilitation device could enhance sensorimotor brain activities. The training task of moving a hand and vibration simulation had strong causal influences between both sides of the cerebral hemispheres, and thus, had high training efficiency in functional cerebral hemodynamics.
Ye et al. [77] investigated the neural features of internet gaming disorder. Granger causality test revealed that there was connectivity from the right precentral gyrus to the left precentral gyrus and dorsal anterior cingulate cortex, which affected the internet gaming disorder severity. Zhang et al. [78] proposed the cross-frequency Granger causality feature extraction and fusion in both hemispheres for EEG emotion recognition. This proposed Granger causality had higher accuracy than the same-frequency band Granger causality features. Sysoev et al. [79] used Granger causality to describe the directed network activities between the somatosensory index and rostral reticular thalamic nucleus, caudal reticular thalamic nucleus, higher order thalamic nuclei and first order ventral posteromedial thalamic nucleus during sleep and wakefulness in rats. Ursino et al. [80] interpreted cortical signals reconstructed from EEG to study brain connectivity using temporal Granger causality in individuals with autism. Fu et al. [81] used neural Granger causality to examine the changes in schizophrenia’s non-linear causal couplings.

2.4. Computer Science

Lamsal et al. [82] used Granger causality to predict the COVID-19 daily cases in Australia from Twitter conversations. This study found that latent social media variables had extra prediction capability for forecasting models. Cai et al. [83] studied the causal effects of social bots on information diffusion in social networks for public health information in China. Granger causality found that sentiments of humans and social bots were able to predict each other. This paper then suggested that emergency managers shall control the bots at the end paths and act as opinion leaders to guide internet users’ sentiments. Tank et al. [84] used deep learning to propose non-linear dynamics of Granger causality with structured multilayer perceptrons or recurrent neural networks and sparsity inducing penalties on the weights.
Pirnay and Burnay [85] attempted to systemize the identification of causalities in Strategy Maps for risk management and decision-making in Belgium. A hybrid gray theory and Granger causality model was constructed for sensor correlation network structure mining on trains. After building the vehicle information network, the authors used complex network theory to mine the vehicle information network to find the causality between the nodes. Wang et al. [86] detected a causal structure for cloud services using Granger causality. Their results noted that neural Granger causality was better on linear and non-linear time series data. For greater linear time series, linear Granger causality was more efficient. Aviles-Cruz et al. [87] studied single user activities on smartphones with data obtained from accelerometer sensors. Zhang et al. [88] used Granger causality to identify the spatiotemporal causal relationship to obtain useful features for a deep learning multitask learning model for traffic speed prediction.
Therefore, with the broad application of Granger causality and its policy implications in business, society, and public administration, this paper intends to perform a bibliometric analysis of Granger causality.

3. Materials and Methods

The objective of this paper is to perform a bibliometric analysis of Granger causality. Web of Science, which is a credible and globally accepted scientific database for peer-reviewed publications, was used to extract the publication data of Granger causality [89,90,91,92]. The process of this bibliometric analysis can be explained in three steps as shown in Figure 1 [93].
In the beginning, “Granger causality” was selected for this bibliometric analysis. Then, a search based on the following query: (“Granger causality” (Topic)) was made on the Web of Science database to extract the publication data on Granger causality on 14 February 2023. A total of 11,793 documents appeared from this query. After that, a filter was applied to identify articles, proceeding papers, early access, review articles, book chapters, and books only. The final dataset which was extracted in plain text file format consisted of 11,701 publications from 1981 to 2023.
Then, performance analysis and scientific mapping were performed. Performance analysis states the contributions of documents and journals, which are quantifiable. Important measures in performance analysis include total number of publications (TP), total number of citations (TC), number of cited papers (NCP), average number of citations per paper (C/P), average number of citations per cited paper (C/CP), h-index, and g-index. The details on the publication number indicates productivity level while the citation metric is a measurement of impact. The value of h-index is defined as the h number of publications with at least h citations. The value of g-index is explained as the g number of publications with at least g2 citations. Thus, the h-index measures the influence while g-index measures the impact [94,95,96,97].
Scientific mapping describes the relationships, connections, and interactions in research. The frequently used scientific mappings are country co-authorship and keyword co-occurrence maps [98]. A co-authorship map studies the scientific interaction among researchers in a topic. Co-authorships improve research contribution as experts from various fields collaborate to share knowledge, funding, and technology. Co-citation analysis shows the references, sources, and authors which are commonly cited together in other documents. A keyword co-occurrence map shows the thematic relationships of the keywords used and could be used to determine the current research trends. The combination of performance analysis and scientific mapping enriches the results of bibliometric analysis. In this paper, the performance analysis was performed with Harzing’s Publish or Perish 8 while the scientific mapping was done with VOSviewer [99,100,101,102].

4. Results

This section presents the results of the bibliometric analysis of Granger causality. Table 1 explains the document types of the Granger causality publications. A total of 78.52% of the publications are articles and 16.30% of the publications are proceeding papers. Early access, review articles, book chapters, and books make up 2.41%, 1.96%, 0.78%, and 0.03% of the total publications, respectively.

4.1. Publication Trend

Table 2 shows the publication trend of Granger causality documents from 1981 to 2023 as of 14 February 2023. The first paper indexed in the Web of Science database is titled “Granger-causality in multiple time series” by TjØstheim [103]. This paper, which was published in 1981, has received 21 citations to date. This paper studied the problem of constrained estimation in models with a known causality structure. The second paper listed on the Web of Science database is “Granger causality and the time series analysis of political relationships” by Freeman [104], which was published in 1983 with 168 citations as of 14 February 2023. This paper discussed the application of Granger causality in the study of political relationships. The third indexed paper is “Granger causality and policy effectiveness” authored by Buiter [105] in 1984, which has received 18 citations. This paper discussed the Granger causality and policy effectiveness with an optimizing controller as well as the Granger causality and automatic stabilizers. Another paper titled “A note on tests of Granger causality” was also published in 1984. This paper by Bessler and Kling [106] has received 18 citations. This paper studied the issue of the relationship between the annual economic activity and annual sunspots.
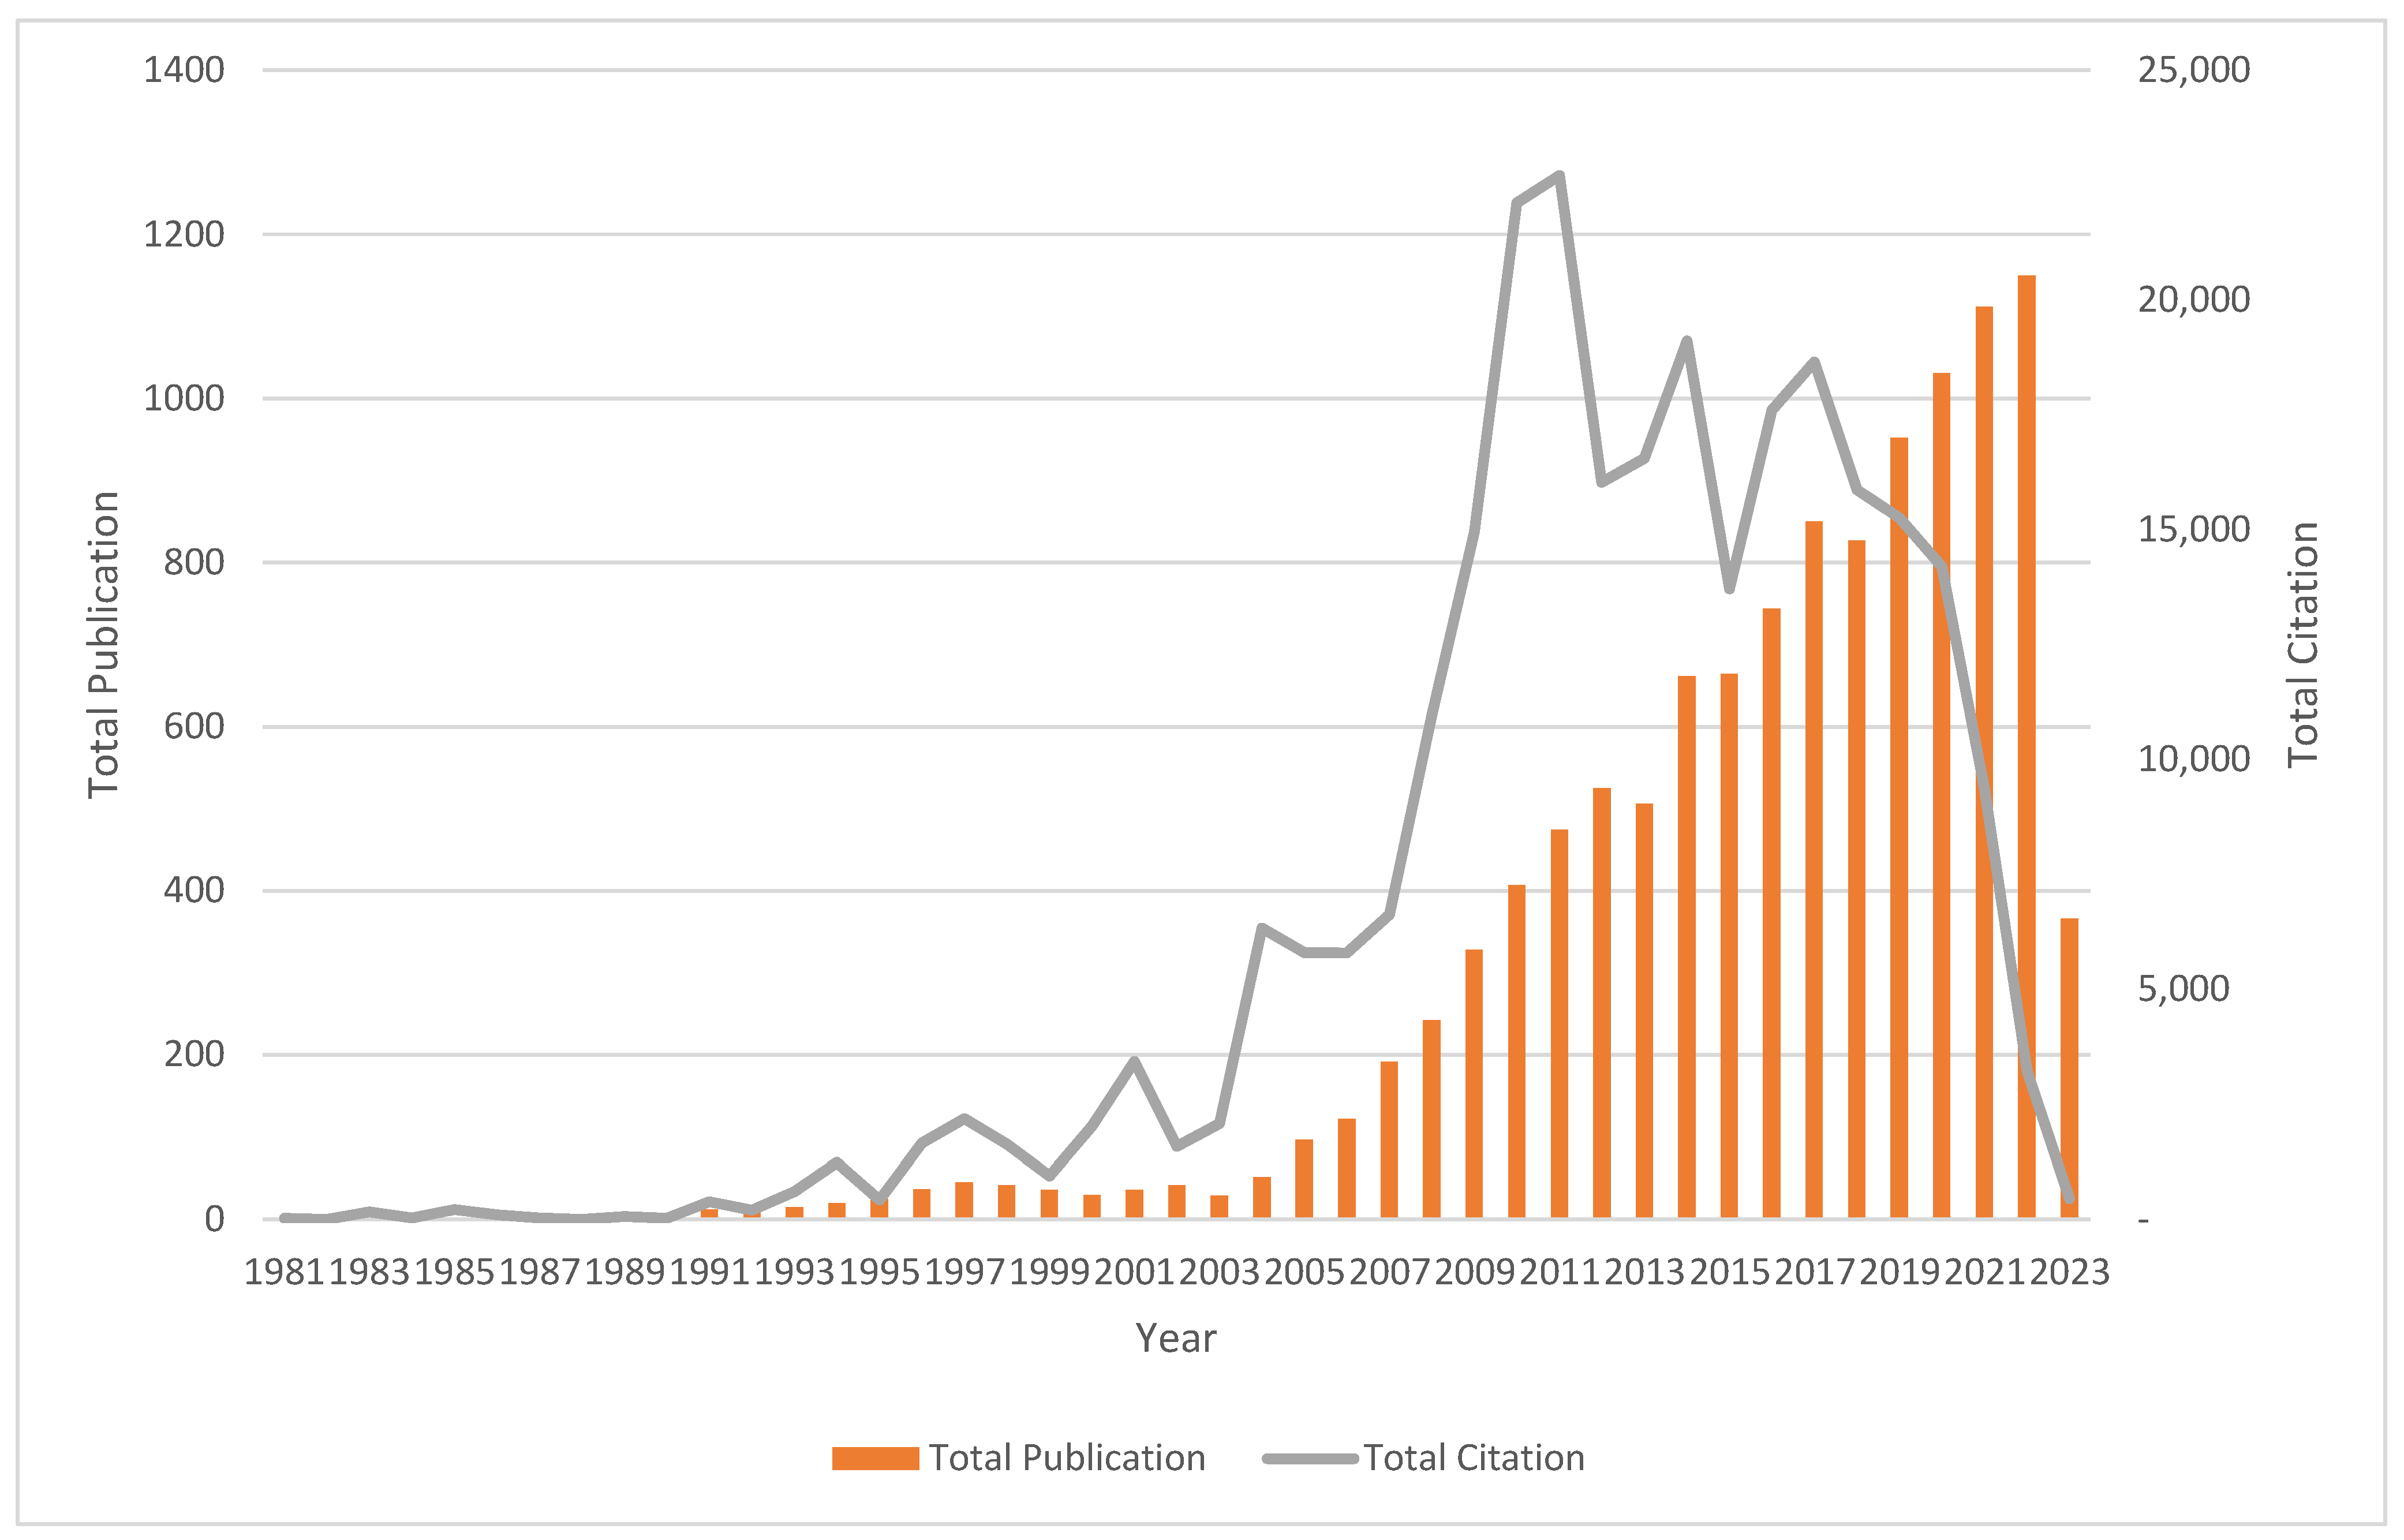
The annual number of publications from 1981 to 1990 were low at only a single digit each year. There was a small fluctuation in the number of publications from 1991 to 2005. However, after 2005, there was a spike in the overall annual publication rate until 2022. The highest number of papers was also recorded in 2022 with 1150 documents. Therefore, it is predicted that the number of documents published in 2023 will exceed the number of documents in 2022, as Granger causality received notable attention from researchers. Table 2 tabulates the annual publication and citation metrics of Granger causality documents from 1981 to 2023. The publication and citation trend of Granger causality publications are described in Figure 2.
From Table 2, the highest total number of citations (TC) was recorded in 2011 with 22,709 citations. There are four papers among the top 10 cited papers which were published in 2011 that contributed to the high number of total citations. The paper by Friston [107] titled “Functional and effective connectivity: a review” was the third most cited paper with 1862 citations. The fifth most cited paper titled “Twitter mood predicts the stock market” by Bollen et al. [108] has received 1225 citations. The sixth most cited paper is “Network modelling methods for fMRI” by Smith et al. [109] with 1209 citations. The paper “FIAR: an R package for analyzing functional integration in the brain” by “Roelstraete and Rosseel [13] received 1055 citations.
The highest number of citations per paper (C/P) and highest number of citations per cited paper (C/CP) were achieved by the only paper “Granger causality and the time series analysis of political relationships” by Freeman [104] published in 1983. This paper has received 168 citations. The h-index was the highest at 70 in 2010, 2011, and 2014. This means that 70 papers have been cited at least 70 times in 2010, 2011, and 2014. The highest g-index of 144 was recorded in 2010 and 2011. There were 144 documents with a total of 20,736 citations published in 2010 and 2011.

4.2. Research Area

The 11701 publications have been classified into several research areas. Most of the publications were under business economics (5119 documents), environmental science and ecology (1300 documents), neurosciences/neurology (1133 documents), engineering (1122 documents), computer science (901 documents), science technology other topics (849 documents), energy fuels (745 documents), mathematics (560 documents), social science other topics (479 documents), and physics (343 documents). The top 10 research areas are listed in Table 3.
The Web of Science database has also classified the publications into several categories. The Web of Science database identified the top 10 categories of publications in the following order: economics (3717 documents), business finance (1109 documents), neurosciences (1036 documents), environmental sciences (948 documents), business (747 documents), energy fuels (745 documents), management (736 documents), environmental studies (599 documents), green sustainable science technology (499 documents), and engineering—electrical/electronic (457 documents). The top 20 Web of Science categories are shown in Table 4.

4.3. Country Contribution

Researchers from about 150 countries have contributed to the publication of Granger causality from 1981 to 2023. The top 3 countries with the highest total publication (TP) were China (3114 documents), the United States (2113 documents), and Turkey (874 documents). Among the 274,321 total citations received from the 11701 documents, the United States received the highest number of citations with 80055 citations, which was more than 29% of the total citations. Meanwhile, England had the most impactful publications with 46.64 citations per paper (C/P) and 51.66 citations per cited paper (C/CP). The United States had the highest h-index (125) and g-index (225). A total of 125 documents have been cited more than 125 times while 225 documents have a cumulative number of more than 50,625 citations. Even though China had the highest total number of publications (TP), the publication impact (measured by C/P and C/CP) of these publications fell behind England, Malaysia, the United States, Turkey, Pakistan, Australia, Germany, and Italy. Table 5 demonstrates the top 10 countries with the high contributions in Granger causality publications.
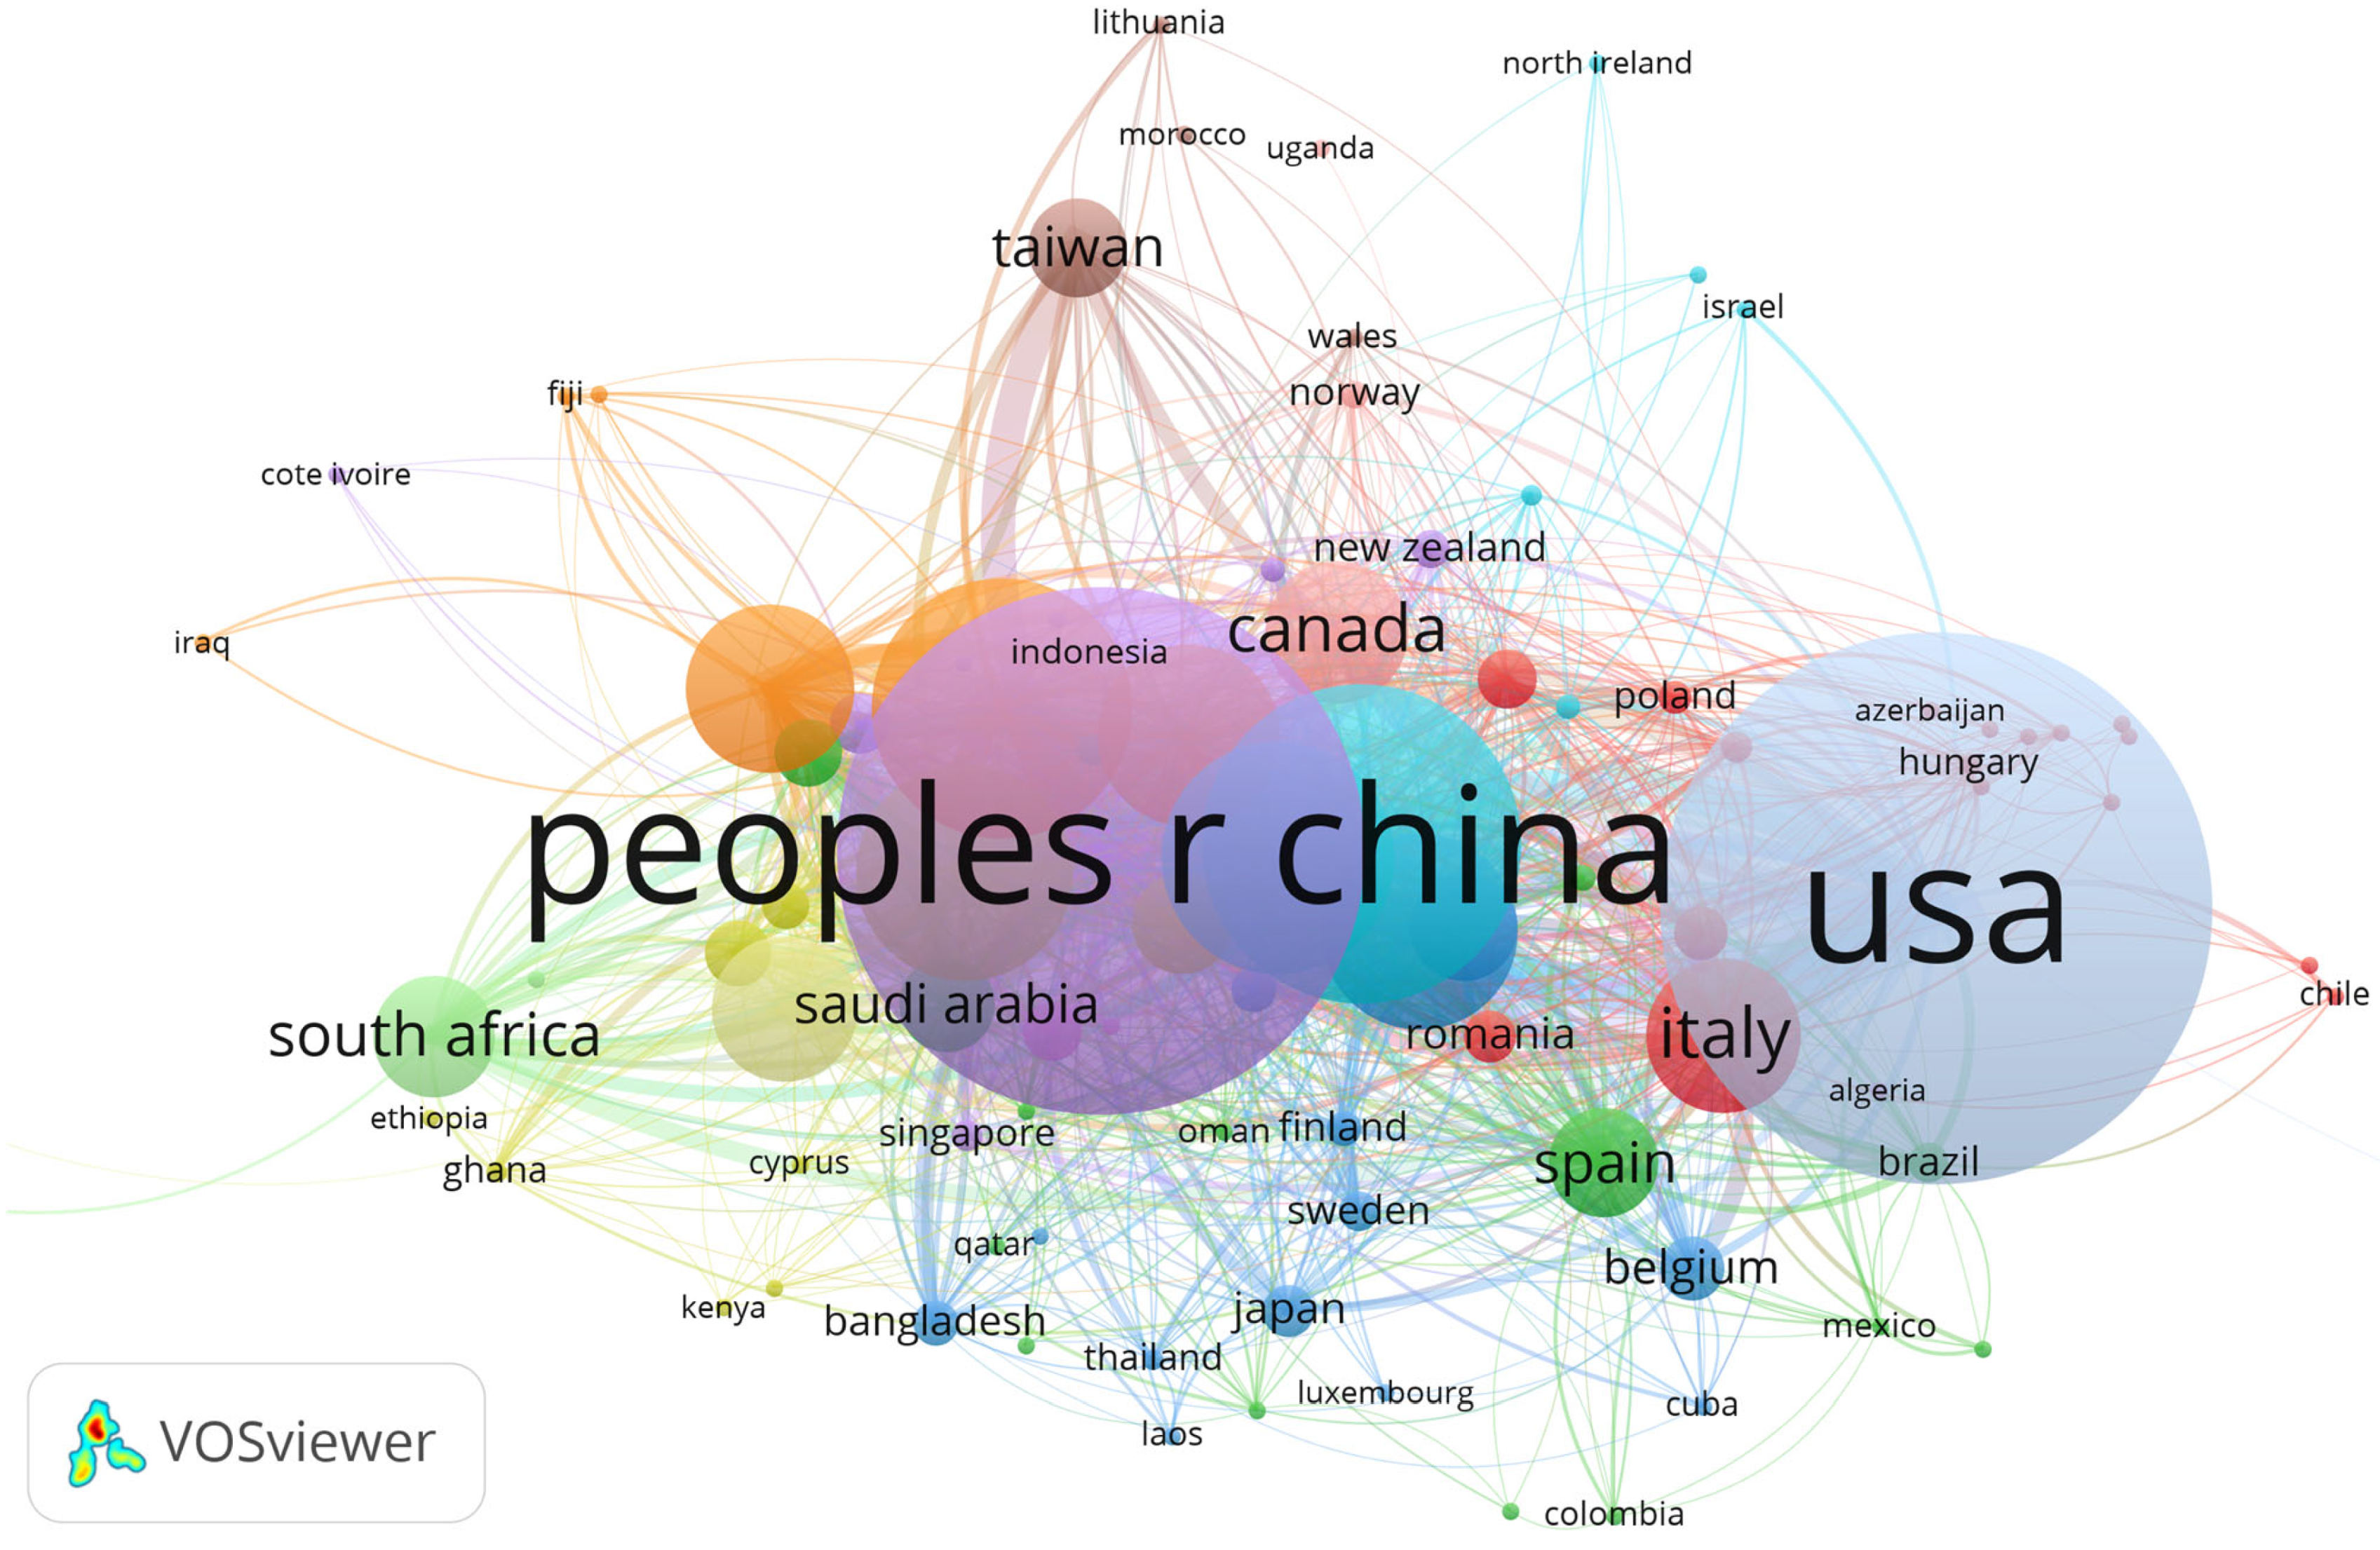
The country co-authorship diagram generated by VOSviewer shows the synergy of research collaboration among countries. The node size in the country co-authorship diagram reflects the strength of co-authorship. That is, when a country has high co-authorship with other countries, the node of the country will be large [110]. The colour of the node and line show the country cluster [111]. The thickness of the line connecting the two nodes indicates the co-authorship link strength. The link strength is the number of publications with co-authorship between two countries. A shorter line also indicates a stronger link [112]. The total link strength of a country reflects the co-authorship strength of the country with all other countries [113,114].
Table 6 explains the top 10 countries with the highest number of co-authorships. The United States had the highest total link strength of 1454 documents from their total of 2113 publications, followed by China (1386), England (840), Pakistan (686), France (617), Turkey (572), Germany (515), Australia (487), Malaysia (444), and Italy (409). This means that the United States had the highest number of collaboration with other countries.
Figure 3 depicts the country co-authorship diagram of Granger causality publications. The United States had the largest node followed by China because these two countries have high total link strengths with 1454 and 1386 documents, respectively. The largest link strength of 292 was between the United States and China. This means that the United States and China had the highest number of co-authorships between countries and the line between them is the thickest. China and Pakistan had the second highest link strength of 188, followed by the United States and England (102), the United States and Germany (100), China and England (93), and China and Taiwan (86).
There were 13 clusters in total. The first cluster is in bright red and made up of Argentina, Azerbaijan, Bosnia and Herzegovina, Chile, Croatia, Czech Republic, Greece, Hungary, Italy, Macedonia, Poland, Romania, Serbia, Slovakia, Slovenia, Switzerland, and Ukraine. The second cluster is dark green and consists of Bahrain, Brazil, Columbia, Ecuador, Egypt, Jordan, Mexico, Oman, Portugal, Qatar, Saudi Arabia, Spain, Tunisia, and Uruguay. The third cluster is dark blue and contains Bangladesh, Belgium, Cuba, Finland, Germany, Japan, Laos, Luxembourg, Netherlands, Scotland, Sweden, Thailand, and Uzbekistan. The fourth cluster is a dark yellow with Cameroon, Cyprus, Ethiopia, Ghana, Kenya, Nigeria, Russia, Turkey, and Vietnam. The fifth cluster is dark purple and made up of Côte d’Ivoire, Indonesia, Iran, Kazakhstan, New Zealand, China, Philippines, Singapore, and South Korea. The sixth cluster is in bright blue with Denmark, England, France, Ireland, Israel, Lebanon, North Ireland, and Sri Lanka. The seventh cluster (orange) consists of Australia, Bulgaria, Fiji, Iraq, Malaysia, and Pakistan. The brown cluster contains Latvia, Lithuania, Morocco, Taiwan, and Wales. Algeria, Austria, Kuwait, and the United Arab Emirates make up the light purple-pink cluster. Canada, Norway, and Uganda are in the light red cluster. Brunei, South Africa, and Zimbabwe are in the light green cluster. The United States and Barbados are in one cluster. India and Peru make up one cluster.

4.4. Journals

There are about 200 journals that have published documents on Granger causality. Table 7 displays the top 10 journals of Granger causality publications. Clarivate Analytics assesses the importance of a journal by measuring the frequency an average document in a journal is cited in a year with the use of Journal Impact Factor (JIF). Journals in the Science Citation Index Expanded (SCIE) and Social Sciences Citation Index (SSCI) have JIFs. JIFs can be used to compare journals within the same field. A JIF is defined as the average number of citations obtained per document published in the journal in the past two years [115]. For example, the JIF 2021 for the journal Renewable & Sustainable Energy Reviews was 16.799. This means that the average number of citations received in 2021 for the documents published in this journal in 2019 and 2020 was 16.799 [116].
The Journal Citation Index (JCI), which is also computed by Clarivate Analytics, offers a single journal level index to compare journals across all fields. All the journals in the Web of Science database have a JCI even though some of the journals do not have a JIF [117]. For JCI 2021, the analysed years are 2018, 2019, and 2020. The global baseline value is 1.00. Therefore, a JCI higher than 1.00 indicates a higher than average citation impact while a JCI lower than 1.00 indicates a lower than average citation impact. For example, Energy Economics received a JCI 2021 of 3.05. This means that, across this journal, the published documents received 3.05 times more citations than the average in the field [118].
CiteScore is a measurement of the journal impact factor by the Scopus database. CiteScore includes document types such as articles, conference papers, book chapters, and data papers. CiteScore is calculated by using the number of citations obtained by a journal in a year to the number of documents published in the last four years, divided by the total document listed in the Scopus database during those four years [119]. For example, Renewable & Sustainable Energy Reviews has a CiteScore 2021 of 28.5. This means that, the average number of citations obtained in 2021 for the documents published in 2017, 2018, 2019, and 2020 was 28.5 [120].
The SCImago Journal Rank (SJR) evaluates journals indexed in the Scopus database by assigning weights to the citations with regard to the journal’s importance. Therefore, citations in highly impactful journals receive greater weights that citations in less important journals. SJR is the average number of weighted citations obtained during a year per paper published in the past three years. For example, the SJR 2021 for Renewable & Sustainable Energy Reviews was 3.678. Documents published in 2018, 2019, and 2020 in this journal obtained 3.678 weighted citations during 2021. This value also shows that Renewable & Sustainable Energy Reviews has high prestige [121].
The Source Normalized Impact per Paper (SNIP) examines the citation impact by calculating the weighted citations with regard to the total citations in a field. SNIP considers field-specific variation in citations. In a field where a citation is less probable, the impact of the citation will be assigned a greater weight. Likewise, where the citation potential is high in the field, the impact of the citation will be lower [122,123]. Based on Table 7, Environmental Science and Pollution Research (260) published the most documents on Granger causality, followed by Energy Economics (174), Applied Economics (156), Neuroimage (154), Sustainability (150), PLoS One (118), Applied Economics Letters (113), Economic Modelling (111), Resources Policy (107), and Renewable & Sustainable Energy Reviews (103).

4.5. Most Cited Publication

Table 8 reveals the top 10 most cited publications on Granger causality. The most cited document “Saliency, switching, attention and control: a network model of insula function” by Menon and Uddin [92] received 2603 citations. This paper presented a network model that the insula is sensitive to salient events and its core function is to mark such events for extra processing and initiate appropriate control signals. The second most cited document “Elements of Causal Inference: Foundations and Learning Algorithms” by Peters et al. [93] studied the concept of causality and related problems. The third most cited paper by Friston [75] reviewed the development and practice of connectivity analyses in neuroimaging, functional connectivity, causal modelling, connectomics, and multivariate analyses of distributed patterns of brain responses. Sridharan et al. [94] used functional magnetic resonance imaging to study the mechanisms underlying the switching of brain networks in experiments. The next most cited paper by Bollen et al. [76] applied a Granger causality analysis and fuzzy neural network to investigate the hypothesis that public mood states are predictive of changes in Dow Jones Industrial Average (DJIA) closing values. The result showed that the accuracy of DJIA predictions can be significantly improved by the inclusion of specific public mood dimensions.
The sixth most cited paper by Smith et al. [77] studied the comparison among connectivity estimation approaches by using simulated FMRI data. The seventh most cited paper by Baccala and Sameshima [95] presented a new frequency-domain approach based on the concept of Granger causality to describe the relationships between multivariate time series based on the decomposition of multivariate partial coherences determined from multivariate autoregressive models. The next most cited paper by Nolte et al. [96] presented an approach that is insensitive to false connectivity arising from volume conduction for interpreting EEG data in terms of brain connectivity. Roelstraete and Rosseel [13] introduced a functional integration analysis in an R (FIAR) package to perform various techniques for studying integration in brain networks. Sugihara et al. [97] proposed a method based on nonlinear state space reconstruction which can distinguish causality from correlation.
The co-citation analysis of cited references shows the prestigious documents which are frequently cited together from another document [130]. Figure 4 shows the co-citation analysis of cited references on Granger causality. The papers by Granger [1] and Engle and Granger [131] were cited 683 times in the 11701 documents on Granger causality. These two papers also have the highest link strengths of 16100 and 11346, respectively. The papers by Engle and Granger [131] and Johansen and Juselius [132] also have a high co-citation with a link strength of 675. The papers by Phillips and Perron [133] and Dickey and Fuller [134] also have high co-citation with a link strength of 652. Another set of papers with high co-citation and link strength of 587 are by Granger [1] and Dickey and Fuller [134]. The papers by Engle and Granger [131] and Dickey and Fuller [134] were also highly co-cited together with a link strength of 571. The papers by Granger [1] and Geweke [8] were also frequently cited together in other documents with a link strength of 507. The papers by Phillips and Perron [133], Dickey and Fuller [134], and Johansen and Juselius [132] also have high link strengths of 7666, 7488, and 6726, respectively.
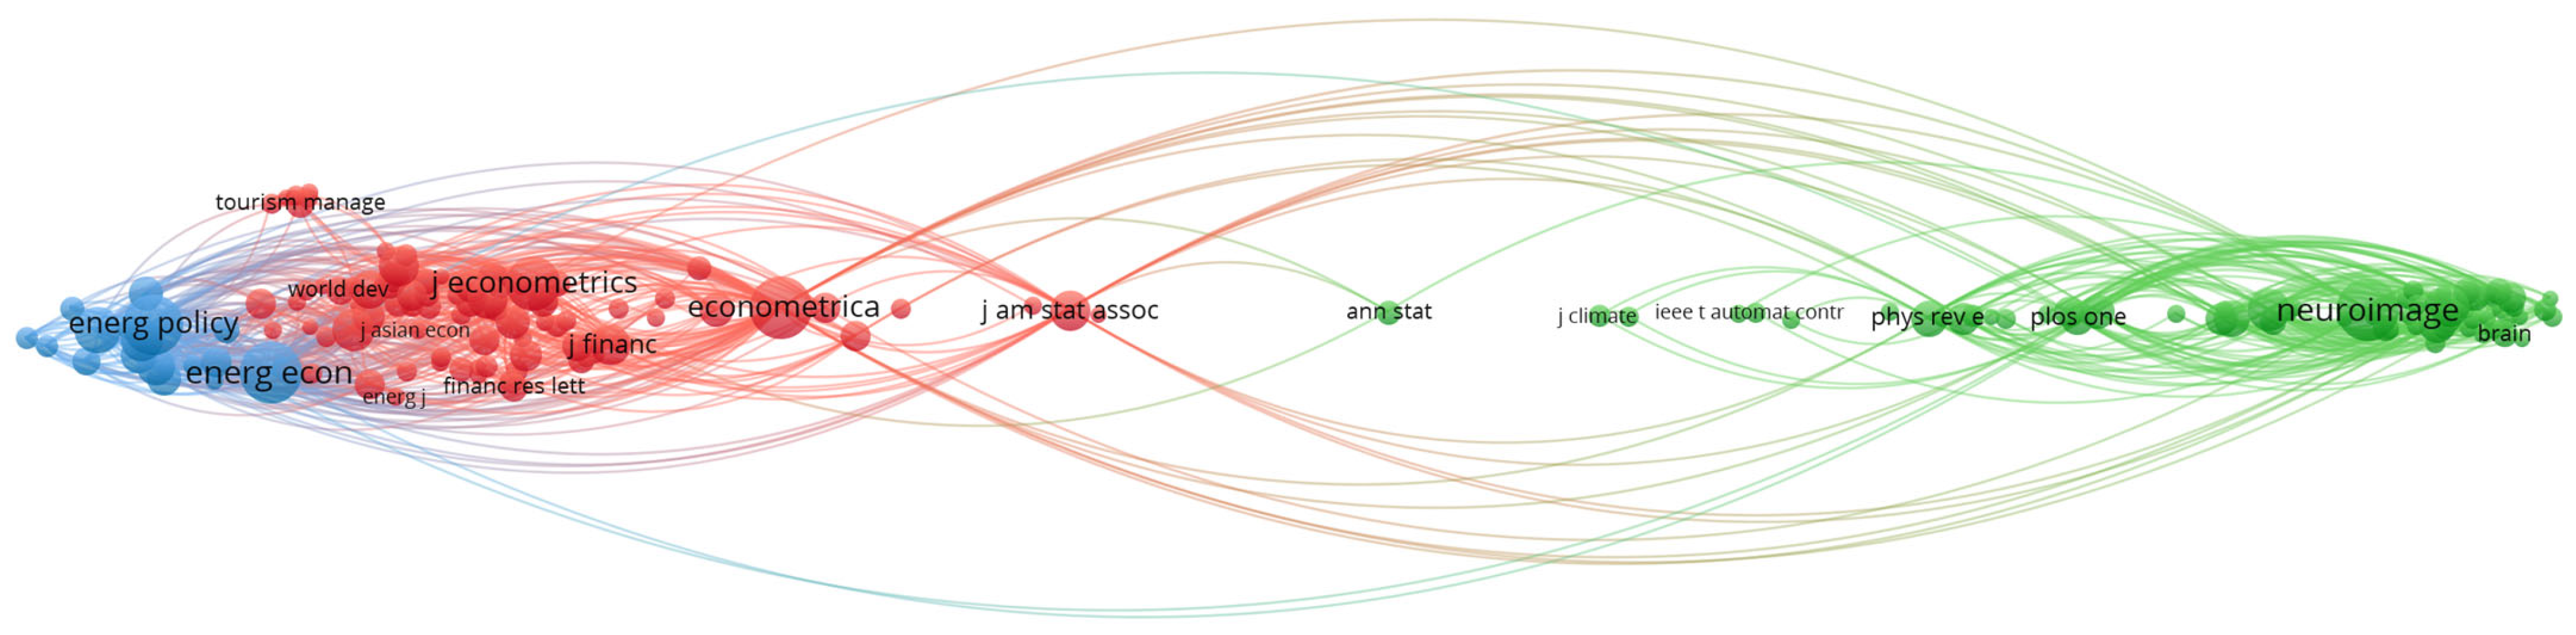
The co-citation of cited sources was also performed using VOSviewer and is shown in Figure 5. Energy Economics has the highest total link strength of 545250, followed by NeuroImage (517050), and Energy Policy (505603). Econometrica (332271), Renewable & Sustainable Energy Reviews (294434), Journal of Econometrics (274903), Journal of Neuroscience (207006), Proceedings of the National Academy of Sciences (202995), Environmental Science and Pollution Research (199643), and Energy (192916) also have high total link strengths.
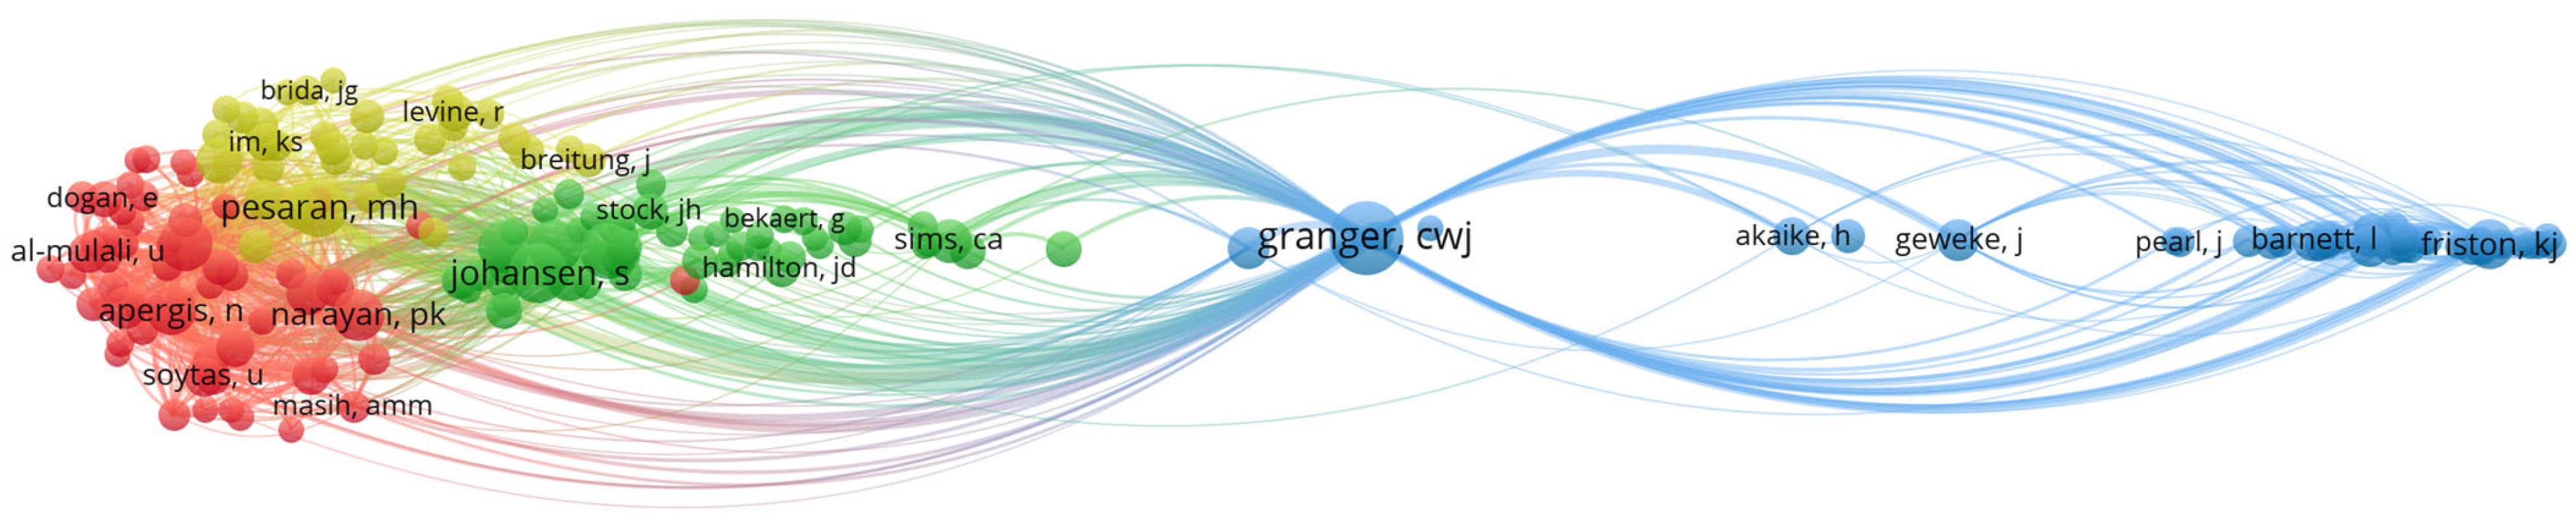
The co-citation analysis of cited authors shows the main contributors in the field of Granger causality [130]. The top 10 co-cited researchers are Granger, C.W.J. (6762 citations, 61075 total link strength), Shahbaz, M. (2369 citations, 54951 total link strength), Pesaran, M.H. (3394 citations, 53148 total link strength), Apergis, N. (1867 citations, 46640 total link strength), Narayan, P.K. (2046 citations, 42402 total link strength), Johansen, S. (3296 citations, 41108 total link strength), Engle, R.F. (2548 citations, 31723 total link strength), Phillips, P.C.B. (1888 citations, 28485 total link strength), Ozturk, I. (1019 citations, 27371 total link strength), and Dickey, D.A. (2175 citations, 26510 total link strength). Figure 6 portrays the co-citation analysis of the cited authors in Granger causality publications.

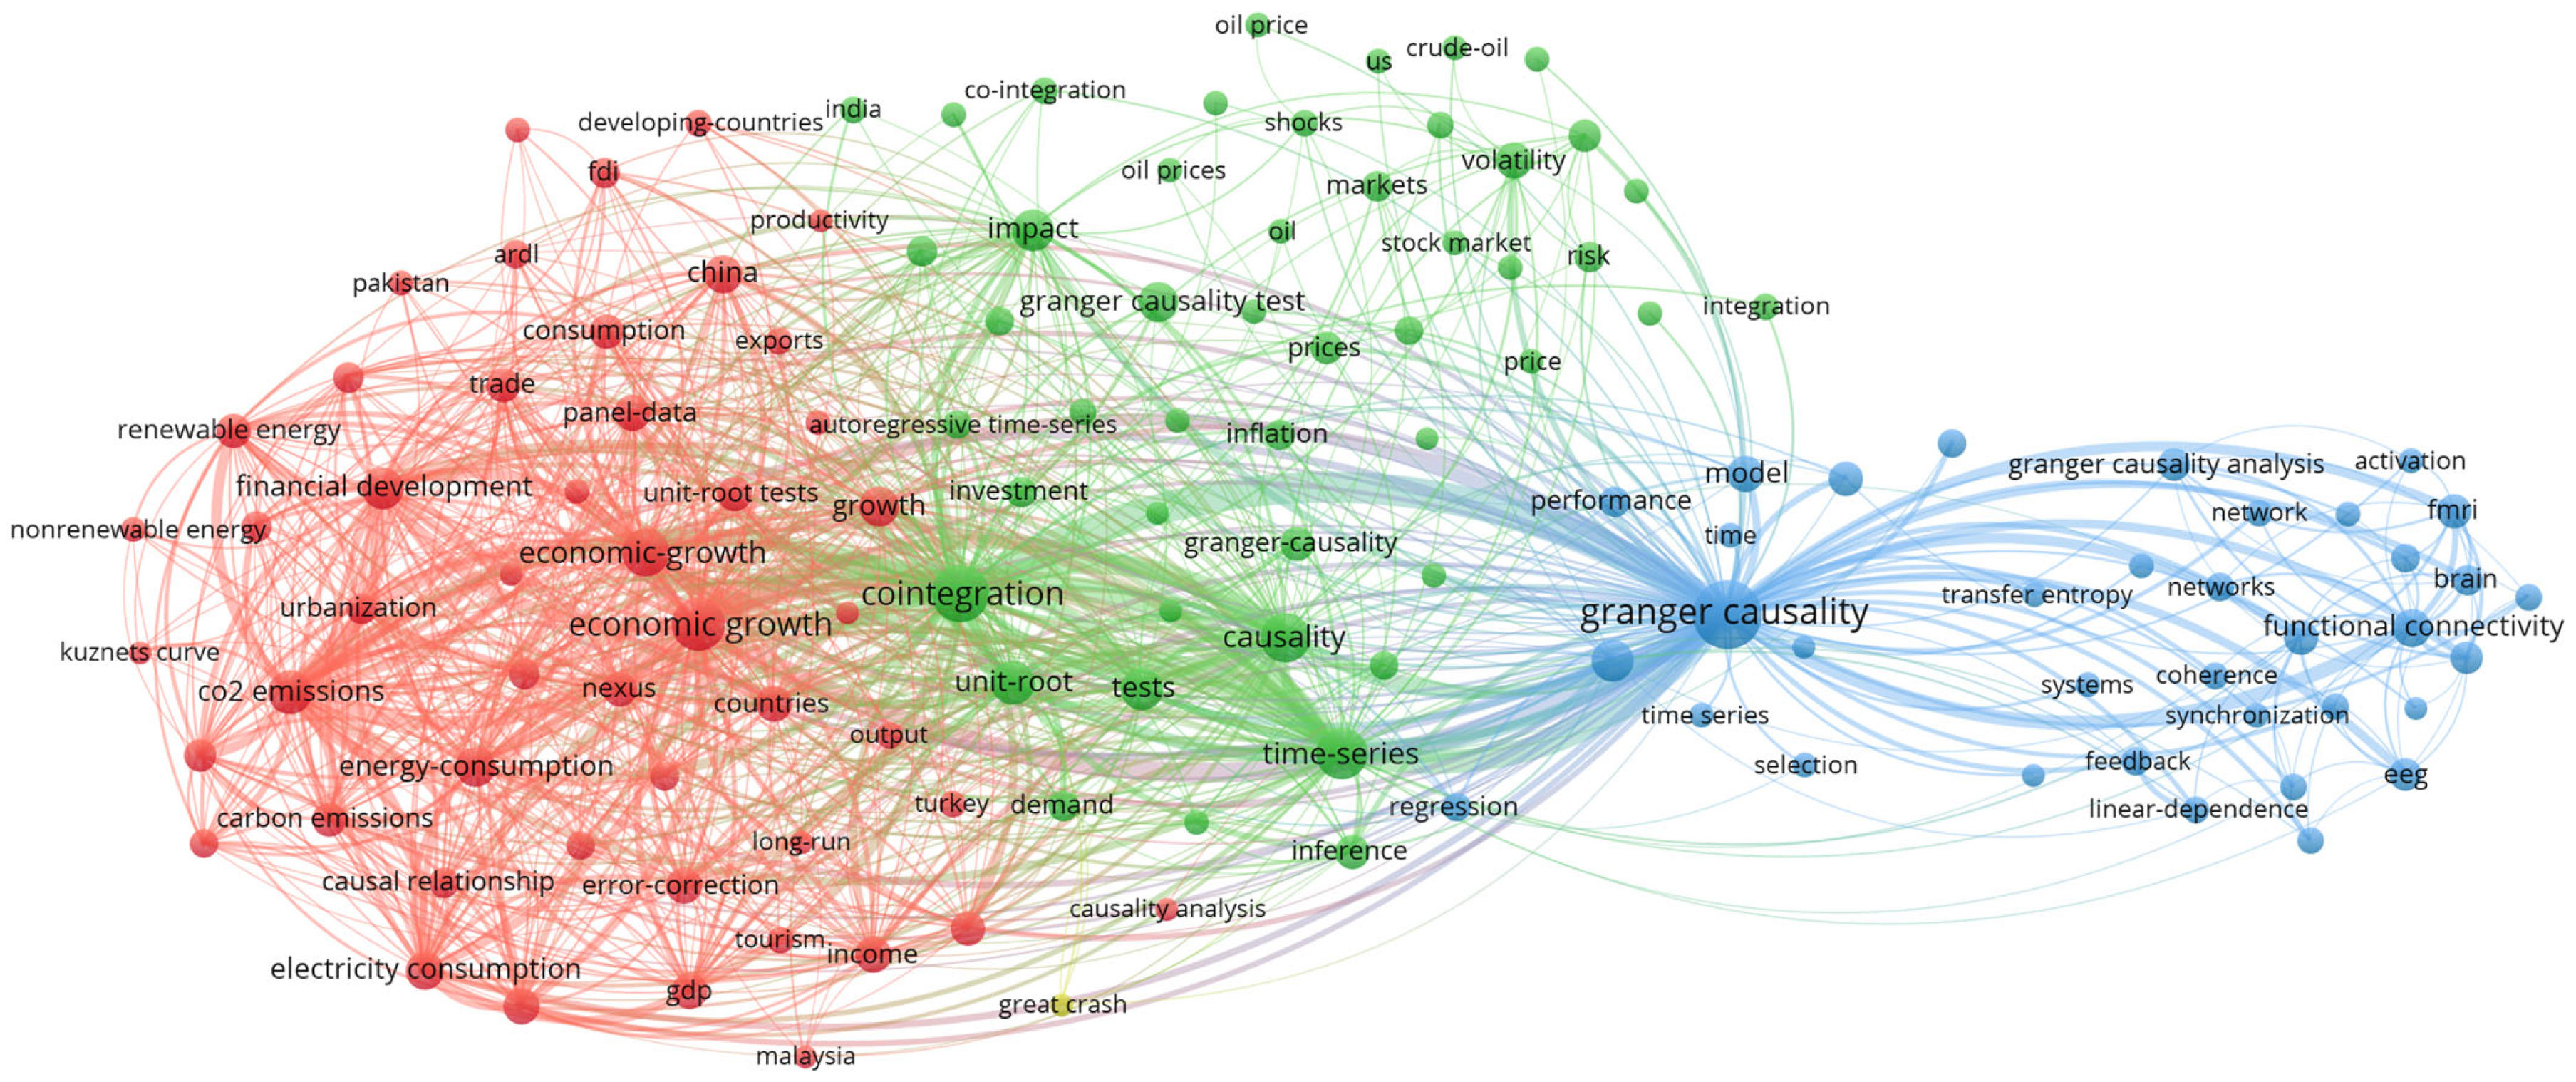
4.6. Keyword Analysis

VOSviewer also provides the keyword co-occurrence map to study the relationships between the keywords to allow scholars to determine the key ideas and the linkage of these key ideas in creating a sub-field for current and future research trends [135,136]. Table 9 shows the top 10 keywords with the respective total link strengths in Granger causality. “Granger causality” occurred 3963 times in all the 11,701 documents with a total link strength of 12,891, followed by “cointegration” (2128 occurrences, 11,166 total link strength) and economic growth (1590 occurrences, 8321 total link strength). Figure 7 depicts the keyword co-occurrence map of the Granger causality publications.
Based on Figure 7, the keywords can be classified into four clusters. The first cluster is red and consists of autoregressive distributed lag (ARDL), carbon emissions, causal relationship, causality analysis, China, economic growth, energy consumption, environmental Kuznets curve (EKC), error correction, exports, foreign direct investment (FDI), financial development, gross domestic product (GDP), globalization, hypothesis, income, Malaysia, non-renewable energy, OECD countries, panel cointegration, panel data, tourism, trade, Turkey, unit root tests, and urbanization. The second cluster, which is green, is made up of autoregressive time series, COVID-19, crude oil, dependence, determinants, efficiency, energy, exchange rate, granger causality, impact, India, inference, inflation, investment, market, monetary policy, oil price, return, risk, stock market, stock returns, transmission, unemployment, United States, vector autoregressive (VAR) model, vector error correction model (VECM), vector autoregressions, and volatility. The third cluster is blue and contains activation, brain, coherence, cortex, dynamics, EEG, effective connectivity, feedback, fMRI, functional connectivity, information flow, oscillations, prefrontal cortex, synchronization, and transfer entropy. The final cluster is in yellow and consists of great crash.
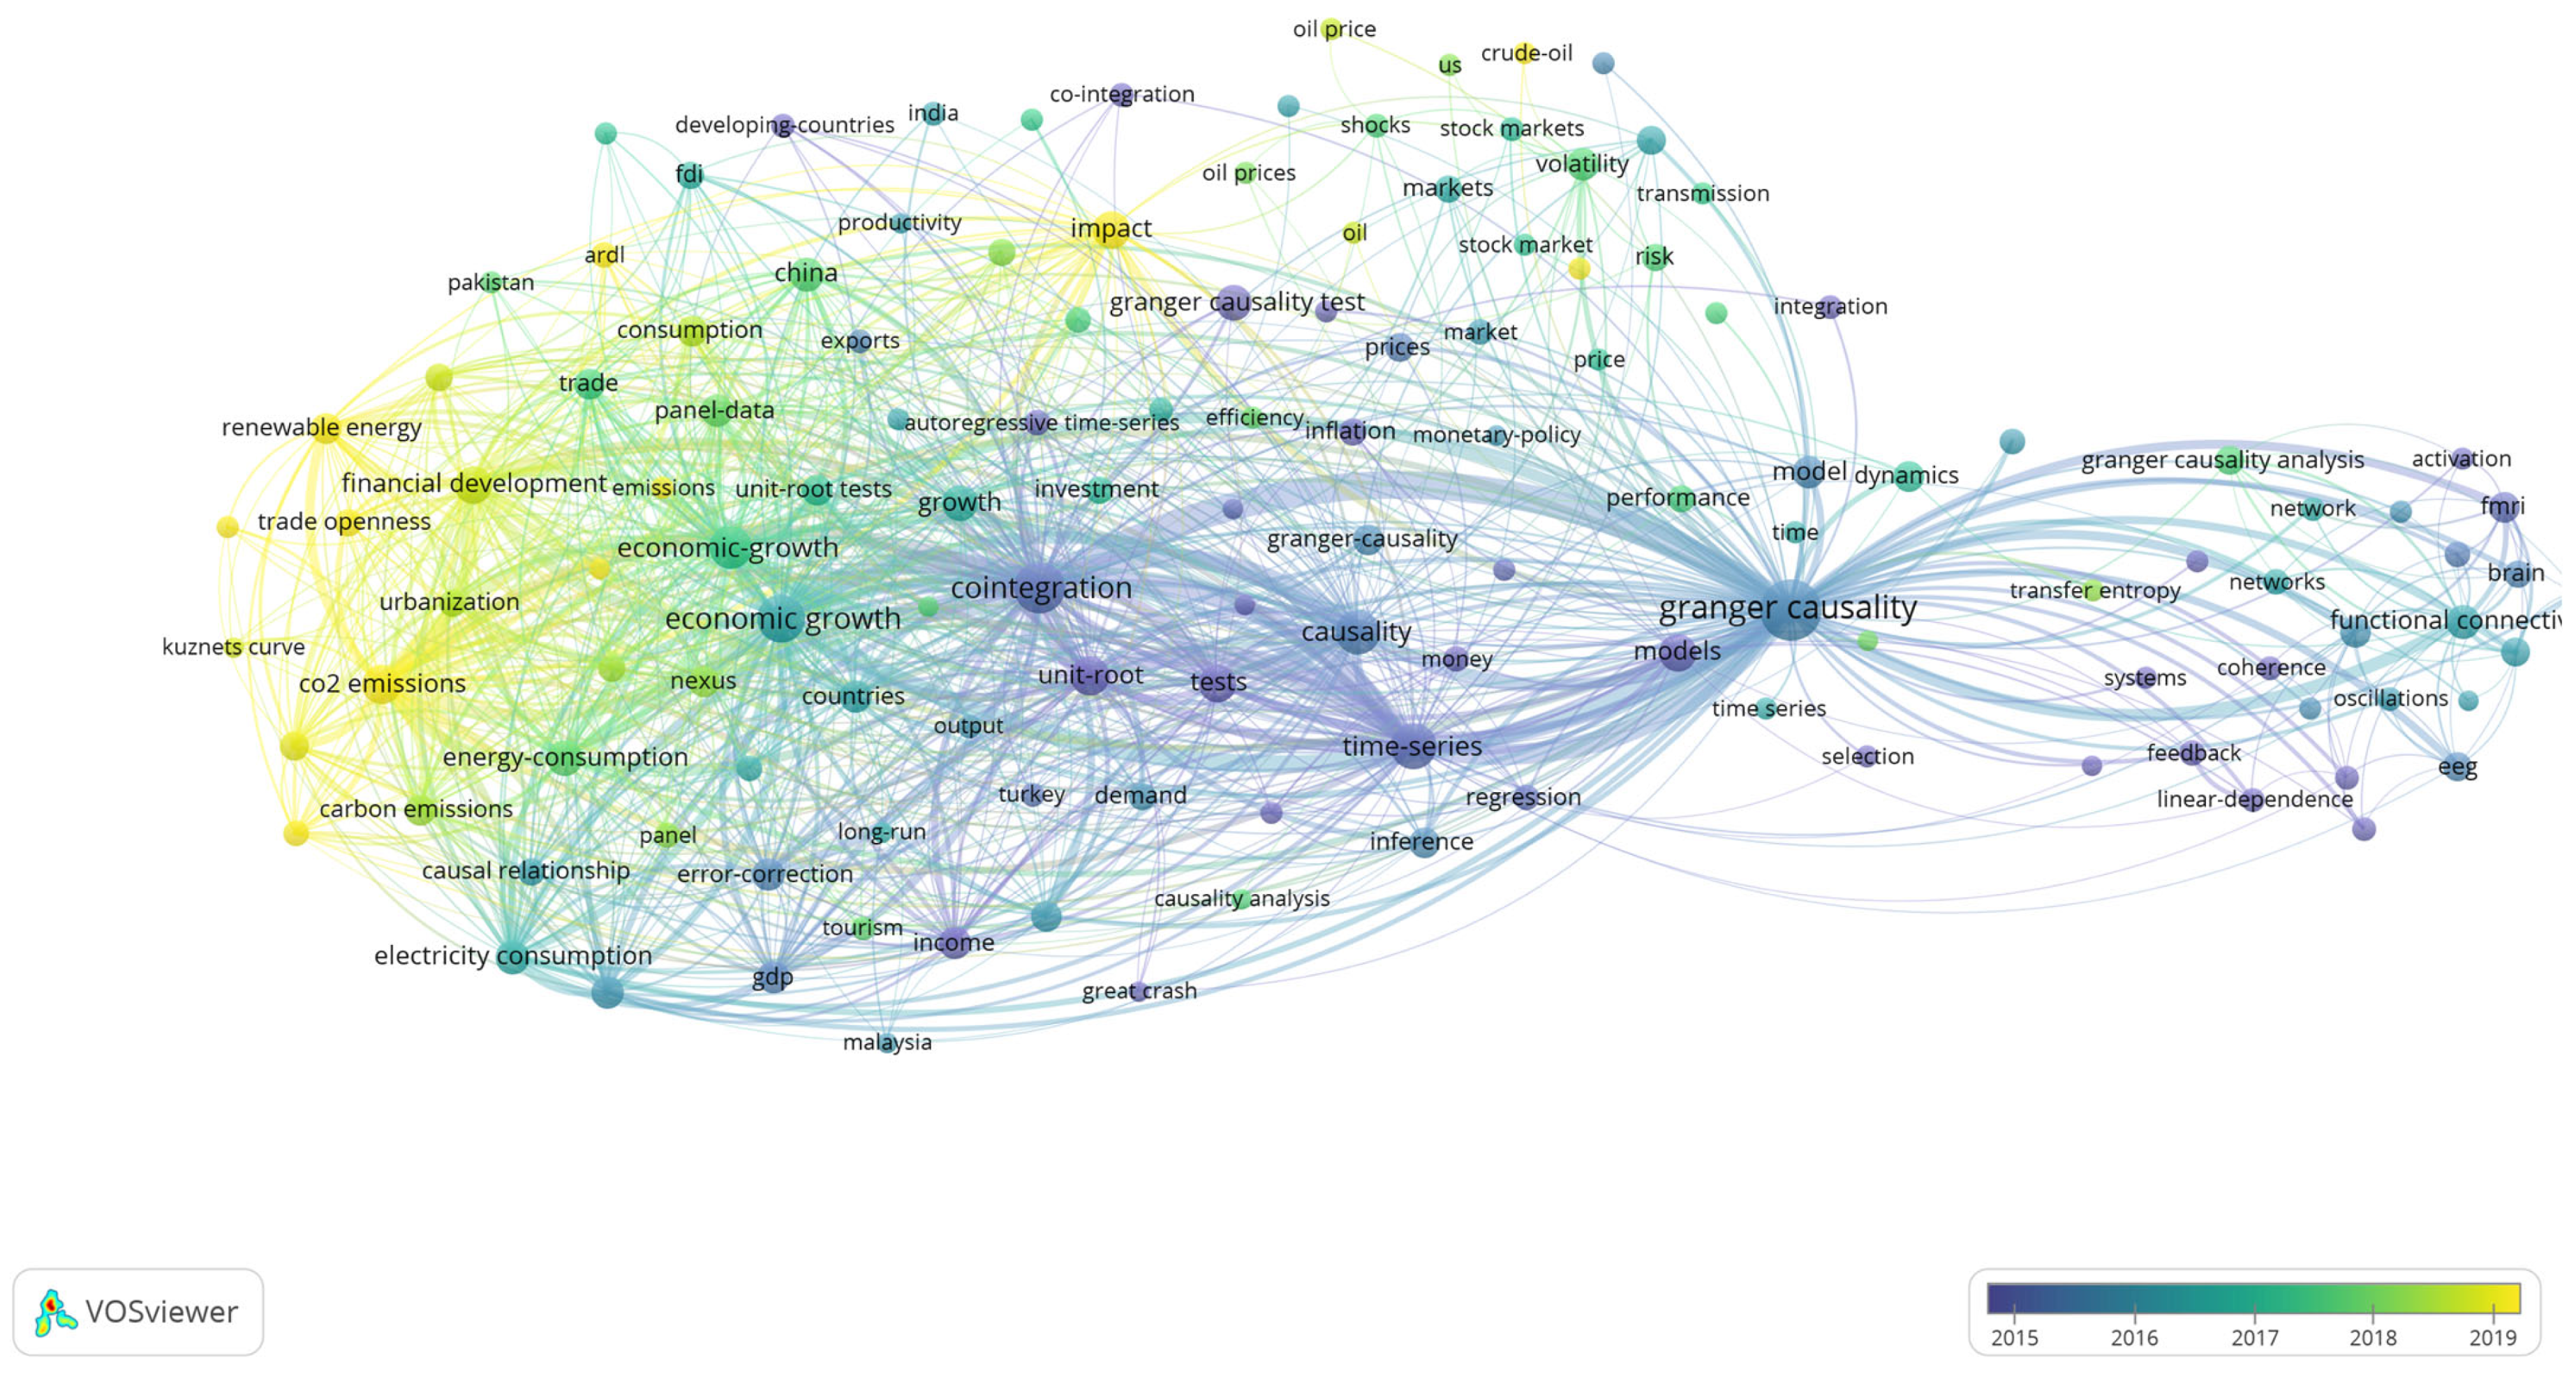
The keyword overlay visualization map in Figure 8 explains the trend of Granger causality publications over time. The colour of the node and line represent the year of the documents contained the keywords were published. A lighter colour of the node and line show the recent focus of keywords in Granger causality [137]. The recent research in Granger causality focused on renewable energy, non-renewable energy, trade openness, carbon emissions, ARDL, EKC, and globalization. This shows that Granger causality is increasingly being applied to study environmental science, energy, and economics. The current trend in Granger causality also shows that many studies are involved in two or more research areas to broaden the application of Granger causality. Moreover, many current studies have focused on green and sustainability in their papers, such as in business, energy, and transportation. For example, nuclear energy and renewable energy have been studied to assess their impacts on the ecological quality in the United States [138], economic sustainability has been studied together with green resources, digitization, and financial development in Vietnam [139] while energy consumption has also been investigated together with tourist arrivals in the Middle East [140].

4.7. Citation Metrics

Citation metrics of the 11,701 documents of Granger causality publications from 1981 to 2023 as of 14 February 2023 have been extracted from Harzing’s Publish or Perish software and presented in Table 10. A total of 274,321 citations were received from the 11,701 documents with an h-index of 209 and g-index of 330.

5. Conclusions

The objective of this paper was to conduct a bibliometric analysis of Granger causality publications indexed in the Web of Science database from 1981 to 2023 as of 14 February 2023. The bibliometric analysis of Granger causality provided a comprehensive overview of the publication trends, research impact, and emerging trends in the various research areas. The first paper indexed in 1981 is titled “Granger-causality in multiple time series” by TjØstheim [103]. The highest number of publications was in 2022 with 1150 documents. The highest total citation was recorded in 2011 with 22709 citations. The most frequently cited paper was “Saliency, switching, attention and control: a network model of insula function” by Menon and Uddin [124] which was published in 2010 and has received 2603 total citations to date.
Most of the publications are articles and proceeding papers. The application of Granger causality can be found mostly in the top three subject areas which are business economics, environmental science and ecology, and neurosciences/neurology. China had the highest number of publication and number of cited papers. However, China’s publication impact was low compared to England, Malaysia, the United States, Turkey, Pakistan, Australia, Germany, and Italy. The United States had the highest total number of citations while England has the highest number of citations per paper and citations per cited paper. The top journal that published Granger causality documents was Environmental Science and Pollution Research by Springer Heidelberg with 260 total publication, 7631 total citations, and a JIF 2021 of 5.190.
The country co-authorship map found that the United States and China had the highest international coloration among researchers in Granger causality publications. The paper “Investigating Causal Relations by Econometric Models and Cross-Spectral Methods” by Granger [1] was the highest co-cited reference. The highest co-cited source was Energy Economics. The top three co-cited researchers were Granger, C.W.J., Shahbaz, M., and Pesaran, M.H. The most used keyword was “Granger causality”. The current focus of Granger causality research is on environmental science, energy, and economics. This study has a few limitations. Firstly, this study mainly focuses on the Web of Science database. Therefore, future studies may consider other databases for a bibliometric analysis of Granger causality. Secondly, the Web of Science database is continuously updating the new publications from time to time. Hence, a bibliometric analysis of Granger causality may be revisited in the future.

Author Contributions

Conceptualization, W.S.L., W.H.L. and S.H.J.; methodology, W.S.L., W.H.L. and P.F.L.; software, P.F.L.; validation, W.S.L., W.H.L. and S.H.J.; formal analysis, W.S.L., W.H.L., S.H.J. and P.F.L.; investigation, W.S.L., W.H.L. and P.F.L.; resources, W.S.L., W.H.L. and S.H.J.; data curation, W.S.L., W.H.L. and P.F.L.; writing—original draft preparation, W.S.L., W.H.L., S.H.J. and P.F.L.; writing—review and editing, W.S.L., W.H.L., S.H.J. and P.F.L.; visualization, W.S.L., W.H.L., S.H.J. and P.F.L.; supervision, W.S.L., W.H.L. and S.H.J.; project administration, W.S.L., W.H.L. and S.H.J.; funding acquisition, S.H.J. All authors have read and agreed to the published version of the manuscript.

Funding

This research was funded by research grants provided by Universiti Kebangsaan Malaysia (GUP-2019-038 and GP-2021-K006416).

Data Availability Statement

The data presented in this study are available on request from the corresponding author.

Acknowledgments

This research was supported by the Universiti Kebangsaan Malaysia and Universiti Tunku Abdul Rahman, Malaysia.

Conflicts of Interest

The authors declare no conflict of interest.

References

  1. Granger, C.W.J. Investigating Causal Relations by Econometric Models and Cross-Spectral Methods. Econometrica 1969, 37, 424–438. [Google Scholar] [CrossRef]
  2. Granger, C.W.J. Testing for Causality: A Personal Viewpoint. J. Econ. Dyn. Control 1980, 2, 329–352. [Google Scholar] [CrossRef]
  3. Wijesekara, C.; Tittagalla, C.; Jayathilaka, A.; Ilukpotha, U.; Jayathilaka, R.; Jayasinghe, P. Tourism and Economic Growth: A Global Study on Granger Causality and Wavelet Coherence. PLoS ONE 2022, 17, e0274386. [Google Scholar] [CrossRef] [PubMed]
  4. Stokes, P.A.; Purdon, P.L. A Study of Problems Encountered in Granger Causality Analysis from a Neuroscience Perspective. Proc. Natl. Acad. Sci. USA 2017, 114, E7063–E7072. [Google Scholar] [CrossRef] [Green Version]
  5. Chvosteková, M.; Jakubík, J.; Krakovská, A. Granger Causality on Forward and Reversed Time Series. Entropy 2021, 23, 409. [Google Scholar] [CrossRef]
  6. Kirchgässner, G.; Wolters, J. Granger Causality. In Introduction to Modern Time Series Analysis; Kirchgässner, G., Wolters, J., Eds.; Springer: Berlin/Heidelberg, Germany, 2007; pp. 93–123. ISBN 978-3-540-73291-4. [Google Scholar]
  7. Schreiber, T. Measuring Information Transfer. Phys. Rev. Lett. 2000, 85, 461–464. [Google Scholar] [CrossRef] [Green Version]
  8. Geweke, J. Measurement of Linear Dependence and Feedback between Multiple Time Series. J. Am. Stat. Assoc. 1982, 77, 304–313. [Google Scholar] [CrossRef]
  9. Barnett, L.; Seth, A.K. The MVGC Multivariate Granger Causality Toolbox: A New Approach to Granger-Causal Inference. J. Neurosci. Methods 2014, 223, 50–68. [Google Scholar] [CrossRef] [Green Version]
  10. Seth, A.K.; Barrett, A.B.; Barnett, L. Granger Causality Analysis in Neuroscience and Neuroimaging. J. Neurosci. 2015, 35, 3293–3297. [Google Scholar] [CrossRef]
  11. Wu, G.-R.; Liao, W.; Stramaglia, S.; Ding, J.-R.; Chen, H.; Marinazzo, D. A Blind Deconvolution Approach to Recover Effective Connectivity Brain Networks from Resting State FMRI Data. Med. Image Anal. 2013, 17, 365–374. [Google Scholar] [CrossRef] [Green Version]
  12. Roebroeck, A.; Formisano, E.; Goebel, R. Mapping Directed Influence over the Brain Using Granger Causality and FMRI. NeuroImage 2005, 25, 230–242. [Google Scholar] [CrossRef] [Green Version]
  13. Roelstraete, B.; Rosseel, Y. FIAR: An R Package for Analyzing Functional Integration in the Brain. J. Stat. Softw. 2011, 44, 1–32. [Google Scholar] [CrossRef] [Green Version]
  14. Soleimani, B.; Das, P.; Karunathilake, I.M.D.; Kuchinsky, S.E.; Simon, J.Z.; Babadi, B. NLGC: Network Localized Granger Causality with Application to MEG Directional Functional Connectivity Analysis. Neuroimage 2022, 260, 119496. [Google Scholar] [CrossRef]
  15. Gao, L.; Sommerlade, L.; Coffman, B.; Zhang, T.; Stephen, J.M.; Li, D.; Wang, J.; Grebogi, C.; Schelter, B. Granger Causal Time-Dependent Source Connectivity in the Somatosensory Network. Sci. Rep. 2015, 5, 10399. [Google Scholar] [CrossRef] [Green Version]
  16. Gow, D.W.; Segawa, J.A.; Ahlfors, S.P.; Lin, F.-H. Lexical Influences on Speech Perception: A Granger Causality Analysis of MEG and EEG Source Estimates. Neuroimage 2008, 43, 614–623. [Google Scholar] [CrossRef] [Green Version]
  17. Cadotte, A.J.; DeMarse, T.B.; Mareci, T.H.; Parekh, M.; Talathi, S.S.; Hwang, D.-U.; Ditto, W.L.; Ding, M.; Carney, P.R. Granger Causality Relationships between Local Field Potentials in an Animal Model of Temporal Lobe Epilepsy. J. Neurosci. Methods 2010, 189, 121–129. [Google Scholar] [CrossRef] [Green Version]
  18. Pesaran, B.; Vinck, M.; Einevoll, G.T.; Sirota, A.; Fries, P.; Siegel, M.; Truccolo, W.; Schroeder, C.E.; Srinivasan, R. Investigating Large-Scale Brain Dynamics Using Field Potential Recordings: Analysis and Interpretation. Nat. Neurosci. 2018, 21, 903–919. [Google Scholar] [CrossRef]
  19. Wang, X.; Yan, J.; Zhang, H.; Yuan, Y. Ultrasonic Thalamic Stimulation Modulates Neural Activity of Thalamus and Motor Cortex in the Mouse. J. Neural. Eng. 2021, 18, 066037. [Google Scholar] [CrossRef]
  20. Abdalbari, H.; Durrani, M.; Pancholi, S.; Patel, N.; Nasuto, S.J.; Nicolaou, N. Brain and Brain-Heart Granger Causality during Wakefulness and Sleep. Front. Neurosci. 2022, 16, 927111. [Google Scholar] [CrossRef]
  21. Hartmann, S.; Ferri, R.; Bruni, O.; Baumert, M. Causality of Cortical and Cardiovascular Activity during Cyclic Alternating Pattern in Non-Rapid Eye Movement Sleep. Philos. Trans. A Math. Phys. Eng. Sci. 2021, 379, 20200248. [Google Scholar] [CrossRef]
  22. Gao, Y.; Wang, X.; Potter, T.; Zhang, J.; Zhang, Y. Single-Trial EEG Emotion Recognition Using Granger Causality/Transfer Entropy Analysis. J. Neurosci. Methods 2020, 346, 108904. [Google Scholar] [CrossRef] [PubMed]
  23. Odhiambo, N.M.; Nyasha, S.; Zerihun, M.F.; Tipoy, C. 3—Financial Development in Africa: Is It Demand-Following or Supply-Leading? In Extending Financial Inclusion in Africa; Makina, D., Ed.; Academic Press: Cambridge, MA, USA, 2019; pp. 37–60. ISBN 978-0-12-814164-9. [Google Scholar]
  24. Boulila, G.; Trabelsi, M. The Causality Issue in the Finance and Growth Nexus: Empirical Evidence from Middle East and North African Countries. Rev. Middle East Econ. Financ. 2004, 2, 123–138. [Google Scholar] [CrossRef] [Green Version]
  25. Amano, M. Finance and Development: Granger-Causality Tests for Prewar and Postwar U.S.A., U.K., and Japan. In Capital Markets, Globalization, and Economic Development; Gup, B.E., Ed.; Innovations in Financial Markets and Institutions; Springer: Boston, MA, USA, 2005; pp. 207–217. ISBN 978-0-387-24563-8. [Google Scholar]
  26. Fahimi, A.; Olasehinde-Williams, G.; Akadiri, S.S. Examining the Causal Relationship between Globalization and Energy Consumption in MINT Countries: Evidence from Bootstrap Panel Granger Causality. Int. J. Financ. Econ. 2021, 26, 1886–1896. [Google Scholar] [CrossRef]
  27. Candelon, B.; Tokpavi, S. A Nonparametric Test for Granger Causality in Distribution With Application to Financial Contagion. J. Bus. Econ. Stat. 2016, 34, 240–253. [Google Scholar] [CrossRef] [Green Version]
  28. Coronado, S.; Martinez, J.N.; Gualajara, V.; Rojas, O. Transfer Entropy Granger Causality between News Indices and Stock Markets in U.S. and Latin America during the COVID-19 Pandemic. Entropy 2022, 24, 1420. [Google Scholar] [CrossRef]
  29. Zuhud, D.A.Z.; Musa, M.H.; Ismail, M.; Bahaludin, H.; Razak, F.A. The Causality and Uncertainty of the COVID-19 Pandemic to Bursa Malaysia Financial Services Index’s Constituents. Entropy 2022, 24, 1100. [Google Scholar] [CrossRef]
  30. Bisht, K.; Kumar, A. A Portfolio Construction Model Based on Sector Analysis Using Dempster-Shafer Evidence Theory and Granger Causal Network: An Application to National Stock Exchange of India. Expert Syst. Appl. 2023, 215, 119434. [Google Scholar] [CrossRef]
  31. Ranco, G.; Aleksovski, D.; Caldarelli, G.; Grčar, M.; Mozetič, I. The Effects of Twitter Sentiment on Stock Price Returns. PLoS ONE 2015, 10, e0138441. [Google Scholar] [CrossRef] [Green Version]
  32. Hamraoui, I.; Boubaker, A. Impact of Twitter Sentiment on Stock Price Returns. Soc. Netw. Anal. Min. 2022, 12, 28. [Google Scholar] [CrossRef]
  33. Pao, H.-T.; Tsai, C.-M. Multivariate Granger Causality between CO2 Emissions, Energy Consumption, FDI (Foreign Direct Investment) and GDP (Gross Domestic Product): Evidence from a Panel of BRIC (Brazil, Russian Federation, India, and China) Countries. Energy 2011, 36, 685–693. [Google Scholar] [CrossRef]
  34. Hiemstra, C.; Jones, J.D. Testing for Linear and Nonlinear Granger Causality in the Stock Price- Volume Relation. J. Financ. 1994, 49, 1639–1664. [Google Scholar] [CrossRef]
  35. Soytas, U.; Sari, R. Energy Consumption, Economic Growth, and Carbon Emissions: Challenges Faced by an EU Candidate Member. Ecol. Econ. 2009, 68, 1667–1675. [Google Scholar] [CrossRef]
  36. Borozan, D. Granger Causality and Innovation Accounting Analysis of the Monetary Transmission Mechanism in Croatia. Post Communist Econ. 2011, 23, 517–537. [Google Scholar] [CrossRef]
  37. Smailović, J.; Grčar, M.; Lavrač, N.; Žnidaršič, M. Stream-Based Active Learning for Sentiment Analysis in the Financial Domain. Inf. Sci. 2014, 285, 181–203. [Google Scholar] [CrossRef]
  38. Lee, C.-C.; Chien, M.-S. Structural Breaks, Tourism Development, and Economic Growth: Evidence from Taiwan. Math. Comput. Simul. 2008, 77, 358–368. [Google Scholar] [CrossRef]
  39. Ghosh, S.; Balsalobre-Lorente, D.; Doğan, B.; Paiano, A.; Talbi, B. Modelling an Empirical Framework of the Implications of Tourism and Economic Complexity on Environmental Sustainability in G7 Economies. J. Clean. Prod. 2022, 376, 134281. [Google Scholar] [CrossRef]
  40. Wang, X.; Dong, F. The Dynamic Relationships among Growth in the Logistics Industry, Energy Consumption, and Carbon Emission: Recent Evidence from China. J. Petrol. Explor. Prod. Technol. 2023, 13, 487–502. [Google Scholar] [CrossRef]
  41. Lo, D.; Yau, Y.; McCord, M.; Haran, M. Lead-Lag Relationship between the Price-to-Rent Ratio and the Macroeconomy: An Empirical Study of the Residential Market of Hong Kong. Buildings 2022, 12, 1345. [Google Scholar] [CrossRef]
  42. Deshpande, G.; Wang, P.; Rangaprakash, D.; Wilamowski, B. Fully Connected Cascade Artificial Neural Network Architecture for Attention Deficit Hyperactivity Disorder Classification From Functional Magnetic Resonance Imaging Data. IEEE Trans. Cybern. 2015, 45, 2668–2679. [Google Scholar] [CrossRef]
  43. Li, G.; Qin, S.J.; Yuan, T. Data-Driven Root Cause Diagnosis of Faults in Process Industries. Chemom. Intell. Lab. Syst. 2016, 159, 1–11. [Google Scholar] [CrossRef]
  44. Tan, X.; Liu, Y.; Liu, D.; Zhu, D.; Zeng, W.; Wang, H. An Attention-Based Deep Convolution Network for Mining Airport Delay Propagation Causality. Appl. Sci. 2022, 12, 10433. [Google Scholar] [CrossRef]
  45. Xie, X.; Rosales, H.G. Analysis of Spatial and Temporal Differences in China’s Provincial Tourism Economy Based on Parallel Data Model and IoT Applications. Wirel. Commun. Mob. Comput. 2022, 2022, 1431345. [Google Scholar] [CrossRef]
  46. Almerekhi, H.; Kwak, H.; Jansen, B.J. Investigating Toxicity Changes of Cross-Community Redditors from 2 Billion Posts and Comments. PeerJ Comput. Sci. 2022, 8, e1059. [Google Scholar] [CrossRef] [PubMed]
  47. Tian, Y.; He, J.; Peng, Z.; Guan, Y.; Wu, L. Lithium-Ion Battery Degradation and Capacity Prediction Model Considering Causal Feature. IEEE Trans. Transp. Electrif. 2022, 8, 3630–3647. [Google Scholar] [CrossRef]
  48. Shahandashti, S.; Ashuri, B. Forecasting Engineering News-Record Construction Cost Index Using Multivariate Time Series Models. J. Constr. Eng. Manag. 2013, 139, 1237–1243. [Google Scholar] [CrossRef]
  49. Liu, D.; Niu, D.; Wang, H.; Fan, L. Short-Term Wind Speed Forecasting Using Wavelet Transform and Support Vector Machines Optimized by Genetic Algorithm. Renew. Energy 2014, 62, 592–597. [Google Scholar] [CrossRef]
  50. Su, C.-W.; Yuan, X.; Tao, R.; Umar, M. Can New Energy Vehicles Help to Achieve Carbon Neutrality Targets? J. Environ. Manag. 2021, 297, 113348. [Google Scholar] [CrossRef]
  51. Shahandashti, S.; Ashuri, B. Highway Construction Cost Forecasting Using Vector Error Correction Models. J. Manag. Eng. 2015, 32, 04015040. [Google Scholar] [CrossRef]
  52. Ellegaard, O.; Wallin, J.A. The Bibliometric Analysis of Scholarly Production: How Great Is the Impact? Scientometrics 2015, 105, 1809–1831. [Google Scholar] [CrossRef] [Green Version]
  53. Guiling, Y.; Panatik, S.A.; Sukor, M.S.M.; Rusbadrol, N.; Cunlin, L. Bibliometric Analysis of Global Research on Organizational Citizenship Behavior From 2000 to 2019. SAGE Open 2022, 12, 21582440221079896. [Google Scholar] [CrossRef]
  54. Xiao, Z.; Qin, Y.; Xu, Z.; Antucheviciene, J.; Zavadskas, E.K. The Journal Buildings: A Bibliometric Analysis (2011–2021). Buildings 2022, 12, 37. [Google Scholar] [CrossRef]
  55. Tiberius, V.; Rietz, M.; Bouncken, R.B. Performance Analysis and Science Mapping of Institutional Entrepreneurship Research. Adm. Sci. 2020, 10, 69. [Google Scholar] [CrossRef]
  56. Moral-Muñoz, J.A.; Herrera-Viedma, E.; Santisteban-Espejo, A.; Cobo, M.J. Software Tools for Conducting Bibliometric Analysis in Science: An up-to-Date Review. Prof. Inf. 2020, 29, e290103. [Google Scholar] [CrossRef] [Green Version]
  57. Zhang, Y.; Zhang, S. The Impacts of GDP, Trade Structure, Exchange Rate and FDI Inflows on China’s Carbon Emissions. Energy Policy 2018, 120, 347–353. [Google Scholar] [CrossRef]
  58. Ben Jebli, M.; Ben Youssef, S.; Apergis, N. The Dynamic Linkage between Renewable Energy, Tourism, CO2 Emissions, Economic Growth, Foreign Direct Investment, and Trade. Lat. Amer. Econ. Rev. 2019, 28, 2. [Google Scholar] [CrossRef] [Green Version]
  59. Sunde, T. Foreign Direct Investment, Exports and Economic Growth: ADRL and Causality Analysis for South Africa. Res. Int. Bus. Financ. 2017, 41, 434–444. [Google Scholar] [CrossRef]
  60. Arogundade, S.; Mduduzi, B.; Eita, H. Foreign Direct Investment and Poverty in Sub-Saharan African Countries: The Role of Host Absorptive Capacity. Cogent Econ. Financ. 2022, 10, 2078459. [Google Scholar] [CrossRef]
  61. Farooqi, M.F.; O’Brien, J. A Comparison of the Impact of the Basel Standards upon Islamic and Conventional Bank Risks in the Gulf State Region. J. Islam. Account. Bus. Res. 2019, 10, 216–235. [Google Scholar] [CrossRef]
  62. Setyowati, N. Macroeconomic Determinants of Islamic Banking Products in Indonesia. Economies 2019, 7, 53. [Google Scholar] [CrossRef] [Green Version]
  63. Samad, A. Is There Any Causality between Islamic Banks’ Return on Depositors and Conventional Banks’ Deposit Interest: Evidence of Causality from Bahrain’s Financial Market. Bus. Econ. Horiz. 2018, 14, 894–912. [Google Scholar] [CrossRef] [Green Version]
  64. Sharif, A.; Aloui, C.; Yarovaya, L. COVID-19 Pandemic, Oil Prices, Stock Market, Geopolitical Risk and Policy Uncertainty Nexus in the US Economy: Fresh Evidence from the Wavelet-Based Approach. Int. Rev. Financ. Anal. 2020, 70, 101496. [Google Scholar] [CrossRef]
  65. Wang, G.-J.; Xie, C.; Wen, D.; Zhao, L. When Bitcoin Meets Economic Policy Uncertainty (EPU): Measuring Risk Spillover Effect from EPU to Bitcoin. In Finance Research Letters; Elsevier: Amsterdam, The Netherlands, 2019; Volume 31. [Google Scholar] [CrossRef]
  66. Robiyanto, R.; Nugroho, B.A.; Handriani, E.; Frensidy, B. Measuring the Effectiveness of ASEAN-5 Initiatives from Emerging Market Portfolio’s Perspective. Cogent Bus. Manag. 2023, 10, 2167292. [Google Scholar] [CrossRef]
  67. Athari, S.A.; Bahreini, M. Does Economic Policy Uncertainty Impact Firms’ Capital Structure Policy? Evidence from Western European Economies. Environ. Sci. Pollut. Res. 2022, 30, 37157–37173. [Google Scholar] [CrossRef] [PubMed]
  68. Athari, S.A. Financial Inclusion, Political Risk, and Banking Sector Stability: Evidence from Different Geographical Regions. Econ. Bull. 2022, 42, 99–108. [Google Scholar]
  69. Zafar, M.W.; Zaidi, S.A.H.; Khan, N.R.; Mirza, F.M.; Hou, F.; Kirmani, S.A.A. The Impact of Natural Resources, Human Capital, and Foreign Direct Investment on the Ecological Footprint: The Case of the United States. Resour. Policy 2019, 63, 101428. [Google Scholar] [CrossRef]
  70. Philip, L.D.; Emir, F.; Udemba, E.N. Investigating Possibility of Achieving Sustainable Development Goals through Renewable Energy, Technological Innovation, and Entrepreneur: A Study of Global Best Practice Policies. Environ. Sci. Pollut. Res. 2022, 29, 60302–60313. [Google Scholar] [CrossRef]
  71. Xie, M.; Irfan, M.; Razzaq, A.; Dagar, V. Forest and Mineral Volatility and Economic Performance: Evidence from Frequency Domain Causality Approach for Global Data. Resour. Policy 2022, 76, 102685. [Google Scholar] [CrossRef]
  72. Adebayo, T.S. Environmental Consequences of Fossil Fuel in Spain amidst Renewable Energy Consumption: A New Insights from the Wavelet-Based Granger Causality Approach. Int. J. Sustain. Dev. World Ecol. 2022, 29, 579–592. [Google Scholar] [CrossRef]
  73. Huang, W.; Saydaliev, H.B.; Iqbal, W.; Irfan, M. Measuring the Impact of Economic Policies on Co2 Emissions: Ways to Achieve Green Economic Recovery in the Post-Covid-19 Era. Clim. Change Econ. 2022, 13, 2240010. [Google Scholar] [CrossRef]
  74. Nketiah, E.; Song, H.; Obuobi, B.; Adu-Gyamfi, G.; Adjei, M.; Cudjoe, D. The Impact of Ecological Footprint in West Africa: The Role of Biocapacity and Renewable Energy. Int. J. Sustain. Dev. World Ecol. 2022, 29, 514–529. [Google Scholar] [CrossRef]
  75. Wang, D.; Huang, Y.; Liang, S.; Meng, Q.; Yu, H. The Identification of Interacting Brain Networks during Robot-Assisted Training with Multimodal Stimulation. J. Neural. Eng. 2023, 20, 016009. [Google Scholar] [CrossRef]
  76. Du, Q.; Luo, J.; Cheng, Q.; Wang, Y.; Guo, S. Vibrotactile Enhancement in Hand Rehabilitation Has a Reinforcing Effect on Sensorimotor Brain Activities. Front. Neurosci. 2022, 16, 935827. [Google Scholar] [CrossRef]
  77. Ye, S.; Wang, M.; Yang, Q.; Dong, H.; Dong, G.-H. Predicting the Severity of Internet Gaming Disorder with Resting-State Brain Features: A Multi-Voxel Pattern Analysis. J. Affect. Disord. 2022, 318, 113–122. [Google Scholar] [CrossRef]
  78. Zhang, J.; Zhang, X.; Chen, G.; Huang, L.; Sun, Y. EEG Emotion Recognition Based on Cross-Frequency Granger Causality Feature Extraction and Fusion in the Left and Right Hemispheres. Front. Neurosci. 2022, 16, 1512. [Google Scholar] [CrossRef]
  79. Sysoev, I.V.; van Luijtelaar, G.; Lüttjohann, A. Thalamo-Cortical and Thalamo-Thalamic Coupling During Sleep and Wakefulness in Rats. Brain Connect. 2022, 12, 650–659. [Google Scholar] [CrossRef]
  80. Ursino, M.; Serra, M.; Tarasi, L.; Ricci, G.; Magosso, E.; Romei, V. Bottom-up vs. Top-down Connectivity Imbalance in Individuals with High-Autistic Traits: An Electroencephalographic Study. Front. Syst. Neurosci. 2022, 16, 932128. [Google Scholar] [CrossRef]
  81. Fu, Y.; Niu, M.; Gao, Y.; Dong, S.; Huang, Y.; Zhang, Z.; Zhuo, C. Altered Nonlinear Granger Causality Interactions in the Large-Scale Brain Networks of Patients with Schizophrenia. J. Neural. Eng. 2022, 19, 066044. [Google Scholar] [CrossRef]
  82. Lamsal, R.; Harwood, A.; Read, M.R. Twitter Conversations Predict the Daily Confirmed COVID-19 Cases. Appl. Soft Comput. 2022, 129, 109603. [Google Scholar] [CrossRef]
  83. Cai, M.; Luo, H.; Meng, X.; Cui, Y.; Wang, W. Network Distribution and Sentiment Interaction: Information Diffusion Mechanisms between Social Bots and Human Users on Social Media. Inf. Process. Manag. 2023, 60, 103197. [Google Scholar] [CrossRef]
  84. Tank, A.; Covert, I.; Foti, N.; Shojaie, A.; Fox, E.B. Neural Granger Causality. IEEE Trans. Pattern Anal. Mach. Intell. 2022, 44, 4267–4279. [Google Scholar] [CrossRef]
  85. Pirnay, L.; Burnay, C. How to Build Data-Driven Strategy Maps? A Methodological Framework Proposition. Data Knowl. Eng. 2022, 139, 102019. [Google Scholar] [CrossRef]
  86. Wang, Q.; Shwartz, L.; Grabarnik, G.Y.; Arya, V.; Shanmugam, K. Detecting Causal Structure on Cloud Application Microservices Using Granger Causality Models. In Proceedings of the 2021 IEEE 14th International Conference on Cloud Computing (CLOUD), Chicago, IL, USA, 5–10 September 2021; pp. 558–565. [Google Scholar]
  87. Aviles-Cruz, C.; Rodriguez-Martinez, E.; Villegas-Cortez, J.; Ferreyra-Ramirez, A. Granger-Causality: An Efficient Single User Movement Recognition Using a Smartphone Accelerometer Sensor. Pattern Recognit. Lett. 2019, 125, 576–583. [Google Scholar] [CrossRef]
  88. Zhang, K.; Zheng, L.; Liu, Z.; Jia, N. A Deep Learning Based Multitask Model for Network-Wide Traffic Speed Prediction. Neurocomputing 2020, 396, 438–450. [Google Scholar] [CrossRef]
  89. Kordana-Obuch, S.; Starzec, M.; Wojtoń, M.; Słyś, D. Greywater as a Future Sustainable Energy and Water Source: Bibliometric Mapping of Current Knowledge and Strategies. Energies 2023, 16, 934. [Google Scholar] [CrossRef]
  90. Muhuri, P.K.; Shukla, A.K.; Abraham, A. Industry 4.0: A Bibliometric Analysis and Detailed Overview. Eng. Appl. Artif. Intell. 2019, 78, 218–235. [Google Scholar] [CrossRef]
  91. Merigó, J.M.; Yang, J.-B. A Bibliometric Analysis of Operations Research and Management Science. Omega 2017, 73, 37–48. [Google Scholar] [CrossRef] [Green Version]
  92. Van Nunen, K.; Li, J.; Reniers, G.; Ponnet, K. Bibliometric Analysis of Safety Culture Research. Saf. Sci. 2018, 108, 248–258. [Google Scholar] [CrossRef]
  93. Herrera-Franco, G.; Montalván-Burbano, N.; Carrión-Mero, P.; Jaya-Montalvo, M.; Gurumendi-Noriega, M. Worldwide Research on Geoparks through Bibliometric Analysis. Sustainability 2021, 13, 1175. [Google Scholar] [CrossRef]
  94. Donthu, N.; Kumar, S.; Mukherjee, D.; Pandey, N.; Lim, W.M. How to Conduct a Bibliometric Analysis: An Overview and Guidelines. J. Bus. Res. 2021, 133, 285–296. [Google Scholar] [CrossRef]
  95. Lam, W.H.; Lam, W.S.; Lee, P.F. The Studies on Gallium Nitride-Based Materials: A Bibliometric Analysis. Materials 2023, 16, 401. [Google Scholar] [CrossRef]
  96. Lam, W.H.; Lam, W.S.; Jaaman, S.H.; Lee, P.F. Bibliometric Analysis of Information Theoretic Studies. Entropy 2022, 24, 1359. [Google Scholar] [CrossRef]
  97. Heradio, R.; de la Torre, L.; Galan, D.; Cabrerizo, F.J.; Herrera-Viedma, E.; Dormido, S. Virtual and Remote Labs in Education: A Bibliometric Analysis. Comput. Edu. 2016, 98, 14–38. [Google Scholar] [CrossRef]
  98. Bota-Avram, C. Bibliometric Analysis of Sustainable Business Performance: Where Are We Going? A Science Map of the Field. Econ. Res. Ekon. Istraživanja 2023, 36, 2137–2176. [Google Scholar] [CrossRef]
  99. Mohadab, M.E.; Bouikhalene, B.; Safi, S. Bibliometric Method for Mapping the State of the Art of Scientific Production in Covid-19. Chaos Solitons Fractals 2020, 139, 110052. [Google Scholar] [CrossRef]
  100. Soh, A.-N.; Puah, C.-H.; Arip, M.A. A Bibliometric Analysis on Tourism Sustainable Competitiveness Research. Sustainability 2023, 15, 1035. [Google Scholar] [CrossRef]
  101. Ghorbel, F.; Hachicha, W.; Boujelbene, Y.; Aljuaid, A.M. Linking Entrepreneurial Innovation to Effectual Logic. Sustainability 2021, 13, 2626. [Google Scholar] [CrossRef]
  102. Karakose, T.; Papadakis, S.; Tülübaş, T.; Polat, H. Understanding the Intellectual Structure and Evolution of Distributed Leadership in Schools: A Science Mapping-Based Bibliometric Analysis. Sustainability 2022, 14, 16779. [Google Scholar] [CrossRef]
  103. TjØstheim, D. Granger-Causality in Multiple Time Series. J. Econom. 1981, 17, 157–176. [Google Scholar] [CrossRef]
  104. Freeman, J.R. Granger Causality and the Times Series Analysis of Political Relationships. Am. J. Pol. Sci. 1983, 27, 327–358. [Google Scholar] [CrossRef]
  105. Buiter, W.H. Granger-Causality and Policy Effectiveness. Economica 1984, 51, 151–162. [Google Scholar] [CrossRef]
  106. Bessler, D.A.; Kling, J.L. A Note on Tests of Granger Causality. Appl. Econ. 1984, 16, 335–342. [Google Scholar] [CrossRef]
  107. Friston, K.J. Functional and Effective Connectivity: A Review. Brain Connect. 2011, 1, 13–36. [Google Scholar] [CrossRef]
  108. Bollen, J.; Mao, H.; Zeng, X. Twitter Mood Predicts the Stock Market. J. Comput. Sci. 2011, 2, 1–8. [Google Scholar] [CrossRef] [Green Version]
  109. Smith, S.M.; Miller, K.L.; Salimi-Khorshidi, G.; Webster, M.; Beckmann, C.F.; Nichols, T.E.; Ramsey, J.D.; Woolrich, M.W. Network Modelling Methods for FMRI. Neuroimage 2011, 54, 875–891. [Google Scholar] [CrossRef] [PubMed]
  110. Sajovic, I.; Boh Podgornik, B. Bibliometric Analysis of Visualizations in Computer Graphics: A Study. SAGE Open 2022, 12, 1105. [Google Scholar] [CrossRef]
  111. Abdullah; Khan, M.N. Determining Mobile Payment Adoption: A Systematic Literature Search and Bibliometric Analysis. Cogent Bus. Manag. 2021, 8, 1893245. [Google Scholar] [CrossRef]
  112. Guo, Y.-M.; Huang, Z.-L.; Guo, J.; Li, H.; Guo, X.-R.; Nkeli, M.J. Bibliometric Analysis on Smart Cities Research. Sustainability 2019, 11, 3606. [Google Scholar] [CrossRef] [Green Version]
  113. Guo, X. A Bibliometric Analysis of Child Language During 1900–2021. Front. Psychol. 2022, 13, 862042. [Google Scholar] [CrossRef]
  114. Martins, J.; Gonçalves, R.; Branco, F. A Bibliometric Analysis and Visualization of E-Learning Adoption Using VOSviewer. Univ. Access Inf. Soc. 2022, 1–15. [Google Scholar] [CrossRef]
  115. Greenwood, D.C. Reliability of Journal Impact Factor Rankings. BMC Med. Res. Methodol. 2007, 7, 48. [Google Scholar] [CrossRef] [Green Version]
  116. Sharma, M.; Sarin, A.; Gupta, P.; Sachdeva, S.; Desai, A.V. Journal Impact Factor: Its Use, Significance and Limitations. World J. Nucl. Med. 2014, 13, 146. [Google Scholar] [CrossRef]
  117. Torres-Salinas, D.; Valderrama-Baca, P.; Arroyo-Machado, W. Is There a Need for a New Journal Metric? Correlations between JCR Impact Factor Metrics and the Journal Citation Indicator—JCI. J. Informetr. 2022, 16, 101315. [Google Scholar] [CrossRef]
  118. Huh, S. The Journal Citation Indicator Has Arrived for Emerging Sources Citation Index Journals, Including the Journal of Educational Evaluation for Health Professions, in June 2021. J. Educ. Eval. Health Prof. 2021, 18, 20. [Google Scholar] [CrossRef]
  119. Trapp, J.V. The New Scopus CiteScore Formula and the Journal Impact Factor: A Look at Top Ranking Journals and Middle Ranking Journals in the Scopus Categories of General Physics and Astronomy, Materials Science, General Medicine and Social Sciences. Phys. Eng. Sci. Med. 2020, 43, 739–748. [Google Scholar] [CrossRef]
  120. Fernandez-Llimos, F. Differences and Similarities between Journal Impact Factor and CiteScore. Pharm. Pract. 2018, 16, 1282. [Google Scholar] [CrossRef] [Green Version]
  121. Falagas, M.E.; Kouranos, V.D.; Arencibia-Jorge, R.; Karageorgopoulos, D.E. Comparison of SCImago Journal Rank Indicator with Journal Impact Factor. FASEB J. 2008, 22, 2623–2628. [Google Scholar] [CrossRef]
  122. Leydesdorff, L.; Opthof, T. Scopus’s Source Normalized Impact per Paper (SNIP) Versus a Journal Impact Factor Based on Fractional Counting of Citations. J. Am. Soc. Inf. Sci. Technol. 2010, 61, 2365–2369. [Google Scholar] [CrossRef] [Green Version]
  123. Moed, H. The Source-Normalized Impact per Paper (SNIP) Is a Valid and Sophisticated Indicator of Journal Citation Impact. J. Am. Soc. Inf. Sci. Technol. 2011, 62, 211–213. [Google Scholar] [CrossRef]
  124. Menon, V.; Uddin, L.Q. Saliency, Switching, Attention and Control: A Network Model of Insula Function. Brain Struct. Funct. 2010, 214, 655–667. [Google Scholar] [CrossRef] [Green Version]
  125. Peters, J.; Janzing, D.; Schölkopf, B. Elements of Causal Inference: Foundations and Learning Algorithms. In Adaptive Computation and Machine Learning Series; The MIT Press: Cambridge, MA, USA, 2017; ISBN 978-0-262-03731-0. [Google Scholar]
  126. Sridharan, D.; Levitin, D.J.; Menon, V. A Critical Role for the Right Fronto-Insular Cortex in Switching between Central-Executive and Default-Mode Networks. Proc. Natl. Acad. Sci. USA 2008, 105, 12569–12574. [Google Scholar] [CrossRef] [Green Version]
  127. Baccalá, L.A.; Sameshima, K. Partial Directed Coherence: A New Concept in Neural Structure Determination. Biol. Cybern. 2001, 84, 463–474. [Google Scholar] [CrossRef] [PubMed]
  128. Nolte, G.; Bai, O.; Wheaton, L.; Mari, Z.; Vorbach, S.; Hallett, M. Identifying True Brain Interaction from EEG Data Using the Imaginary Part of Coherency. Clin. Neurophysiol. 2004, 115, 2292–2307. [Google Scholar] [CrossRef] [PubMed]
  129. Sugihara, G.; May, R.; Ye, H.; Hsieh, C.; Deyle, E.; Fogarty, M.; Munch, S. Detecting Causality in Complex Ecosystems. Science 2012, 338, 496–500. [Google Scholar] [CrossRef] [PubMed]
  130. Suban, S.A. Bibliometric Analysis on Wellness Tourism—Citation and Co-Citation Analysis. Inst. Hosp. Rev. 2022. ahead-of-print. [Google Scholar] [CrossRef]
  131. Engle, R.F.; Granger, C.W.J. Co-Integration and Error Correction: Representation, Estimation, and Testing. Econometrica 1987, 55, 251–276. [Google Scholar] [CrossRef]
  132. Johansen, S.; Juselius, K. Maximum Likelihood Estimation and Inference on Cointegration--With Applications to the Demand for Money. Oxf. Bull. Econ. Stat. 1990, 52, 169–210. [Google Scholar] [CrossRef]
  133. Phillips, P.C.B.; Perron, P. Testing for a Unit Root in Time Series Regression. Biometrika 1988, 75, 335–346. [Google Scholar] [CrossRef]
  134. Dickey, D.A.; Fuller, W.A. Distribution of the Estimators for Autoregressive Time Series with a Unit Root. J. Am. Stat. Assoc. 1979, 74, 427–431. [Google Scholar] [CrossRef]
  135. Jiang, J.; Lyu, W.; Chen, N. A Bibliometric Analysis of Diffuse Large B-Cell Lymphoma Research from 2001 to 2020. Comput. Biol. Med. 2022, 146, 105565. [Google Scholar] [CrossRef]
  136. Lam, W.S.; Lee, P.F.; Lam, W.H. Cellulose Nanofiber for Sustainable Production: A Bibliometric Analysis. Mater. Today Proc. 2022, 62, 6460–6467. [Google Scholar] [CrossRef]
  137. Murdayanti, Y.; Khan, M.N.A.A. The Development of Internet Financial Reporting Publications: A Concise of Bibliometric Analysis. Heliyon 2021, 7, e08551. [Google Scholar] [CrossRef]
  138. Kartal, M.T.; Samour, A.; Adebayo, T.S.; Depren, S.K. Do Nuclear Energy and Renewable Energy Surge Environmental Quality in the United States? New Insights from Novel Bootstrap Fourier Granger Causality in Quantiles Approach. Prog. Nucl. Energy 2023, 155, 104509. [Google Scholar] [CrossRef]
  139. Hung, N.T. Green Investment, Financial Development, Digitalization and Economic Sustainability in Vietnam: Evidence from a Quantile-on-Quantile Regression and Wavelet Coherence. Technol. Forecast. Soc. Change 2023, 186, 122185. [Google Scholar] [CrossRef]
  140. Ghaderi, Z.; Saboori, B.; Khoshkam, M. Revisiting the Environmental Kuznets Curve Hypothesis in the MENA Region: The Roles of International Tourist Arrivals, Energy Consumption and Trade Openness. Sustainability 2023, 15, 2553. [Google Scholar] [CrossRef]
Figure 1. Bibliometric analysis process flow.
Entropy 25 00632 g001
Figure 2. Publication and citation trends of Granger causality.
Entropy 25 00632 g002
Figure 3. Country co-authorship analysis of Granger causality publications.
Entropy 25 00632 g003
Figure 4. Co-citation analysis of cited documents on Granger causality.
Entropy 25 00632 g004
Figure 5. Co-citation analysis of cited source on Grange causality.
Entropy 25 00632 g005
Figure 6. Co-citation analysis of cited authors in Granger causality publications.
Entropy 25 00632 g006
Figure 7. Keyword co-occurrence map of Granger causality publications.
Entropy 25 00632 g007
Figure 8. Keyword overlay visualization map of Granger causality publications.
Entropy 25 00632 g008
Table 1. Document types of Granger causality publications.
Document TypeTotal Publication (TP)Percentage (%)
Article958278.52
Proceeding Paper198916.30
Early Access2942.41
Review Article2391.96
Book Chapters950.78
Book40.03
Table 2. Annual publication and citation metrics of Granger causality publication.
YearTPPercentage (%)Cumulative Percentage (%)NCPTCC/PC/CPh-Indexg-Index
198110.010.0112121.0021.0011
198310.010.021168168.00168.0011
198420.020.0323618.0018.0022
198520.020.052211105.50105.5022
198620.020.07210351.5051.5012
198730.030.0923311.0016.5023
198810.010.10122.002.0011
198930.030.1336321.0021.0023
199020.020.1522110.5010.5022
1991120.100.251138632.1735.09612
1992140.120.371220214.4316.83514
1993150.130.501560340.2040.20915
1994200.170.6718123861.9068.781120
1995250.210.882441816.7217.421120
1996370.321.2036165744.7846.031737
1997450.381.5842218048.4451.901645
1998420.361.9438163338.8842.972140
1999360.312.253294826.3329.631330
2000300.262.5028201567.1771.961530
2001360.312.8135342895.2297.942236
2002420.363.1740157637.5239.402139
2003290.253.4223207771.6290.301629
2004520.443.86456332121.77140.712852
2005970.834.6985579559.7468.183576
20061221.045.7395578947.4560.943475
20071911.637.37131662634.6950.584180
20082422.079.4417110,97545.1963.9552103
20093282.8012.2422514,95145.5866.4560118
20104073.4815.7229822,11754.3474.2270144
20114744.0519.7737422,70947.9160.7270144
20125254.4924.2541816,03530.5438.3660112
20135064.3228.5843316,55132.7138.2265112
20146615.6534.2353619,11128.9135.6570117
20156645.6739.9054513,71320.6525.165995
20167446.3646.2661917,60623.6628.4462104
20178507.2653.5369018,65421.9527.0363111
20188277.0760.5970815,86619.1922.416094
20199528.1468.7381115,25916.0318.825690
202010318.8177.5487814,19613.7716.175485
202111129.5087.0488293848.4410.644261
202211509.8396.8763532212.805.072332
20233663.13100.001254521.233.621013
Total11701100 274,361
Table 3. Research areas of Granger causality publications.
Research AreasTotal Publication
Business Economics5119
Environmental Science and Ecology1300
Neurosciences/Neurology1133
Engineering1112
Computer Science901
Science Technology, Other Topics849
Energy Fuels745
Mathematics560
Social Science, Other Topics479
Physics343
Radiology Nuclear Medicine and Medical Imaging309
Mathematical Methods in Social Sciences281
Operations Research Management Science264
Public Administration224
Psychology197
Mathematical Computational Biology140
Agriculture135
Biochemistry and Molecular Biology124
Automation Control Systems117
Thermodynamics107
Table 4. Web of Science categories of Granger causality publications.
Web of Science CategoriesTotal Publication
Economics3717
Business Finance1109
Neurosciences1036
Environmental Sciences948
Business747
Energy Fuels745
Management736
Environmental Studies599
Green Sustainable Science Technology499
Engineering—Electrical/Electronic457
Computer Science Artificial Intelligence349
Multidisciplinary Sciences347
Engineering—Biomedical311
Radiology Nuclear Medicine and Medical Imaging309
Computer Science Information Systems296
Computer Science Interdisciplinary Applications296
Social Science Mathematical Methods281
Neuroimaging274
Statistics Probability268
Operations Research Management Science264
Table 5. Top 10 countries with high contributions in Granger causality publications.
CountryTPNCPTCC/PC/CPh-Indexg-Index
China3114207946,77815.0222.597147
United States2113187680,05537.8942.67125225
Turkey87470431,37335.944.5688157
India70351710,04914.2919.444682
England64858530,22146.6451.6683159
Pakistan49643317,20234.7539.7366118
Australia49043717,02434.7438.9663117
Italy47642312,66026.629.935896
Germany46941212,82627.3531.135796
Malaysia45437918,73341.2649.4371128
Table 6. Top 10 countries with co-authorships with other countries.
CountryTotal PublicationTotal Link Strength
United States21131454
China31141386
England648840
Pakistan496686
France383617
Turkey874572
Germany469515
Australia490487
Malaysia454444
Italy476409
Table 7. Journals of Granger causality documents.
Publication TitleTP%TCPublisherJIFJCICite ScoreSJRSNIPh-Index
Environmental Science and Pollution Research2602.227631Springer Heidelberg5.1900.816.60.8311.154132
Energy Economics1741.4918,514Elsevier9.2523.0511.32.5492.347168
Applied Economics1561.333028Routledge Journals, Taylor & Francis Ltd.1.9160.632.80.5631.08691
Neuroimage1541.3210,816Academic Press Inc. Elsevier Science7.4001.6411.22.7462.099381
Sustainability1501.281673Multidisciplinary Digital Publishing Institute3.8890.655.00.6641.310109
PLoS One1181.012993Public Library Science3.7520.885.60.8521.368367
Applied Economics Letters1130.971481Routledge Journals, Taylor & Francis Ltd.1.2870.411.80.40.66354
Economic Modelling1110.956072Elsevier3.8751.284.81.0651.73387
Resources Policy1070.912832Elsevier Sci Ltd.8.2221.637.61.4611.99680
Renewable & Sustainable Energy Reviews1030.8812,603Pergamon-Elsevier Science Ltd.16.7991.2628.53.6784.535337
Table 8. Top 10 most cited publications on Granger causality.
TitleYearTCJournal Title
Saliency, switching, attention and control: a network model of insula function [124]20102603Brain Structure & Function
Elements of Causal Inference: Foundations and Learning Algorithms [125]20172131Elements of Causal Inference: Foundations and Learning Algorithms
Functional and Effective Connectivity: A Review [107]20111862Brain Connectivity
A critical role for the right fronto-insular cortex in switching between central-executive and default-mode networks [126]20081841Proceedings of the National Academy of Sciences of the United States of America
Twitter mood predicts the stock market [108]20111225Journal of Computational Science
Network modelling methods for FMRI [109]20111209NeuroImage
Partial directed coherence: a new concept in neural structure determination [127]20011168Biological Cybernetics
Identifying true brain interaction from EEG data using the imaginary part of coherency [128]20041060Clinical Neurophysiology
FIAR: An R Package for Analyzing Functional Integration in the Brain [13]20111055Journal of Statistical Software
Detecting Causality in Complex Ecosystems [129]20121046Science
Table 9. Keywords with total link strengths in Granger causality.
KeywordsOccurrencesTotal Link Strength
Granger causality396312,891
Cointegration212811,166
Economic growth15908321
Time series14507579
CO2 emissions8836630
Unit root8475160
Financial development7255098
Energy consumption6164326
GDP4492986
Income4462965
Table 10. Citation metrics of Granger causality publications.
ItemsMetrics
Extraction Date13 January 2023
Number of Publications11,701
Total Number of Citations274,321
Number of Years42 (1981–2023)
Citations per Year6531.45
Citations per Paper23.44
Citations per Author118,838.8
Papers per Author5295.57
Authors per Paper3.11
h-index209
g-index330
Disclaimer/Publisher’s Note: The statements, opinions and data contained in all publications are solely those of the individual author(s) and contributor(s) and not of MDPI and/or the editor(s). MDPI and/or the editor(s) disclaim responsibility for any injury to people or property resulting from any ideas, methods, instructions or products referred to in the content.

