
Effect of Superheat Steam on Ejector in Distilled Water Preparation System for Medical Injection

Abstract
:1. Introduction
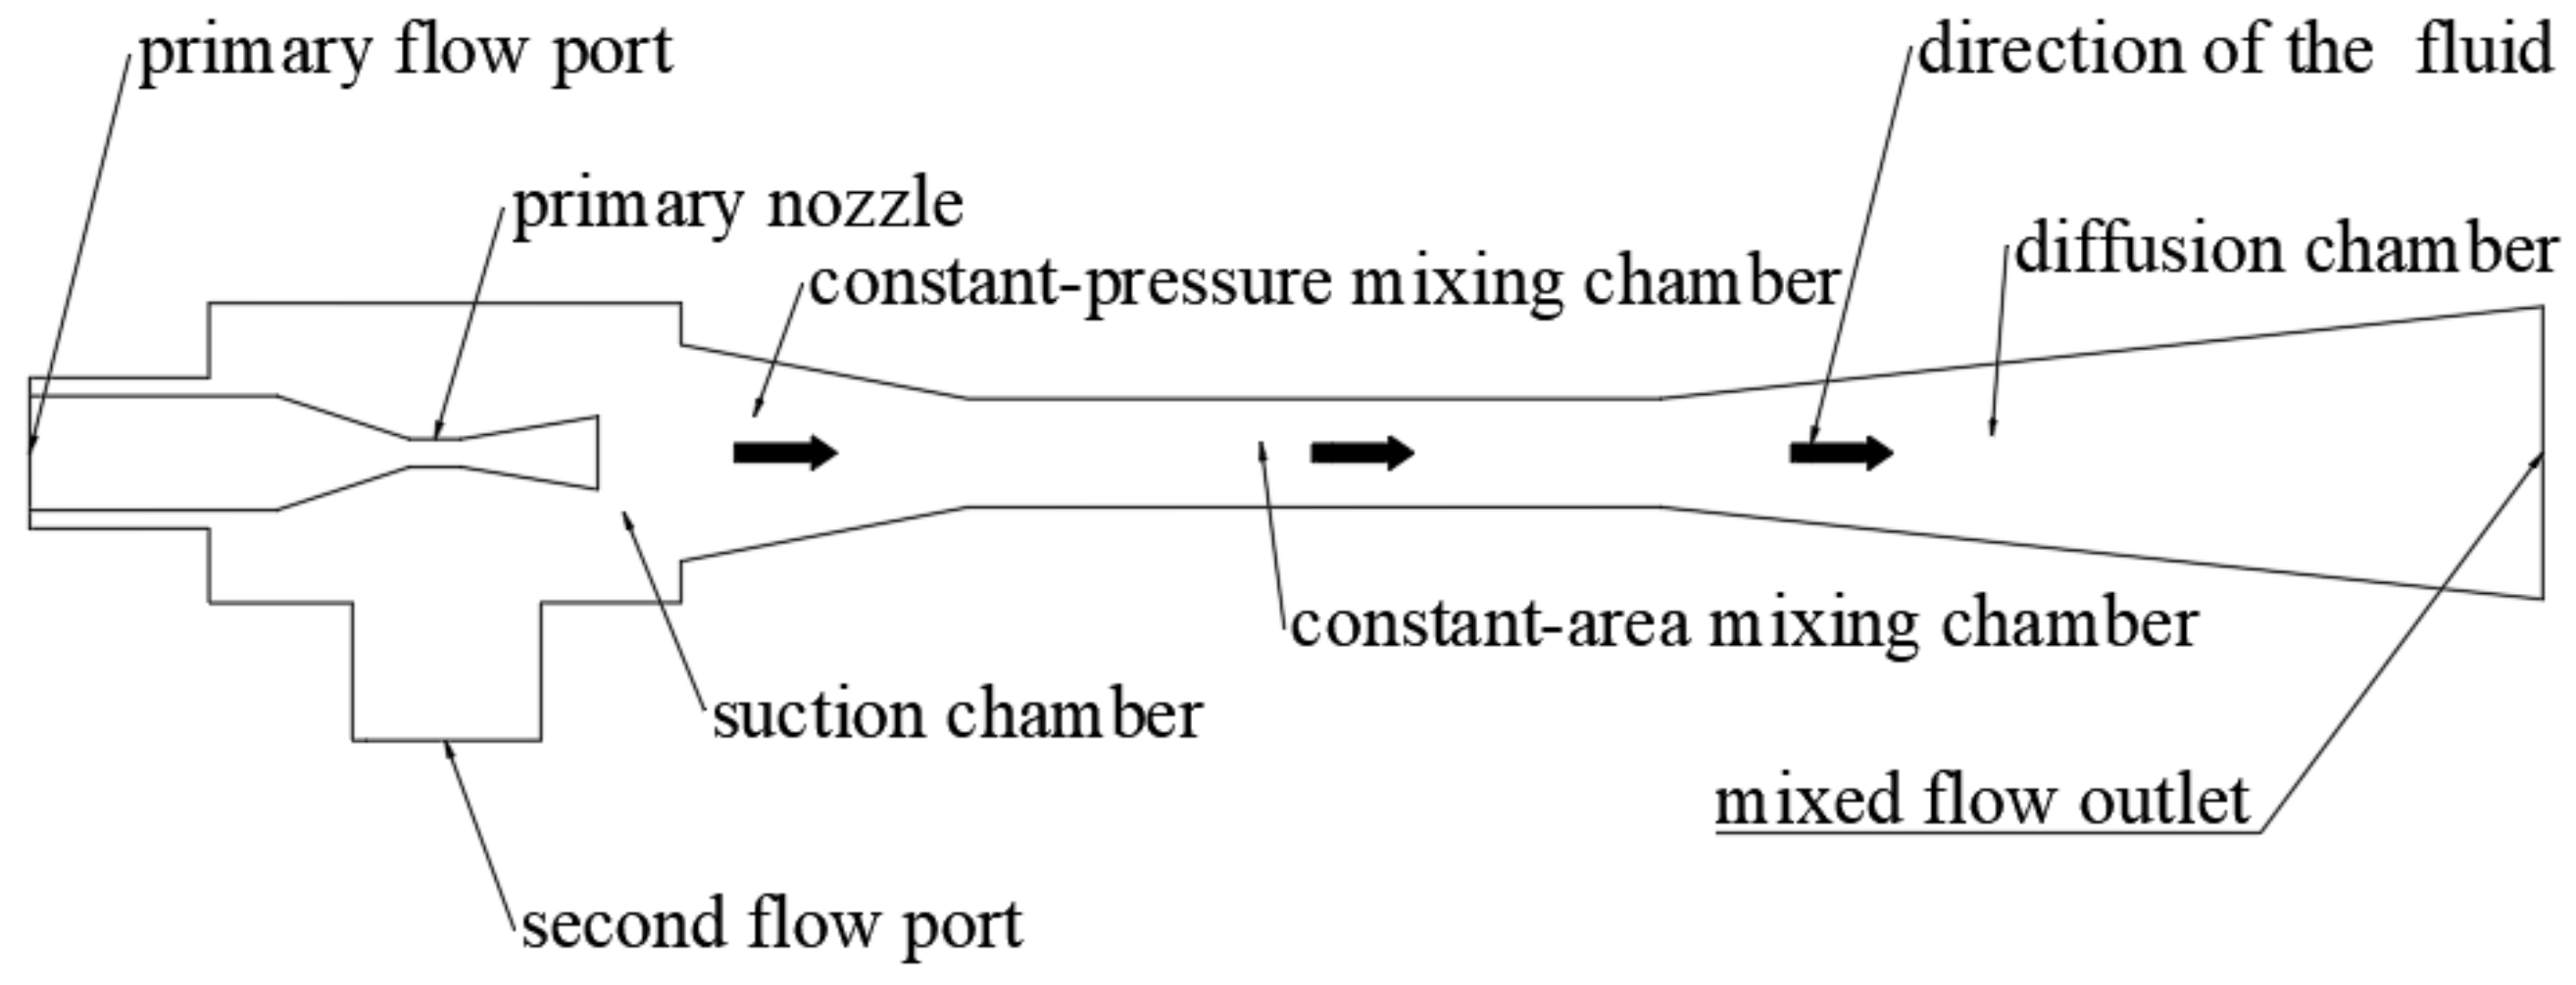
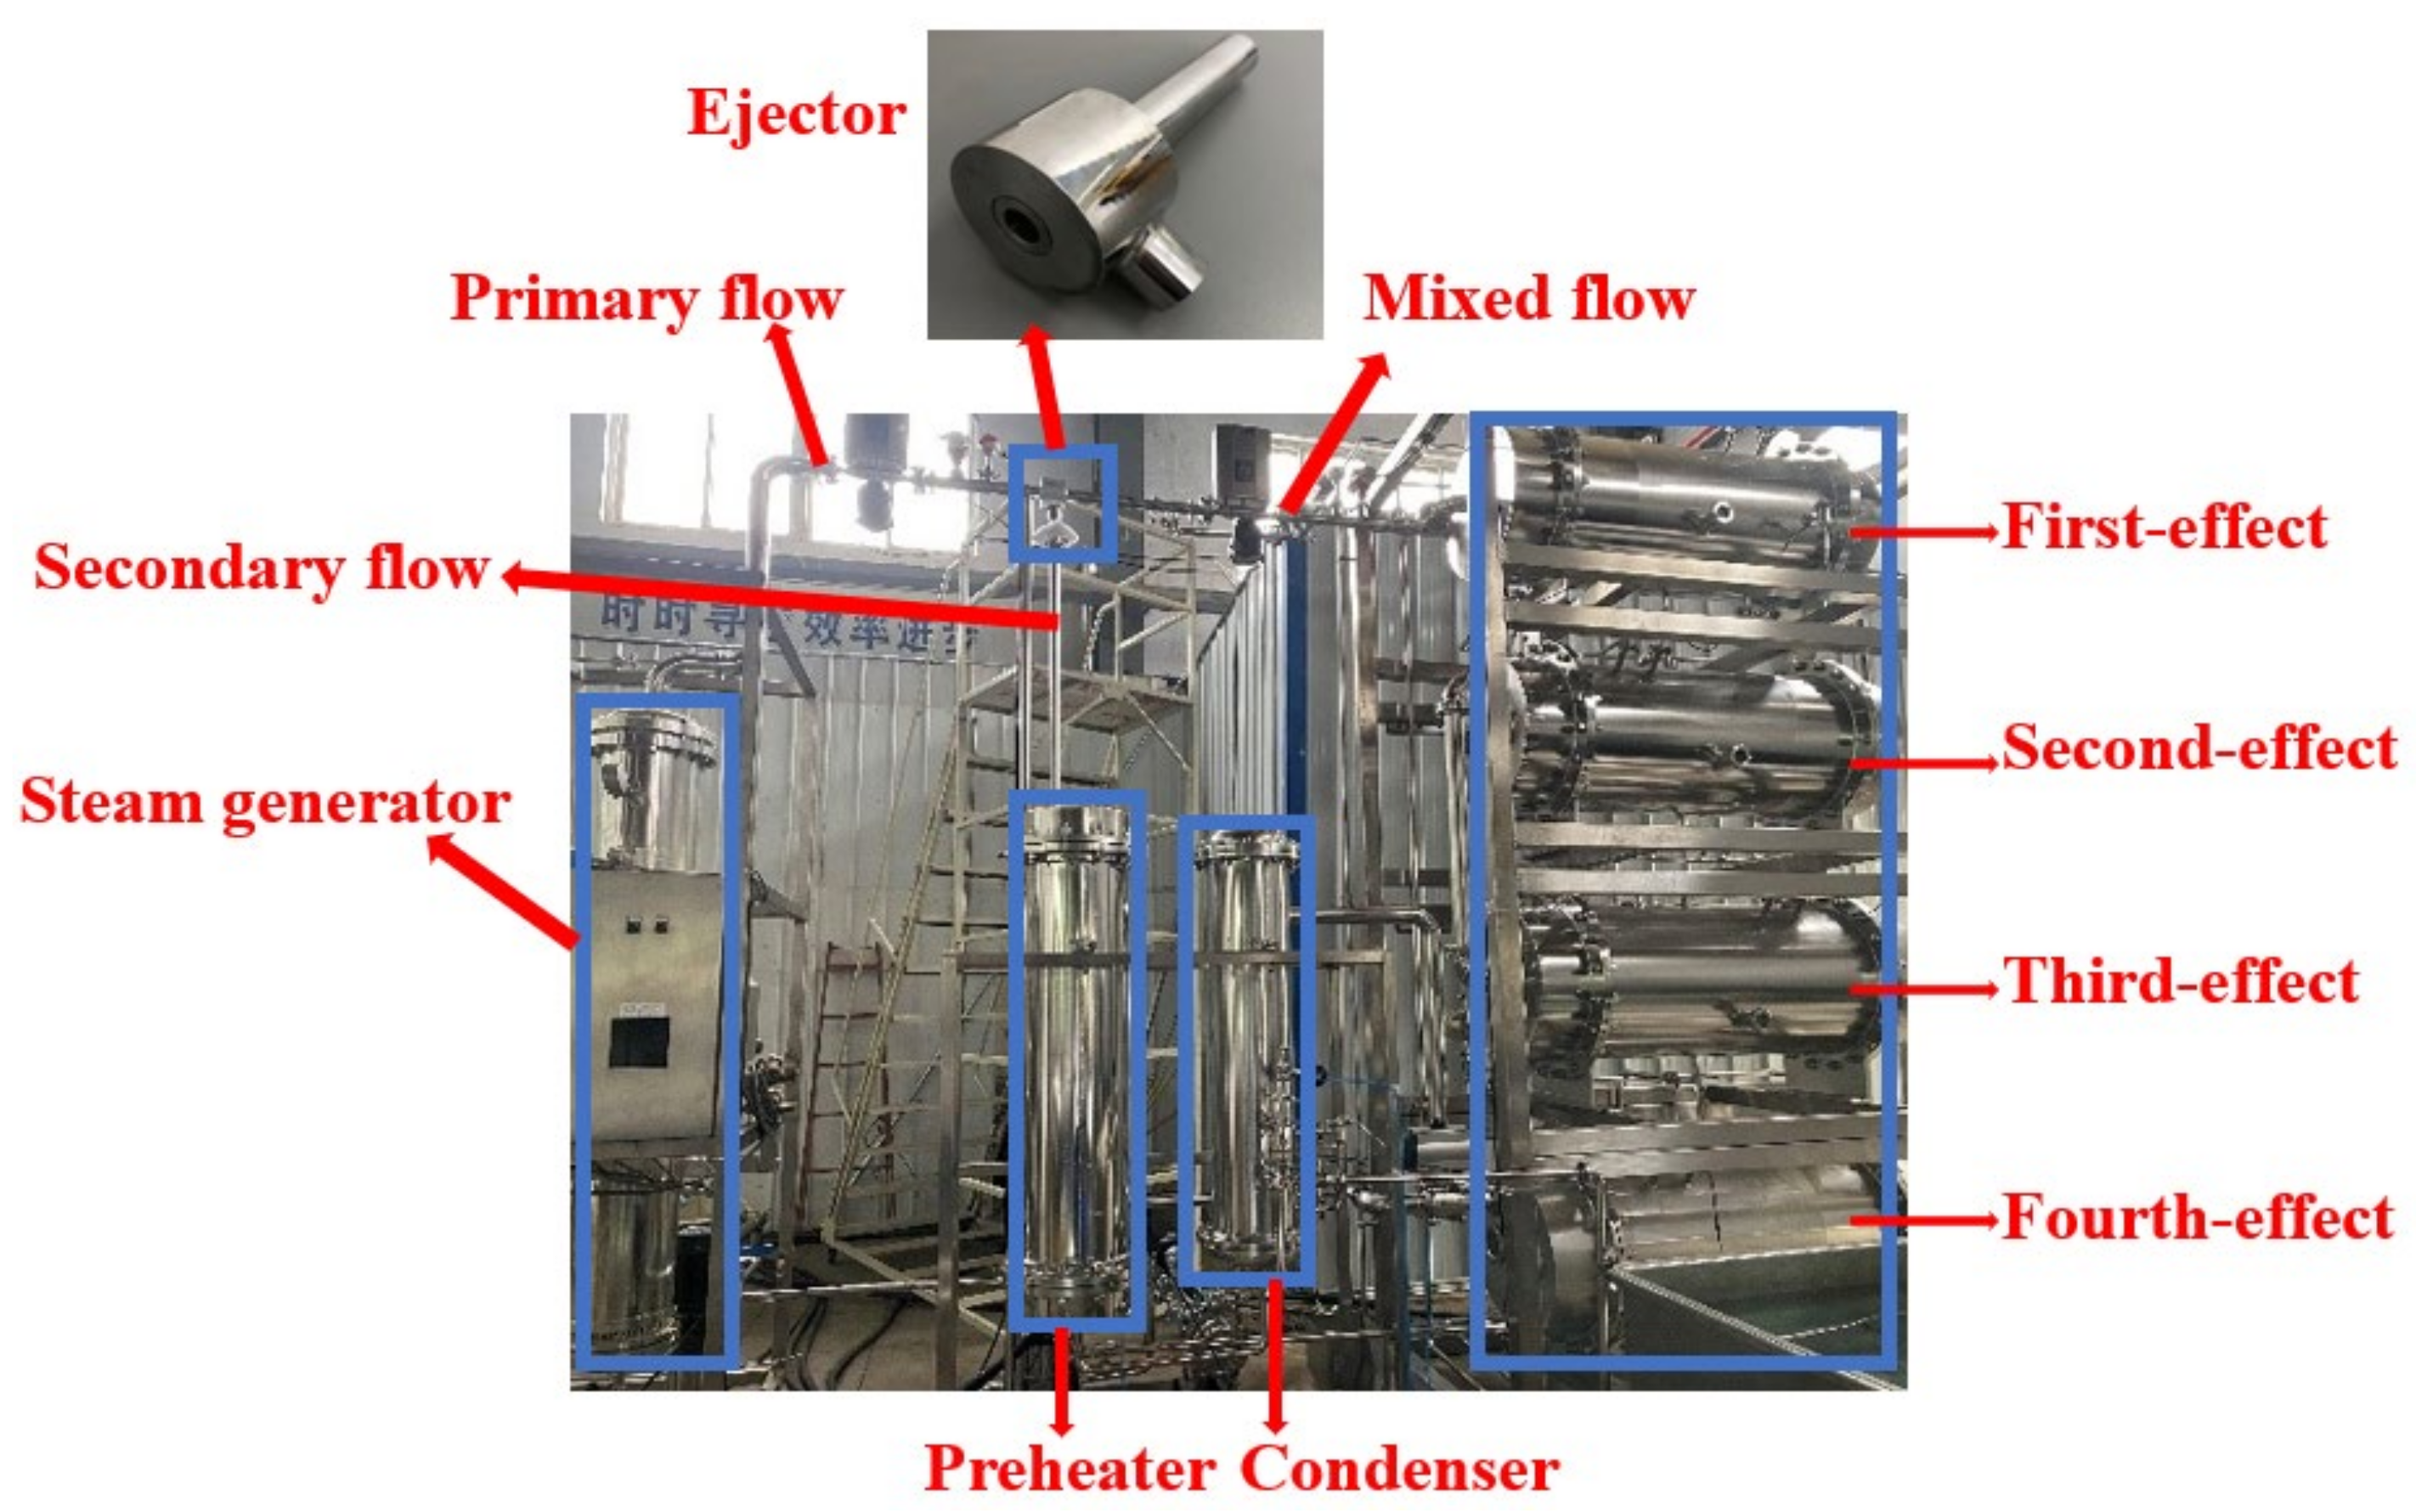
2. Ejector
3. Numerical Procedure
3.1. Wet Steam Model
3.2. Non-Equilibrium Condensation Phase Transition Model
3.3. Governing Equations
- 1.
- The internal fluid of the ejector is stable.
- 2.
- The inner wall of the ejector is adiabatic.
- 3.
- The change in the fluid in the ejector is an isentropic process.
- 1.
- Laws of conservation of mass:
- 2.
- Law of conservation of energy:
- 3.
- Law of conservation of momentum:
- 4.
- Droplet number density equation:
3.4. CFD Settings
3.4.1. Mesh
3.4.2. Boundary Conditions and Turbulence Model Selection
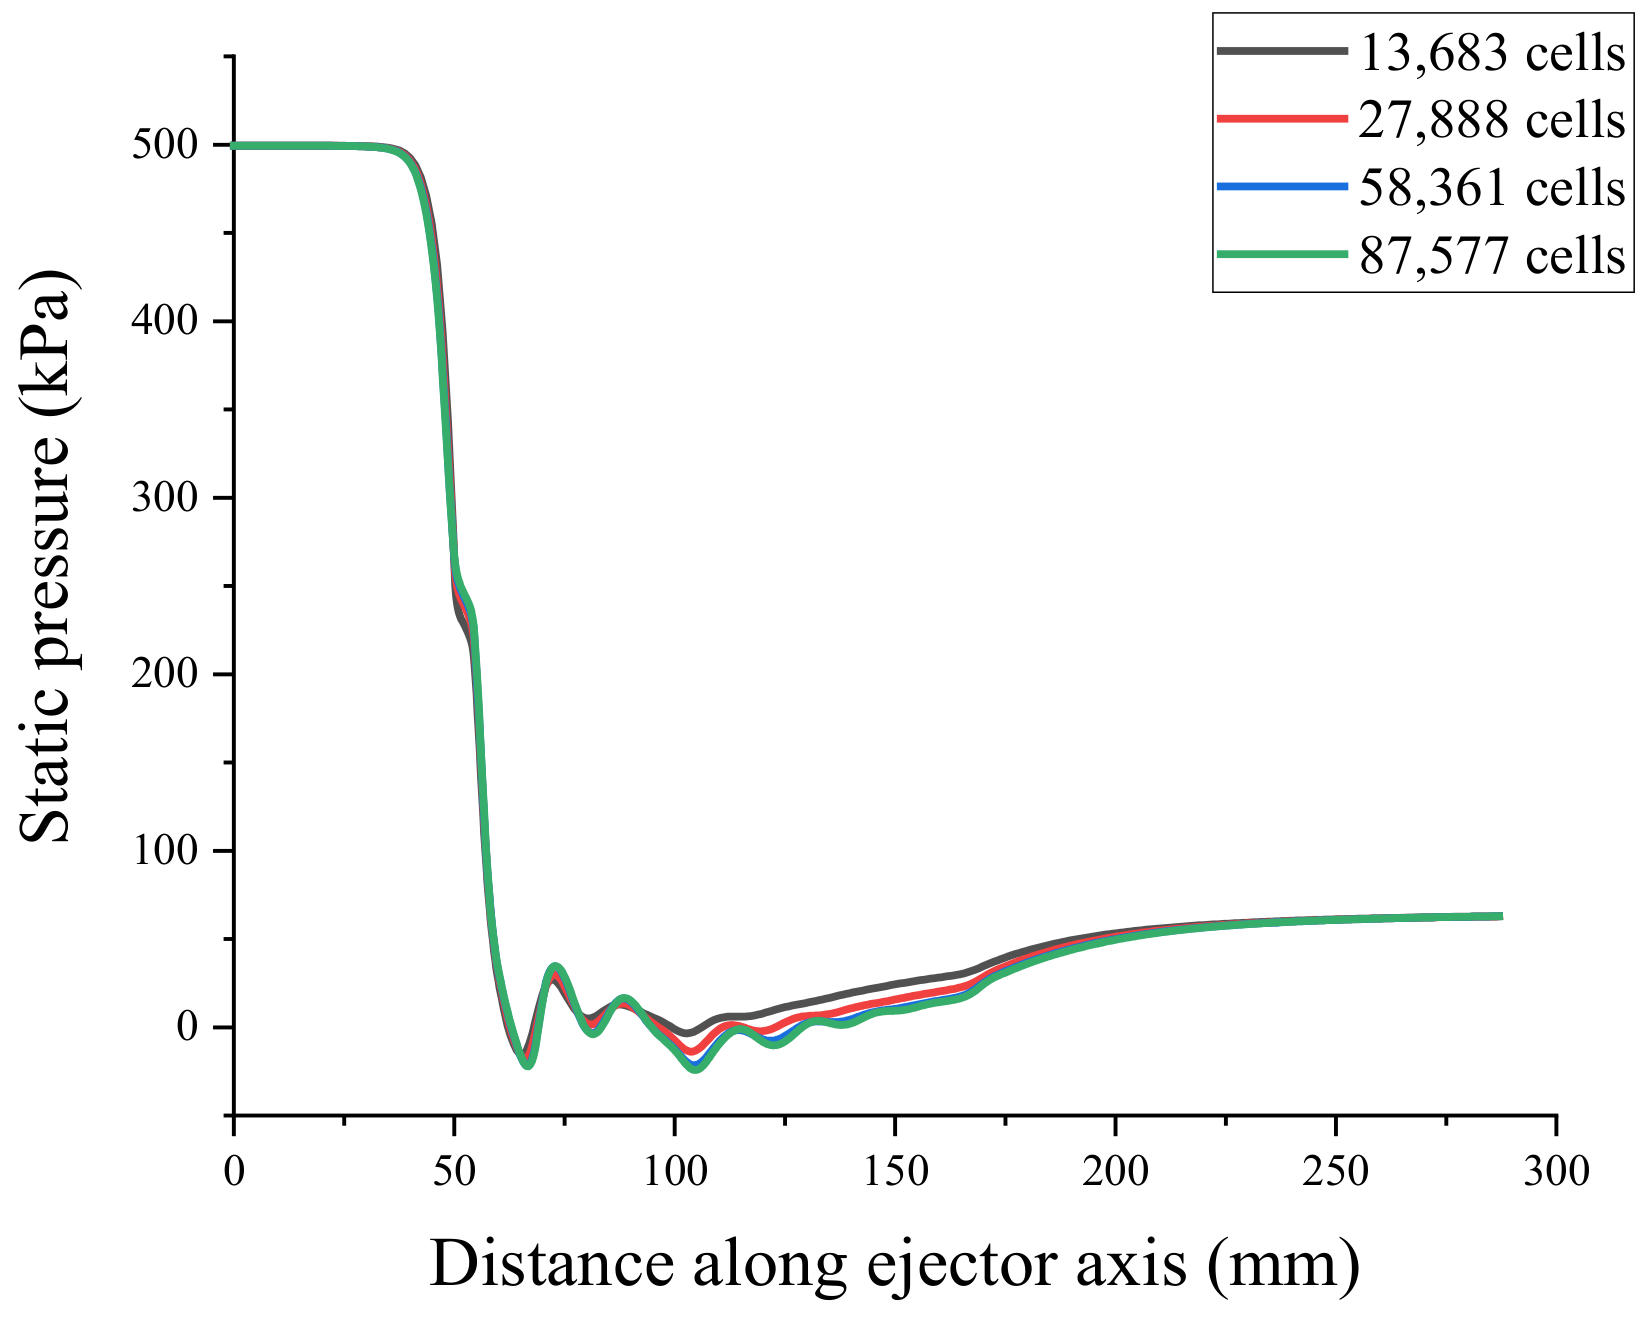
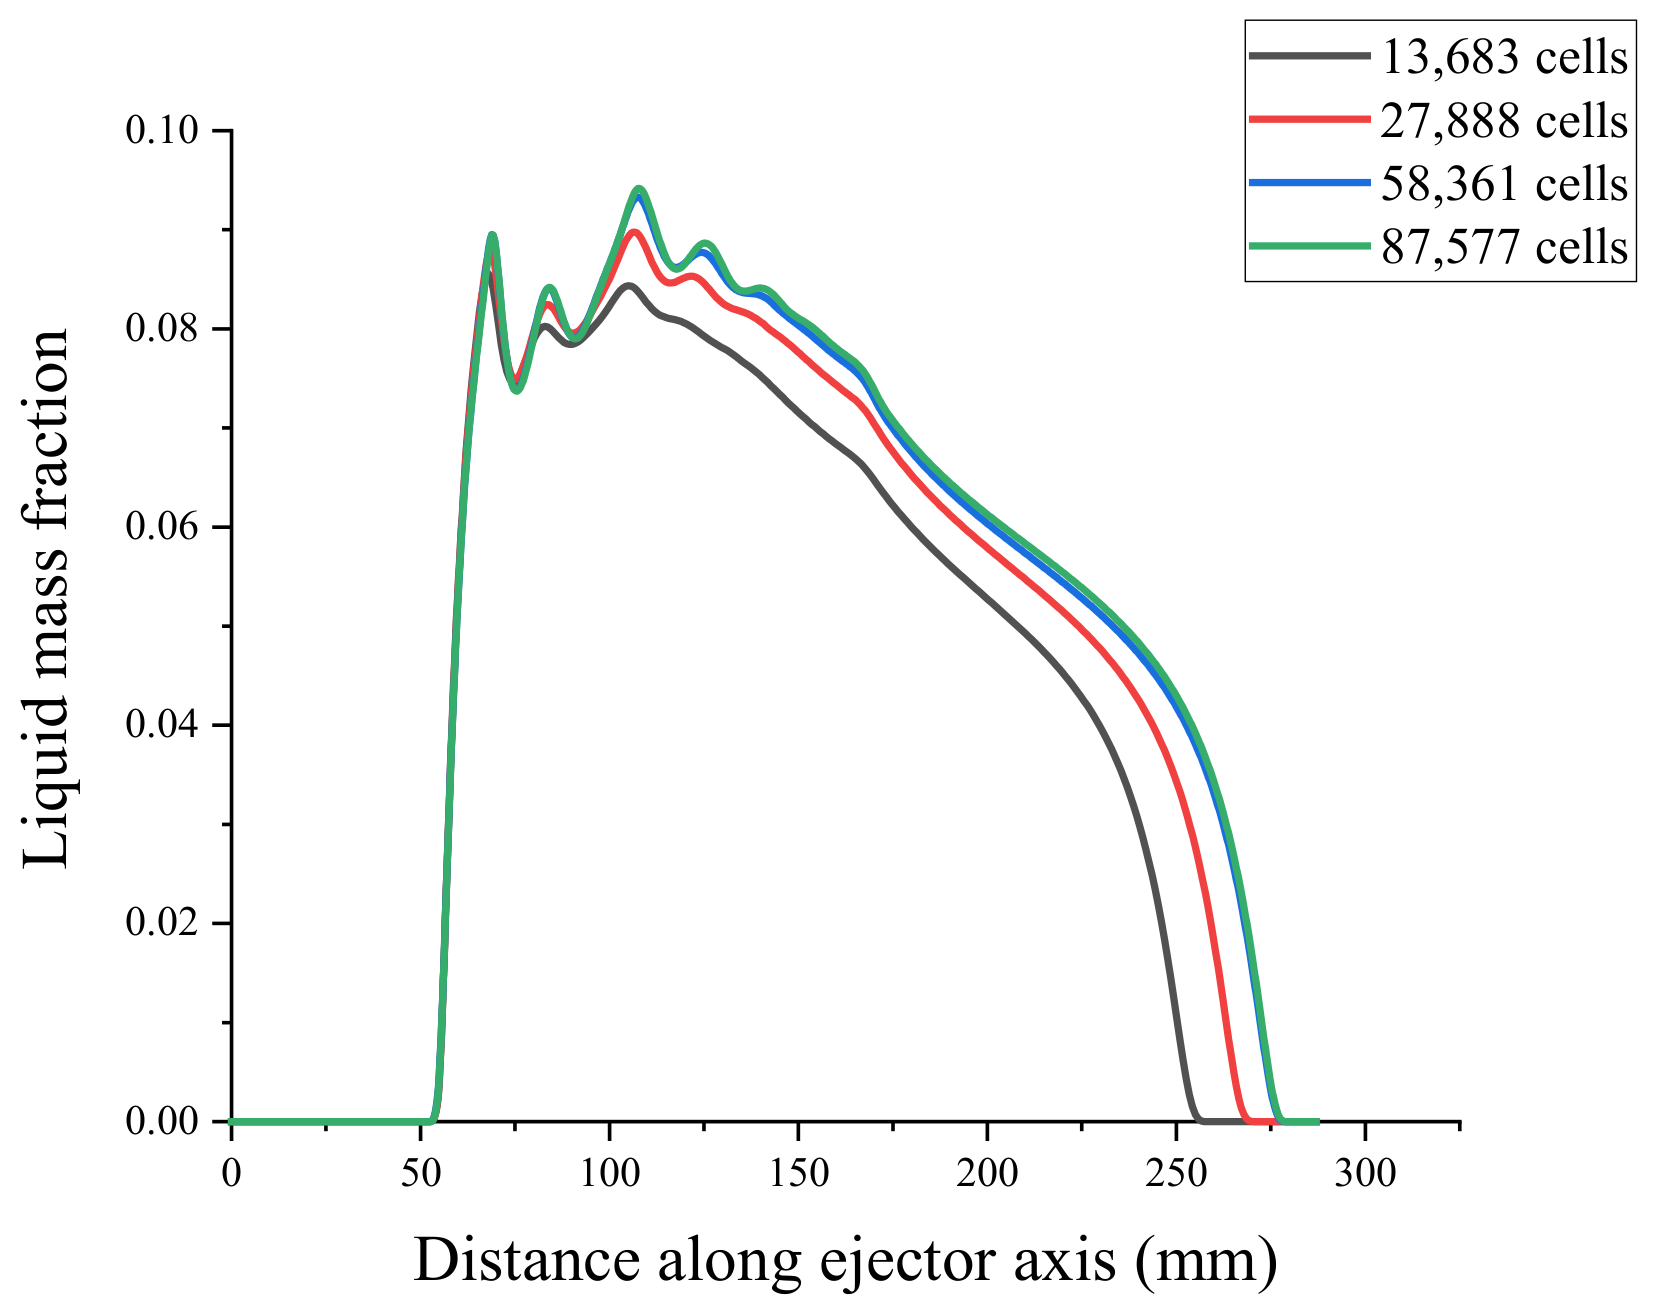
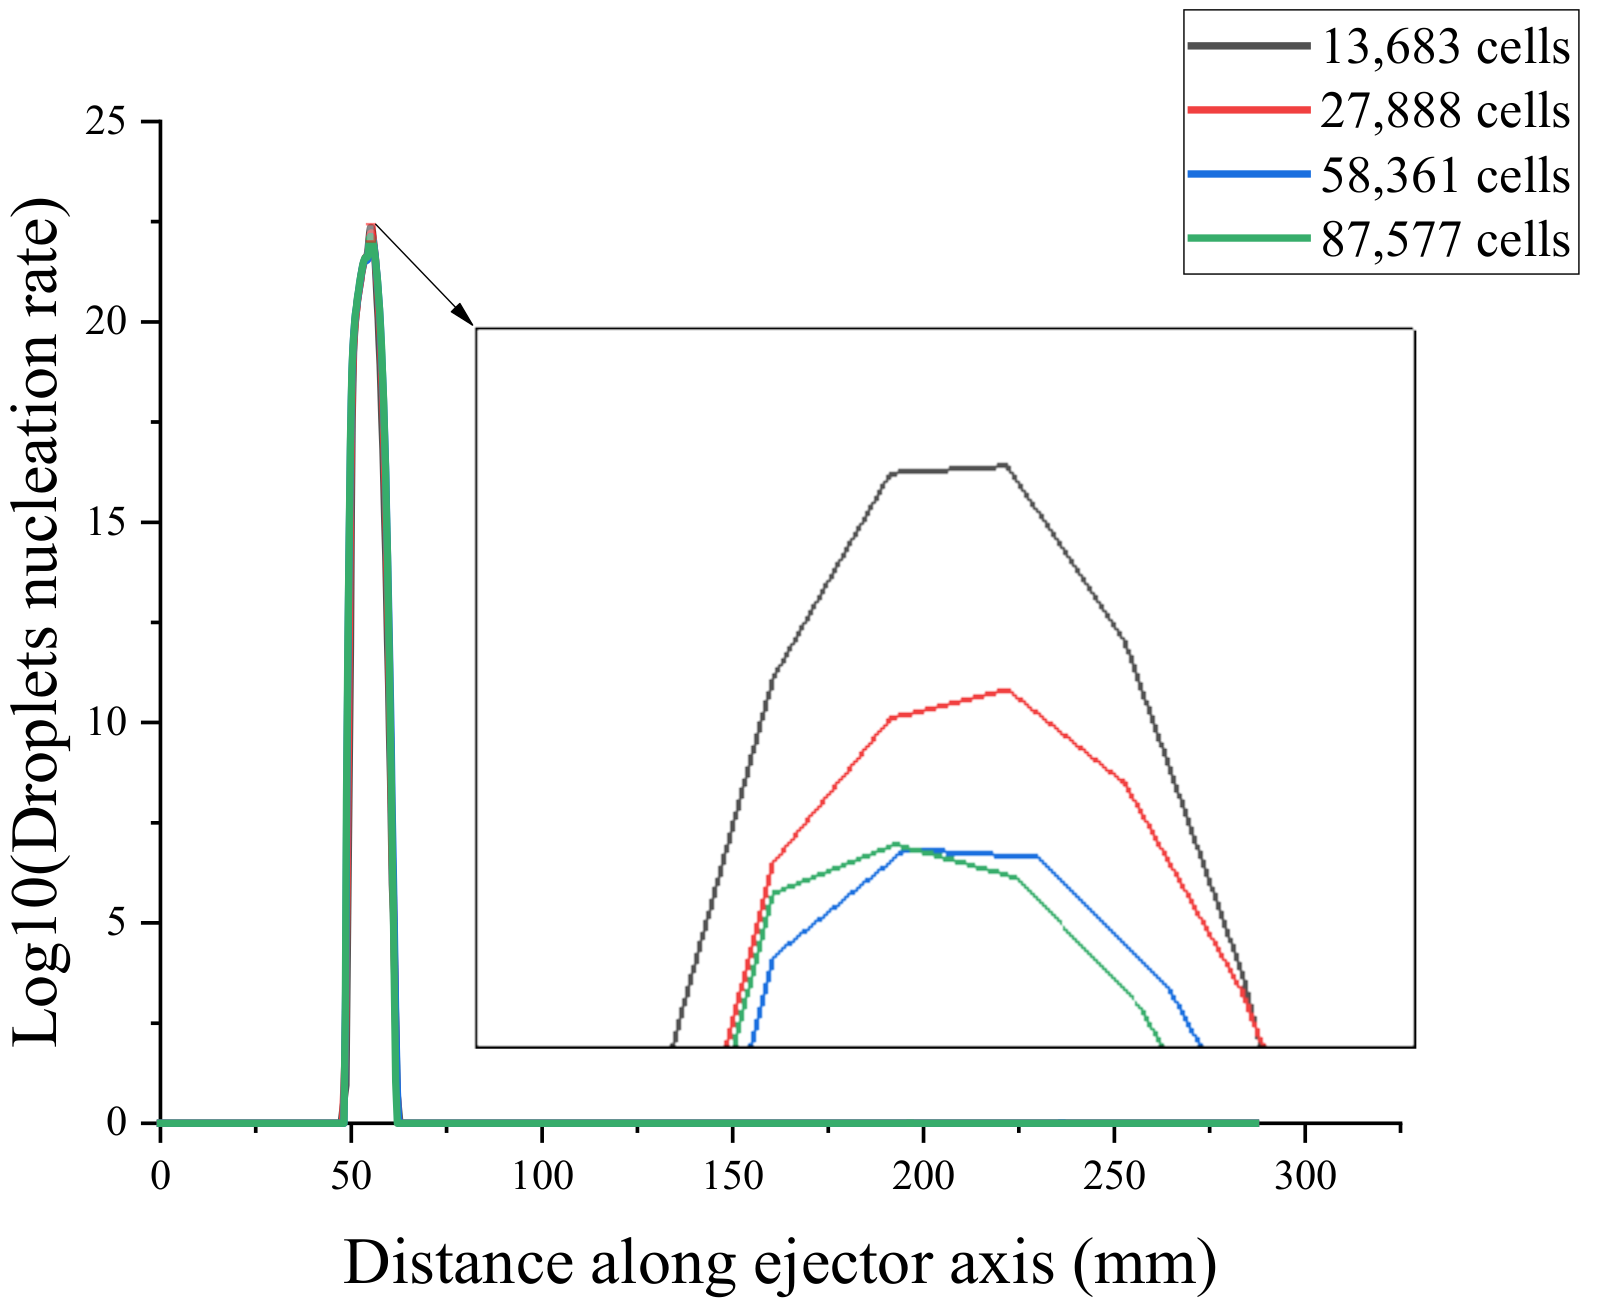
3.4.3. Mesh Independence Verification
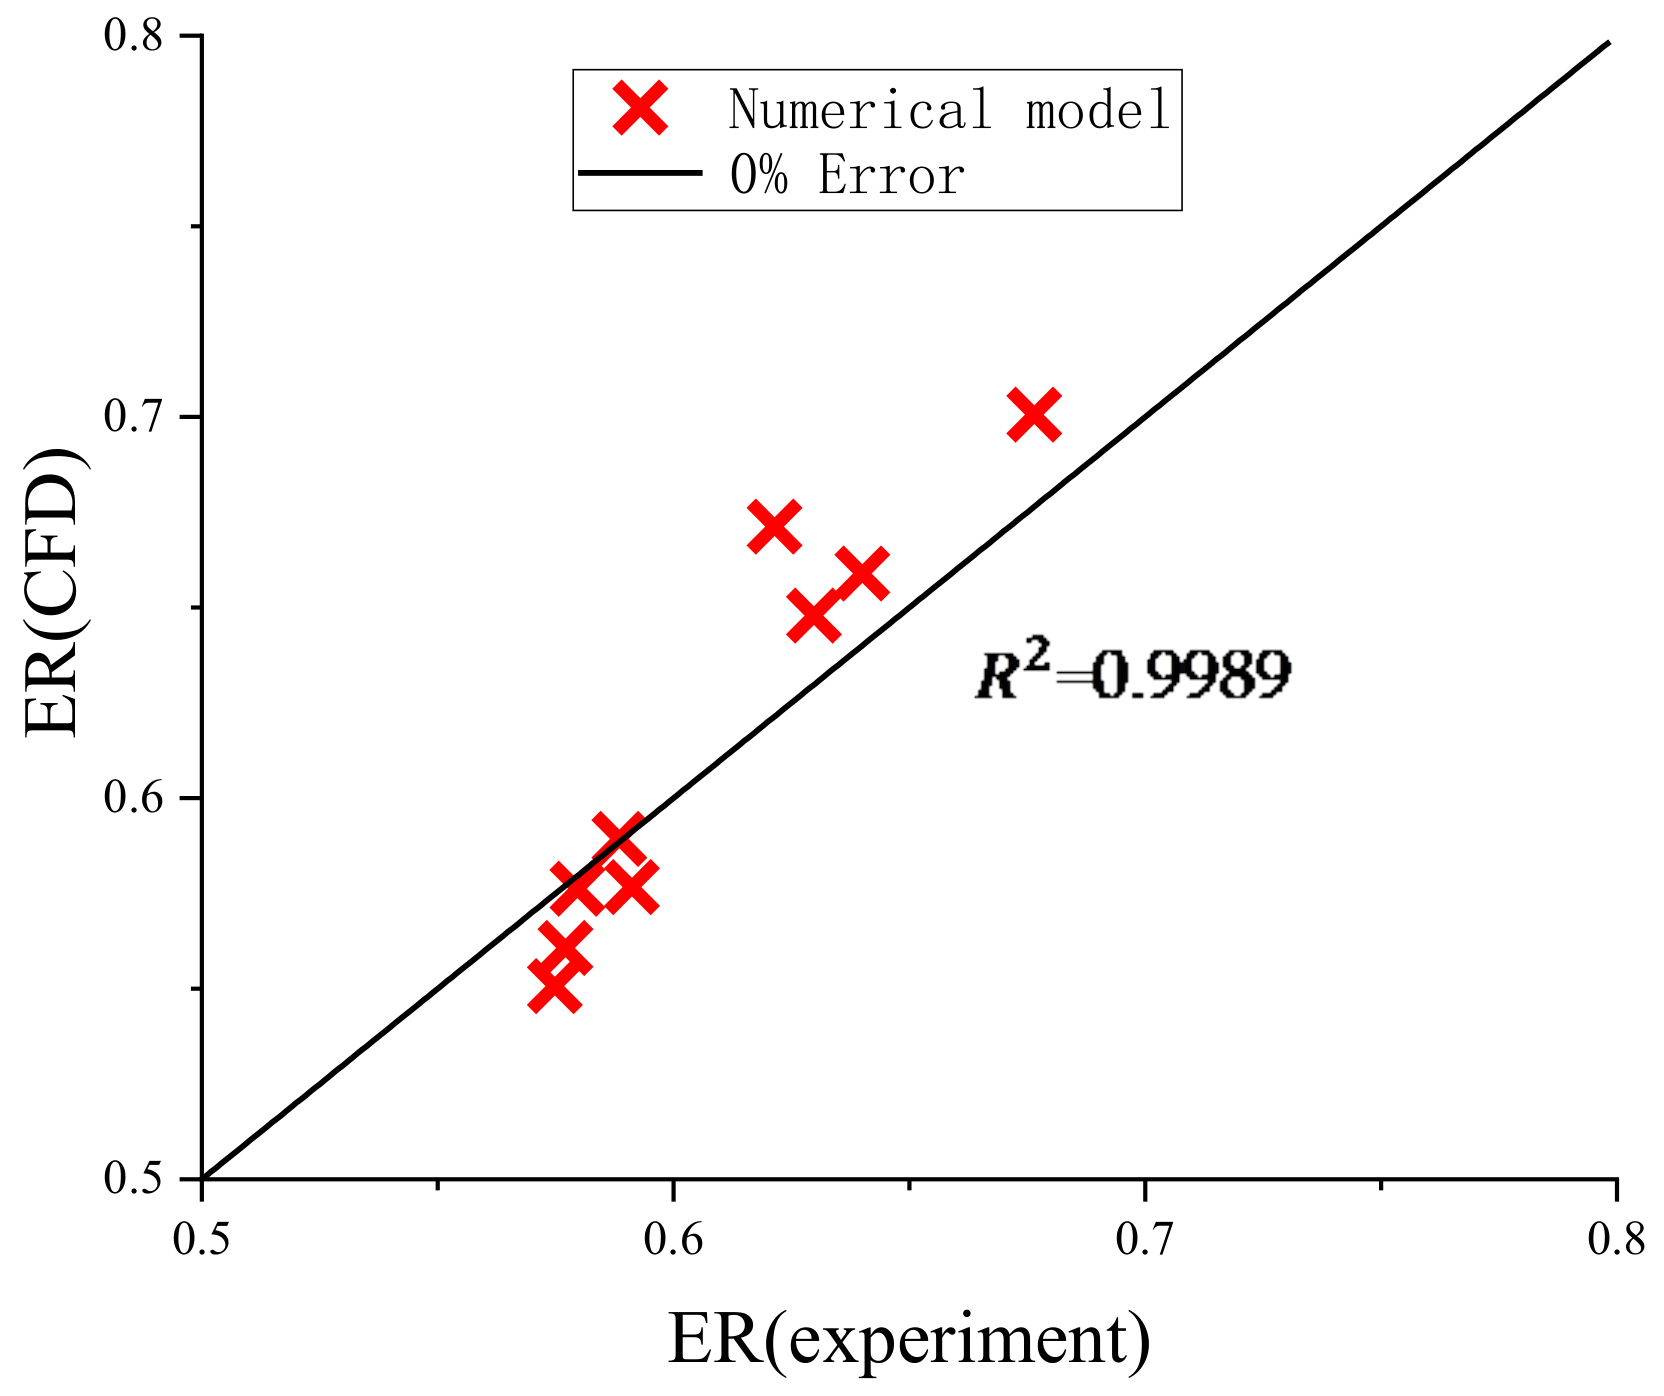
3.5. Experimental Verification
4. Results and Discussion
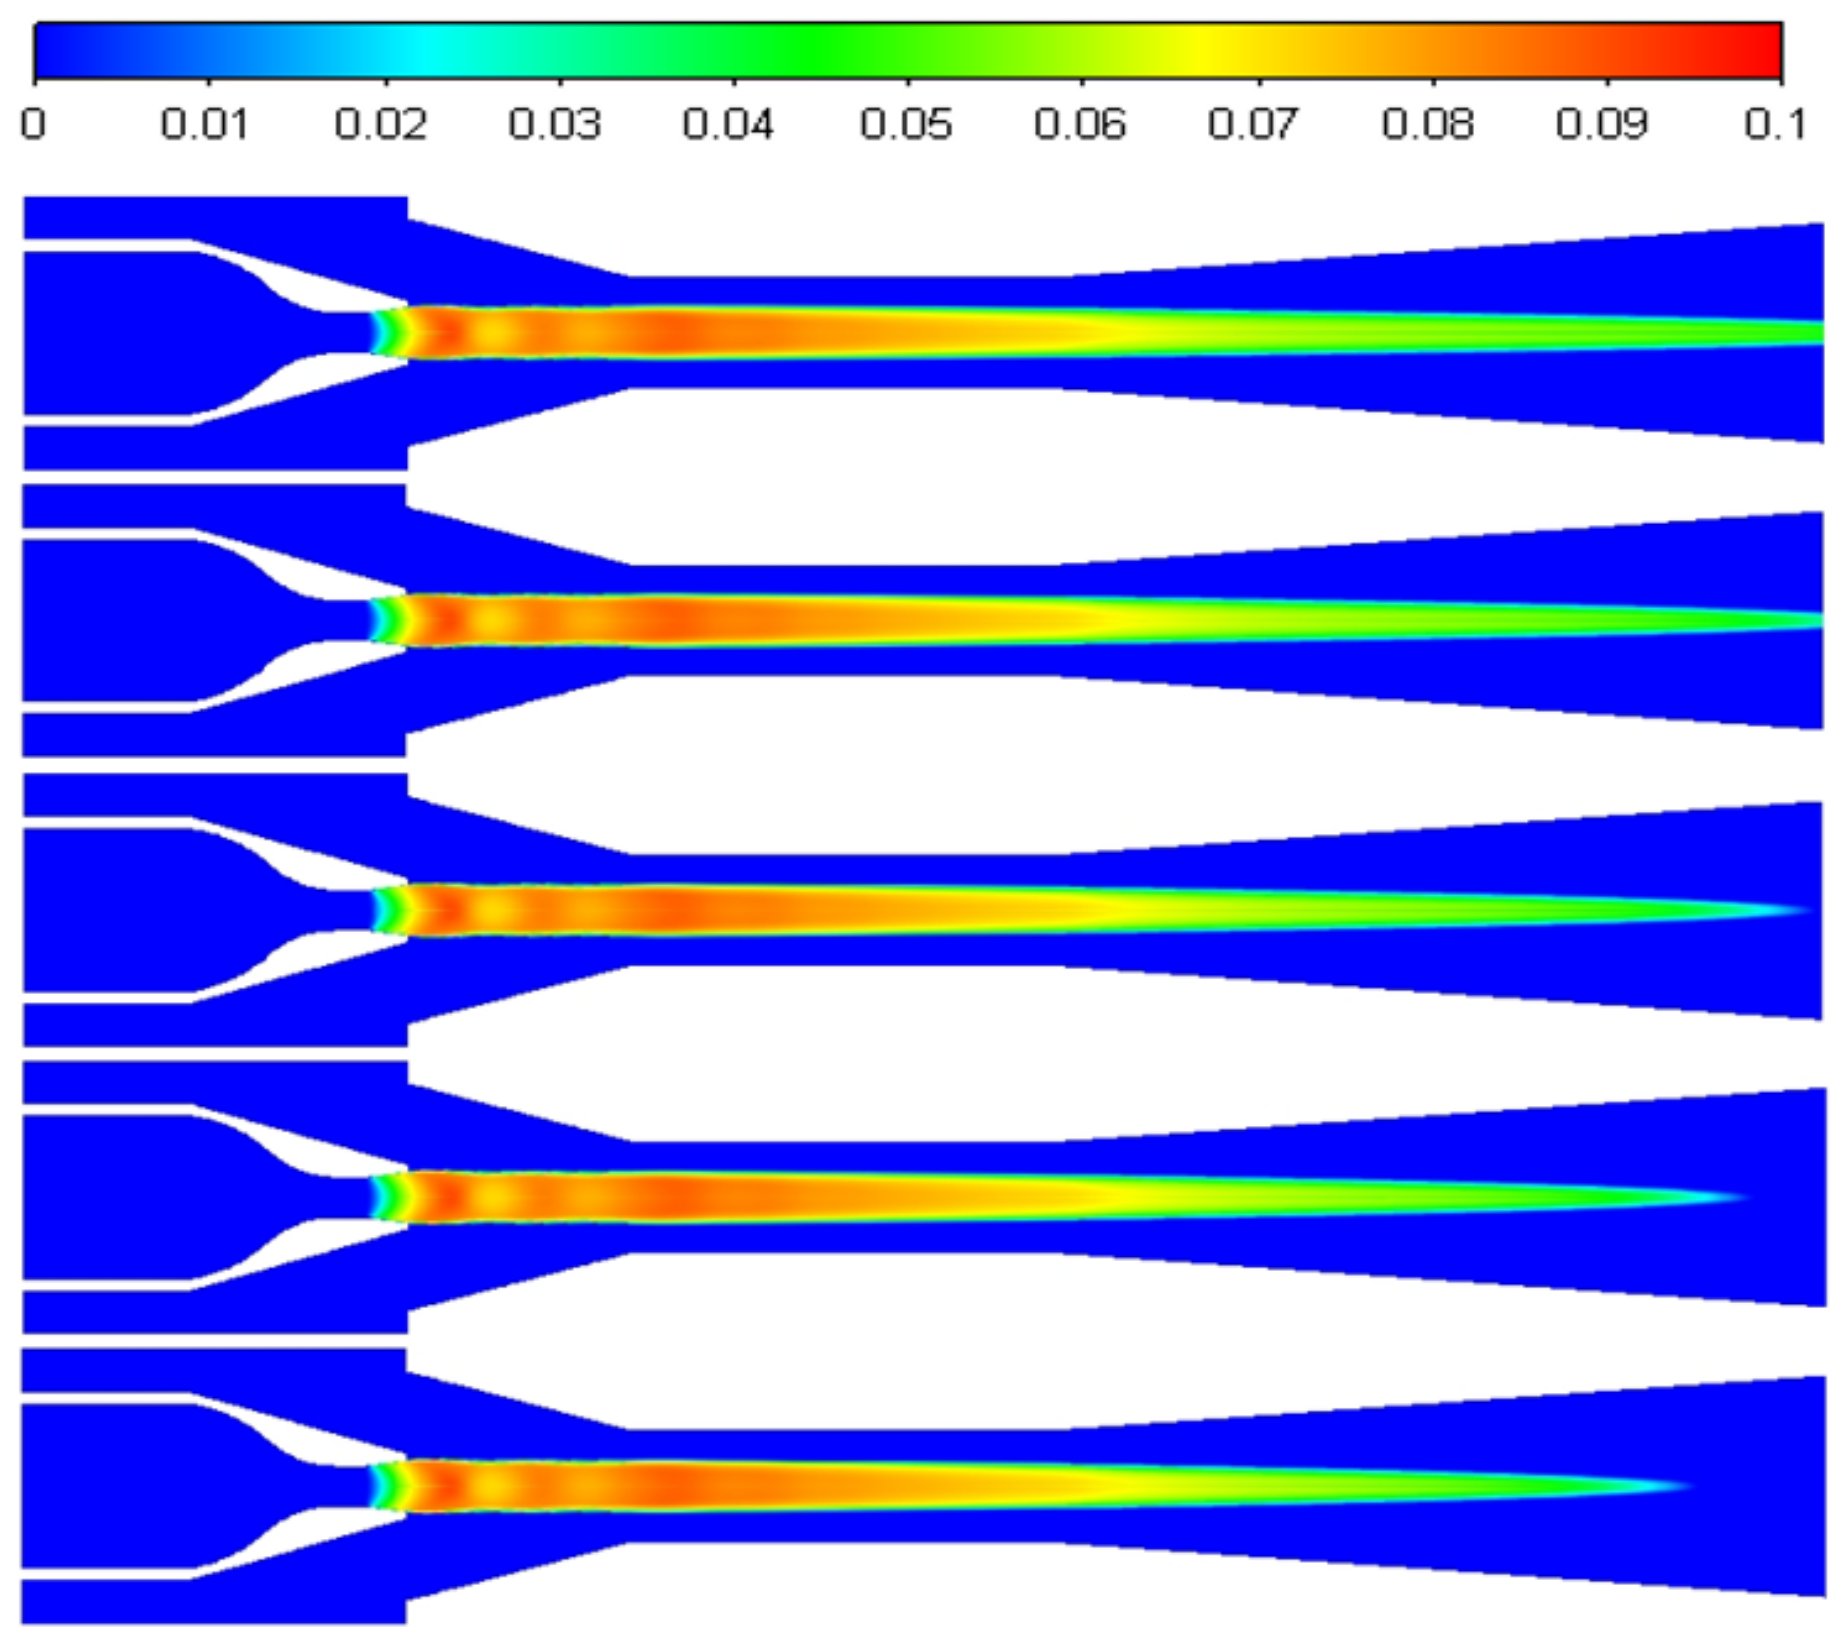
4.1. Effect of Superheat on Ejector Performance
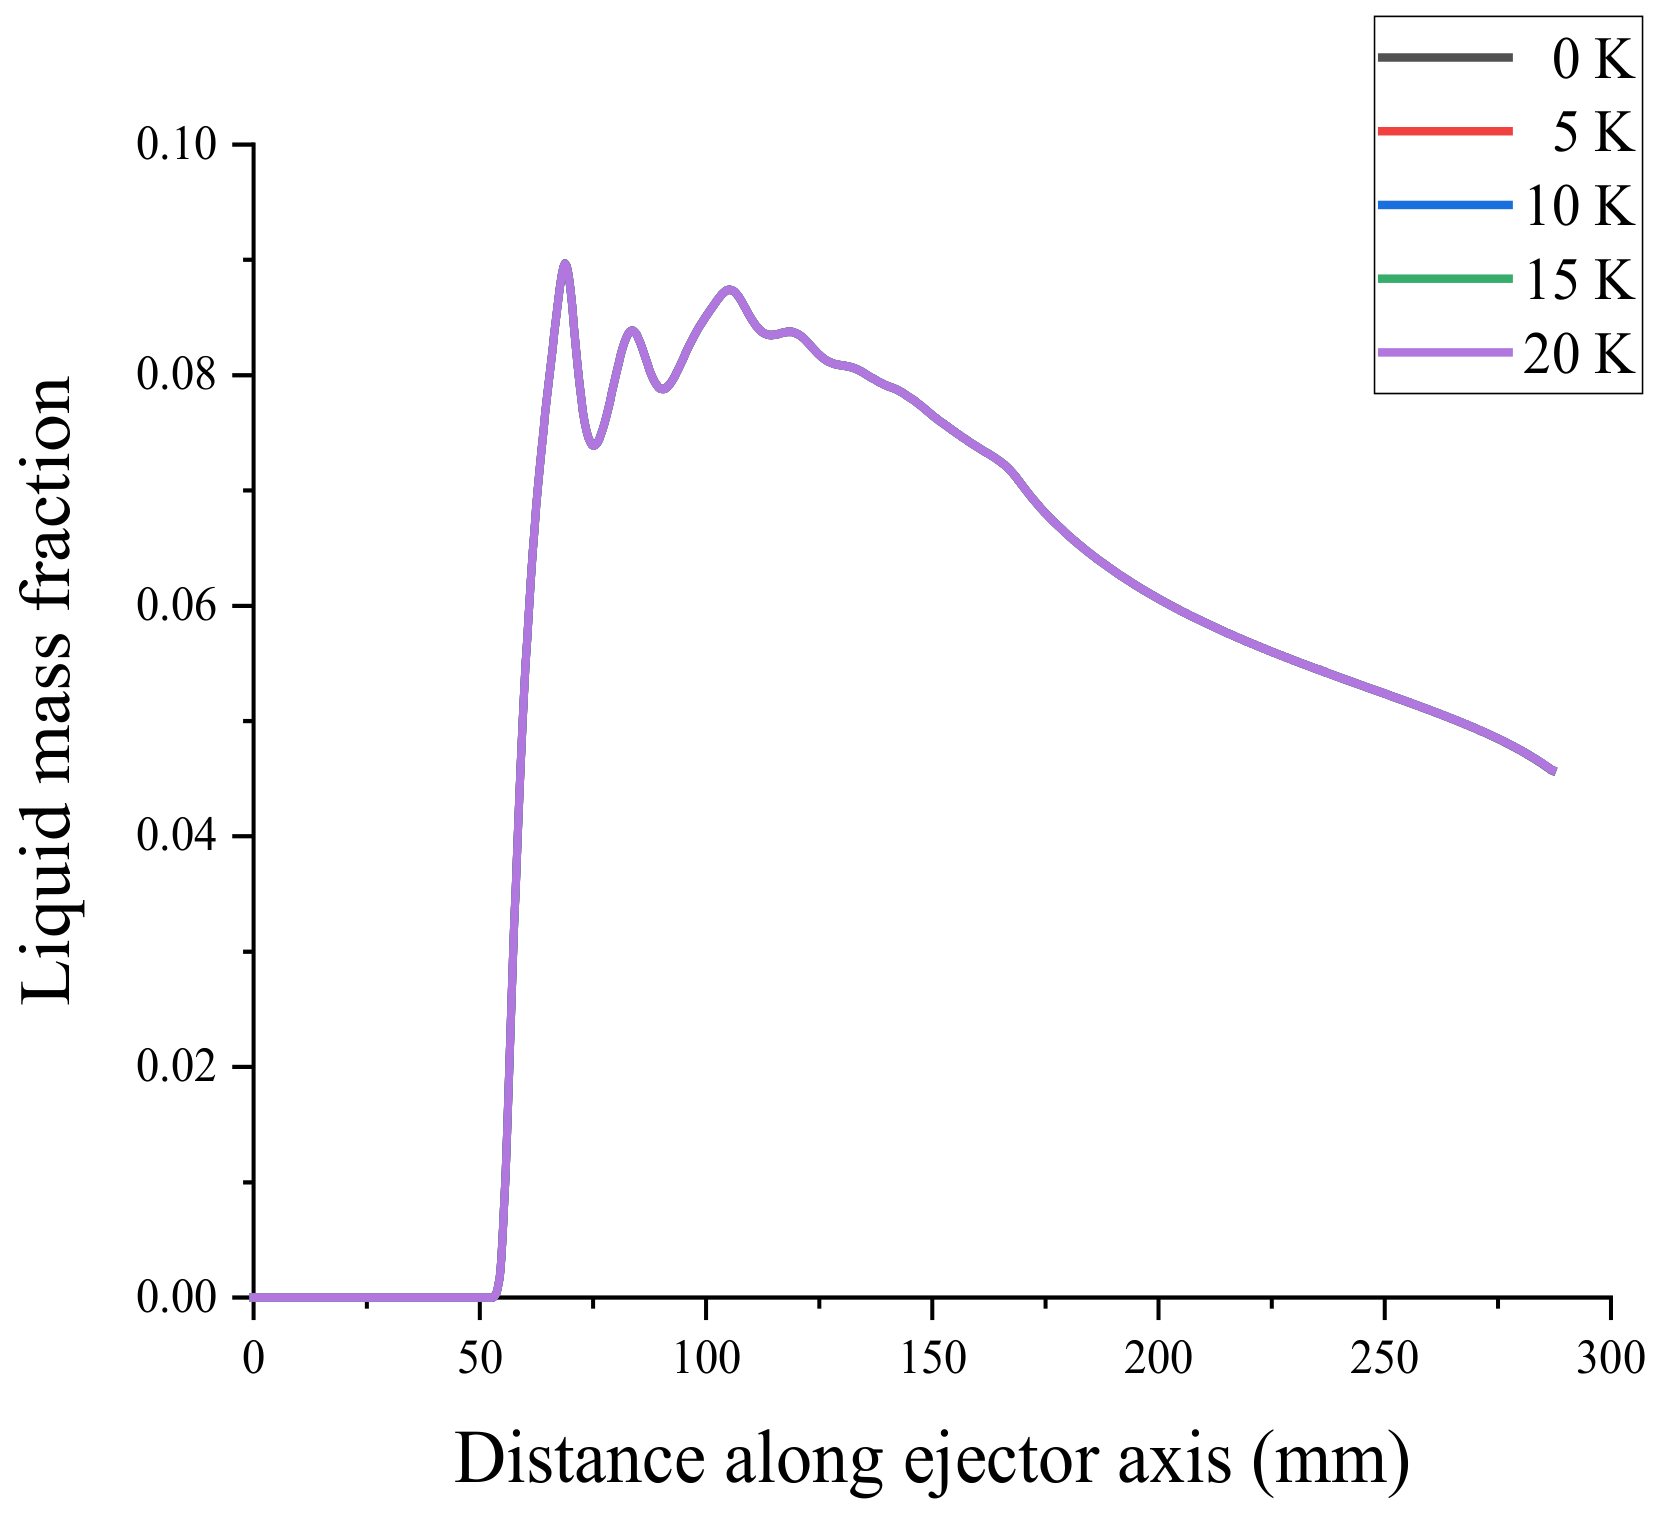
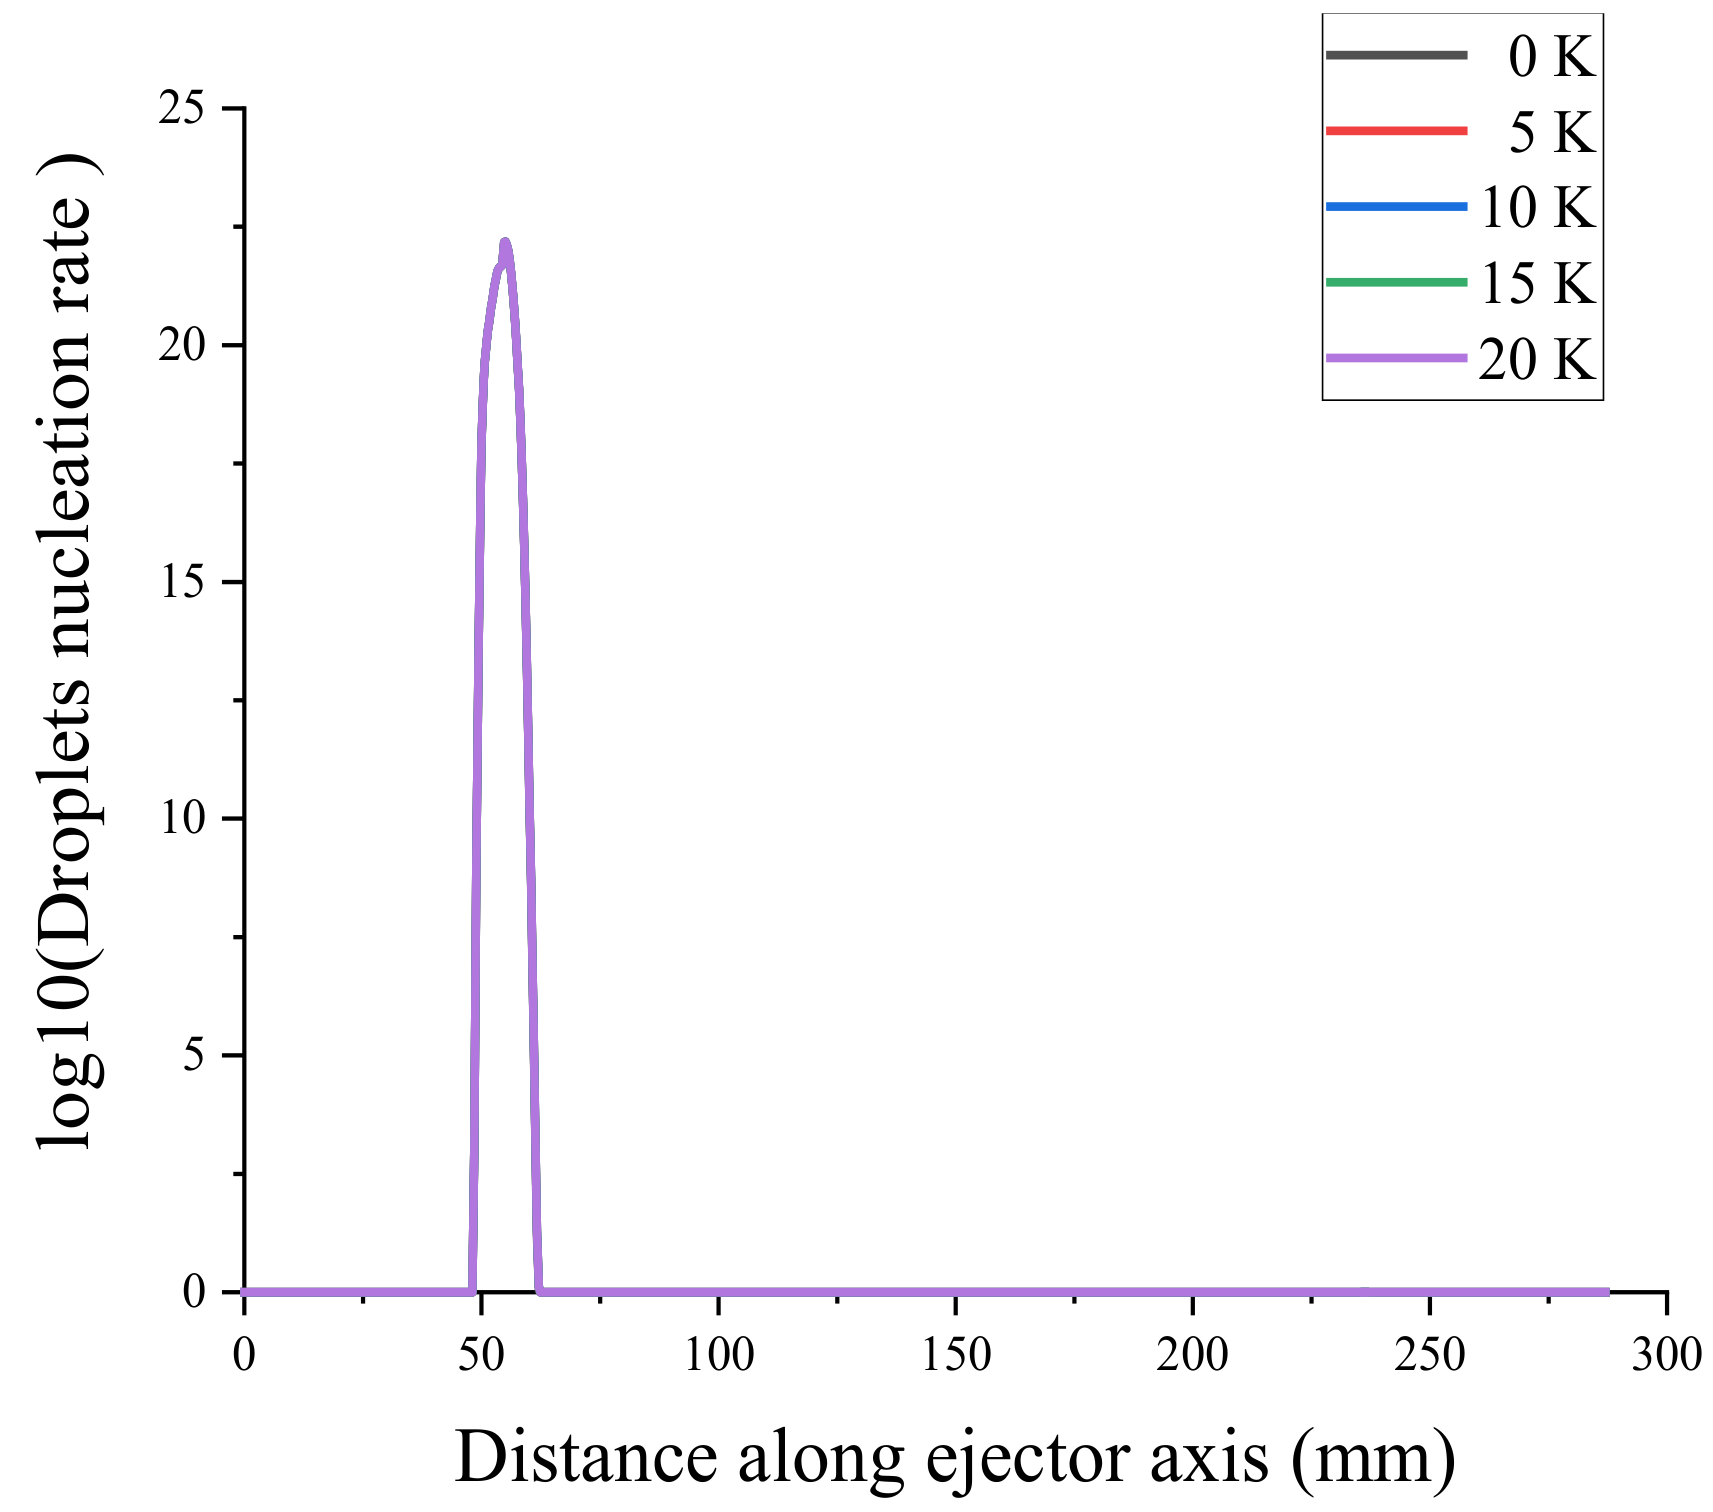
4.2. Effect of Superheat on Non-Equilibrium Condensation
5. Conclusions
Author Contributions
Funding
Data Availability Statement
Acknowledgments
Conflicts of Interest
References
- Tashtoush, B.M.; Moh’d, A.A.-N.; Khasawneh, M.A. A comprehensive review of ejector design, performance, and applications. Appl. Energy 2019, 240, 138–172. [Google Scholar] [CrossRef]
- Aidoun, Z.; Ameur, K.; Falsafioon, M.; Bdache, M. Current advances in ejector modeling, experimentation and applications for refrigeration and heat pumps. Part 1: Single-phase ejectors. Inventions 2019, 4, 15. [Google Scholar] [CrossRef] [Green Version]
- Gu, W.; Wang, X.; Wang, L.; Yin, X.; Liu, H. Performance investigation of an auto-tuning area ratio ejector for MED-TVC desalination system. Appl. Therm. Eng. 2019, 155, 470–479. [Google Scholar] [CrossRef]
- Keenan, J.H.; Neumann, E.P.; Lustwerk, F. An investigation of ejector design by analysis and experiment. J. Appl. Mech. 1950, 17, 299–309. [Google Scholar] [CrossRef]
- Huang, B.J.; Chang, J.M.; Wang, C.P.; Pertrenko, V.A. A 1-D analysis of ejector performance. Int. J. Refrig. 1999, 22, 354–364. [Google Scholar] [CrossRef]
- Chen, W.X.; Liu, M.; Chong, D.T.; Yan, J.; Little, A.B.; Bartosiewicz, Y. A 1D model to predict ejector performance at critical and sub-critical operational regimes. Int. J. Refrig. 2013, 36, 1750–1761. [Google Scholar] [CrossRef]
- Huang, B.J.; Chang, J.M. Empirical correlation for ejector design. Int. J. Refrig. 1999, 22, 379–388. [Google Scholar] [CrossRef]
- El-Dessouky, H.; Ettouney, H.; Alatiqi, I.; Al-Nuwaibit, G. Evaluation of steam jet ejectors. Chem. Eng. Processing: Process Intensif. 2002, 41, 551–561. [Google Scholar] [CrossRef]
- Ruangtrakoon, N.; Aphornratana, S. Design of steam ejector in a refrigeration application based on thermodynamic performance analysis. Sustain. Energy Technol. Assess. 2019, 31, 369–382. [Google Scholar] [CrossRef]
- Tashtoush, B.; Nayfeh, Y. Energy and economic analysis of a variable-geometry ejector in solar cooling systems for residential buildings. J. Energy Storage 2020, 27, 101061. [Google Scholar] [CrossRef]
- Megdouli, K.; Sahli, H.; Tashtoush, B.M.; Nahdi, E.; Kairouani, L. Theoretical research of the performance of a novel enhanced transcritical CO2 refrigeration cycle for power and cold generation. Energy Convers. Manag. 2019, 201, 112139. [Google Scholar] [CrossRef]
- Zeng, M.-Q.; Zhang, X.-L.; Mo, F.-Y.; Zhang, X.-R. Thermodynamic analysis of the effect of internal heat exchanger on the dual-ejector transcritical CO2 cycle for low-temperature refrigeration. Int. J. Energy Res. 2022, 46, 12702–12721. [Google Scholar] [CrossRef]
- Friso, D. Mathematical Modelling of the Entrainment Ratio of High Performance Supersonic Industrial Ejectors. Processes 2022, 10, 88. [Google Scholar] [CrossRef]
- Sun, D.-W. Recent developments in the design theories and applications of ejectors—A review. J. Inst. Energy 1995, 68, 65–79. [Google Scholar]
- Sriveerakul, T.; Aphornratana, S.; Chunnanond, K. Performance prediction of steam ejector using computational fluid dynamics: Part 1. Validation of the CFD results. Int. J. Therm. Sci. 2007, 46, 812–822. [Google Scholar] [CrossRef]
- Sriveerakul, T.; Aphornratana, S.; Chunnanond, K. Performance prediction of steam ejector using computational fluid dynamics: Part 2. Flow structure of a steam ejector influenced by operating pressures and geometries. Int. J. Therm. Sci. 2007, 46, 823–833. [Google Scholar] [CrossRef]
- Rusly, E.; Aye, L.; Charters, W.W.S.; Ooi, A. CFD analysis of ejector in a combined ejector cooling system. Int. J. Refrig. 2005, 28, 1092–1101. [Google Scholar] [CrossRef]
- Wang, X.; Dong, J.; Zhang, G.; Fu, Q.; Li, H.; Han, T.; Tu, J. The primary pseudo-shock pattern of steam ejector and its influence on pumping efficiency based on CFD approach. Energy 2019, 167, 224–234. [Google Scholar] [CrossRef]
- Pianthong, K.; Seehanam, W.; Behnia, M.; Sriveerakul, T.; Aphornratana, S. Investigation and improvement of ejector refrigeration system using computational fluid dynamics technique. Energy Convers. Manag. 2007, 48, 2556–2564. [Google Scholar] [CrossRef]
- Yan, J.; Cai, W.; Li, Y. Geometry parameters effect for air-cooled ejector cooling systems with R134a refrigerant. Renew. Energy 2012, 46, 155–163. [Google Scholar] [CrossRef]
- Carrillo, J.A.E.; de La Flor, F.J.S.; Lissén, J.M.S. Single-phase ejector geometry optimisation by means of a multi-objective evolutionary algorithm and a surrogate CFD model. Energy 2018, 164, 46–64. [Google Scholar] [CrossRef]
- Cai, L.; He, M.; Huang, K.Z.; Xiong, W. Computational fluid dynamics simulation of the supersonic steam ejector using different condensation model. Therm. Sci. 2019, 23, 1655–1661. [Google Scholar] [CrossRef]
- Ariafar, K.; Buttsworth, D.; Al-Doori, G.; Malpress, R. Effect of mixing on the performance of wet steam ejectors. Energy 2015, 93, 2030–2041. [Google Scholar] [CrossRef]
- Wang, C.; Wang, L.; Zhao, H.; Du, Z.; Ding, Z. Effects of superheated steam on non-equilibrium condensation in ejector primary nozzle. Int. J. Refrig. 2016, 67, 214–226. [Google Scholar] [CrossRef]
- Yang, Y.; Zhu, X.; Yan, Y.; Ding, H.; Wen, C. Performance of supersonic steam ejectors considering the nonequilibrium condensation phenomenon for efficient energy utilisation. Appl. Energy 2019, 242, 157–167. [Google Scholar] [CrossRef] [Green Version]
- Tang, Y.; Liu, Z.; Li, Y.; Wu, H.; Zhang, X.; Yang, N. Visualization experimental study of the condensing flow regime in the transonic mixing process of desalination-oriented steam ejector. Energy Convers. Manag. 2019, 197, 111849. [Google Scholar] [CrossRef]
- Wang, C.; Wang, L.; Gao, R. The effects of superheated refrigerant on ejector performances. In Proceedings of the 2015 IEEE 10th Conference on Industrial Electronics and Applications (ICIEA), Auckland, New Zealand, 15–17 June 2015; pp. 2055–2060. [Google Scholar]
- Wang, X.; Dong, J.; Li, A.; Lei, H.; Tu, J. Numerical study of primary steam superheating effects on steam ejector flow and its pumping performance. Energy 2014, 78, 205–211. [Google Scholar] [CrossRef]
- Zhang, G.; Wang, X.; Pourranjbar, D.; Dykas, S.; Li, H.; Chen, J. The comprehensive analysis of the relationship between the latent heat, entrainment ratio, and ejector performance under different superheating degree conditions considering the non-equilibrium condensation. Appl. Therm. Eng. 2022, 200, 117701. [Google Scholar] [CrossRef]
- Zhang, G.; Zhang, X.; Wang, D.; Jin, Z.; Qin, X. Performance evaluation and operation optimization of the steam ejector based on modified model. Appl. Therm. Eng. 2019, 163, 114388. [Google Scholar] [CrossRef]
- Sun, W.; Ma, X.; Zhang, Y.; Jia, L.; Xue, H. Performance analysis and optimization of a steam ejector through streamlining of the primary nozzle. Case Stud. Therm. Eng. 2021, 27, 101356. [Google Scholar] [CrossRef]
- Young, J.B. An equation of state for steam for turbomachinery and other flow calculations. J. Eng. Gas Turbines Power. 1988, 110, 1–7. [Google Scholar] [CrossRef]
- Aliabadi, M.A.F.; Jahangiri, A.; Khazaee, I.; Lakzian, E. Investigating the effect of water nano-droplets injection into the convergent-divergent nozzle inlet on the wet steam flow using entropy generation analysis. Int. J. Therm. Sci. 2020, 149, 106181. [Google Scholar] [CrossRef]
- Young, J.B. Semi-analytical techniques for investigating thermal non-equilibrium effects in wet steam turbines. Int. J. Heat Fluid Flow 1984, 5, 81–91. [Google Scholar] [CrossRef]
- Xue, H.; Wang, L.; Jia, L.; Xie, C.; Lv, Q. Design and investigation of a two-stage vacuum ejector for MED-TVC system. Appl. Therm. Eng. 2020, 167, 114713. [Google Scholar] [CrossRef]
- Besagni, G.; Inzoli, F. Computational fluid-dynamics modeling of supersonic ejectors: Screening of turbulence modeling approaches. Appl. Therm. Eng. 2017, 117, 122–144. [Google Scholar] [CrossRef]
- Moore, M.J.; Walters, P.T.; Crane, R.I.; Davidson, B.J. Predicting the fog drop size in wet steam turbines. In Wet Steam 4 Conference; Institute of Mechanical Engineers (UK), University of Warwick: Coventry, UK, 1973; Paper C37/73. [Google Scholar]
- Huang, L.; Young, J.B. An analytical solution for the Wilson point in homogeneously nucleating flows. Proc. R. Soc. London. Ser. A Math. Phys. Eng. Sci. 1996, 452, 1459–1473. [Google Scholar]


| Item | Value | Unit |
|---|---|---|
| Nozzle throat length | 5.00 | mm |
| Nozzle throat diameter | 6.50 | mm |
| Nozzle inlet diameter | 26.06 | mm |
| Nozzle outlet diameter | 8.22 | mm |
| Suction chamber length | 61.28 | mm |
| Suction chamber diameter | 43.38 | mm |
| Constant-pressure inlet diameter | 36.21 | mm |
| Constant-pressure length | 35.36 | mm |
| Constant-area length | 68.36 | mm |
| Constant-area diameter | 17.84 | mm |
| Diffusion chamber diameter | 34.93 | mm |
| Diffusion chamber length | 122.00 | mm |
| Item | Temperature (K) | Pressure (kPa) |
|---|---|---|
| Primary inlet | 432.05 | 500.00 |
| Secondary inlet | 376.35 | 12.40 |
| Outlet | 388.50 | 63.00 |
| X (mm) | −250 | −200 | 0 | 500 |
| Y (mm) | ±56.35 | ±56.35 | ±50 | ±72 |
| Times | Tp(K) | Pp(kPa) | Ts(K) | Ps(kPa) | Tb(K) | Pb(kPa) | ERexperiment | ERCFD | Error (%) |
|---|---|---|---|---|---|---|---|---|---|
| 1 | 431.95 | 509.0 | 376.35 | 12.4 | 388.75 | 71.1 | 0.6297 | 0.6478 | 2.87 |
| 2 | 435.15 | 557.2 | 375.85 | 11.1 | 388.85 | 73.7 | 0.6214 | 0.6713 | 8.03 |
| 3 | 434.65 | 542.8 | 374.65 | 6.9 | 387.35 | 65.6 | 0.5748 | 0.5507 | 4.19 |
| 4 | 436.35 | 575.6 | 375.25 | 7.8 | 389.35 | 75.1 | 0.5796 | 0.5762 | −0.59 |
| 5 | 436.35 | 575.6 | 375.05 | 7.0 | 389.15 | 74.1 | 0.5885 | 0.5893 | 0.14 |
| 6 | 435.25 | 552.0 | 373.55 | 2.6 | 386.45 | 60.9 | 0.6765 | 0.7006 | −3.56 |
| 7 | 435.75 | 565.8 | 375.85 | 10.4 | 389.65 | 77.3 | 0.5771 | 0.5607 | −2.84 |
| 8 | 436.45 | 577.8 | 374.04 | 3.5 | 388.45 | 70.3 | 0.5911 | 0.5767 | −2.44 |
| 9 | 436.15 | 570.9 | 376.85 | 14.6 | 389.85 | 78.8 | 0.6400 | 0.6589 | 2.95 |
| 10 | 433.85 | 530.9 | 373.15 | 0.5 | 385.65 | 70.9 | 0.3217 | 0.3074 | 4.44 |
Publisher’s Note: MDPI stays neutral with regard to jurisdictional claims in published maps and institutional affiliations. |
© 2022 by the authors. Licensee MDPI, Basel, Switzerland. This article is an open access article distributed under the terms and conditions of the Creative Commons Attribution (CC BY) license (https://creativecommons.org/licenses/by/4.0/).
Share and Cite
Yang, B.; Ma, X.; Zhang, H.; Sun, W.; Jia, L.; Xue, H. Effect of Superheat Steam on Ejector in Distilled Water Preparation System for Medical Injection. Entropy 2022, 24, 960. https://doi.org/10.3390/e24070960
Yang B, Ma X, Zhang H, Sun W, Jia L, Xue H. Effect of Superheat Steam on Ejector in Distilled Water Preparation System for Medical Injection. Entropy. 2022; 24(7):960. https://doi.org/10.3390/e24070960
Chicago/Turabian StyleYang, Bin, Xiaojing Ma, Hailun Zhang, Wenxu Sun, Lei Jia, and Haoyuan Xue. 2022. "Effect of Superheat Steam on Ejector in Distilled Water Preparation System for Medical Injection" Entropy 24, no. 7: 960. https://doi.org/10.3390/e24070960