
Behavior Variations and Their Implications for Popularity Promotions: From Elites to Mass on Weibo


Abstract
:1. Introduction
- RQ1. What are the behavioral differences between the mass and elites across various user groups and content domains?
- RQ2. Are there differences between the actions of the mass and elites to promote content popularity?
- RQ3. How to choose promotion strategies suitable for various user groups and content domains?
- This study is the first to disclose the behavior variations from elites to the mass across user groups and multiple domains in social media. With regard to splitting users into five groups and the contents into seven domains, an accurate and complete spectrum of behavior variations across domains is comprehensively established. With the help of a spectrum, what kinds of users targeted as behaviorally influential seeds in marketing-like applications can be optimally pinpointed.
- Comprehensive mapping between behavior variations and popularity promotions is established in rich perspectives ranging from activity patterns to various content characteristics. In particular, though targeting influentials are extensively exploited, this is the first time to study the popularity promotion for the mass. Appropriate strategies for popularity enhancement can accordingly be derived from the mapping in terms of taking both user groups and content domains into account.
- Machine learning and network analysis are jointly employed in this study, which enriches the practical methodologies in probing massive users in a communication study. Driven by massive tweets and huge retweet networks on Weibo, solutions involving artificial intelligence and intensive calculations are conducted to split user groups, cut content domains and draw the mapping, overcoming the high costs and low efficiency of conventional approaches.
2. Literature Review
2.1. Differences in Behavior between Elites and the Mass
2.2. Behavior for Popularity Promotions
3. Materials and Methods
3.1. Weibo Data Set
3.2. User Groups
3.3. Domain Classifier
3.4. Selection of Elites
4. Behavior Variations between the Mass and Elites
4.1. Tweeting
4.1.1. Tweeting Activity
4.1.2. Content Diversity
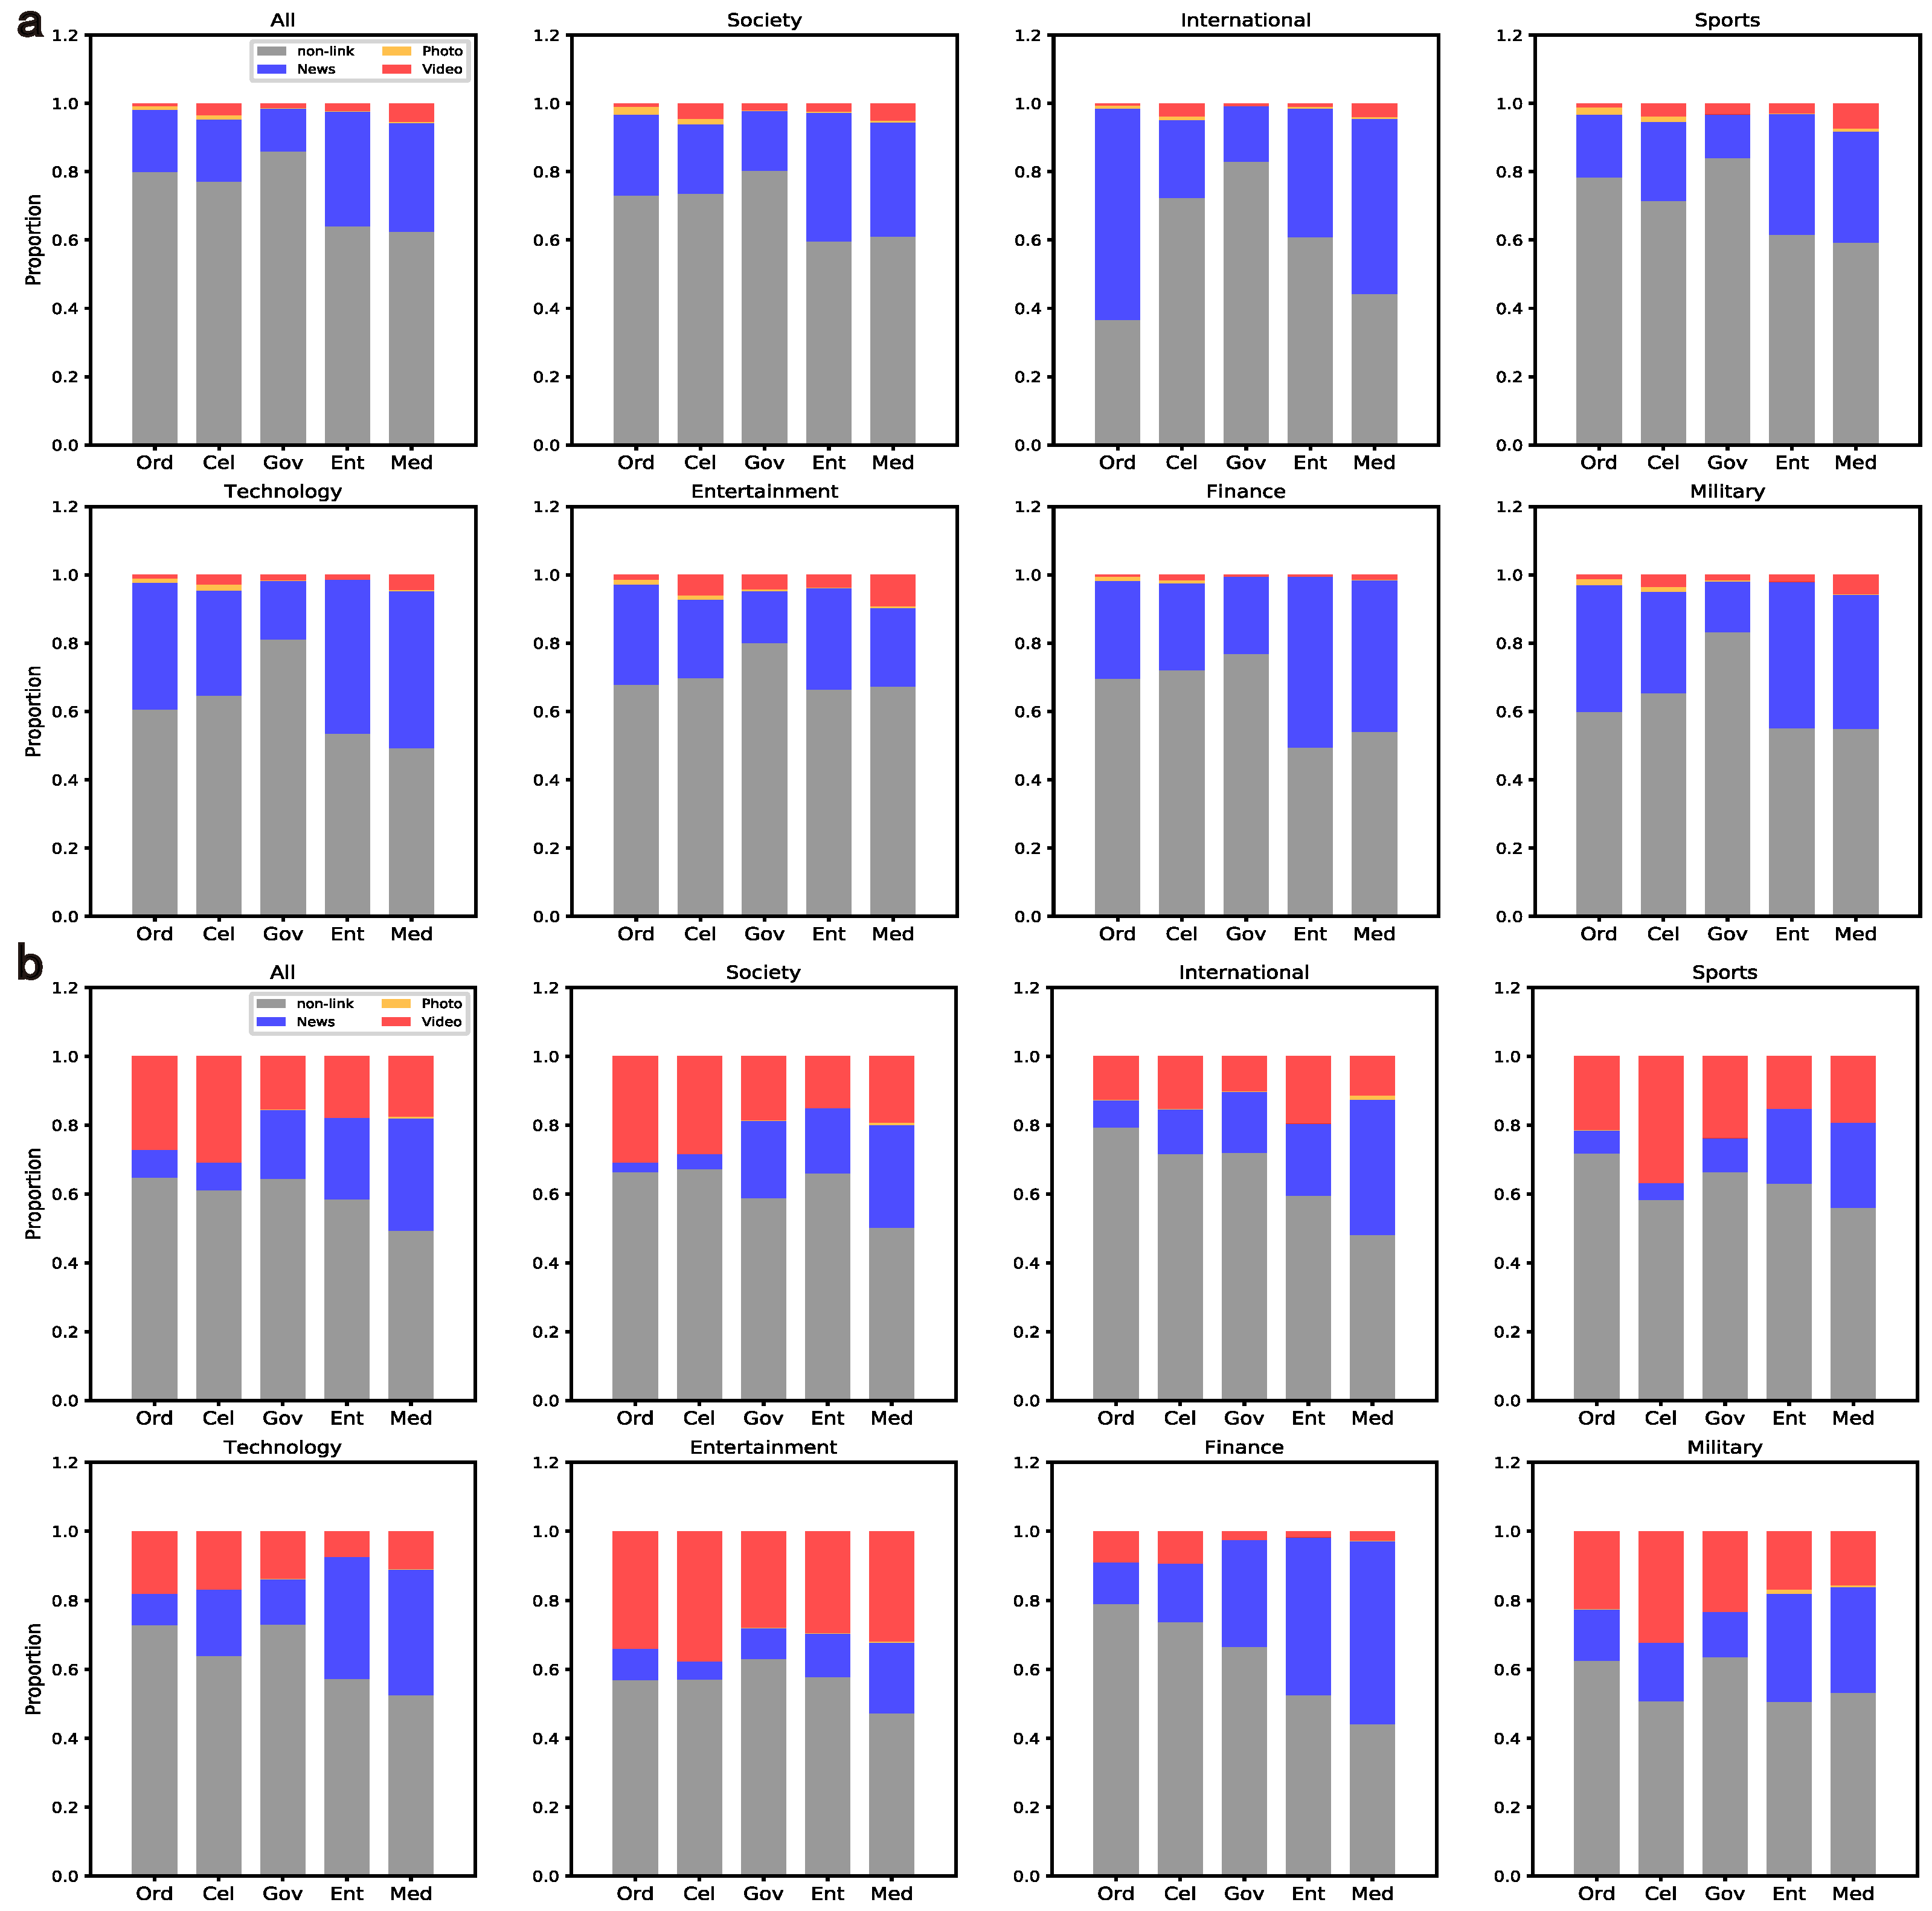
4.1.3. Content Links
4.2. Retweeting
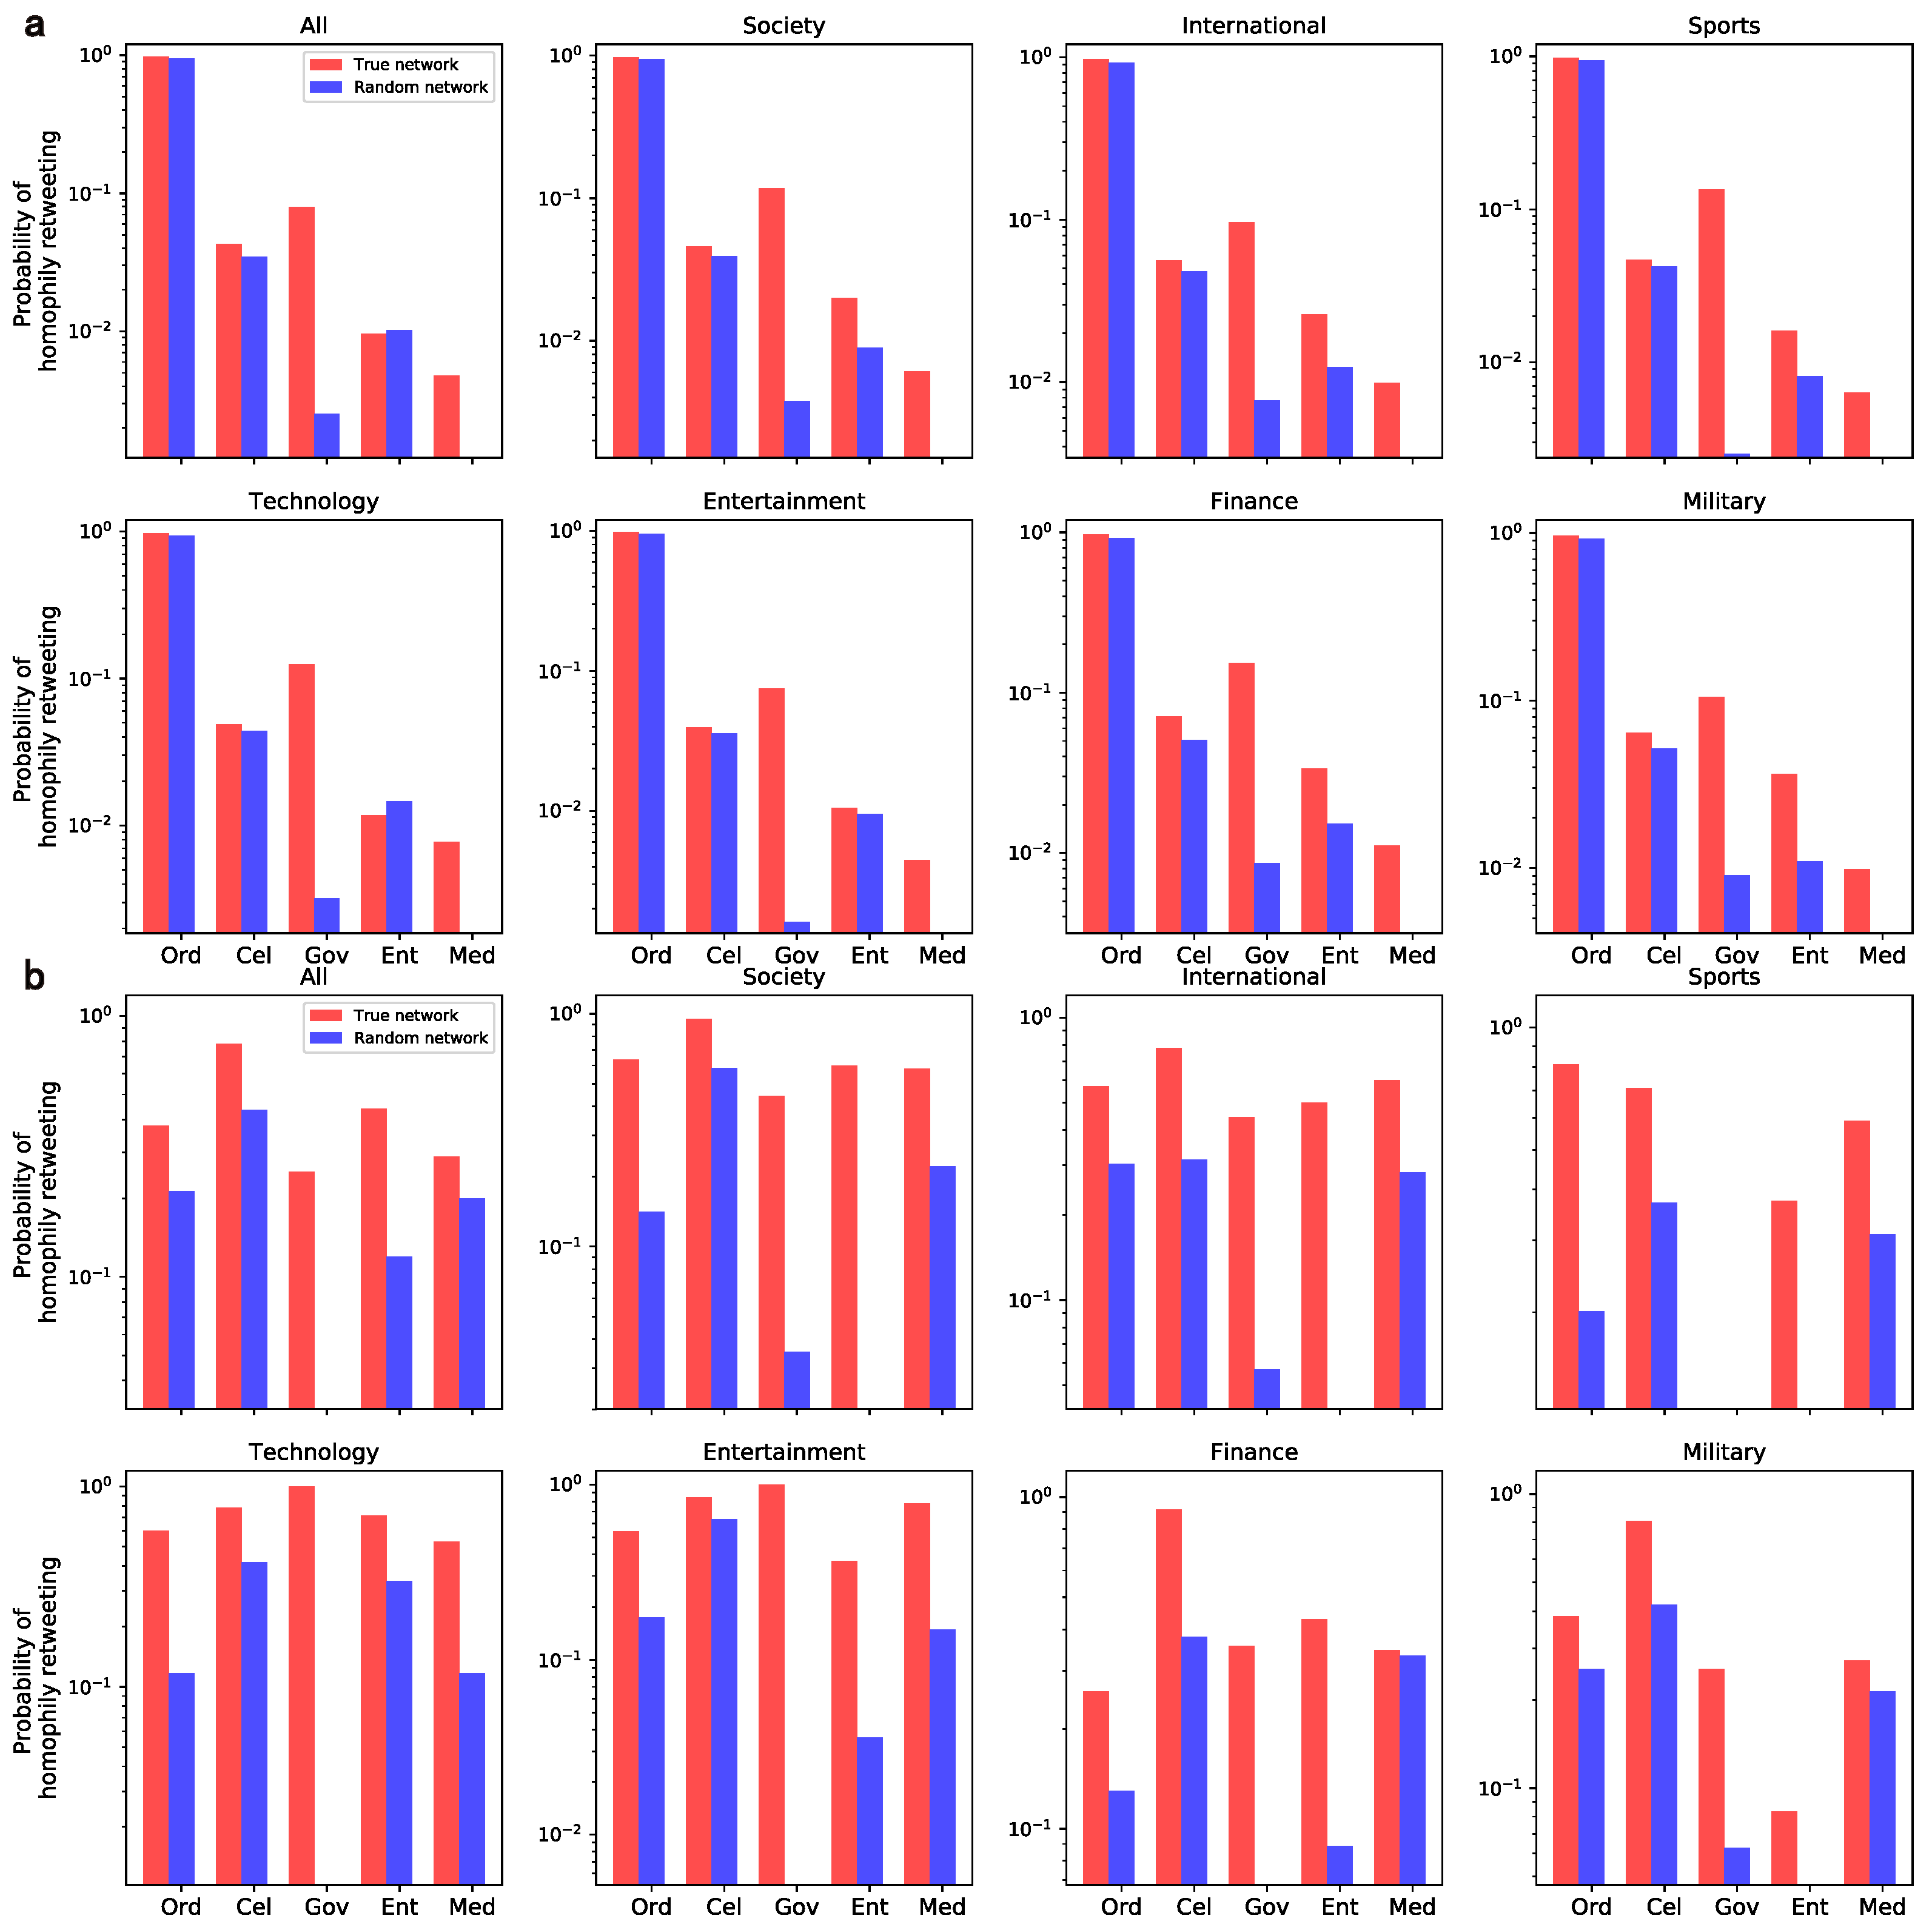
4.2.1. Homophily
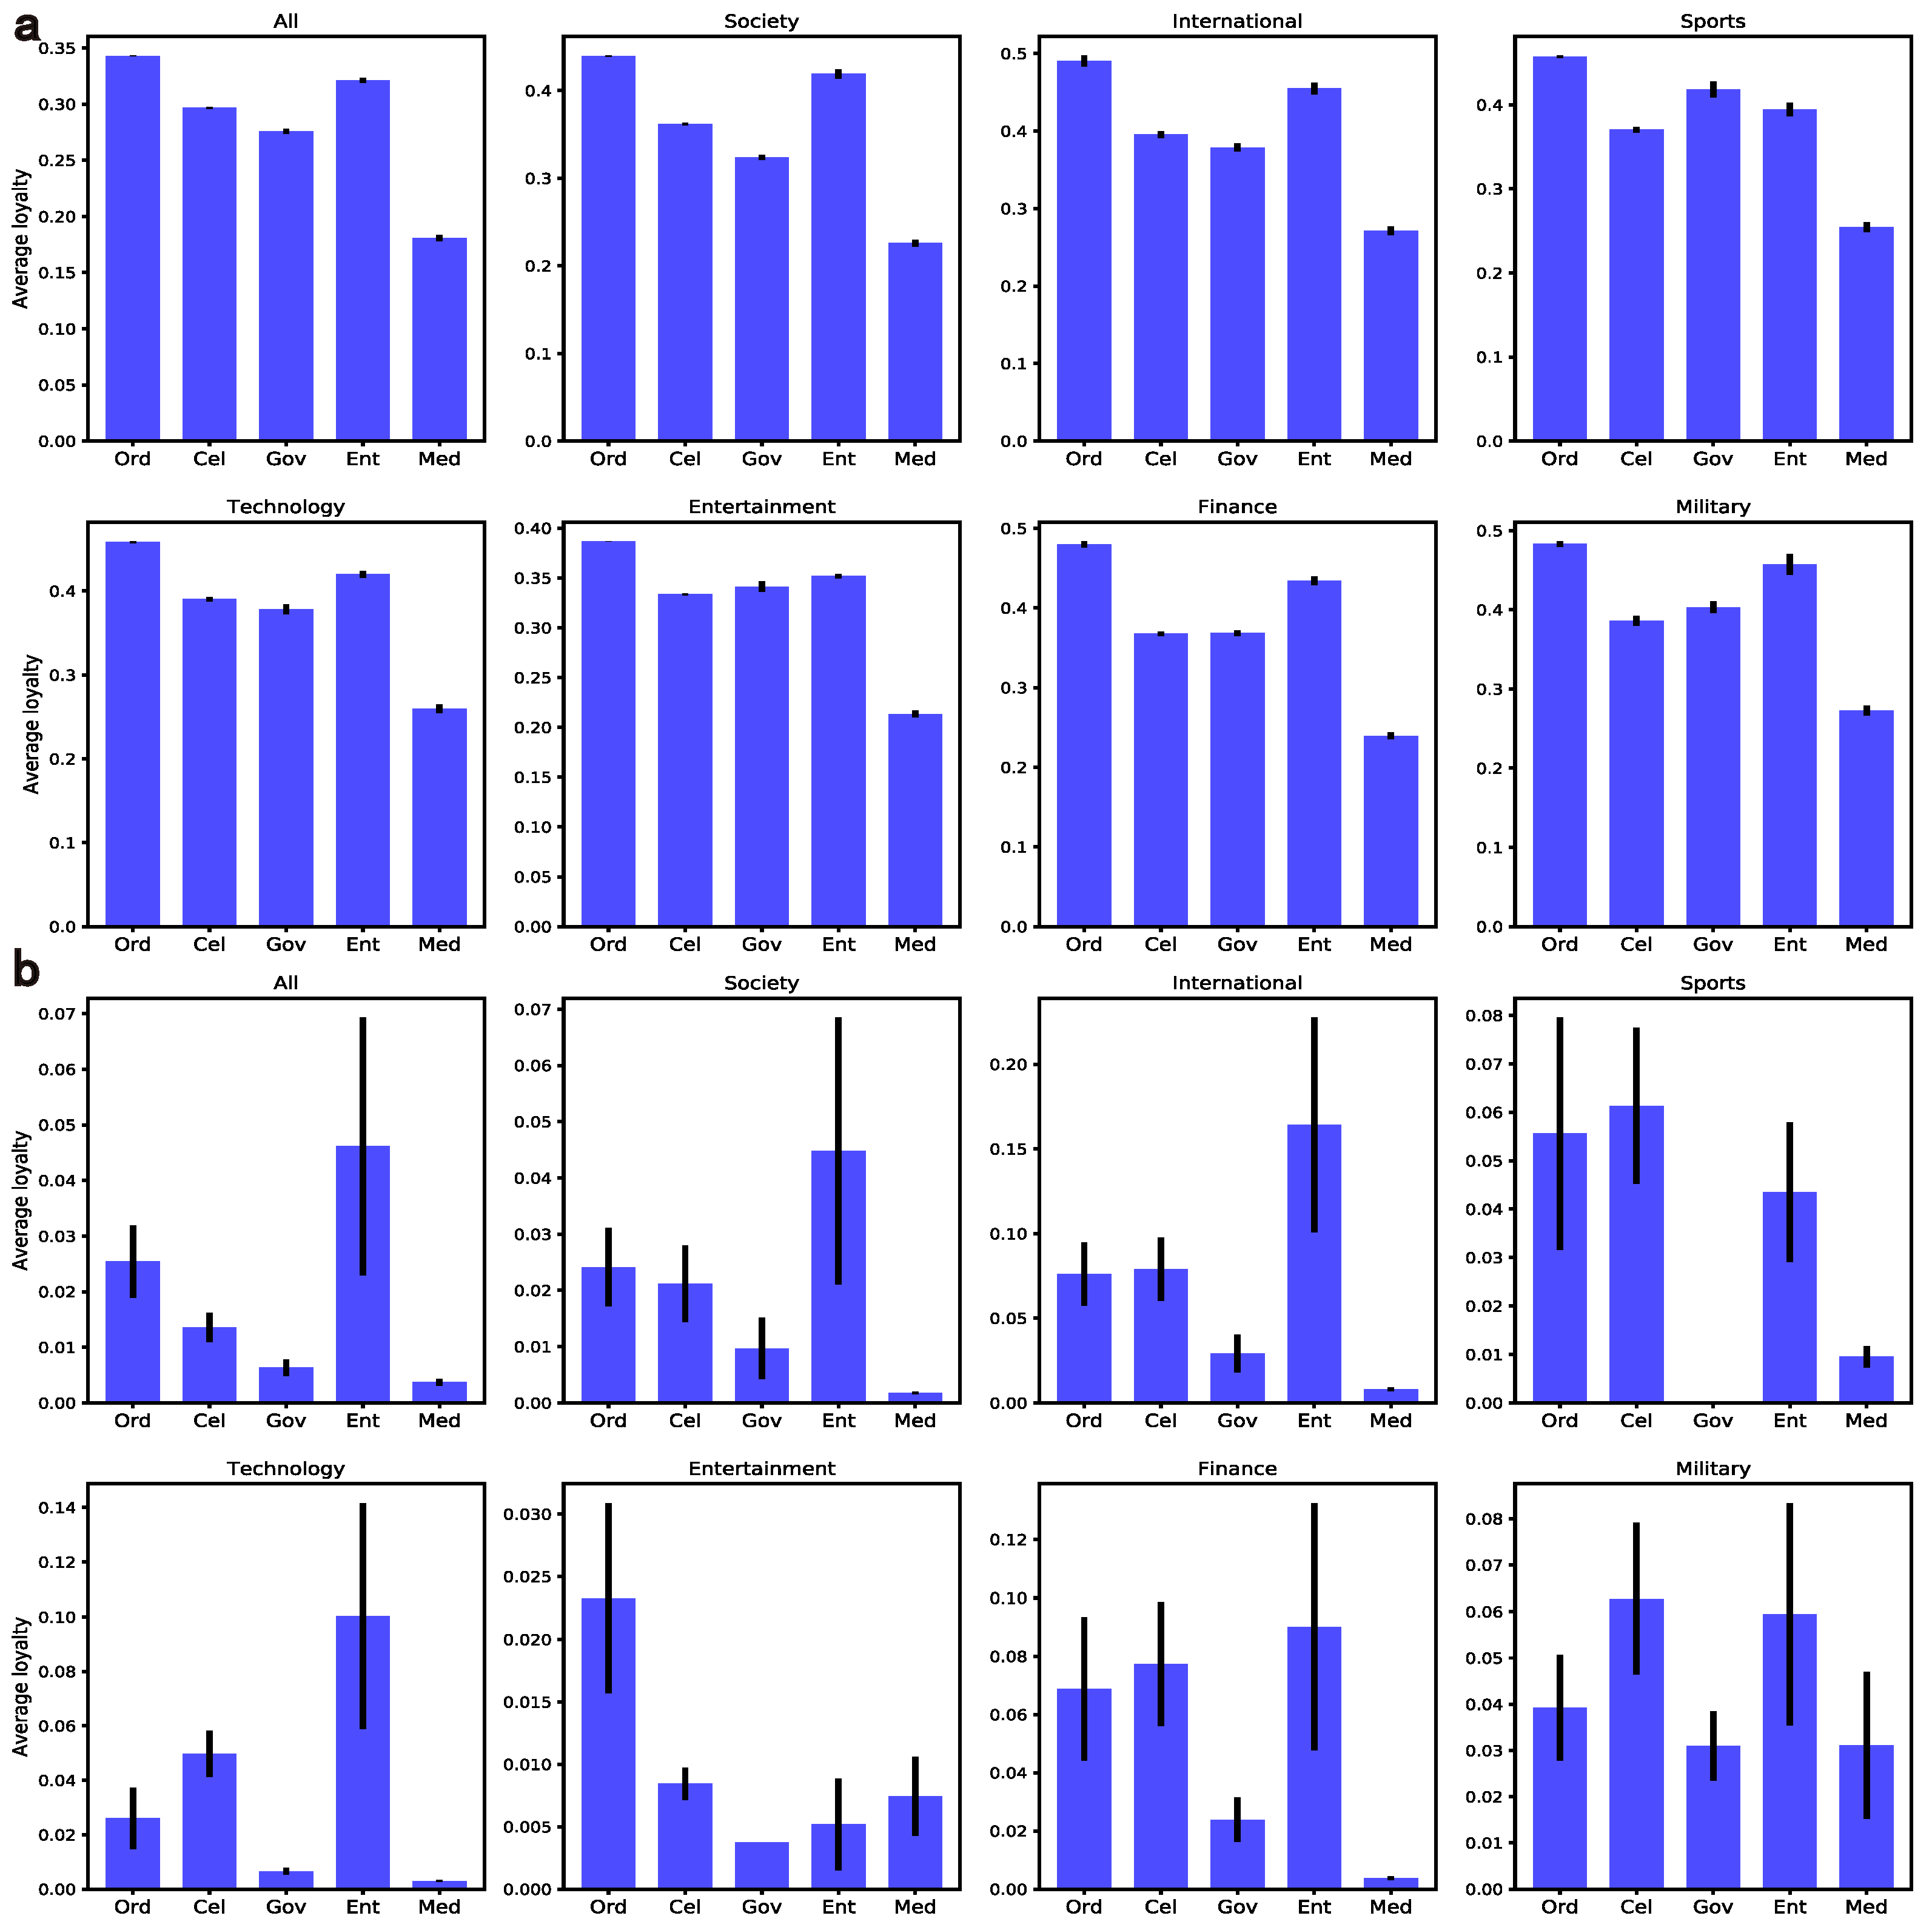
4.2.2. Loyalty
5. User-Oriented Actions for Popularity Promotions
5.1. Content Diversity
5.2. Content Links
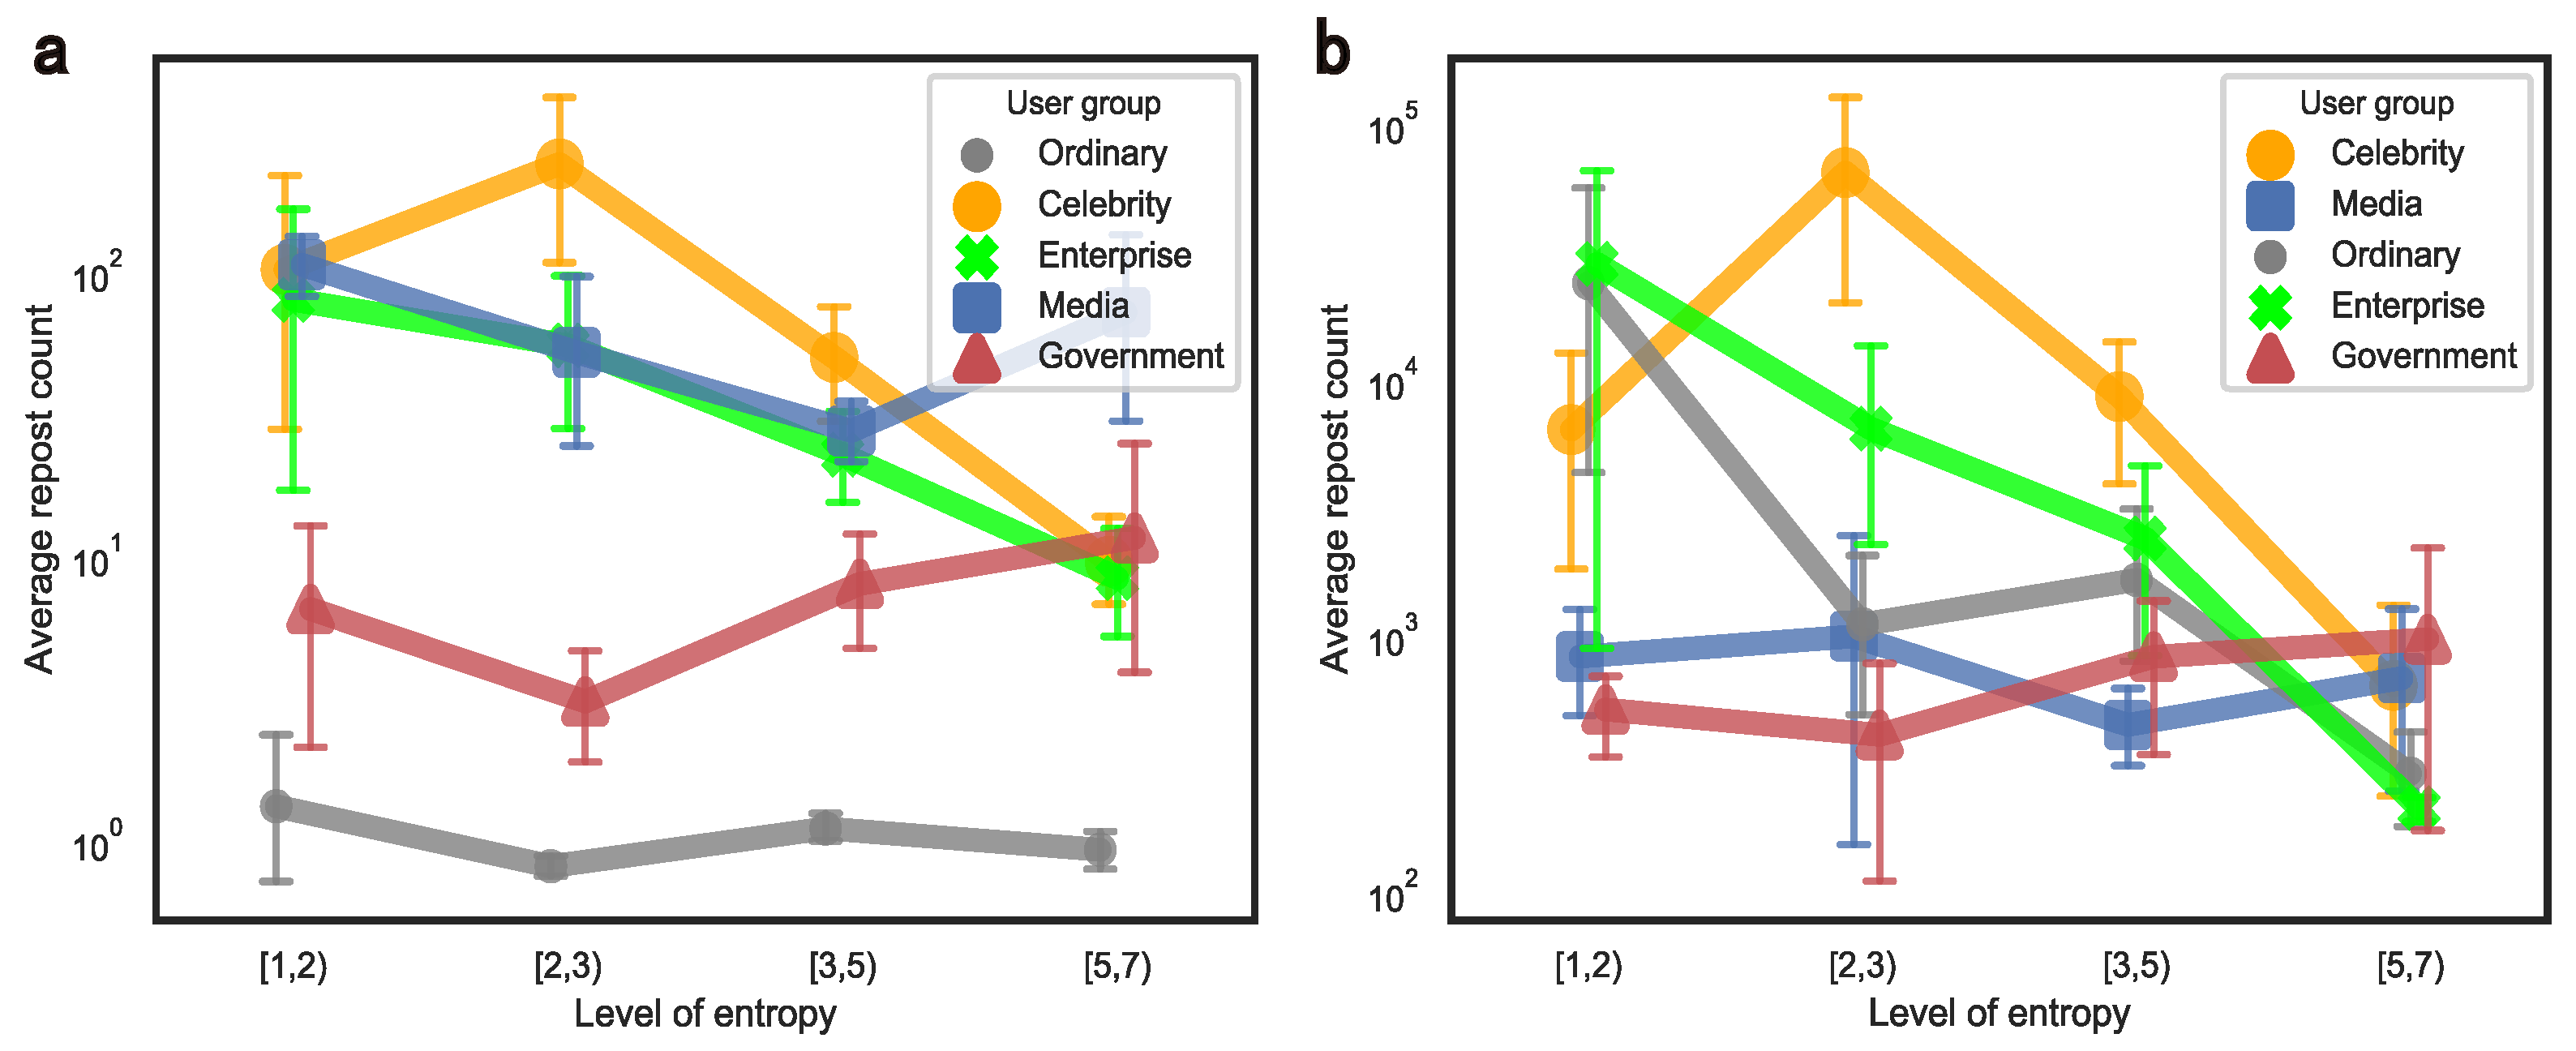
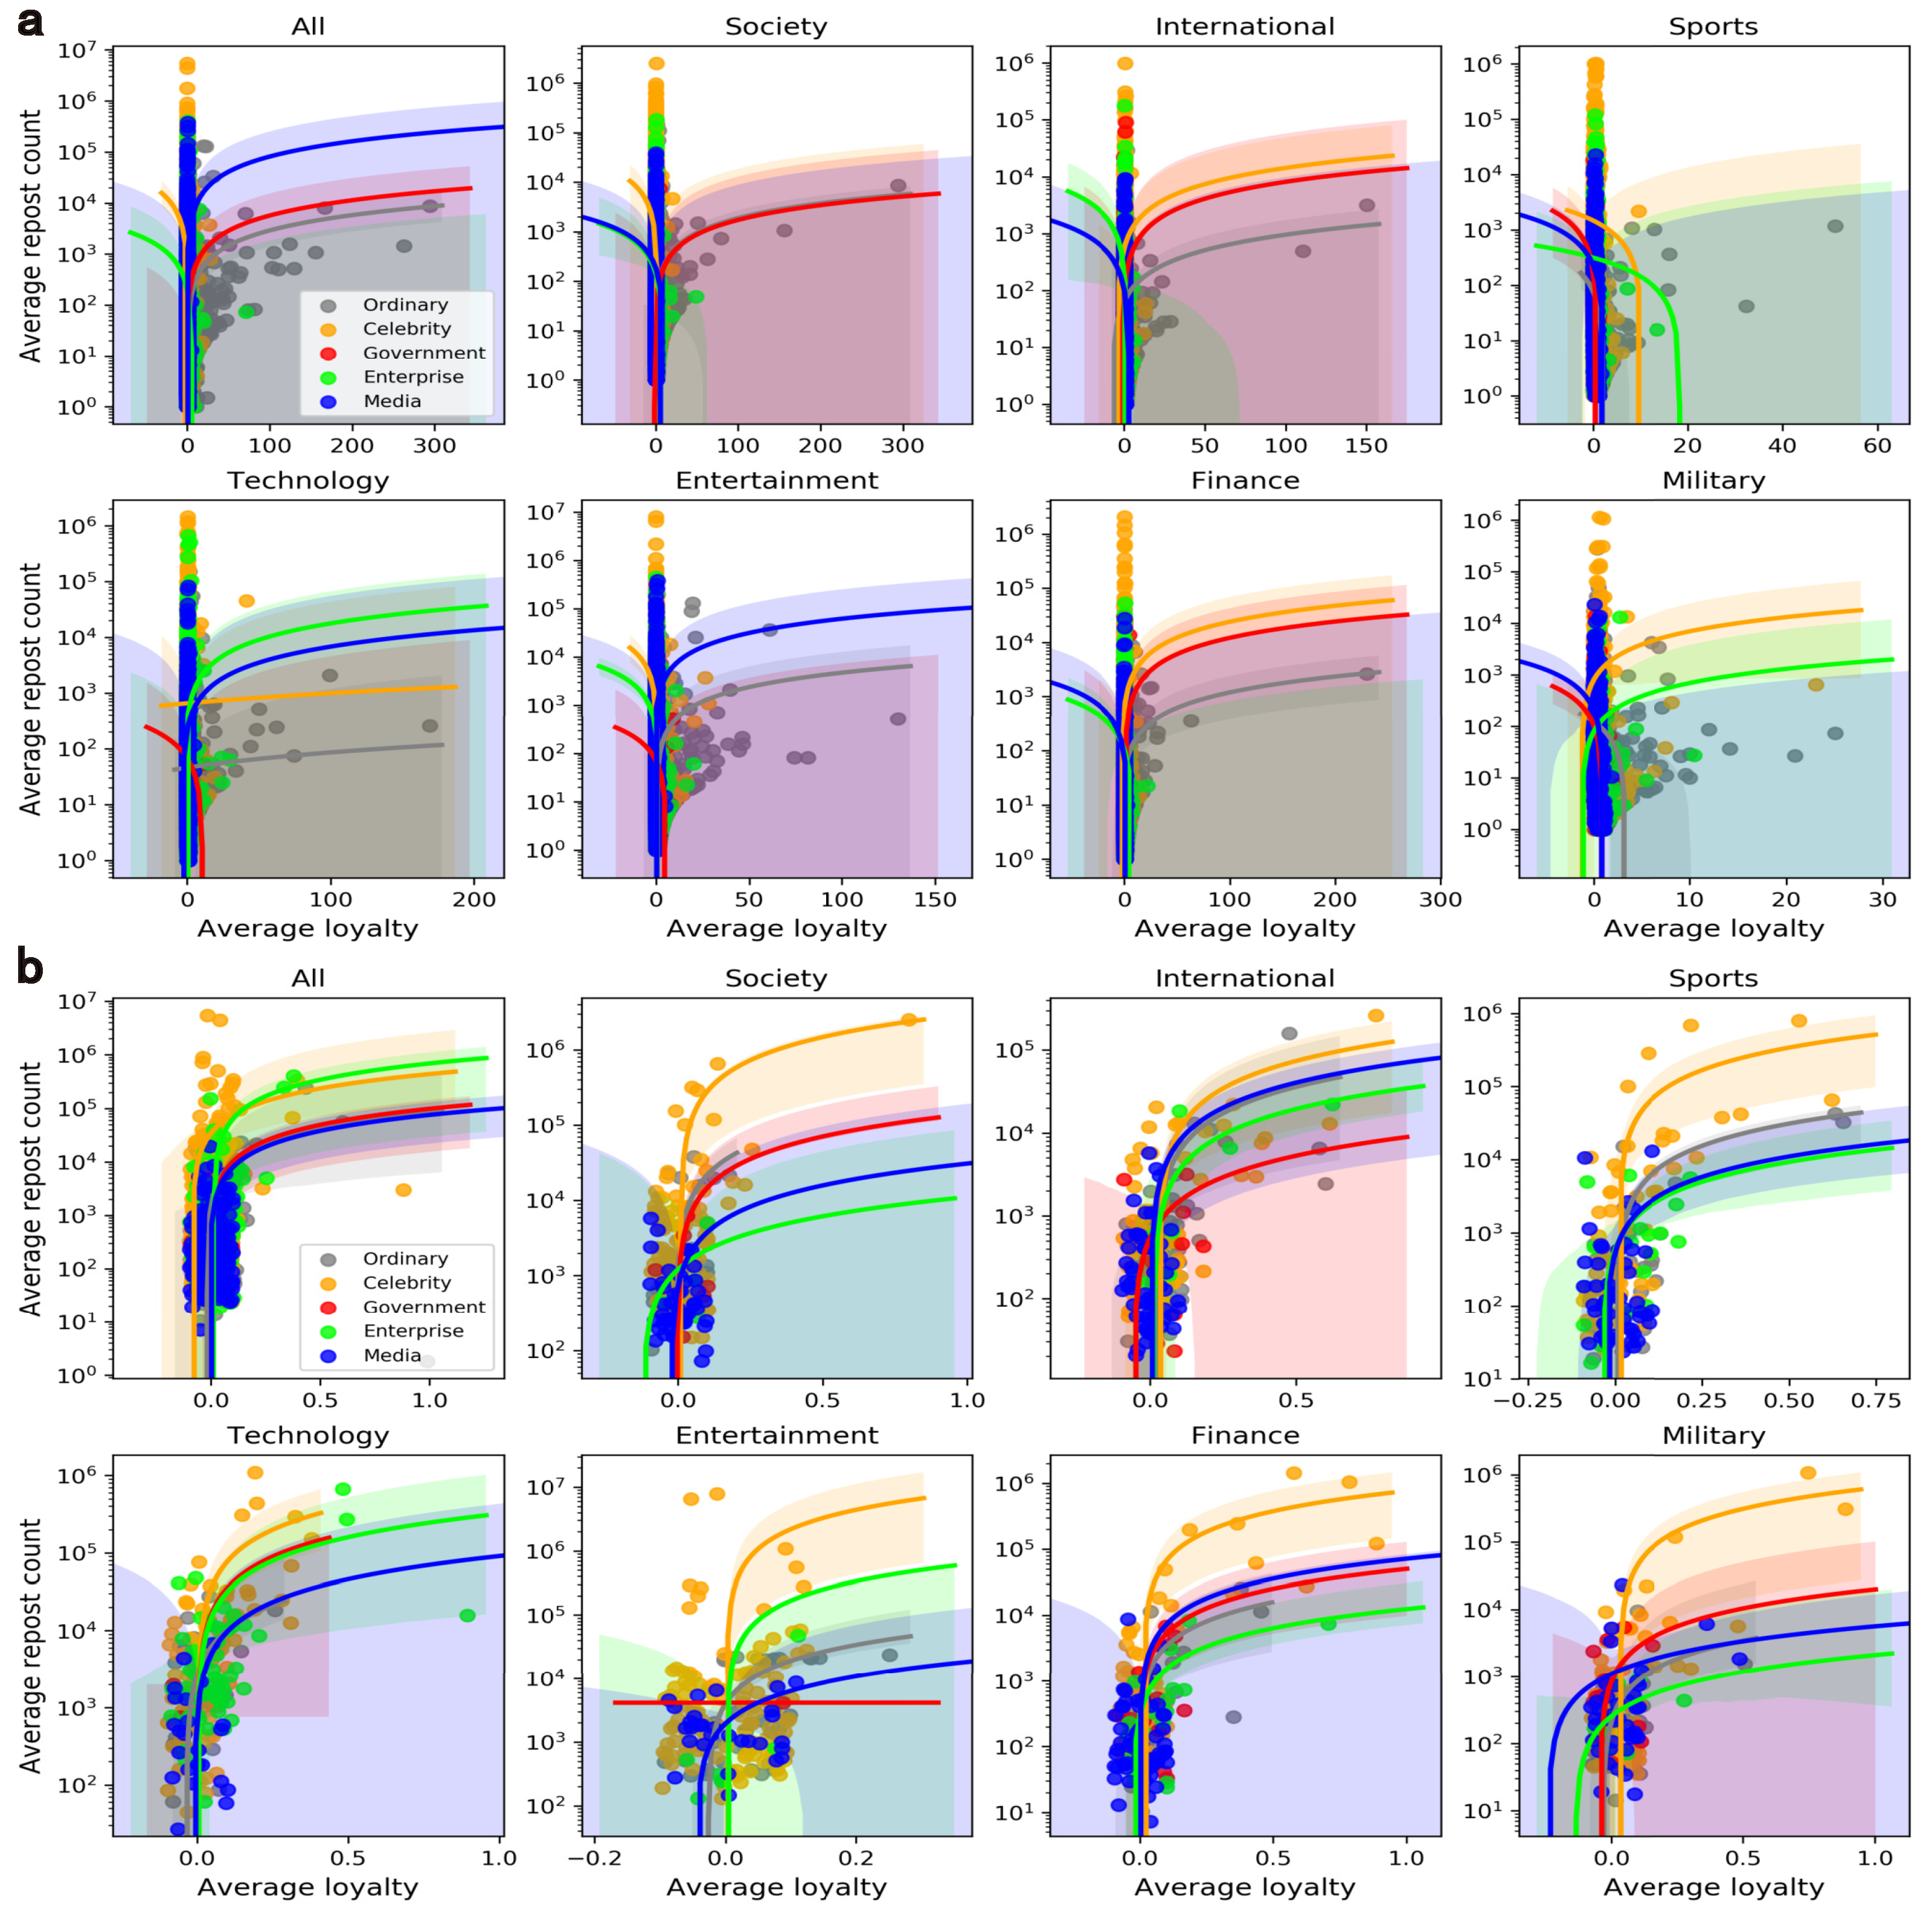
5.3. Loyalty
6. Discussion
7. Conclusions
Author Contributions
Funding
Institutional Review Board Statement
Informed Consent Statement
Data Availability Statement
Conflicts of Interest
Appendix A

| Domain | Count | Precision (%) | Recall (%) | F-Measure (%) |
|---|---|---|---|---|
| Society | 22,975 | 65.31 | 74.71 | 69.69 |
| Finance | 66,134 | 87.04 | 86.77 | 86.90 |
| Military | 34,617 | 90.04 | 92.43 | 91.22 |
| Entertainment | 91,679 | 88.53 | 95.33 | 91.80 |
| International | 14,253 | 65.83 | 59.00 | 62.23 |
| Sports | 108,041 | 98.62 | 93.90 | 96.20 |
| Technology | 73,674 | 92.36 | 86.83 | 89.51 |
| All | 411,373 | 83.96 | 84.14 | 84.05 |


References
- Figueiredo, F.; Almeida, J.M.; Gonçalves, M.A.; Benevenuto, F. Trendlearner: Early prediction of popularity trends of user generated content. Inf. Sci. 2016, 349, 172–187. [Google Scholar] [CrossRef] [Green Version]
- Lerman, K.; Hogg, T. Using a model of social dynamics to predict popularity of news. In Proceedings of the 19th International Conference on World Wide Web, Raleigh, NC, USA, 26–30 April 2010; pp. 621–630. [Google Scholar]
- Rogers, E.M. Diffusion of Innovations; Simon and Schuster: New York, NY, USA, 2010. [Google Scholar]
- Mobilia, M. Does a single zealot affect an infinite group of voters? Phys. Rev. Lett. 2003, 91, 028701. [Google Scholar] [CrossRef] [PubMed] [Green Version]
- Uzunoğlu, E.; Kip, S.M. Brand communication through digital influencers: Leveraging blogger engagement. Int. J. Inf. Manag. 2014, 34, 592–602. [Google Scholar] [CrossRef]
- Tsay, B. Mass Communication Techniques in the Age of Social Media: The Case of China and Weibo. Ph.D. Thesis, University of California, San Diego, CA, USA, 2018. [Google Scholar]
- Zhang, L.; Zhao, J.; Xu, K. Who creates trends in online social media: The crowd or opinion leaders? J. Comput.-Mediat. Commun. 2016, 21, 1–16. [Google Scholar] [CrossRef] [Green Version]
- Beck, R.; Camarota, S.A. Elite vs. Public Opinion: An Examination of Divergent Views on Immigration; Backgrounder; Center for Immigration Studies: Washington, DC, USA, 2002. [Google Scholar]
- Chiou, J.S.; Hsiao, C.C.; Su, F.Y. Whose online reviews have the most influences on consumers in cultural offerings? Professional vs consumer commentators. Internet Res. 2014, 24, 353–368. [Google Scholar] [CrossRef]
- Grossmann, M.; Thaler, D. Mass-elite divides in aversion to social change and support for donald trump. Am. Politics Res. 2018, 46, 753–784. [Google Scholar] [CrossRef] [Green Version]
- Su, Y. Exploring the effect of weibo opinion leaders on the dynamics of public opinion in china: A revisit of the two-step flow of communication. Glob. Media China 2019, 4, 493–513. [Google Scholar] [CrossRef] [Green Version]
- Wang, N.; She, J.; Chen, J. How “big vs” dominate chinese microblog: A comparison of verified and unverified users on sina weibo. In Proceedings of the 2014 ACM Conference on Web Science, Bloomington, IN, USA, 23–26 June 2014; pp. 182–186. [Google Scholar]
- Boster, F.J.; Kotowski, M.R.; Andrews, K.R.; Serota, K. Identifying influence: Development and validation of the connectivity, persuasiveness, and maven scales. J. Commun. 2011, 61, 178–196. [Google Scholar] [CrossRef]
- Chong, D.; Druckman, J.N. A theory of framing and opinion formation in competitive elite environments. J. Commun. 2007, 57, 99–118. [Google Scholar] [CrossRef]
- VanAelst, P.; Walgrave, S. Information and arena: The dual function of the news media for political elites. J. Commun. 2016, 66, 496–518. [Google Scholar] [CrossRef] [Green Version]
- González-Bailón, S.; Borge-Holthoefer, J.; Moreno, Y. Broadcasters and hidden influentials in online protest diffusion. Am. Behav. Sci. 2013, 57, 943–965. [Google Scholar] [CrossRef]
- Barnett, G.A.; Xu, W.W.; Chu, J.; Jiang, K.; Huh, C.; Park, J.Y.; Park, H.W. Measuring international relations in social media conversations. Gov. Inf. Q. 2017, 34, 37–44. [Google Scholar] [CrossRef] [Green Version]
- Bello-Orgaz, G.; Mesas, R.M.; Zarco, C.; Rodriguez, V.; Cordón, O.; Camacho, D. Marketing analysis of wineries using social collective behavior from users’ temporal activity on twitter. Inf. Process. Manag. 2020, 57, 102220. [Google Scholar] [CrossRef]
- Zhao, Y.; Wang, G.; Yu, P.S.; Liu, S.; Zhang, S. Inferring social roles and statuses in social networks. In Proceedings of the 19th ACM SIGKDD International Conference on Knowledge Discovery and Data Mining, Chicago, IL, USA, 11–14 August 2013; pp. 695–703. [Google Scholar]
- Xiong, J.; Feng, X.; Tang, Z. Understanding user-to-user interaction on government microblogs: An exponential random graph model with the homophily and emotional effect. Inf. Process. Manag. 2020, 57, 102229. [Google Scholar] [CrossRef]
- Sela, A.; Goldenberg, D.; Bengal, I.; Shmueli, E. Active viral marketing: Incorporating continuous active seeding efforts into the diffusion model. Expert Syst. Appl. 2018, 107, 45–60. [Google Scholar] [CrossRef]
- Hilbert, M.; Vásquez, J.; Halpern, D.; Valenzuela, S.; Arriagada, E. One step, two step, network step? complementary perspectives on communication flows in twittered citizen protests. Soc. Sci. Comput. Rev. 2017, 35, 444–461. [Google Scholar] [CrossRef] [Green Version]
- Guan, W.; Gao, H.; Yang, M.; Li, Y.; Ma, H.; Qian, W.; Cao, Z.; Yang, X. Analyzing user behavior of the micro-blogging website sina weibo during hot social events. Phys. A Stat. Mech. Its Appl. 2014, 395, 340–351. [Google Scholar] [CrossRef] [Green Version]
- Ju, W.; Chen, L.; Li, B.; Liu, W.; Sheng, J.; Wang, Y. A new algorithm for positive influence maximization in signed networks. Inf. Sci. 2020, 512, 1571–1591. [Google Scholar] [CrossRef]
- Li, Y.; Hu, Y. How to attain a popularity goal? examining the mediation effects of popularity determinants and behaviors. J. Youth Adolesc. 2018, 47, 1842–1852. [Google Scholar] [CrossRef]
- Wang, C.; Guan, X.; Qin, T.; Li, W. Who are active? An in-depth measurement on user activity characteristics in sina microblogging. In Proceedings of the 2012 IEEE Global Communications Conference (GLOBECOM), Anaheim, CA, USA, 3–7 December 2012; pp. 2083–2088. [Google Scholar]
- Rizwan, M.; Wan, W.; Cervantes, O.; Gwiazdzinski, L. Using location-based social media data to observe check-in behavior and gender difference: Bringing weibo data into play. ISPRS Int. J. Geo-Inf. 2018, 7, 196. [Google Scholar] [CrossRef] [Green Version]
- Baños, R.A.; Borge-Holthoefer, J.; Moreno, Y. The role of hidden influentials in the diffusion of online information cascades. EPJ Data Sci. 2013, 2, 6. [Google Scholar] [CrossRef] [Green Version]
- Hu, H.; Zhu, J.J. Social networks, mass media and public opinions. J. Econ. Interact. Coord. 2017, 12, 393–411. [Google Scholar] [CrossRef]
- Morone, F.; Makse, H.A. Influence maximization in complex networks through optimal percolation. Nature 2015, 524, 65–68. [Google Scholar] [CrossRef] [PubMed] [Green Version]
- Nip, J.Y.; Fu, K.-W. Challenging official propaganda? public opinion leaders on sina weibo. China Q. 2016, 225, 122–144. [Google Scholar] [CrossRef]
- Berelson, B.; Gaudet, H.; Lazarsfeld, P.F. The People’s Choice: How the Voter Makes Up His Mind in A Presidential Campaign; Columbia University Press: New York, NY, USA, 1968. [Google Scholar]
- Xiong, Y.; Cheng, Z.; Liang, E.; Wu, Y. Accumulation mechanism of opinion leaders’ social interaction ties in virtual communities: Empirical evidence from china. Comput. Hum. Behav. 2018, 82, 81–93. [Google Scholar] [CrossRef]
- Fan, R.; Zhao, J.; Xu, K. Topic dynamics in weibo: A comprehensive study. Soc. Netw. Anal. Min. 2015, 5, 41. [Google Scholar] [CrossRef]
- Momtaz, N.J.; Aghaie, A.; Alizadeh, S. Identifying opinion leaders for marketing by analyzing online social networks. Int. J. Virtual Communities Soc. Netw. 2011, 3, 43–59. [Google Scholar] [CrossRef]
- Leal, G.P.; Hormeyll, L.F.; Pessoa, L.A.G.D.P. Influence of virtual communities in purchasing decisions: The participants’ perspective. J. Bus. Res. 2014, 67, 882–890. [Google Scholar] [CrossRef]
- Wiertz, C.; DeRuyter, K. Beyond the call of duty: Why customers contribute to firm-hosted commercial online communities. Organ. Stud. 2007, 28, 347–376. [Google Scholar] [CrossRef] [Green Version]
- Senevirathna, C.; Gunaratne, C.R.W.; Jayalath, C.; Garibay, I. Influence Cascades: Entropy-Based Characterization of Behavioral Influence Patterns in Social Media. Entropy 2021, 23, 160. [Google Scholar] [CrossRef]
- Shannon, C.E. A mathematical theory of communication. Bell Syst. Tech. J. 1948, 5, 3–55. [Google Scholar]
- Langford, D.; Male, S. Strategic Management in Construction; John Wiley & Sons: London, UK, 2008. [Google Scholar]
- Lazarsfeld, P.F.; Berelson, B.; Gaudet, H. The People’s Choice; Duell, Sloan & Pearce: New York, NY, USA, 1944. [Google Scholar]
- Luarn, P.; Yang, J.; Chiu, Y. The network effect on information dissemination on social network sites. Comput. Hum. Behav. 2014, 37, 1–8. [Google Scholar] [CrossRef]
- Weimann, G. The influentials: People who influence people. Public Opin. Q. 1994, 60, 468–470. [Google Scholar]
- Watts, D.J.; Dodds, P.S. Influentials, networks, and public opinion formation. J. Consum. Res. 2007, 34, 441–458. [Google Scholar] [CrossRef]
- Smith, M.A.; Rainie, L.; Shneiderman, B.; Himelboim, I. Mapping twitter topic networks: From polarized crowds to community clusters. Pew Res. Cent. 2014, 20, 1–56. [Google Scholar]
- Guisinger, A.; Saunders, E.N. Mapping the boundaries of elite cues: How elites shape mass opinion across international issues. Int. Stud. Q. 2017, 61, 425–441. [Google Scholar] [CrossRef]
- Casalo, L.V.; Flavian, C.; Ibanezsanchez, S. Influencers on instagram: Antecedents and consequences of opinion leadership. J. Bus. Res. 2018, in press. [Google Scholar] [CrossRef]
- Boyd, D.; Golder, S.A.; Lotan, G. Tweet, tweet, retweet: Conversational aspects of retweeting on twitter. In Proceedings of the 43rd Hawaii International Conference on System Science, Honolulu, HI, USA, 5–8 January 2010; pp. 1–10. [Google Scholar]
- McPherson, M.; Smith-Lovin, L.; Cook, J.M. Birds of a feather: Homophily in social networks. Annu. Rev. Sociol. 2001, 27, 415–444. [Google Scholar] [CrossRef] [Green Version]
- Centola, D. The spread of behavior in an online social network experiment. Science 2010, 329, 1194–1197. [Google Scholar] [CrossRef]
- Colleoni, E.; Rozza, A.; Arvidsson, A. Echo chamber or public sphere? predicting political orientation and measuring political homophily in twitter using big data. J. Commun. 2014, 64, 317–332. [Google Scholar] [CrossRef]
- Kwak, H.; Lee, C.; Park, H.; Moon, S. What is twitter, a social network or a news media? In Proceedings of the 19th International Conference on World Wide Web, Raleigh, NC, USA, 26–30 April 2010; pp. 591–600. [Google Scholar]
- Zhou, Z.; Xu, K.; Zhao, J. Homophily of music listening in online social networks of china. Soc. Netw. 2018, 55, 160–169. [Google Scholar] [CrossRef]
- Guillen, M.; Nielsen, J.P.; Scheike, T.H.; Perez-Marin, A.M. Time-varying effects in the analysis of customer loyalty: A case study in insurance. Expert Syst. Appl. 2012, 39, 3551–3558. [Google Scholar] [CrossRef]
- Ibrahimi, K.; Cherif, O.O.; Elkoutbi, M.; Rouam, I. Model to improve the forecast of the content caching based time-series analysis at the small base station. In Proceedings of the 2019 International Conference on Wireless Networks and Mobile Communications (WINCOM), Fez, Morocco, 29 October–1 November 2019; pp. 1–6. [Google Scholar]
- Zhu, J.H. Issue competition and attention distraction: A zero-sum theory of agenda-setting. J. Q. 1992, 69, 825–836. [Google Scholar] [CrossRef]
- Yu, H. Beyond gatekeeping: J-blogging in china. J. Theory Pract. Crit. 2011, 12, 379–393. [Google Scholar]
- Shin, H.; Sohn, S.Y. Segmentation of stock trading customers according to potential value. Expert Syst. Appl. 2004, 27, 27–33. [Google Scholar] [CrossRef]
- Boateng, S.L. Online relationship marketing and customer loyalty: A signaling theory perspective. Int. J. Bank Mark. 2019, 37, 226–240. [Google Scholar] [CrossRef] [Green Version]
- Cheng, C.; Chen, Y. Classifying the segmentation of customer value via rfm model and rs theory. Expert Syst. Appl. 2009, 36, 4176–4184. [Google Scholar] [CrossRef]
- Szabo, G.; Huberman, B.A. Predicting the popularity of online content. Commun. ACM 2010, 53, 80–88. [Google Scholar] [CrossRef]
- Chen, G.H.; Nikolov, S.; Shah, D. A latent source model for nonparametric time series classification. Adv. Neural Inf. Process. Syestems 2013, 26, 1088–1096. [Google Scholar]
- Bliss, C.A.; Kloumann, I.M.; Harris, K.D.; Danforth, C.M.; Dodds, P.S. Twitter reciprocal reply networks exhibit assortativity with respect to happiness. J. Comput. Sci. 2012, 3, 388–397. [Google Scholar] [CrossRef] [Green Version]
- Ahajjam, S.; Badir, H. Identification of influential spreaders in complex networks using hybridrank algorithm. Sci. Rep. 2018, 8, 1–10. [Google Scholar] [CrossRef] [PubMed]
- Al-garadi, M.A.; Varathan, K.D.; Ravana, S.D. Identification of influential spreaders in online social networks using interaction weighted k-core decomposition method. Phys. A Stat. Mech. Its Appl. 2017, 468, 278–288. [Google Scholar] [CrossRef]
- Koh, Y.J.; Sundar, S.S. Heuristic versus systematic processing of specialist versus generalist sources in online media. Hum. Commun. Res. 2010, 36, 103–124. [Google Scholar] [CrossRef]


| User Group | Ordinary | Celebrity | Government | Enterprise | Media |
|---|---|---|---|---|---|
| Mass | 8,043,807 | 301,118 | 20,370 | 87,155 | 9983 |
| Elite | 196 | 408 | 29 | 111 | 186 |
| Content Domains | All Users | Video | News Article | Picture |
|---|---|---|---|---|
| All | Ordinary | 0.013 *** | −0.006 | 0.002 |
| Celebrity | 0.050 *** | −0.024 | −0.006 | |
| Government | 0.224 ** | −0.043 | 0.114 | |
| Enterprise | 0.096 ** | −0.043 | 0.038 | |
| Media | 0.072 | −0.065 | 0.018 | |
| Society | Ordinary | 0.003 | −0.006 | 0 |
| Celebrity | 0.123 *** | −0.025 | −0.005 | |
| Government | 0.071 | −0.059 | 0 | |
| Enterprise | −0.01 | 0.071 | 0 | |
| Media | −0.038 | 0.073 | 0 | |
| International | Ordinary | 0.006 | 0 | 0 |
| Celebrity | 0.080 ** | 0.015 | −0.005 | |
| Government | 0.025 | 0.054 | 0.056 | |
| Enterprise | −0.012 | 0.084 | −0.013 | |
| Media | 0.164 | −0.073 | −0.003 | |
| Sports | Ordinary | 0.041 *** | −0.019 *** | 0.001 |
| Celebrity | 0.04 | −0.021 | −0.005 | |
| Government | 0.062 | 0.036 | 0 | |
| Enterprise | 0.089 | −0.061 | 0.004 | |
| Media | −0.046 | −0.059 | 0.489 *** | |
| Technology | Ordinary | 0.017 *** | −0.020 *** | 0.004 |
| Celebrity | 0.002 | −0.024 | −0.003 | |
| Government | 0.149 | 0.002 | 0.08 | |
| Enterprise | 0.017 | −0.039 | −0.005 | |
| Media | −0.011 | 0.02 | 0.01 | |
| Entertainment | Ordinary | 0.010 ** | −0.009 * | 0.003 |
| Celebrity | 0.03 | −0.038 * | −0.008 | |
| Government | 0.057 | −0.062 | −0.025 | |
| Enterprise | −0.001 | −0.04 | −0.003 | |
| Media | 0.05 | −0.061 | 0.008 | |
| Finance | Ordinary | 0.005 | −0.006 | 0 |
| Celebrity | 0.028 | −0.022 | −0.004 | |
| Government | 0.01 | −0.08 | 0.034 | |
| Enterprise | −0.008 | −0.012 | −0.005 | |
| Media | −0.051 | −0.028 | −0.052 | |
| Military | Ordinary | 0.005 | −0.019 ** | 0.003 |
| Celebrity | 0.006 | −0.02 | −0.008 | |
| Government | 0.145 | −0.018 | −0.04 | |
| Enterprise | 0.316 *** | 0.008 | 0 | |
| Media | −0.043 | −0.12 | −0.024 |
| Content Domains | Elites | Video | News Article | Picture |
|---|---|---|---|---|
| All | Ordinary | −0.075 | −0.081 | −0.019 |
| Celebrity | −0.073 | 0.004 | −0.023 | |
| Government | −0.003 | 0.16 | 0.272 | |
| Enterprise | −0.142 | 0.240 * | −0.032 | |
| Media | 0.124 | −0.085 | −0.042 | |
| Society | Ordinary | −0.058 | −0.049 | −0.012 |
| Celebrity | −0.094 | 0.096 | −0.008 | |
| Government | −0.166 | 0.21 | 0.674 *** | |
| Enterprise | 0.188 | −0.003 | −0.028 | |
| Media | 0.078 | −0.096 | −0.032 | |
| International | Ordinary | −0.014 | −0.042 | −0.02 |
| Celebrity | −0.061 | −0.055 | −0.008 | |
| Government | 0.263 | −0.197 | 0.013 | |
| Enterprise | 0.034 | −0.061 | 0 | |
| Media | 0.137 | −0.058 | −0.043 | |
| Sports | Ordinary | −0.139 | −0.082 | −0.033 |
| Celebrity | −0.072 | −0.041 | −0.012 | |
| Government | 0.103 | −0.02 | 0 | |
| Enterprise | −0.088 | 0.182 | −0.001 | |
| Media | 0.041 | −0.025 | −0.037 | |
| Technology | Ordinary | −0.1 | −0.148 * | −0.015 |
| Celebrity | −0.031 | 0.018 | −0.016 | |
| Government | 0.048 | 0.147 | −0.113 | |
| Enterprise | −0.089 | 0.302 ** | −0.022 | |
| Media | 0.150 * | −0.074 | −0.029 | |
| Entertainment | Ordinary | −0.048 | −0.189 ** | −0.028 |
| Celebrity | −0.065 | 0.005 | −0.013 | |
| Government | 0.502 ** | −0.024 | 0.006 | |
| Enterprise | −0.105 | −0.028 | −0.028 | |
| Media | 0.07 | −0.087 | −0.033 | |
| Finance | Ordinary | −0.045 | −0.055 | −0.012 |
| Celebrity | −0.031 | −0.058 | −0.007 | |
| Government | −0.057 | −0.075 | −0.09 | |
| Enterprise | 0.125 | 0.358 ** | 0 | |
| Media | 0.165 * | 0.019 | −0.007 | |
| Military | Ordinary | 0.095 | −0.069 | −0.041 |
| Celebrity | −0.071 | −0.045 | −0.011 | |
| Government | −0.056 | −0.031 | 0.334 | |
| Enterprise | −0.077 | 0.324 ** | −0.025 | |
| Media | 0.057 | 0 | −0.018 |
| Mass | Elite | |||||||
|---|---|---|---|---|---|---|---|---|
| Coef | Std Err | p > | Coef | Std Err | p > | |||
| const | 1.2787 | 0.007 | 193.957 | *** | 22.8254 | 10.615 | 2.15 | (0.032) * |
| average loyalty | 0.8224 | 0.012 | 66.248 | *** | 1629.9279 | 90.067 | 18.097 | *** |
| retweeter count | 0.0037 | 0 | 340.457 | *** | 0.0018 | 0 | 4.291 | *** |
| observations | 3,024,960 | 928 | ||||||
| 0.038 | 0.267 | |||||||
| adjust | 0.038 | 0.266 | ||||||
| F-statistic | 59,660 | 168.6 | ||||||
Publisher’s Note: MDPI stays neutral with regard to jurisdictional claims in published maps and institutional affiliations. |
© 2022 by the authors. Licensee MDPI, Basel, Switzerland. This article is an open access article distributed under the terms and conditions of the Creative Commons Attribution (CC BY) license (https://creativecommons.org/licenses/by/4.0/).
Share and Cite
Shi, B.; Xu, K.; Zhao, J. Behavior Variations and Their Implications for Popularity Promotions: From Elites to Mass on Weibo. Entropy 2022, 24, 664. https://doi.org/10.3390/e24050664
Shi B, Xu K, Zhao J. Behavior Variations and Their Implications for Popularity Promotions: From Elites to Mass on Weibo. Entropy. 2022; 24(5):664. https://doi.org/10.3390/e24050664
Chicago/Turabian StyleShi, Bowen, Ke Xu, and Jichang Zhao. 2022. "Behavior Variations and Their Implications for Popularity Promotions: From Elites to Mass on Weibo" Entropy 24, no. 5: 664. https://doi.org/10.3390/e24050664