1. Introduction
The fast-growing development of seawater desalination and solar energy utilization technology advances the applications of solar seawater desalination technology [
1,
2,
3]. Since the solar concentrated photothermal system has high solar thermal efficiency and can produce a high-grade heat source, the multi-effect distillation (MED) desalination system driven by concentrating photothermal energy has become a focus of research in the field of solar seawater desalination technology [
4,
5]. Ejectors have been widely used in MED desalination systems due to their simple mechanical structures and the ability to reduce energy consumption [
6,
7,
8]. However, due to the unstable working condition of the concentrated photothermal MED desalination system and its special working situations, most of the ejectors fail to meet the needs of the system. Therefore, it is necessary to develop high-performance ejectors that are suitable for the concentrated photothermal MED desalination system.
Based on the location of the primary nozzle, the ejector can be directly divided into two main types: Constant area mixing (CAM) ejector and constant pressure mixing (CPM) ejector. The CPM ejectors are considered to be more favorable in practical use because of their stable performance at a wider range of back pressures [
9]. Therefore, the constant pressure mixing model has always been applied in the ejector design [
10]. Keenan et al. [
11] employed thermodynamic formulas to derive the calculation model of ejectors for the first time. Additionally, the isobaric mixing theory was widely recognized and applied afterwards. Munday et al. [
12] developed this model based on the assumption that the flow mixing progress began at a “fictive throat”, which is located downstream of the primary nozzle exit. Huang et al. [
13] modified this model to explain the double choking phenomenon. It was assumed that the “fictive throat” was the location at the constant area section and the mixing progress occurred when the entrained flow was choked. To predict the performance of ejectors more accurately, Zhu et al. [
14] developed a “shock circle model” by considering the actual non-uniform velocity distribution of the secondary flow in the mixing chamber. In these studies, limited work has been reported on the effects of the ejector geometry on its performance. The ejector with a designed geometry is desired for fitting the operational conditions. Furthermore, to gain deep insight into the ejector mechanism, many attempts have been made to study the effect of the nozzle exit position (NXP) and area ratio (AR) on the performance of the ejector. Researchers have found that some other geometric shapes of the nozzle, such as mixing section size, diffuser size, diverging angle, and constant area section size, are among the factors that affect the ejector performance [
9].
In recent years, great efforts have been made to explore the geometry of ejectors for practical use. Park et al. [
15] presented a robust TVC for a pilot-scale desalination system based on the CFD method. It was a novel robust ejector designed to be operated in the critical mode under various operating pressures by changing the primary nozzle throat diameter and the ejector throat diameter. Chaiwongsa et al. [
16] investigated the influence of the nozzle throat area on the performance of the ejector and refrigeration system through an experimental study. It was found that the primary mass flow rate varied directly with the nozzle throat, and the secondary mass flow rate also tended to vary directly with the nozzle throat. Zhang et al. [
17] investigated the effect of the nozzle position on steam ejectors by placing a long conical regulating cone at the nozzle throat. It was found that the performance of the ejector was adjustable by moving the position of the regulating cone to change the area of the nozzle throat. Liu et al. [
18] designed an axial-symmetric CFD model to investigate the effect of the area ratio on ejector performance. Simulation results showed that the entrainment ratio increased by about 20% by adjusting the area ratio from 18.23 to 30.25 as the effective cross-area increased with the throat diameter. Thongtip et al. [
19] tested four different nozzles of the same area ratio and two nozzles of different area ratios at various operating conditions. Their research showed that using larger nozzles with a lower generator temperature was beneficial to the ejector performance used in the R141b ejector refrigerator. Wang et al. [
20] proposed the concept of the adaptive nozzle exit position (ANXP) ejector. The results indicated that the new method could improve the ejector performance in MED-TVC desalination systems. Tang et al. [
21,
22,
23] carried out a CFD study to optimize the entrainment passage for performance improvement in the MED-TVC desalination system under both design and off-design conditions. Their results showed that the throat-entraining entrance downstream pressure regulation could be adopted if the ejector operates under the design condition; otherwise, the combined entraining entrance downstream pressure regulation would be the best choice for the off-design conditions. According to the effects of both AR and NXP on the performance of the ejector, Wang et al. [
24] explored the AR auto-adjusting ejector and the NXP auto-adjusting ejector. The CFD simulations showed that two kinds of auto-tuning ejectors exhibited better performance than that of the constant structure. Pei et al. [
25] investigated a wide-operating-range ejector by using hydrogen gas as a working fluid. The experimental data showed that the optimal value range for the diameter ratio was 3.00–3.54 and the lower diameter ratio in optimal value benefited the operating range extension. Gu et al. [
26] proposed an auto-tuning AR ejector by installing a spindle in the primary nozzle. Compared with the average entrainment ratio of 0.69 for a conventional fixed geometry ejector, the new design had an average entrainment ratio of 1.39. Wang et al. [
27] explored a new design method for the primary nozzle to simplify the design process and improve the overall ejector efficiency. The proposed design method could improve the overall efficiency of the ejector by 14.41% compared to conventional methods. Gao et al. [
28] studied the steam ejector used in a MED-TVC desalination system. The CFD simulation showed that adding an auxiliary entrainment inlet at the low-pressure region of the ejector was beneficial to improve its entrainment ratio and outlet mass flow rate. Xue et al. [
29] investigated a two-stage vacuum ejector for the MED-TVC desalination system. The experimental results indicated the two-stage ejector could be used at a lower vacuum degree than the single ejector.
Despite the good performance of ejectors in the studies, most of the research on the performance of ejectors has assumed that the ejector works under the designed condition. However, due to the instability of solar energy, it is difficult to ensure that the concentrated photothermal MED desalination systems operate under fixed conditions. Inevitably, the departure from the design condition will result in the deterioration of the ejector performance. While researchers have investigated some structured ejectors that can meet the requirements of off-design conditions to a certain extent, the operating conditions are still limited and the ejector performance is not suited for concentrated photothermal MED desalination. Thus, it is challenging to adapt to the operating environment and the situation where the steam parameters fluctuate greatly.
This work aims to demonstrate a wide-operating-range ejector for the concentrated photothermal MED desalination systems both theoretically and experimentally. Firstly, the thermodynamic properties of the system are obtained by establishing the mathematical model of the dynamic auto-adjusting steam ejector. Then, the operation parameters are used to provide the basis for the structural design of the key components of the dynamic auto-adjusting steam ejector. According to the determined parameters of the whole structure of the steam ejector, an optimized design scheme is generated. Finally, by using the optimal design results of the steam ejector, a dynamic auto-adjusting steam ejector demonstration prototype is developed to elucidate the feasibility of the design scheme.
3. Dynamic Model Analysis of Auto-Adjusting Ejector
3.1. Meshing of the Auto-Adjusting Ejector
In this work, the two-dimensional axisymmetric model was employed for the ejector calculation. Sharifi et al. [
30] established a calculation model for the traditional steam thermal compression ejector in the seawater desalination system based on two-dimensional axisymmetric and three-dimensional methods, respectively. The simulation results obtained by both models turned out to be similar. Therefore, the application of a two-dimensional axisymmetric model would be sufficient for calculation with the desired accuracy.
Figure 3 illustrates a schematic diagram of the designed auto-adjusting ejector computational domain grid. To obtain more accurate results, the different region of the ejector model was divided in mesh. At the connection of each region, a same mesh surface was maintained. Additionally, in the key regions near the wall of the ejector, where the fluid state altered greatly with a relatively high velocity gradient, the mesh density was increased accordingly. After verification of grid independence and taking the consumption of computing resources and computing time into consideration, the calculation could be acceptable to meet the accuracy requirement for reflecting the internal flow field of the ejector. The number of grids in the final model is estimated to be 40,000.
3.2. Numerical Calculation Model
To simplify the solution process, this article makes the following assumptions:
The fluid is a steady ideal gas in the ejector;
The inner wall of the ejector is adiabatic;
The vortex in the flow field inside the ejector is an isentropic process;
The primary steam of the ejector is superheated;
The mixing process of the fluid is completed in the mixing chamber.
Based on the above assumptions, the governing equations, including the mass conservation, energy conservation, and momentum conservation equations, are given as follows:
The conservation of mass equation:
The momentum conservation equation:
The conservation of energy equation:
In Equations (4)–(6),
i,
j = x, y, z was defined according to the Einstein summation rule. The
and
are expressed as follows:
where
A is the cross-sectional area,
ρ is the density,
T is the static temperature,
E is the total energy,
P is the pressure,
αeff is the thermal conductivity coefficient,
µeff is the dynamic viscosity coefficient, and
R is the ideal gas constant, respectively.
3.3. Numerical Settings and Boundary Conditions
The choice of turbulence model is related to the accuracy of the simulation results in the CFD simulations. The
k-ε model is the most widely applied in CFD research. The
k-ε models in FLUENT include three types: Standard
k-ε, RNG
k-ε, and Realizable
k-ε [
31]. The Realizable
k-ε model, as an improved version of the standard turbulence model, is better than the traditional Standard
k-ε model in calculating different fluid flow processes, such as ejection, fluid mixing layer, pipe flow, and boundary layer flow. In particular, the simulation analysis of this model in terms of fluid diffusion velocity is very accurate for the calculation results of the axisymmetric jet model and the results of the plane jet. In addition, the effectiveness of the “Realizable
k-ε” turbulence model in predicting steam ejectors in seawater desalination systems has been verified by experimental data. Thus, this research uses the “Realizable
k-ε” turbulence model for the simulation calculation of turbulence in the ejector internal flow field.
The transfer equations of the “Realizable k-ε” turbulence model are expressed as follows:
For turbulent kinetic energy
k:
For turbulent dissipation rate
ε:
In Equations (9) and (10), Gk is the turbulent kinetic energy produced by the average velocity gradient, Gb is the turbulent kinetic energy produced by rising buoyancy, µ is the speed, is the fluctuating expansion parameter incompressible turbulence, σk and σε are the turbulent Prandtl numbers of k and ε, respectively, C1ε and C2 are fixed constants, and Sk and Sε are defined constants.
In the turbulence model, the turbulent viscosity (
) is calculated by the following formula:
To ensure that the model achieves a good calculation, the model constants are selected as follows:
In this paper, the Standard-Wall-Function is used to solve the near-wall function. The near-wall function is a series of semi-empirical formulas used to calculate the viscous influence area between the wall and the fully developed turbulence in the turbulence problem. Standard-Wall-Function is based on the research of Launder and Spalding and is widely used in fluid simulation in the industry. This function is also suitable for supersonic fluid calculation and has been verified by experimental data.
In the Fluent software, the parameter settings of the fluid model solver inside the ejector are listed in
Table 2.
The proposed ejector consists of three fluid inlets and one outlet. The boundary types of the two primary inlet flows and one secondary inlet flow are set as “pressure inlet”, and the ejector outlet is set as the “pressure outlet”. The boundary conditions applied to the inlet are axisymmetric with swirl. The specific parameters of the boundary are summarized in
Table 3.
In the process of solving the control equations and turbulence model, the second-order upwind is used to discretize the convection terms, and the SIMPLEC algorithm is used to calculate the pressure field. In the CFD simulation of the ejector, when the residuals of all equations are less than 10−7 and the calculated mass flow meets the mass conservation equation (i.e., the obtained net flow is less than 10−7 kg/s), the calculation is considered to be converged and ends.
3.4. Grid Independence Analysis
The CFD ejector model needs to be verified for grid independence so that the simulation results are not affected by the number of grids. This work draws three sets of grids, including the grid number of 16547, 44834, and 88863, respectively. Generally, the Mach number and pressure distribution of the fluid inside the ejector determine most of its performance indicators. Therefore, the axial Mach number and axial static pressure are used for the verification of grid independence. In
Figure 4a,b, the axial Mach number and axial pressure distribution of the ejector inner fluid are presented, respectively. The Mach number and pressure distribution of the three models with different mesh numbers are basically the same. Only the Mach numbers with x from 0.06 to 0.08 m in
Figure 4a have some slight discrepancy. Based on this, the influence of three different mesh number models on the ejection ratio of the ejector is carried out, and the relative error is less than 1.3%. Besides, an excessive number of model grids will consume CPU resources and time to converge in the calculation results. Therefore, in this work, the number of ejector model grids of 44834 was selected, based on the results obtained from the grid independence verification and considering the calculation resources and calculation accuracy of the simulation.
3.5. Experimental Platform and Conditions
To realize the model verification, a set of the experimental platform was designed and built according to actual application scenarios, combined with the ejector operating conditions, as depicted in
Figure 5. The experimental platform was comprised of an ejector, a condenser, a set of evaporators, sensors, data acquisition devices and control systems. During the experimental processes, feed water, which sprays in every evaporator, turned into water vapor and then condensed at low pressure. The latent heat released from the condensation of the vapor is used as a heat source to warm up the brine water. The ejector plays an important role in recycling the vapor from the end to the first effect evaporator. The high temperature and pressure steam were controlled by a valve where the opening can be adjusted manually. The experiment was conducted with a gradual change in the primary flow pressure. The experimental process was relatively simple. Firstly, the air tightness of the devices was checked carefully. Then, the inlet valve of the primary flow was opened gradually, allowing the pressure to fluctuate within the range of 2–4 bar. The pressure was a little higher than the simulation value to offset the loss around the ejector interface. The ejector back pressure and secondary pressure were fixed separately as the experimental comparison. The suction pressure and mass flow rate of all the flows were recorded. Since it is a valid experimental platform for ejectors, the steam source is replaced by an electric steam boiler, which can generate high-pressure steam up to about 10 bar. The steam mass flow at the three ports of the ejector is measured by mass flow meters, and the pressure and temperature are measured by a high-precision pressure–temperature sensor. The pilot experiment system adopts a set of DAQ (Data Acquisition) equipment for data collection, recording, and display.
4. Results and Discussion
To study the performance of the auto-adjusting ejector under variable operating conditions, the CFD simulation method is adopted. The operating conditions and performance parameters of the ejector to be investigated are compression ratio, primary pressure, back pressure, ejection ratio, and
AR. The correlation curve between the
AR of the adjustable ejector and the back-and-forth movement of the spray needle is shown in
Figure 6.
The relation between
AR and spindle tip position was fit into a function of:
The expression curve was close enough to calculate the value with the R
2 of 0.9978. According to the spring elasticity coefficient and Hooke law, the force and the deformation value (elongation or compression) of the spring are proportional within the elastic limit and the formula is defined as:
The relationship between spring elasticity coefficient (
) and the inlet steam pressure (
) of the ejector and
AR can be obtained, and the basis for the selection of the spring elasticity coefficient can be estimated by the following formula.
4.1. Relationship between Needle Position and Ejector Performance
4.1.1. Influence of Needle Position on Ejector Performance
Figure 7a,b showed the distributions of Mach number and static pressure along the ejector axis when the tip position of the needle Δ
L is 0 mm, 1 mm, 2 mm, and 3 mm, respectively. The boundary conditions are set as primary flow pressure of 3 bar, secondary flow pressure of 0.1 bar, and back pressure of 0.35 bar, respectively. Similar to the traditional ejector, the velocity of the primary fluid increases and reaches the supersonic at the throat of the nozzle and then continues to accelerate and reach the maximum velocity of 1.9 Mach at the exit of the nozzle. In
Figure 7a, as the tip position moves, the value of
AR increases and the Mach number at the nozzle outlet increases, thereby improving the ejection ability to the secondary flow. Meanwhile, the same results can be observed from
Figure 7b. With the movement of the needle, the lower the pressure reaches the nozzle outlet, the stronger the suction capacity of the ejector and the lower the velocity of the fluid in the ejector.
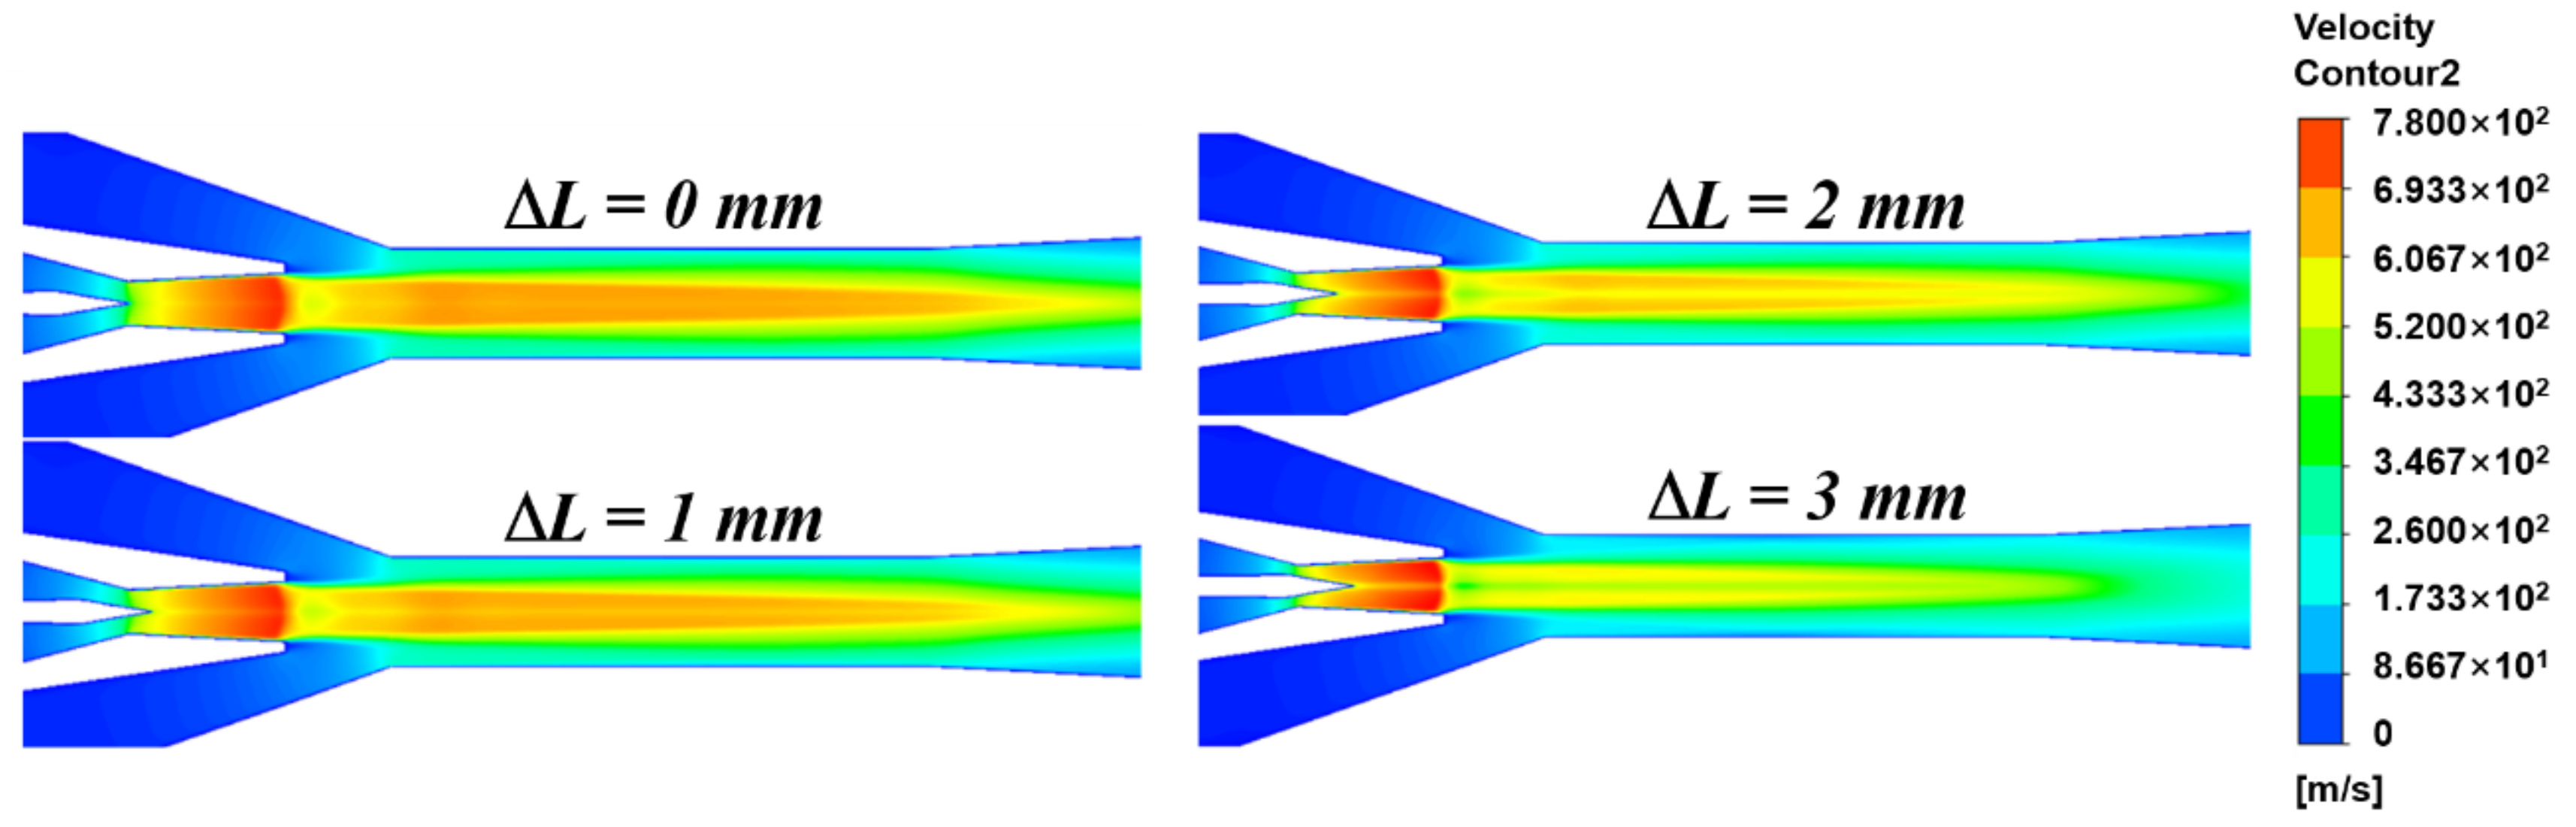
The velocity contours of the internal flow field of the ejector are shown in
Figure 8. It is observed that the fluid velocity gradually decreases as the Δ
L increases. Compared with the single supersonic nucleus of the traditional ejector, the fluid supersonic nucleus of the auto-adjusting ejector is gradually divided into a shape with a lower center velocity and a higher peripheral velocity in the cross-section due to the continuous movement of the needle. Besides, there exists a small area of low velocity at the nozzle exit.
4.1.2. The Influence of Needle Position on Port Flow
The position of the needle of the auto-adjusting ejector move with the fluctuation of the primary flow pressure and the
AR of the ejector also changes accordingly. The relationship between the position of the needle and the ejector performance is shown in
Figure 9. The boundary conditions are set as primary pressure of three bar, secondary pressure of 0.1 bar, and back pressure of 0.35 bar, respectively. It is observed that the performance of the auto-adjusting ejector first increases and then decreases in the fixed working conditions, as the needle continues to move to the throat of the ejector.
Figure 10 shows the diagrams of the relationships between the mass flow of the primary and secondary of the ejector and the needle position under the same operating conditions. It is observed that the mass flow of the primary inlet of the ejector gradually decreases as the tip position of the needle increases. This is because the
AR of the ejector decreases as the needle continuously deepens leading to the effective throat area of the nozzle decreasing. It shows that the secondary flow mass flow rate gradually decreases and the suction capacity decreases with the needle position continuously increasing as the primary pressure below three bar. Besides, the secondary flow rate of the ejector no longer decreases with the needle position increasing as the primary pressure exceeds 3.5 bar.
4.2. Influence of Operating Parameters on Ejector Performance
4.2.1. Influence of Compression Ratio on Ejector Performance
Figure 11 shows the relationship between the entrainment ratio and the compression ratio of the auto-adjusting ejector when the primary pressure is 2.5 bar under the same operating conditions. It is indicated that the ejector can form effective ejection within the compression ratio range of 0.8–6 bar, and the ejection coefficient of the ejector can reach about 1.5. With the compression ratio ranging from 0.8 to 3 bar, the compression ratio increase has little effect on the ejection efficiency. When the primary flow pressure of the ejector is insufficient or the expansion ratio is too small, the overall ejection coefficient will rapidly decrease, and the ejector will enter a backflow failure state when the compression ratio is greater than 3.5. This phenomenon is similar to the traditional ejector performance curve. When the needle position of the ejector is at 0 mm, a larger compression ratio range is obtained and the maximum entrainment ratio is 1.06 and the maximum compression ratio is 5.5 where the ejector still has the suction ability. As the nozzle moves further, the ejection performance gradually increases, and the effective compression ratio continues to shrink.
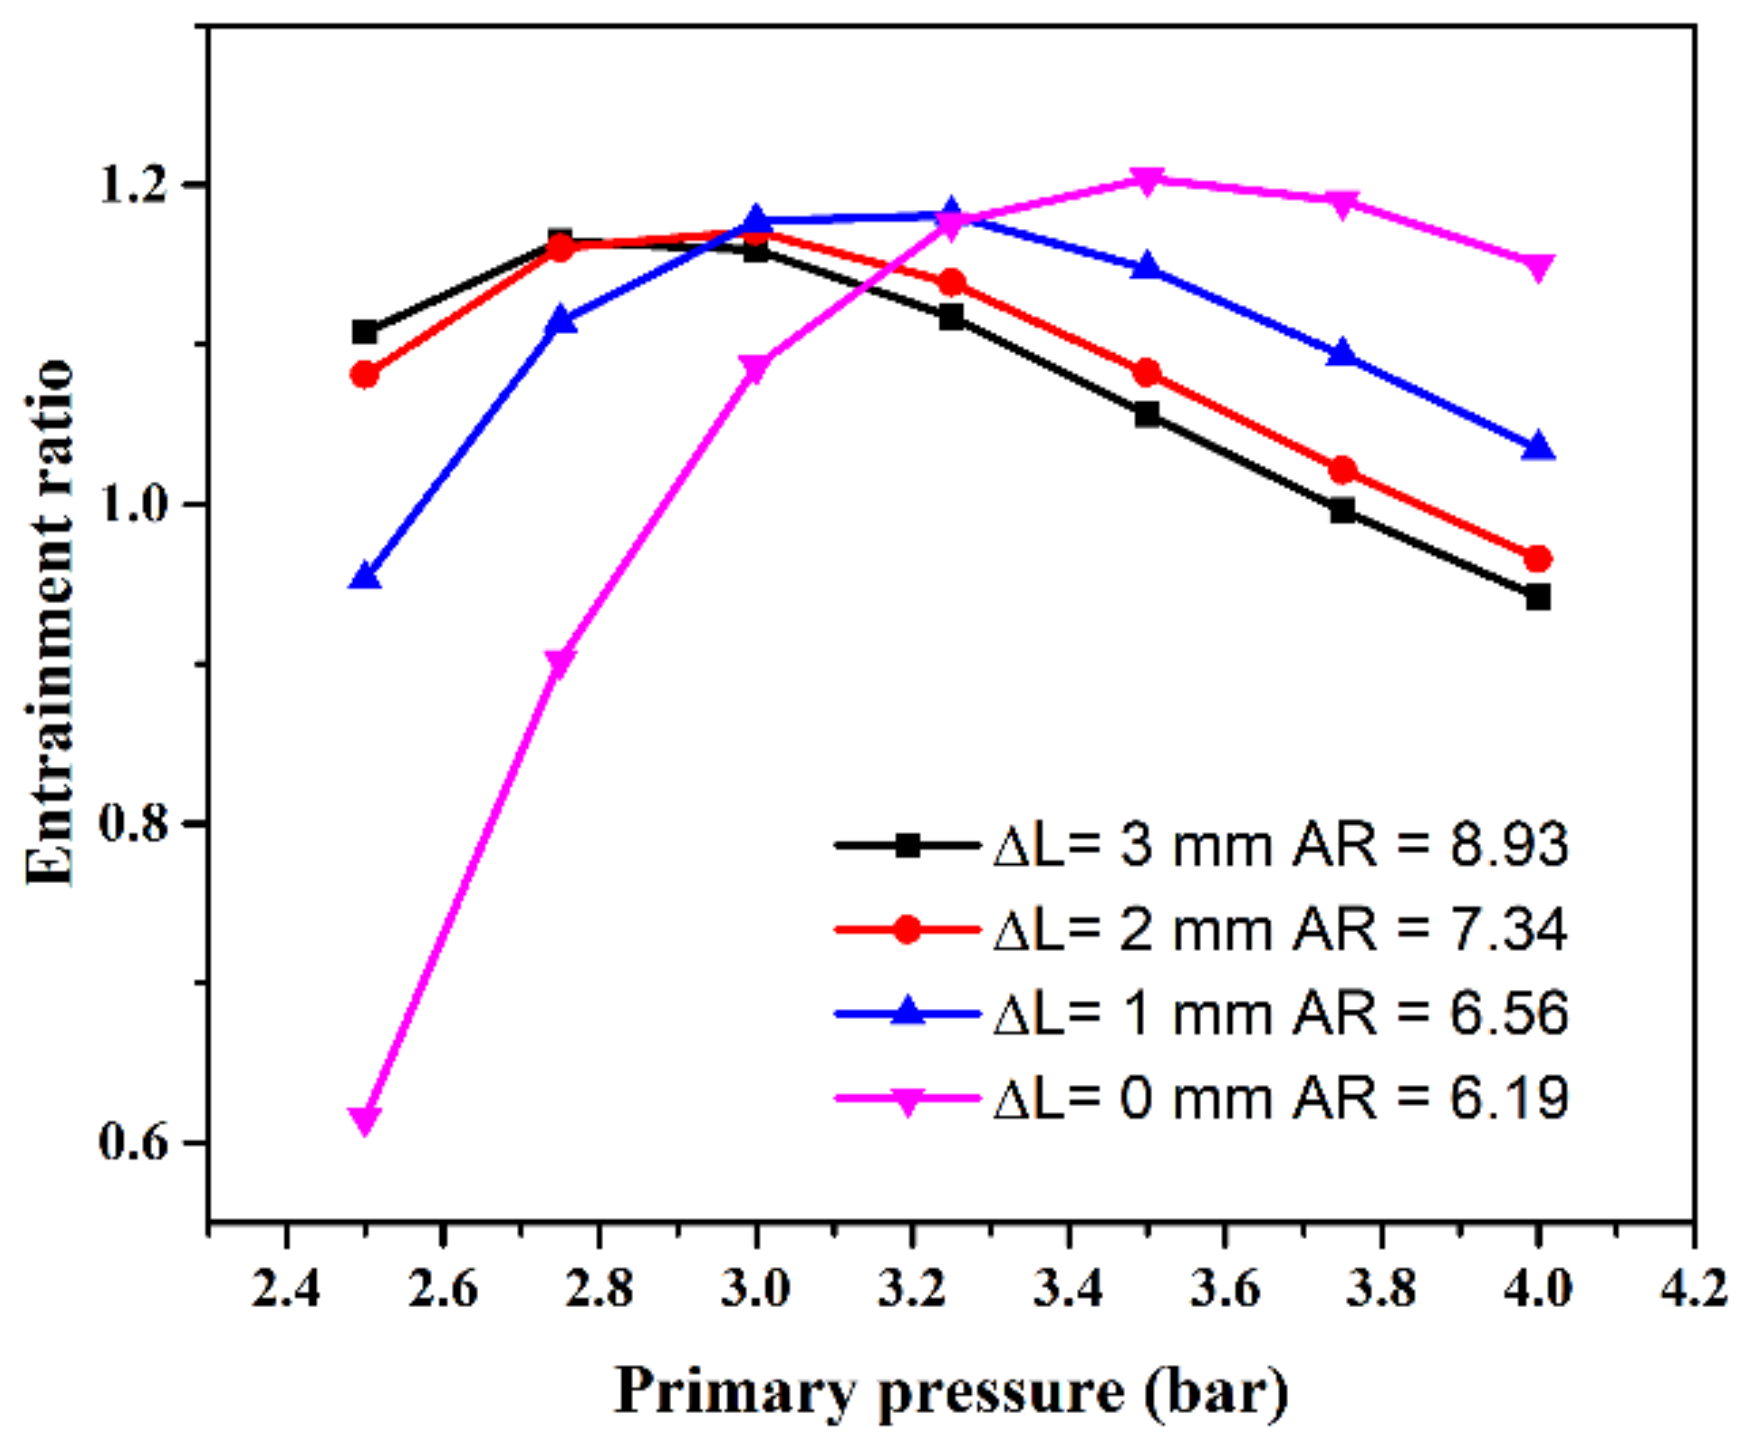
4.2.2. Influence of Primary Pressure Change on the Performance
Figure 12 shows the effect of expansion ratio variation on the entrainment ratio. The primary pressure changes gradually from 2.5 to 4 bar when the other boundary conditions are set as a secondary pressure of 0.1 bar, the back pressure of 0.35 bar, respectively. It can be seen that the ejector’s primary flow pressure has a huge impact on the ejector’s performance. The better performance of the ejector can be achieved with a smaller value of Δ
L when the primary flow pressure is less than three bar. The performance of the ejector with the large Δ
L is gradually improved with the primary pressure increasing. This phenomenon is consistent with the actual operating conditions of the ejector. When the pressure of the primary flow increases, the fluid exerts a thrust force on the spring to the right and pushes the ejector needle to the right and then the Δ
L increases. During this process, the ejector performance can always be maintained at a high level. When the primary pressure of the auto-adjusting ejector changes, its entrainment ratio increases first and then decreases and changes. The larger the distance is, the better the entrainment ratio obtained.
4.3. Performance Comparison with Traditional Ejector
The auto-adjusting ejector is compared to the traditional ejector in the primary pressure range of the variable operating conditions. To simplify the analysis, this work assumes that the needle position increases with the primary pressure, as shown in
Figure 13a. The two ejectors are set as the same boundary conditions (back pressure 0.35 bar, secondary pressure 0.1 bar, the primary pressure range of 2.5 bar to 4 bar) and the comparison result is shown in
Figure 13b. It is observed that the
ER of the auto-adjusting ejector only changes in a small range between 1.1 and 1.2, but the
ER of the traditional ejector decreases from 1 to 0.7 in the low-pressure range. The main reason is that the retracting needle allows the ejector to maintain a relatively stable operating state when the
AR increases with the primary pressure decreasing. The average
ER of the auto-adjusting ejector can reach 1.14 compared to 0.84 for the traditional ejector. Besides, when the primary flow pressure is 2.5 bar, the auto-adjusting ejector can improve the entrainment ratio by 1.6 times compared to the traditional ejector. Therefore, the performance and stability of the auto-adjusting ejector are superior to the traditional ejector under the variable operating conditions of primary flow driven by solar energy.


