
Comparison of Entropy Calculation Methods for Ransomware Encrypted File Identification


Abstract
:1. Introduction
- The main contribution of this paper is in initially assessing the commonly used entropy measurement methods, and use these to create a short-list of contenders that are assessed on a commonly used data set, for a range of success rate measurements against ransomware/encryption detection.
- Analyse a large and varied selection of entropy calculation methods in order to determine if any of the techniques are able to accurately distinguish between files generated by a crypto-ransomware and other common high entropy files such as compressed or archive file types.
- No other published research covers this extensive scope of entropy calculation analysis, using a standard data set, and thus provides a core contribution to crypto-ransomware detection research.
2. Related Work
3. Methodology
3.1. Proposed Tests
3.1.1. NIST SP-800 22
- Frequency (Monobit) Test. Determine whether the number of ones and zeros in an entire sequence is approximately the same as would be expected for a truly random sequence.
- Frequency Test within a Block. Determine whether the frequency of ones in an M-bit block is approximately , as would be expected under an assumption of randomness.
- Runs Test. Test the total number of runs in the sequence, where a run is an uninterrupted sequence of identical bits. The purpose of the Runs test is to determine whether the number of runs of ones and zeros of various lengths is as-expected for a random sequence. In particular, this test determines whether the oscillation between such zeros and ones is too fast or too slow.
- Test for the Longest Run of Ones in a Block. Determine whether the length of the longest run of ones within the tested sequence is consistent with the length of the longest run of ones that would be expected in a random sequence.
- Discrete Fourier Transform (Spectral) Test. Detect periodic features (i.e., repetitive patterns that are near each other) in the tested sequence that would indicate a deviation from the assumption of randomness. The intention is to detect whether the number of peaks exceeding the 95% threshold is significantly different than 5%.
- Non-overlapping Template Matching Test. Count the number of occurrences of pre-specified target strings and identifying too many occurrences of a given non-periodic (aperiodic) pattern. An example of an 68-bit aperiodic pattern being 0 1 1 1 1 1 1 1.
- Overlapping Template Matching Test. Similar to the previous test, this test also looks for occurrences of pre-specified target strings. When a match is found, this test moves the test window by one byte, whereas the previous test moves the test widow to the end of the matching sequence.
- Maurer’s Universal Statistical Test. This is the number of bits between matching patterns (a measure that is related to the length of a compressed sequence). The purpose of the test is to detect whether or not the sequence can be significantly compressed without loss of information. A significantly compressible sequence is considered to be non-random.
- Linear Complexity Test. This tests the length of a linear feedback shift register (LFSR). The linear complexity of a sequence equals to the length of the smallest linear feedback shift register (LFSR) that generates the given sequence. Random sequences are characterised by longer LFSR’s. An LFSR that is too short implies non-randomness.
- Serial Test. Test the frequency of all possible overlapping m-bit patterns across the entire sequence.
- Approximate Entropy Test. Similar to the previous test, this tests the frequency of all possible overlapping m-bit patterns across the entire sequence. The purpose of the test is to compare the frequency of overlapping blocks of two consecutive/adjacent lengths (m and m + 1) against the expected result for a random sequence.
- Cumulative Sums (Cusum) Test. The focus of this test is the maximal excursion (from zero) of the random walk defined by the cumulative sum of adjusted (−1, +1) digits in the sequence. For a random sequence, the excursions of the random walk should be near zero.
- Random Excursions Test. Test the number of cycles having exactly K visits in a cumulative sum random walk. This test is to determine if the number of visits to a particular state within a cycle deviates from what one would expect for a random sequence.
- Random Excursions Variant Test. Test the total number of times that a particular state is visited in a cumulative sum random walk. The purpose of this test is to detect deviations from the expected number of visits to various states in the random walk.
3.1.2. Dieharder2
3.1.3. PractRand
3.1.4. Mathematical Tests
- H is the entropy (measured in bits)
- n number of bytes in the sample
- probability of byte i appearing in the stream of bytes.
- The negative sign ensures that the result is always positive or zero.
- Chi-square. The chi-square (X) test is a popular statistical test generally used to determine if an observed distribution is statistically similar to an expected distribution [58]. In the case of perfectly random data on the file system, we would expect an equal occurrence of each byte value. In the case of crypto-ransomware detection, where the files are encrypted, we use equal frequencies of byte values for the expected distribution, and use the formula presented in Equation (2), to check if the observed distribution is similar [57,59]:where
- = chi squared
- = Observed value
- = Expected value
- Monte Carlo. This is a technique of approximating the value of a function where calculating the actual value is difficult or impossible. It uses random sampling to define constraints on the value and then makes a sort of best guess [60]. The underlying concept is to use randomness to solve problems that might be deterministic in principle. Monte Carlo values are calculated using the formula presented in Equation (3) and were calculated using the ent [57] program.where
- E = Result of approximation
- = Randomly chosen value
- Arithmetic Mean. The mean is the average or the most common value in a collection of numbers and is calculated by adding all the numbers in a given data set and then dividing it by the total number of members of that data set. The formula used to calculate this value is presented in Equation (4) and were calculated using the ent [57] program.where
- M = Arithmetic Mean
- S = Sum of Observations
- T = Sum of Observations
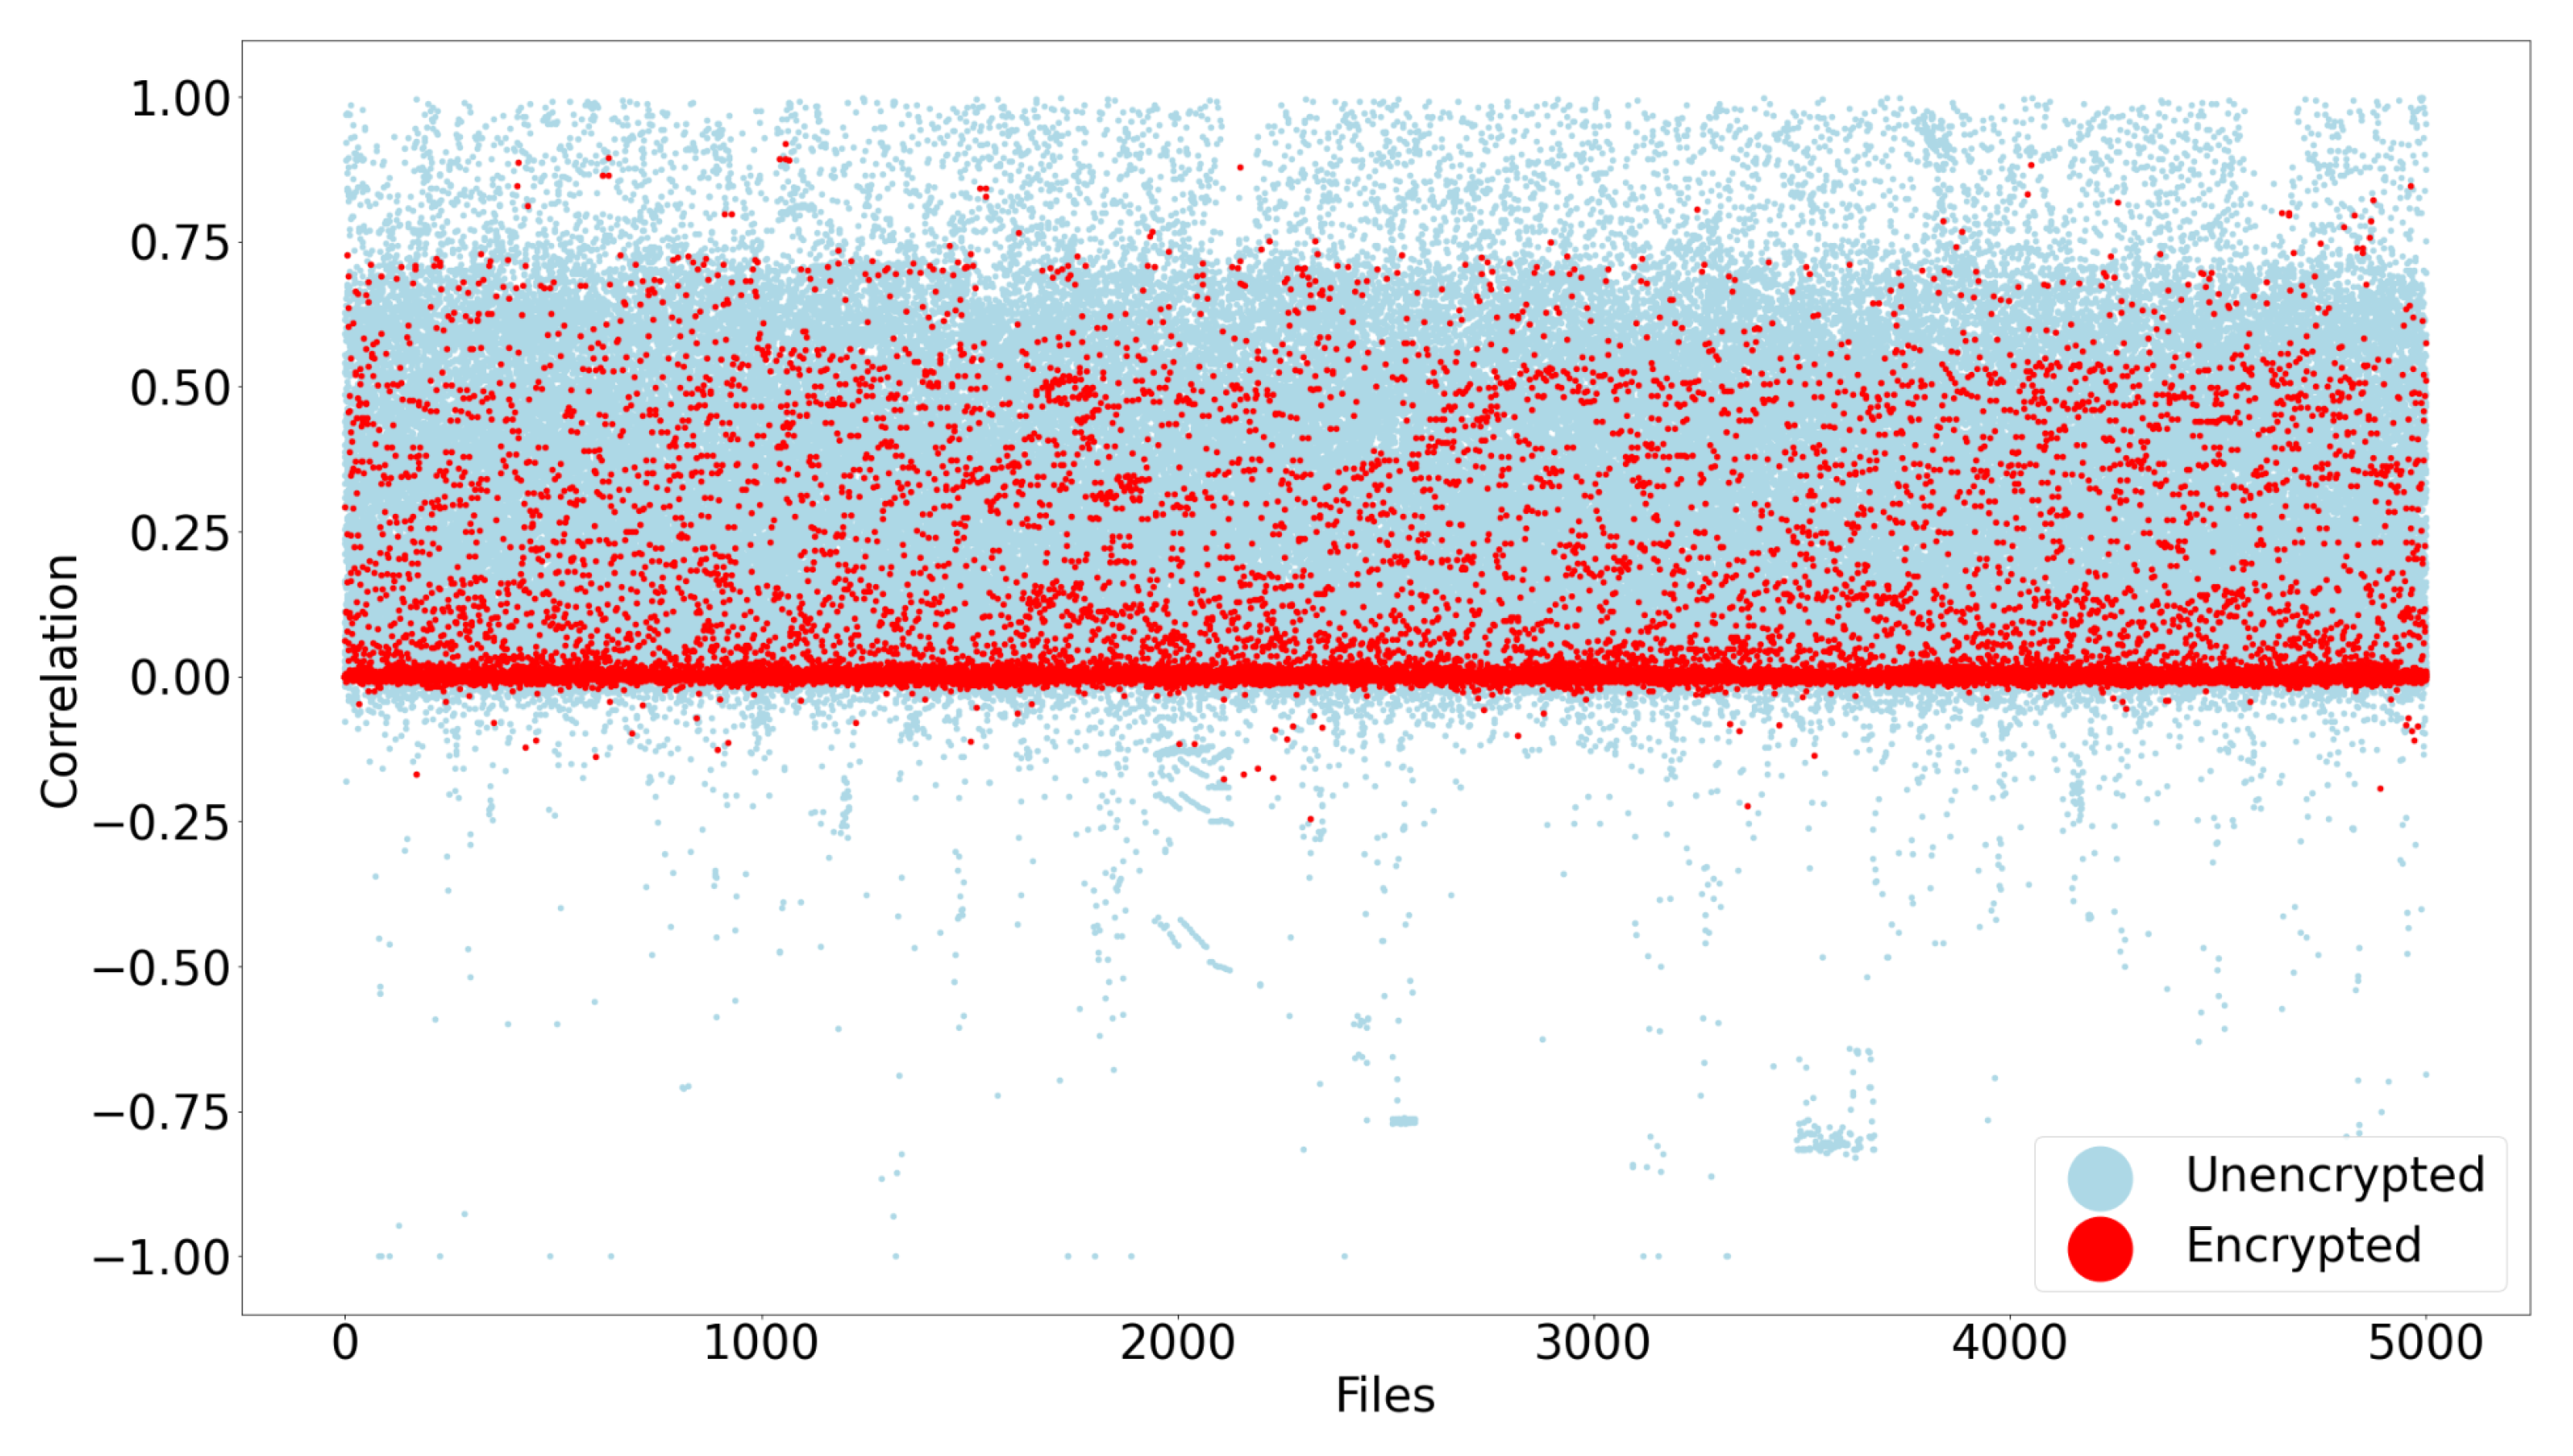
- Serial Byte Correlation Coefficient. A lightweight statistical test that looks at the relationship between consecutive numbers. This quantity measures the extent to which each byte in the file depends upon the previous byte. Tests the correlation between bytes written to a file, expecting a low value for encrypted files [8]. For random sequences, this value (which can be positive or negative) will, of course, be close to zero. The Serial Correlation Coefficient of a sequence is calculated using the formula given by Knuth [61]. For a sequence of numbers , , ,....., , the Serial Byte Correlation Coefficient is defined as shown in Equation (5) and was calculated using the ent [57] program:Kullback-Liebler(KL). KL divergence, which is closely related to relative entropy, information divergence, and information for discrimination, is a non-symmetric measure of the difference between two probability distributions and has been suggested as a good test [30], especially when considering high entropy files that are not encrypted. The equation for this calculation is shown in Equation (6).where is the relative entropy
- n is the number of bytes in the sample
- first probability distribution
- second probability distribution
3.1.5. Other Tests Considered
- TESTU01 A popular [43] software library implemented in the ANSI C language and offers a collection of utilities for the empirical statistical testing of uniform random number generators (RNGs) including several pre-configured groups of tests called SmallCrush, Crush and BigCrush [44]. A significant amount of effort was spent attempting to utilise this library to perform statistical analysis on bitstreams, unfortunately without success as the sourced package for this library would not compile on the authors’ platform.
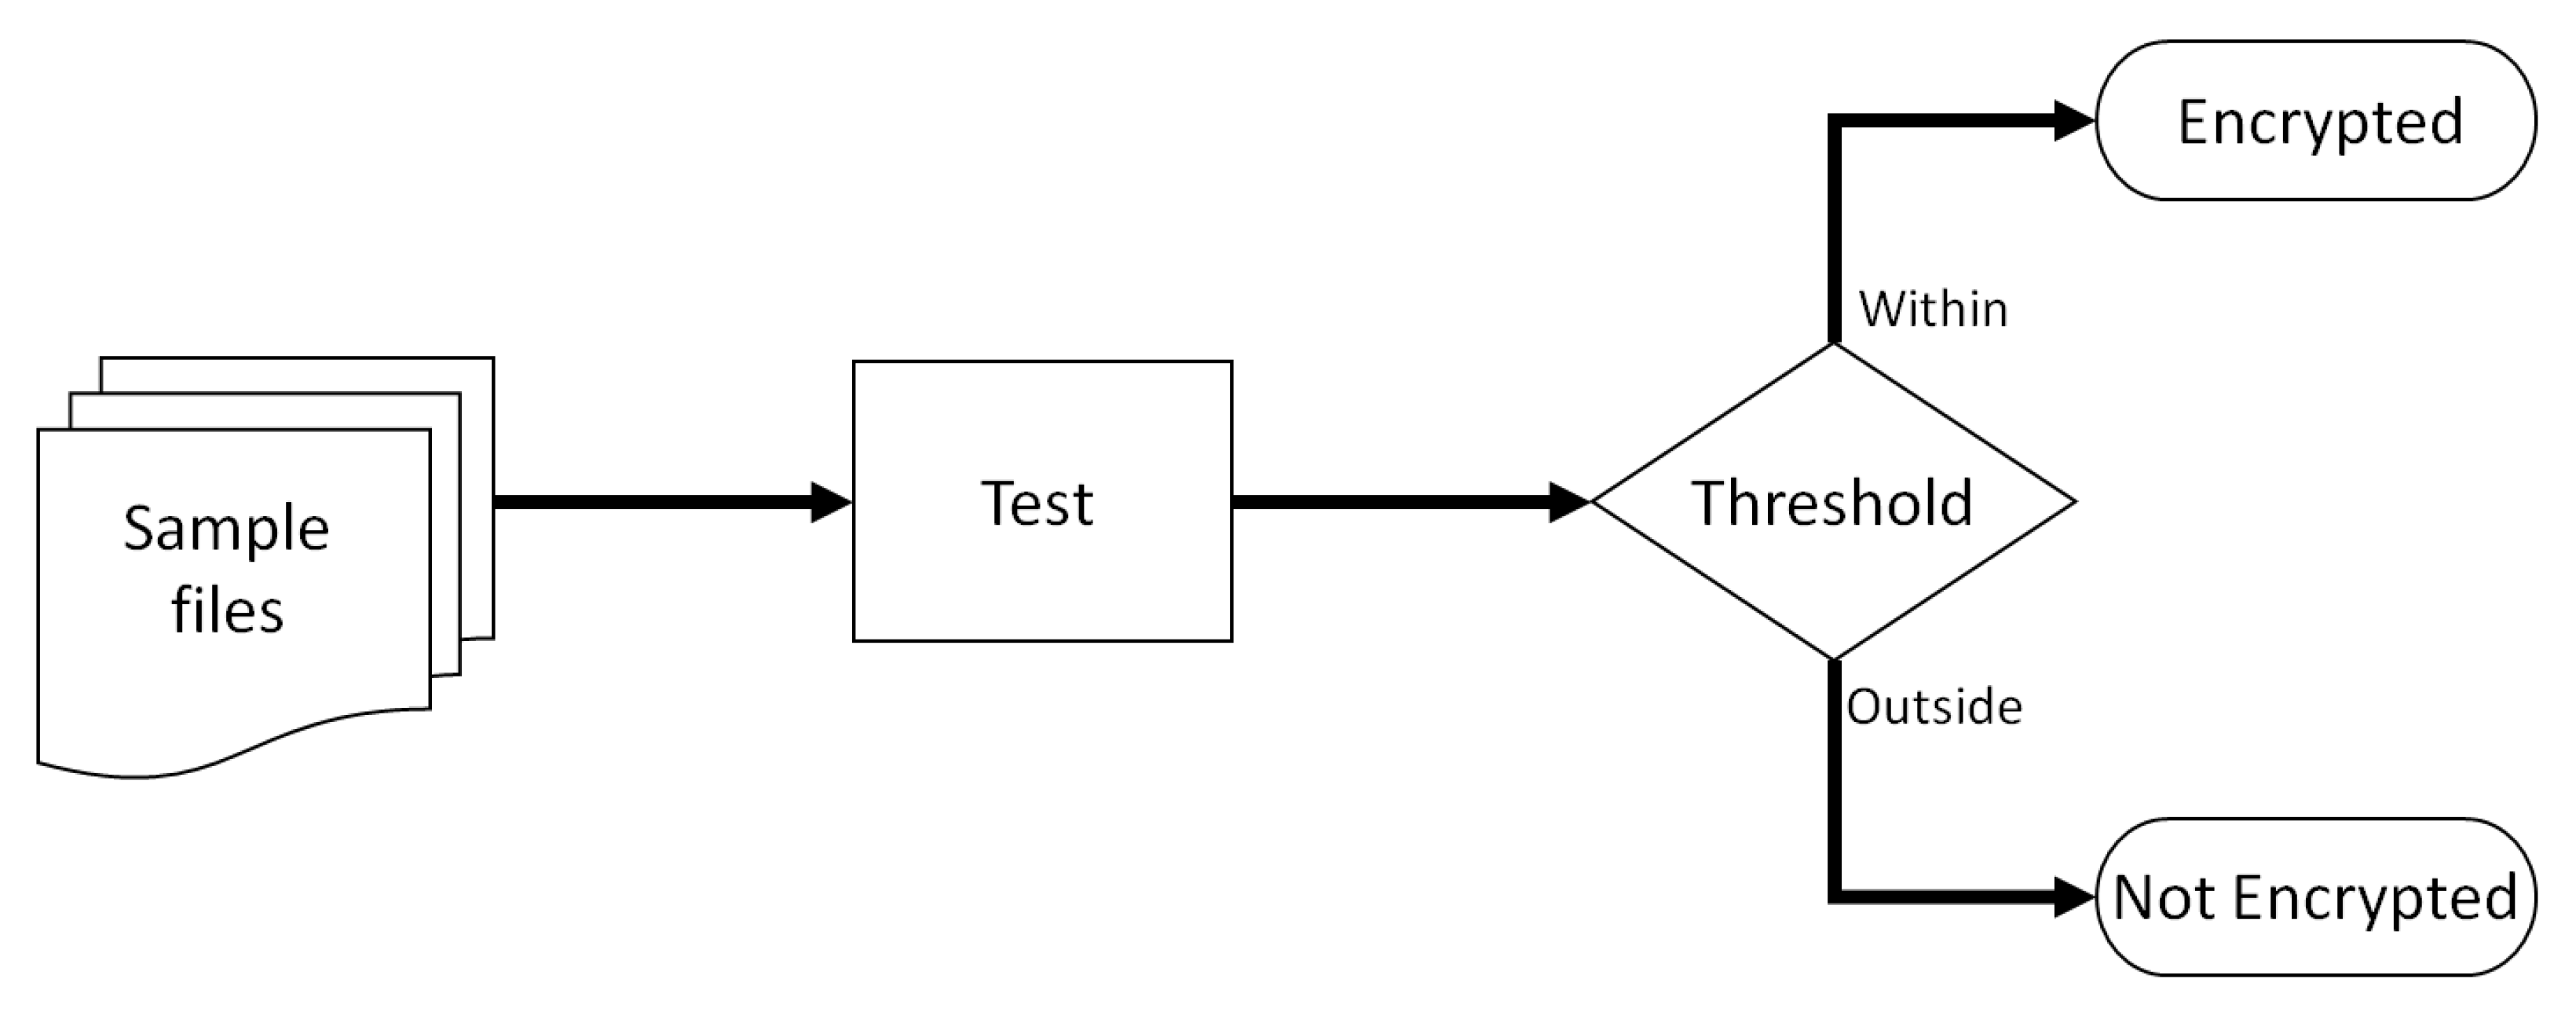
3.2. Experimental Overview
3.3. Classification
- Recall Shown in Equation (8), is used to calculate how often the test correctly predicted the result.Precision Shown in Equation (9), is used to calculate how often the test is correct.F1 Shown in Equation (10), is used to calculate how balanced the test is between the precision and the recall values.
4. Implementation and Evaluation
4.1. Phase one Testing, Qualification
4.2. Results from Phase One Testing
4.3. Phase Two Testing
4.4. Results from Phase Two Testing
5. Conclusions
5.1. Limitations
5.2. Future Work
Author Contributions
Funding
Informed Consent Statement
Data Availability Statement
Conflicts of Interest
Appendix A. Dieharder2 Test Description
- Test 1—Overlapping 5-Permutations Test. Analyse sequences of five consecutive random numbers. The 120 possible orderings should occur with statistically equal probability [42]
- Test 2—32 × 32 Binary Rank Test. Select 1024 bits from the random number sequence random numbers to form a matrix over 0,1, then determine the rank of the matrix. Count the ranks.
- Test 3—6 × 8 Binary Rank Test. Similar to the previous test, but in this test selects 48 bits from the random number sequence of random numbers to form a matrix over 0,1, then determine the rank of the matrix. Count the ranks.
- Test 4—Bitstream Test. The file under test is viewed as a stream of bits. Consider an alphabet with two “letters” of, 0 and 1 and define the stream of bits as a succession of 20-letter “words”, overlapping. The bitstream test counts the number of missing 20-letter (20-bit) words in a string of overlapping 20-letter words. There are possible 20-letter words. For a truly random string of + 19 bits, the number of missing words j should be normally distributed with mean 141,909 and sigma 428.
- Test 5—Overlapping Pairs Sparse Occupancy (OPSO). Generate a long sequence of random floats on (0,1). Add sequences of 100 consecutive floats. The sums should be normally distributed with characteristic mean and variance. The test considers 2-letter words from an alphabet of 1024 letters. Each letter is determined by a specified ten bits from a 32-bit integer in the sequence to be tested. OPSO generates (overlapping) 2-letter words and counts the number of missing words that do not appear in the entire sequence [42].
- Test 6—Overlapping Quadruples Sparse Occupancy
- (OQSO) Test. Similar to the OPSD test, except this test considers 4 letter words from an alphabet of 32 letters.
- Test 7—DNA Test. Again similar to the previous two tests, except this test considers an alphabet of 4 letters: C, G, A, T, determined by two designated bits in the sequence of random integers being tested.
- Test 8—Count the 1’s (stream) Test. Consider the file under test as a stream of bytes (four per 32-bit integer). Each byte can contain from 0 to 8 1’s. Now let the stream of bytes provide a string of overlapping 5-letter words, each “letter” taking values A, B, C, D or E. There are possible 5-letter words, and from a string of 256,000 (overlapping) 5-letter words, counts are made on the frequencies for each word.
- Test 9—Count the 1’s Test (byte). This is similar to the previous test, except the calculations are performed on specific bytes [42].
- Test 10—Parking Lot Test. This tests the distribution of attempts to randomly park a square car of length 1 on a 100 × 100 parking lot without crashing. A square is successfully parked if it does not overlap an existing successfully parked one. After 12,000 tries, the number of successfully parked squares should follow a certain normal distribution.
- Test 11—Minimum Distance (2D Circle) Test. Randomly place 8000 points in a circle with a diameter of 10,000 points, then find the minimum distance between the pairs. The square of this distance should be exponentially distributed with a certain mean.
- Test 12—3D Sphere (Minimum Distance) Test. Randomly place 4000 points in a cube of edge 1000. At each point, centre a sphere large enough to reach the next closest point. Then the volume of the smallest such sphere is (very close to) exponentially distributed with a mean of . Thus, the radius cubed is exponential with mean of 30.
- Test 13—Squeeze Test. Random integers are floated to get uniforms on [0,1). Starting with k = , the test finds j, the number of iterations necessary to reduce k to 1, using the reduction k = ceiling(), with U provided by floating integers from the file being tested.
- Test 14—Sums Test. Integers are floated to get a sequence U(1), U(2), ... of uniform [0,1) variables. Then overlapping sums, S(1) = U(1) + ... + U(100), S2 = U(2) + ... + U(101), ... are formed. The S’s are virtually normal with a certain covariance matrix.
- Test 15—Runs Test. This test counts runs up, and runs down, in a sequence of uniform [0,1) variables, obtained by floating the 32-bit integers in the specified file. The covariance matrices for the runs-up and runs-down are well known, leading to chi-square tests for quadratic forms in the weak inverses of the covariance matrices. Runs are counted for sequences of length 10,000.
- Test 16—Craps Test. This test plays 200,000 games of craps and then finds the number of wins and the number of throws necessary to end each game. The number of wins should be (very close to) a normal with a mean 200,000p and a variance 200,000p(1-p), with p = 244/495. Throws necessary to complete the game can vary from 1 to infinity, but counts for all>21 are lumped with 21. A chi-square test is made on the no.-of-throws cell counts. Each 32-bit integer from the test file provides the value for the throw of a die, by floating to [0,1), multiplying by 6 and taking 1 plus the integer part of the result.
- Test 17—Marsaglia and Tsang GCD Test. Randomness tests are conducted over two outputs of the greatest common divisor operation, namely the number of required iterations and the value of greatest common divisor. The Kolmogorov–Smirnov, Anderson-Darling, Jarque-Bera, and Chi-Square tests are applied as goodness-of-fit tests when the test is conducted over the number of required iterations.
- Test 100—STS Monobit Test. Counts the bits that are in unity in a long string of random units.
- Test 101—STS Runs Test. Counts the total number of 0 runs + total number of 1 runs across a sample of bits.
- Test 102—STS Serial Test. Accumulates the frequencies of overlapping n-tuples of bits drawn from a source of random integers. With overlap, the test statistics are more complex. There is considerable covariance in the bit frequencies and a simple chi-square test no longer suffices.
- Test 200—RGB Bit Distribution Test. Accumulates the frequencies of all n-tuples of bits in a list of random integers and compares the distribution thus generated with the theoretical (binomial) histogram, forming chi-square and the associated p-value.
- Test 201—Generalised Minimum Distance Test. This is a more generalised implementation of the 2d circle and 3d sphere tests.
- Test 202—RGB Permutations Test. This is a non-overlapping test that simply counts order permutations of random numbers, pulled out n at a time. There are n! permutations and all are equally likely. The samples are independent, so one can do a simple chi-square test on the count vector with n! - 1 degree of freedom. This is an inferior version of the overlapping permutations tests, which are much more difficult because of the covariance of the overlapping samples.
- Test 203—RGB Lagged Sums Test. This tests for the possibility that the input stream has a bit-level correlation after some fixed number of intervening bits.
- Test 204 -The Kolmogorov–Smirnov Test. This test generates a vector of tsamples uniform deviates from the input stream and then applies an Anderson-Darling or Kuiper KS test to it to directly test for uniformity.
- Test 205—DAB Byte Distribution Test. Extract n independent bytes from each of k consecutive words. Increment indexed counters in each of n tables, then use a basic chi-square fitting test for the p-value.
- Test 206—DCT (Frequency Analysis) Test. This test performs a Discrete Cosine Transform calculations on blocks of the input stream.
- Test 207—DAB Fill Tree Test. This test fills small binary trees of fixed depth with words from the source file. When a word cannot be inserted into the tree, the current count of words in the tree is recorded, along with the position at which the word would have been inserted.
- Test 208—DAB Fill Tree 2 Test. Bit version of Fill Tree test.
- Test 209—DAB Monobit 2 Test. Determine whether the number of ones and zeros in a sequence is approximately the same as would be expected for a truly random sequence, using multiple block sizes.
Appendix B. Ransomware Strains

| Ransomware Samples | Hash |
|---|---|
| BLACKMATTER | be5bc29f58b868f4ff8cd66b4526535593e515a697bb8951c625bdfed13cccb7 |
| CONTI | d3c75c5bc4ae087d547bd722bd84478ee6baf8c3355b930f26cc19777cd39d4c |
| DARKSIDE | 508dd6f7ed6c143cf5e1ed6a4051dd8ee7b5bf4b7f55e0704d21ba785f2d5add |
| DHARMA | c2ab289cbd2573572c39cac3f234d77fdf769e48a1715a14feddaea8ae9d9702 |
| GANDCRAB | 64d341ecbc52f9d78080bf23559ec1778824979dd19498ee44032ec1d5224ff6 |
| HELLOKITTY | 501487b025f25ddf1ca32deb57a2b4db43ccf6635c1edc74b9cff54ce0e5bcfe |
| MAZE | c2ab289cbd2573572c39cac3f234d77fdf769e48a1715a14feddaea8ae9d9702 |
| NETWALKER | 57cf4470348e3b5da0fa3152be84a81a5e2ce5d794976387be290f528fa419fd |
| NOTPETYA | 027cc450ef5f8c5f653329641ec1fed91f694e0d229928963b30f6b0d7d3a74 |
| PHOBOS | a91491f45b851a07f91ba5a200967921bf796d38677786de51a4a8fe5ddeafd2 |
| RYUK | 06b323e0b626dc4f051596a39f52c46b35f88ea6f85a56de0fd76ec73c7f3851 |
| SODINOKIBI | 06b323e0b626dc4f051596a39f52c46b35f88ea6f85a56de0fd76ec73c7f3851 |
References
- Sophos. The State of Ransomware in Education 2021; Technical Report April; Sophos: Oxford, UK, 2021. [Google Scholar]
- Johns, E. Cyber Security Breaches Survey 2020; Technical Report 4; Department for Digital, Culture, Media and Sport: London, UK, 2020. [Google Scholar] [CrossRef] [Green Version]
- Institute for Security and Technology. Combating Ransomware Technical Report; Intel Security Group: San Francisco, CA, USA, 2021; pp. 1–81. [Google Scholar]
- Genç, Z.A.; Lenzini, G.; Ryan, P.Y. Next Generation Cryptographic Ransomware. In Proceedings of the Nordic Conference on Secure IT Systems, Oslo, Norway, 28–30 November 2018; pp. 385–401. [Google Scholar] [CrossRef] [Green Version]
- Genç, Z.A.; Lenzini, G.; Ryan, P.Y.A. NoCry: No More Secure Encryption Keys for Cryptographic Ransomware. In Proceedings of the International Workshop on Emerging Technologies for Authorization and Authentication, Luxembourg, 27 September 2019; pp. 69–85. [Google Scholar] [CrossRef] [Green Version]
- Kharraz, A.; Kirda, E. Redemption: Real-Time Protection Against Ransomware at End-Hosts. In Proceedings of the International Symposium on Research in Attacks, Intrusions, and Defenses, Atlanta, GA, USA, 18–20 September 2017; pp. 98–119. [Google Scholar] [CrossRef]
- McIntosh, T.; Jang-Jaccard, J.; Watters, P.; Susnjak, T. The Inadequacy of Entropy-Based Ransomware Detection. In Proceedings of the International Conference on Neural Information Processing, Sydney, Australia, 12–15 December 2019; Springer International Publishing: New York, NY, USA, 2019; Volume 1, pp. 181–189. [Google Scholar] [CrossRef]
- Pont, J.; Abu Oun, O.; Brierley, C.; Arief, B.; Hernandez-Castro, J. A Roadmap for Improving the Impact of Anti-ransomware Research. In Proceedings of the International Conference on Neural Information Processing, Sydney, Australia, 12–15 December 2019; Springer International Publishing: New York, NY, USA, 2019; pp. 137–154. [Google Scholar] [CrossRef]
- Rossow, C.; Dietrich, C.J.; Grier, C.; Kreibich, C.; Paxson, V.; Pohlmann, N.; Bos, H.; Van Steen, M. Prudent practices for designing malware experiments: Status quo and outlook. In Proceedings of the IEEE Symposium on Security and Privacy, San Francisco, CA, USA, 20–23 May 2012; pp. 65–79. [Google Scholar] [CrossRef] [Green Version]
- Davies, S.R.; Macfarlane, R.; Buchanan, W.J. NapierOne. 2021. Available online: https://www.napierone.com (accessed on 19 October 2022).
- Davies, S.R.; Macfarlane, R.; Buchanan, W.J. NapierOne: A modern mixed file data set alternative to Govdocs1. Forensic Sci. Int. Digit. Investig. 2022, 40, 301330. [Google Scholar] [CrossRef]
- Kolodenker, E.; Koch, W.; Stringhini, G.; Egele, M. PayBreak: Defense against cryptographic ransomware. In Proceedings of the 2017 ACM Asia Conference on Computer and Communications Security, Abu Dhabi, United Arab Emirates, 2–6 April 2017; pp. 599–611. [Google Scholar] [CrossRef]
- Lee, K.; Lee, S.Y.; Yim, K. Machine Learning Based File Entropy Analysis for Ransomware Detection in Backup Systems. IEEE Access 2019, 7, 110205–110215. [Google Scholar] [CrossRef]
- Scaife, N.; Carter, H.; Traynor, P.; Butler, K.R. CryptoLock (and Drop It): Stopping Ransomware Attacks on User Data. In Proceedings of the 2016 IEEE 36th International Conference on Distributed Computing Systems (ICDCS), Nara, Japan, 27–30 June 2016; pp. 303–312. [Google Scholar] [CrossRef]
- Singh, A.; Ikuesan, A.; Venter, H. A context-aware trigger mechanism for ransomware forensics. In Proceedings of the 14th International Conference on Cyber Warfare and Security, ICCWS 2019, Stellenbosch, South Africa, 28 February–1 March 2019; pp. 629–638. [Google Scholar]
- Shannon, C. A Mathematical Theory of Communication. Bell Syst. Technol. 1948, 27, 379–423. [Google Scholar] [CrossRef] [Green Version]
- Kim, H.E.; Yoo, D.; Kang, J.S.; Yeom, Y. Dynamic ransomware protection using deterministic random bit generator. In Proceedings of the 2017 IEEE Conference on Applications, Information and Network Security, AINS 2017, Miri, Malaysia, 13–14 November 2017; pp. 64–68. [Google Scholar] [CrossRef]
- Casino, F.; Choo, K.K.R.; Patsakis, C. HEDGE: Efficient Traffic Classification of Encrypted and Compressed Packets. IEEE Trans. Inf. Forensics Secur. 2019, 14, 2916–2926. [Google Scholar] [CrossRef] [Green Version]
- Cleary, G. Digital Evidence Detection Using Bytewise Approximate Matching Gabrielle Cleary RD5 Report Edinburgh Napier University School of Computing; Technical Report January; Edinburgh Napier University: Edinburgh, UK, 2018. [Google Scholar]
- Continella, A.; Guagnelli, A.; Zingaro, G.; De Pasquale, G.; Barenghi, A.; Zanero, S.; Maggi, F. ShieldFS: A self-healing, ransomware-aware file system. In Proceedings of the 32nd Annual Conference on Computer Security Applications, Los Angeles, CA, USA, 5–8 December 2016; pp. 336–347. [Google Scholar] [CrossRef]
- De Gaspari, F.; Hitaj, D.; Pagnotta, G.; De Carli, L.; Mancini, L.V. Reliable detection of compressed and encrypted data. Neural Comput. Appl. 2022, 34, 20379–20393. [Google Scholar] [CrossRef]
- Frei, S.; Schatzmann, D.; Plattner, B.; Trammell, B. Modeling the Security Ecosystem—The Dynamics of (In)Security. Econ. Inf. Secur. Priv. 2010, 79–106. [Google Scholar] [CrossRef]
- Georgescu, C.; Simion, E. New results concerning the power of NIST randomness tests. Proc. Rom. Acad. Ser. A-Math. Phys. Tech. Sci. Inf. Sci. 2017, 18, 381–388. [Google Scholar]
- Grance, T.; Kent, K.; Kim, B. Computer Security Incident Handling Guide; Nist Special Publication: Gaithersburg, MD, USA, 2004; p. 148. [CrossRef]
- Kharraz, A.; Arshad, S.; Mulliner, C.; Robertson, W.; Kirda, E. UNVEIL: A Large-Scale, Automated Approach to Detecting Ransomware. In Proceedings of the Usenix 25th USENIX Security Symposium, Austin, TX, USA, 10–12 August 2016; pp. 757–772. [Google Scholar]
- Mehnaz, S.; Mudgerikar, A.; Bertino, E. RWGuard: A Real-Time Detection System Against Cryptographic Ransomware. In International Symposium on Research in Attacks, Intrusions, and Defenses; Springer International Publishing: Crete, Greece, 2018; Volume 1, pp. 114–136. [Google Scholar] [CrossRef]
- Rev, S.P.; Proposal, D. NIST SP 800-22 and GM / T 0005-2012 Tests: Clearly Obsolete, Possibly Harmful A Systemic Problem: Security Is Not Considered; Technical Report, Pdshield; IACR Cryptol. ePrint Arch.: Oxford, UK, 2022. [Google Scholar]
- Silva, J.A.; López, L.I.B.; Caraguay, Á.L.V.; Hernández-álvarez, M. A survey on situational awareness of ransomware attacks-detection and prevention parameters. Remote. Sens. 2019, 11, 1168. [Google Scholar] [CrossRef]
- William, E.; Donna, F.; Elaine, M.; Ray, A.; William, T.; Emad, A. NIST Special Publication 800-63-2 Electronic Authentication Guideline; Technical Report; NIST: Gaithersburg, MD, USA, 2017. [CrossRef]
- Mbol, F.; Robert, J.M.; Sadighian, A. An Efficient Approach to Detect TorrentLocker Ransomware in Computer Systems. In Proceedings of the 15th International Conference, CANS 2016, Milan, Italy, 14–16 November 2016; pp. 532–541. [Google Scholar] [CrossRef]
- Choudhury, P.; Kumar, K.R.; Nandi, S.; Athithan, G. An empirical approach towards characterization of encrypted and unencrypted VoIP traffic. Multimed. Tools Appl. 2019, 79, 603–631. [Google Scholar] [CrossRef]
- Hahn, D.; Apthorpe, N.; Feamster, N. Detecting Compressed Cleartext Traffic from Consumer Internet of Things Devices. ArXiv 2018, arXiv:1805.02722v1. [Google Scholar]
- Palisse, A.; Durand, A.; Le Bouder, H.; Le Guernic, C.; Lanet, J.L. Data aware defense (DaD): Towards a generic and practical ransomware countermeasure. Lect. Notes Comput. Sci. 2017, 10674, 192–208. [Google Scholar] [CrossRef] [Green Version]
- Ryan, H. Evaluating File Format Endangerment Levels and Factors. Ph.D. Thesis, University of North Carolina, Chapel Hill, NC, USA, 2014. [Google Scholar]
- Wang, R.; Shoshitaishvili, Y.; Kruegel, C.; Vigna, G. Steal this movie—Automatically bypassing DRM protection in streaming media services. In Proceedings of the 22nd USENIX Security Symposium, Berkeley, CA, USA, 14–16 August 2013; pp. 687–702. [Google Scholar]
- Weston, P.J.; Wolthusen, S.D. Forensic entropy analysis of microsoft windows storage volumes. SAIEE Afr. Res. J. 2014, 105, 21–28. [Google Scholar] [CrossRef]
- NIST. Cryptographic Module Validation Program|CSRC; NIST: Gaithersburg, MD, USA, 2021. Available online: https://csrc.nist.gov/projects/cryptographic-module-validation-program (accessed on 19 October 2022).
- GM/T 0005-2012; SCA. Randomness Test Specification. Cryptography Industry Standard of the P.R. China. March 2012. Available online: https://www.chinesestandard.net/ (accessed on 19 October 2022).
- Zheng, W. GM/T 0005-2012: PDF in English. 2012. Available online: https://www.chinesestandard.net/PDF.aspx/GMT0005-2012 (accessed on 19 October 2022).
- U.S. Department of Commerce. Federal Information Processing Standards Publication 140-3; Technical Report; U.S. Department of Commerce: Gaithersburg, MD, USA, 2019. [CrossRef]
- Brown, R.G. Die Harder; Technical Report; Duke University Physics Department: Durham, UK, 2006. [Google Scholar]
- Cedar101. Dieharder Tests. Available online: https://en.wikipedia.org/wiki/Diehard_tests (accessed on 5 May 2022).
- Álvarez, R.; Martínez, F.; Zamora, A. Improving the Statistical Qualities of Pseudo Random Number Generators. Symmetry 2022, 14, 269. [Google Scholar] [CrossRef]
- L’ecuyer, P.; Simard, R. TestU01: A C library for empirical testing of random number generators. ACM Trans. Math. Softw. 2007, 33, 1–40. [Google Scholar] [CrossRef]
- Rukhin, A.; Soto, J.; Nechvatal, J. A Statistical Test Suite for Random and Pseudorandom Number Generators for Cryptographic Applications; National Institute of Standards and Technology: Gaithersburg, MD, USA, 2010; Volume 22.
- NIST. Proposal to Revise SP 800-22 Rev. 1a | CSRC. 2022. Available online: https://csrc.nist.gov/News/2022/proposal-to-revise-sp-800-22-rev-1a (accessed on 19 October 2022).
- Marsaglia, G. DIEHARD Statistical Tests. Available online: https://web.archive.org/web/20160125103112/http:/stat.fsu.edu/pub/diehard (accessed on 19 October 2022).
- Sýs, M.; Říha, Z. Faster randomness testing with the NIST statistical test suite. Lect. Notes Comput. Sci. 2014, 8804, 272–284. [Google Scholar] [CrossRef]
- Tompson, J. hGitHub-jeffTompson/DiehardCDROM: A Re-Creation of the Original Diehard Random Number CD-ROM. Available online: https://github.com/jeffThompson/DiehardCDROM (accessed on 25 April 2022).
- Doty-Humphrey, C. PractRand. Available online: http://pracrand.sourceforge.net/ (accessed on 3 May 2022).
- Gevorkyan, M.N.; Demidova, A.V.; Korol’kova, A.V.; Kulyabov, D.S. A Practical Approach to Testing Random Number Generators in Computer Algebra Systems. Comput. Math. Math. Phys. 2020, 60, 65–73. [Google Scholar] [CrossRef]
- O’Neill, M. PCG, A Family of Better Random Number Generators | PCG, A Better Random Number Generator. Available online: https://www.pcg-random.org/index.html (accessed on 12 March 2022).
- Rosetta. Entropy. 2020. Available online: http://rosettacode.org/wiki/Entropy (accessed on 12 October 2022).
- VandenBrink, R. Using File Entropy to Identify “Ransomwared” Files. 2016. Available online: https://isc.sans.edu/forums/diary/Using+File+Entropy+to+Identify+Ransomwared+Files/21351/ (accessed on 12 October 2022).
- Hall, G.A. Sliding Window Measurement for File Type Identification. Available online: https://www.researchgate.net/publication/237601448_Sliding_Window_Measurement_for_File_Type_Identification (accessed on 12 October 2022).
- Schneier, B. Applied Cryptograph, Second Edition: Protocols, Algorithms and Source Code in C; John Wiley & Sons, Inc.: Wiley, NJ, USA, 1996; p. 251. ISBN 9780471117094. [Google Scholar]
- Walker, J. Pseudorandom Number Sequence Test Program. 2008. Available online: https://www.fourmilab.ch/random/ (accessed on 19 October 2022).
- Karl Pearson, F.R.S. X. On the criterion that a given system of deviations from the probable in the case of a correlated system of variables is such that it can be reasonably supposed to have arisen from random sampling. J. Sci. 2009, 50, 157–175. [Google Scholar] [CrossRef] [Green Version]
- Pont, J.; Hernandez-Castro, J. Why Current Statistical Approaches to Ransomware Detection Fail. In Proceedings of the International Conference on Information Security, 23rd Information Security Conference, Bali, Indonesia, 16–18 December 2020; pp. 199–218. [Google Scholar] [CrossRef]
- Mol, M. Monte Carlo Methods-Rosetta Code. Available online: http://rosettacode.org/wiki/Monte_Carlo_methods (accessed on 19 October 2022).
- Knuth, D.E. The Art of Computer Programming. Volume 2, Seminumerical Algorithms, 3rd ed.; Addison Wesley: Boston, MA, USA, 1997; p. 72. [Google Scholar]
- Ting, K.M. Confusion Matrix. In Encyclopedia of Machine Learning and Data Mining; Springer: Boston, MA, USA, 2017; p. 260. [Google Scholar] [CrossRef]
- Yuste, J.; Pastrana, S. Avaddon ransomware: An in-depth analysis and decryption of infected systems. Comput. Secur. 2021, 109, 102388. [Google Scholar] [CrossRef]
- Arntz, P. Threat Spotlight: CrySIS, aka Dharma Ransomware, Causing a Crisis for Businesses | Malwarebytes Labs. 2019. Available online: https://www.malwarebytes.com/blog/news/2019/05/threat-spotlight-crysis-aka-dharma-ransomware-causing-a-crisis-for-businesses (accessed on 19 October 2022).
- Hanel, A. What Is Ryuk Ransomware? The Complete Breakdown. 2019. Available online: https://www.crowdstrike.com/blog/big-game-hunting-with-ryuk-another-lucrative-targeted-ransomware/ (accessed on 19 October 2022).
- Ploszek, R.; Švec, P.; Debnár, P. Analysis of encryption schemes in modern ransomware. Rad Hrvat. Akad. Znan. Umjet. Mat. Znan. 2021, 25, 1–13. [Google Scholar] [CrossRef]
- Walter, J. HelloKitty Ransomware Lacks Stealth, However, Still Strikes Home-SentinelLabs. 2021. Available online: https://www.sentinelone.com/labs/hellokitty-ransomware-lacks-stealth-but-still-strikes-home/ (accessed on 19 October 2022).
- Walter, J. NetWalker Ransomware: No Respite, No English Required-SentinelLabs. 2020. Available online: https://www.sentinelone.com/labs/netwalker-ransomware-no-respite-no-english-required/ (accessed on 19 October 2022).
- Stood, K.; Hurley, S. NotPetya Ransomware Attack [Technical Analysis]. 2017. Available online: https://www.crowdstrike.com/blog/petrwrap-ransomware-technical-analysis-triple-threat-file-encryption-mft-encryption-credential-theft (accessed on 19 October 2022).
- Mundo, A. GandCrab Ransomware Puts the Pinch on Victims | McAfee Blog. Available online: https://www.hstoday.us/subject-matter-areas/cybersecurity/gandcrab-ransomware-puts-the-pinch-on-victims/ (accessed on 19 October 2022).
- Threat Actor Profile–“BlackMatter” Ransomware. 2021. Available online: https://www.avertium.com/blog/blackmatter-threat-actor-profile (accessed on 19 October 2022).
- Mundo, A. Ransomware Maze | McAfee Blog. 2020. Available online: https://www.mcafee.com/blogs/other-blogs/mcafee-labs/ransomware-maze/ (accessed on 19 October 2022).
- Weizman, I.; Pirozzi, A. Conti Unpacked | Understanding Ransomware Development As a Response to Detection-SentinelLabs. 2021. Available online: https://assets.sentinelone.com/sentinellabs/conti-ransomware-unpacked (accessed on 19 October 2022).
- Lee, J.; Lee, K. A Method for Neutralizing Entropy Measurement-Based Ransomware Detection Technologies Using Encoding Algorithms. Entropy 2022, 24, 239. [Google Scholar] [CrossRef]
- De Gaspari, F.; Hitaj, D.; Pagnotta, G.; De Carli, L.; Mancini, L.V. Evading behavioral classifiers: A comprehensive analysis on evading ransomware detection techniques. Neural Comput. Appl. 2022, 34, 12077–12096. [Google Scholar] [CrossRef]
- Joshi, Y.S.; Mahajan, H.; Joshi, S.N.; Gupta, K.P.; Agarkar, A.A. Signature-less ransomware detection and mitigation. J. Comput. Virol. Hacking Tech. 2021, 17, 299–306. [Google Scholar] [CrossRef]
- Kim, G.Y.; Paik, J.Y.; Kim, Y.; Cho, E.S. Byte Frequency Based Indicators for Crypto-Ransomware Detection from Empirical Analysis. J. Comput. Sci. Technol. 2022, 37, 423–442. [Google Scholar] [CrossRef]
- Jiao, J.; Zhao, H.; Liu, Y. Analysis and Detection of Android Ransomware for Custom Encryption. In Proceedings of the 2021 IEEE 4th International Conference on Computer and Communication Engineering Technology, CCET 2021, Beijing, China, 13–15 August 2021; pp. 220–225. [Google Scholar] [CrossRef]
- AyBeeEll. Birthday Problem-Wikipedia. Available online: https://en.wikipedia.org/wiki/Birthday_problem (accessed on 19 October 2022).
- Naylor, G.C. The Birthday Problem. Teach. Stat. 1981, 3, 30. [Google Scholar] [CrossRef]


| Classification | Description |
|---|---|
| True Positive (TP) | Correctly classified encrypted file |
| True Negative (TN) | Correctly classified non-encrypted file |
| False Positive (FP) | Classified normal file as an encrypted file |
| False Negative (FN) | Failed to classified encrypted file |
Type | Dataset Size (MB) | Description |
|---|---|---|
| DOCX | 3.9 | Document files |
| PPTX | 73.4 | Document files |
| XLSX | 16.6 | Document files |
| 24.3 | Document files | |
| JPG | 1085.0 | Images files |
| PNG | 2.0 | Images files |
| WEBP | 2.4 | Images files |
| MP4 | 30.6 | Media files |
| 7ZIP | 131.6 | 7zip compressed files |
| ZIP | 131.4 | WinZip compressed files |
| GZ | 131.6 | gzip compressed files |
| Dharma | 28.1 | Ransomware encrypted files |
| NotPetya | 26.9 | Ransomware encrypted files |
| Phobos | 28.1 | Ransomware encrypted files |
| Sodinokibi | 25.9 | Ransomware encrypted files |
| Test | Threshold | Description |
|---|---|---|
| SP-800 22 | 0.01 | Probability greater than [45] |
| Dieharder2 | 0.5 | Probability greater than [41] |
| Shannon Entropy | 7.95 | Bit value greater than [30] |
| Chi-Square | 0.01 | Probability greater than [57] |
| Monte Carlo | 0.015 | Within range +/− [57] |
| Mean | 0.85 | +/− 127.5 [57] |
| Serial Correlation | 0.0011 | Correlation less than [57] |
| Kullback-Liebler | 0.01 | Greater than [30] |
| PractRand | 0.01 | Greater than [50] |
| Test | Qualified | Comments |
|---|---|---|
| Frequency | Yes | |
| BlockFrequency | Yes | Tests qualified due to their & performance and accuracy. |
| Runs | Yes | |
| LongestRuns | Yes | |
| SP-800 Serial | Yes | |
| CumulativeSums | Yes | |
| Chi-square | Yes | |
| Serial ByteCorrelation | Yes | |
| Shannon Entropy | Yes | Accepted due to their overall use |
| Mean | Yes | |
| Monte Carlo-Pi | Yes | |
| ApproximateEntropy | No | |
| MatrixRank | No | |
| DiscreteFourierTransform | No | |
| NonOverlappingTemplate | No | |
| OverlappingTemplate | No | |
| Universal | No | |
| LinearComplexity | No | |
| RandomExcursions | No | |
| RandomExcursionsVariant | No | |
| Kullback-Liebler | No | |
| Birthday | No | Rejected due to low performance and/or lack of accuracy |
| Overlapping 5 permutations | No | |
| 32 × 32 Binary Rank Test | No | |
| 6 × 8 Binary Rank Test | No | |
| Bistream | No | |
| OPSO | No | |
| OQSO | No | |
| DNA | No | |
| Count 1 Stream | No | |
| Count 1 byte | No | |
| Parking Lot | No | |
| 2D Sphere | No | |
| 3D Sphere | No | |
| Squeeze | No | |
| Sums | No | |
| Runs | No | |
| Craps | No | |
| Marsaglia and Tsang GCD | No | |
| STS Monobit | No | |
| STS Runs | No | |
| STS Serial | No | |
| RGB Bit Distribution | No | |
| Genralised Minimum Distance | No | |
| RGB Permutations | No | |
| RGB Lagged Sum | No | |
| The Kolmogorov–Smirnov | No | |
| DAB byte Distribution | No | |
| DCT | No | |
| DAB Fill Tree | No | |
| DAB Fill Tree 2 | No | |
| DAB Monobit 2 | No | |
| PractRand | No |
| Type | Type | Type | Type |
|---|---|---|---|
| 7ZIP | EPUB | MP3 | SVG |
| APK | EXE | MP4 | TIF |
| BIN | GIF | ODS | TXT |
| BMP | GIF | OXPS | WEBP |
| CSS | GZIP | XLS | |
| CSV | HTML | PNG | XLSX |
| DOC | ICS | PS | XML |
| DOCX | JS | PPT | ZIP |
| DWG | JPG | PPTX | ZLIB |
| ELF | JSON | RAND | |
| EPS | MKV | RAR |
| Accuracy | Recall | Precision | F1 | |
|---|---|---|---|---|
| BlockFrequency | 0.90 | 0.71 | 0.86 | 0.78 |
| Frequency | 0.89 | 0.77 | 0.78 | 0.77 |
| Sums | 0.92 | 0.75 | 0.91 | 0.82 |
| Longest Runs | 0.89 | 0.78 | 0.77 | 0.78 |
| Runs | 0.92 | 0.76 | 0.89 | 0.82 |
| Sp-800 Serial | 0.93 | 0.73 | 0.97 | 0.83 |
| Shannon | 0.75 | 0.86 | 0.50 | 0.63 |
| Chi-Square | 0.90 | 0.74 | 0.86 | 0.79 |
| Mean | 0.86 | 0.77 | 0.70 | 0.73 |
| Monte Carlo | 0.82 | 0.58 | 0.64 | 0.61 |
| Serial Byte | 0.81 | 0.23 | 0.91 | 0.37 |
| Block Frequency | Frequency | Sums | Longest | Runs | SP-800 Serial | Shannon | chi | Mean | Monte Carlo | Serial Byte | |
|---|---|---|---|---|---|---|---|---|---|---|---|
| bin | 1.00 | 1.00 | 1.00 | 1.00 | 1.00 | 1.00 | 1.00 | 1.00 | 1.00 | 1.00 | 1.00 |
| css | 0.64 | 0.85 | 0.90 | 0.88 | 0.92 | 0.99 | 1.00 | 0.98 | 1.00 | 1.00 | 1.00 |
| csv | 0.93 | 0.98 | 0.99 | 0.99 | 0.99 | 1.00 | 1.00 | 1.00 | 1.00 | 1.00 | 1.00 |
| dll | 1.00 | 0.98 | 1.00 | 0.94 | 0.98 | 1.00 | 0.85 | 0.99 | 0.99 | 0.96 | 0.99 |
| doc | 1.00 | 1.00 | 1.00 | 1.00 | 1.00 | 1.00 | 1.00 | 1.00 | 1.00 | 0.99 | 1.00 |
| elf | 1.00 | 1.00 | 1.00 | 1.00 | 1.00 | 1.00 | 1.00 | 1.00 | 1.00 | 1.00 | 1.00 |
| eps | 1.00 | 1.00 | 1.00 | 1.00 | 1.00 | 1.00 | 1.00 | 1.00 | 1.00 | 1.00 | 1.00 |
| exe | 1.00 | 0.98 | 1.00 | 0.99 | 1.00 | 1.00 | 0.95 | 1.00 | 0.97 | 0.97 | 1.00 |
| html | 1.00 | 1.00 | 1.00 | 1.00 | 1.00 | 1.00 | 1.00 | 1.00 | 1.00 | 1.00 | 1.00 |
| ics | 1.00 | 1.00 | 1.00 | 1.00 | 1.00 | 1.00 | 1.00 | 1.00 | 1.00 | 1.00 | 1.00 |
| JAVASCRIPT | 0.68 | 0.80 | 0.82 | 0.95 | 0.84 | 0.99 | 1.00 | 1.00 | 1.00 | 1.00 | 1.00 |
| json | 0.72 | 0.71 | 0.90 | 0.95 | 0.94 | 0.99 | 1.00 | 1.00 | 1.00 | 1.00 | 1.00 |
| powershell | 0.93 | 0.97 | 0.98 | 0.99 | 0.98 | 1.00 | 1.00 | 1.00 | 1.00 | 1.00 | 1.00 |
| svg | 0.99 | 1.00 | 1.00 | 0.99 | 1.00 | 1.00 | 1.00 | 1.00 | 1.00 | 1.00 | 1.00 |
| txt | 0.88 | 0.94 | 0.96 | 0.95 | 0.94 | 0.98 | 1.00 | 1.00 | 1.00 | 1.00 | 1.00 |
| xls | 1.00 | 1.00 | 1.00 | 1.00 | 1.00 | 1.00 | 1.00 | 1.00 | 1.00 | 1.00 | 1.00 |
| xml | 0.31 | 0.44 | 0.65 | 0.98 | 0.48 | 1.00 | 1.00 | 1.00 | 1.00 | 1.00 | 1.00 |
| Block Frequency | Frequency | Sums | Longest | Runs | SP-800 Serial | Shannon | chi | Mean | Monte Carlo | Serial Byte | |
|---|---|---|---|---|---|---|---|---|---|---|---|
| 7zip | 1.00 | 0.77 | 0.99 | 0.93 | 0.95 | 1.00 | 0.00 | 0.99 | 0.05 | 0.14 | 1.00 |
| APK | 1.00 | 0.98 | 1.00 | 0.98 | 1.00 | 1.00 | 0.77 | 1.00 | 0.87 | 0.82 | 1.00 |
| bmp | 1.00 | 0.99 | 1.00 | 1.00 | 1.00 | 1.00 | 1.00 | 1.00 | 0.99 | 0.99 | 1.00 |
| docx | 1.00 | 0.98 | 1.00 | 0.99 | 1.00 | 1.00 | 0.87 | 1.00 | 0.95 | 0.91 | 1.00 |
| dwg | 1.00 | 1.00 | 1.00 | 1.00 | 1.00 | 1.00 | 1.00 | 1.00 | 0.99 | 0.99 | 1.00 |
| epub | 1.00 | 0.88 | 1.00 | 0.94 | 0.96 | 1.00 | 0.29 | 1.00 | 0.73 | 0.53 | 1.00 |
| gif | 1.00 | 0.95 | 0.99 | 0.79 | 0.98 | 1.00 | 0.77 | 1.00 | 0.98 | 0.98 | 0.98 |
| gz | 1.00 | 0.98 | 1.00 | 0.75 | 0.99 | 1.00 | 0.00 | 0.98 | 0.83 | 0.92 | 0.95 |
| jpg | 1.00 | 0.85 | 1.00 | 0.92 | 0.94 | 1.00 | 0.52 | 1.00 | 0.89 | 0.88 | 0.99 |
| mkv | 1.00 | 1.00 | 1.00 | 0.99 | 1.00 | 1.00 | 0.27 | 1.00 | 0.96 | 0.90 | 1.00 |
| mp3 | 1.00 | 0.99 | 1.00 | 1.00 | 1.00 | 1.00 | 0.50 | 1.00 | 0.97 | 0.96 | 1.00 |
| mp4 | 1.00 | 0.97 | 1.00 | 0.93 | 1.00 | 1.00 | 0.59 | 1.00 | 0.90 | 0.86 | 1.00 |
| ods | 1.00 | 0.91 | 1.00 | 0.99 | 0.98 | 1.00 | 0.47 | 1.00 | 0.84 | 0.74 | 1.00 |
| oxps | 1.00 | 0.95 | 1.00 | 0.79 | 1.00 | 1.00 | 0.24 | 1.00 | 0.77 | 0.85 | 0.97 |
| 1.00 | 0.95 | 1.00 | 0.87 | 1.00 | 1.00 | 0.67 | 1.00 | 0.92 | 0.89 | 0.99 | |
| png | 1.00 | 0.80 | 0.97 | 0.85 | 0.92 | 0.99 | 0.35 | 1.00 | 0.69 | 0.79 | 0.99 |
| ppt | 1.00 | 0.99 | 1.00 | 1.00 | 1.00 | 1.00 | 0.92 | 1.00 | 0.93 | 0.89 | 1.00 |
| pptx | 1.00 | 0.97 | 1.00 | 1.00 | 1.00 | 1.00 | 0.54 | 1.00 | 0.83 | 0.81 | 1.00 |
| RANSOMWARE-BLACKMATTER | 0.74 | 0.75 | 0.73 | 0.78 | 0.75 | 0.71 | 0.91 | 0.62 | 0.77 | 0.54 | 0.15 |
| RANSOMWARE-CONTI | 0.81 | 0.84 | 0.82 | 0.86 | 0.84 | 0.82 | 0.96 | 0.83 | 0.86 | 0.63 | 0.22 |
| RANSOMWARE-DARKSIDE | 0.95 | 0.95 | 0.93 | 0.94 | 0.94 | 0.93 | 0.98 | 0.93 | 0.93 | 0.70 | 0.31 |
| RANSOMWARE-DHARMA | 0.50 | 0.86 | 0.82 | 0.87 | 0.86 | 0.77 | 0.87 | 0.82 | 0.81 | 0.62 | 0.23 |
| RANSOMWARE-GANDCRAB | 0.92 | 0.97 | 0.95 | 0.97 | 0.97 | 0.94 | 0.99 | 0.96 | 0.94 | 0.72 | 0.33 |
| RANSOMWARE-HELLOKITTY | 0.04 | 0.09 | 0.04 | 0.13 | 0.04 | 0.01 | 0.45 | 0.01 | 0.15 | 0.15 | 0.01 |
| RANSOMWARE-MAZE | 1.00 | 1.00 | 0.99 | 1.00 | 1.00 | 0.99 | 1.00 | 0.99 | 0.97 | 0.73 | 0.37 |
| RANSOMWARE-NETWALKER | 0.09 | 0.14 | 0.09 | 0.18 | 0.10 | 0.07 | 0.45 | 0.08 | 0.18 | 0.15 | 0.02 |
| RANSOMWARE-NOTPETYA | 0.76 | 0.77 | 0.75 | 0.79 | 0.77 | 0.75 | 0.84 | 0.76 | 0.78 | 0.59 | 0.22 |
| RANSOMWARE-PHOBOS | 0.73 | 0.87 | 0.85 | 0.87 | 0.87 | 0.85 | 0.87 | 0.86 | 0.84 | 0.62 | 0.24 |
| RANSOMWARE-RYUK | 0.99 | 1.00 | 0.98 | 1.00 | 1.00 | 0.98 | 1.00 | 0.99 | 0.97 | 0.74 | 0.36 |
| RANSOMWARE-SODINOKIBI | 1.00 | 1.00 | 0.99 | 1.00 | 1.00 | 0.99 | 1.00 | 0.99 | 0.97 | 0.74 | 0.36 |
| rar | 1.00 | 0.98 | 1.00 | 0.61 | 0.98 | 0.99 | 0.00 | 0.97 | 0.89 | 0.96 | 0.96 |
| tar | 1.00 | 1.00 | 1.00 | 1.00 | 1.00 | 1.00 | 0.83 | 1.00 | 0.96 | 0.89 | 1.00 |
| tif | 1.00 | 1.00 | 1.00 | 1.00 | 1.00 | 1.00 | 0.90 | 1.00 | 1.00 | 1.00 | 1.00 |
| webp | 0.88 | 0.28 | 0.67 | 0.21 | 0.56 | 0.78 | 0.15 | 0.63 | 0.40 | 0.55 | 0.93 |
| xlsx | 1.00 | 0.98 | 1.00 | 0.99 | 1.00 | 1.00 | 0.77 | 1.00 | 0.95 | 0.93 | 1.00 |
| zip | 1.00 | 0.75 | 0.99 | 0.95 | 0.97 | 1.00 | 0.00 | 1.00 | 0.08 | 0.20 | 1.00 |
| zlib | 1.00 | 0.98 | 1.00 | 0.75 | 0.99 | 0.99 | 0.00 | 0.98 | 0.82 | 0.92 | 0.95 |
| Accuracy | Recall | Precision | F1 | |
|---|---|---|---|---|
| Shannon | 0.79 | 0.86 | 0.55 | 0.67 |
| Chi-Square | 0.91 | 0.74 | 0.86 | 0.79 |
| Mean | 0.89 | 0.77 | 0.76 | 0.76 |
| Monte Carlo | 0.84 | 0.58 | 0.71 | 0.64 |
Publisher’s Note: MDPI stays neutral with regard to jurisdictional claims in published maps and institutional affiliations. |
© 2022 by the authors. Licensee MDPI, Basel, Switzerland. This article is an open access article distributed under the terms and conditions of the Creative Commons Attribution (CC BY) license (https://creativecommons.org/licenses/by/4.0/).
Share and Cite
Davies, S.R.; Macfarlane, R.; Buchanan, W.J. Comparison of Entropy Calculation Methods for Ransomware Encrypted File Identification. Entropy 2022, 24, 1503. https://doi.org/10.3390/e24101503
Davies SR, Macfarlane R, Buchanan WJ. Comparison of Entropy Calculation Methods for Ransomware Encrypted File Identification. Entropy. 2022; 24(10):1503. https://doi.org/10.3390/e24101503
Chicago/Turabian StyleDavies, Simon R., Richard Macfarlane, and William J. Buchanan. 2022. "Comparison of Entropy Calculation Methods for Ransomware Encrypted File Identification" Entropy 24, no. 10: 1503. https://doi.org/10.3390/e24101503