Figure 1.
Proposed image encryption algorithm’s flowchart.
Figure 1.
Proposed image encryption algorithm’s flowchart.
Figure 2.
Logistic map bifurcation diagram.
Figure 2.
Logistic map bifurcation diagram.
Figure 3.
The proposed algorithm applied to a sample.
Figure 3.
The proposed algorithm applied to a sample.
Figure 4.
Images used to test the proposed algorithm: (a) Baboon, (b) Peppers, (c) Male, (d) Sailboat, and (e) Cameraman.
Figure 4.
Images used to test the proposed algorithm: (a) Baboon, (b) Peppers, (c) Male, (d) Sailboat, and (e) Cameraman.
Figure 5.
Sample images and their respective encrypted ciphers: (a) Baboon, (b) Male, (c) Sailboat, (d) Baboon cipher, (e) Male cipher, (f) Sailboat cipher.
Figure 5.
Sample images and their respective encrypted ciphers: (a) Baboon, (b) Male, (c) Sailboat, (d) Baboon cipher, (e) Male cipher, (f) Sailboat cipher.
Figure 6.
Histograms of images and their respective ciphers: (a) Baboon histogram, (b) Sailboat histogram, (c) Peppers histogram, (d) Baboon cipher histogram, (e) Sailboat cipher histogram, (f) Peppers cipher histogram.
Figure 6.
Histograms of images and their respective ciphers: (a) Baboon histogram, (b) Sailboat histogram, (c) Peppers histogram, (d) Baboon cipher histogram, (e) Sailboat cipher histogram, (f) Peppers cipher histogram.
Figure 7.
Avalanche effect illustrated in two images encrypted from the same plaintext image with a change of 1 bit: (a) Peppers, (b) Peppers cipher, (c) Peppers cipher where plaintext peppers have 1-bit change.
Figure 7.
Avalanche effect illustrated in two images encrypted from the same plaintext image with a change of 1 bit: (a) Peppers, (b) Peppers cipher, (c) Peppers cipher where plaintext peppers have 1-bit change.
Figure 8.
Results of data loss (occlusion) attacks on the color image Baboon (): (a–c) different severities of occlusion attacks, (d–f) corresponding decrypted images.
Figure 8.
Results of data loss (occlusion) attacks on the color image Baboon (): (a–c) different severities of occlusion attacks, (d–f) corresponding decrypted images.
Figure 9.
Results of salt and pepper noise attack on the color image Baboon (): (a–c) different noise densities introduced, (d–f) corresponding decrypted images.
Figure 9.
Results of salt and pepper noise attack on the color image Baboon (): (a–c) different noise densities introduced, (d–f) corresponding decrypted images.
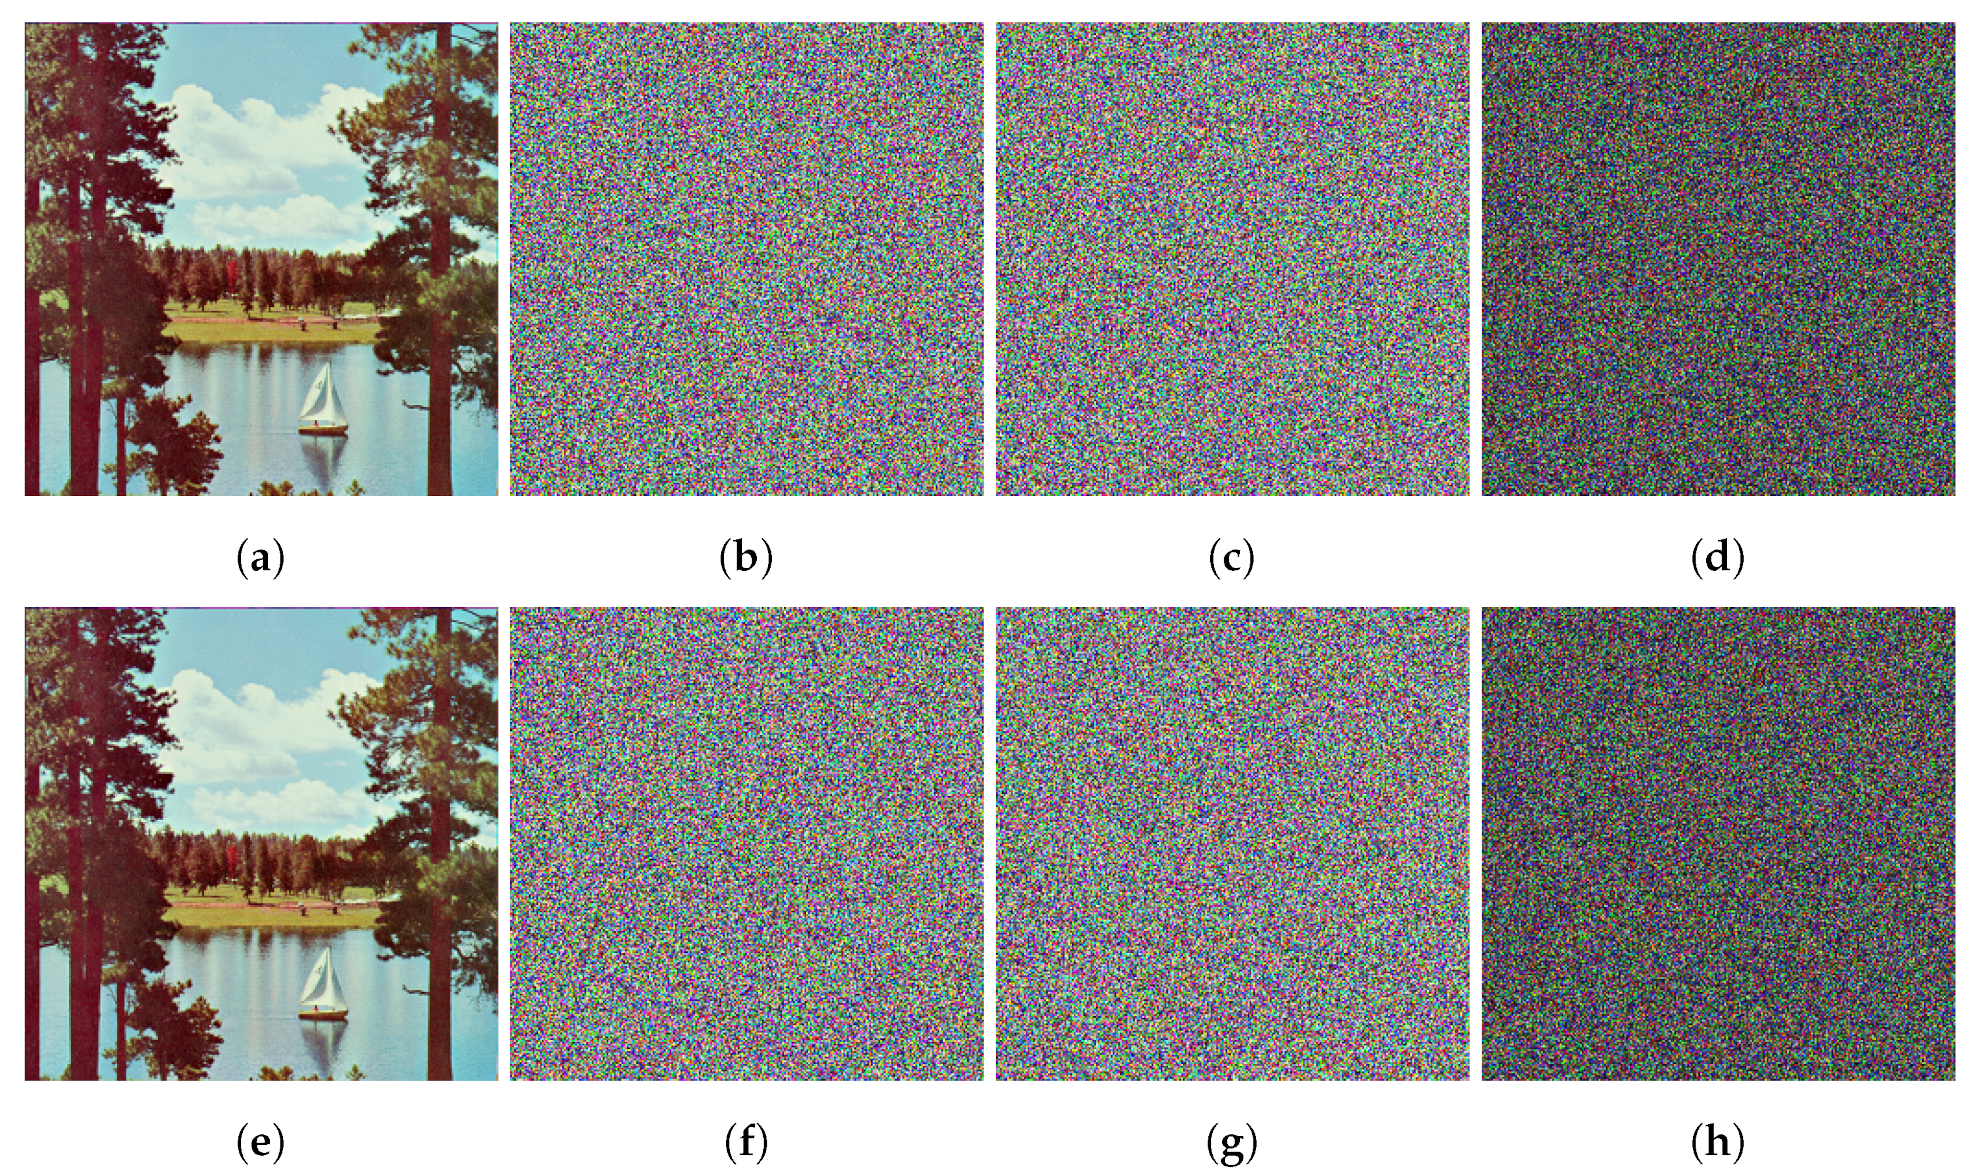
Figure 10.
Results of key sensitivity tests on the color image Sailboat (): (a) plaintext image, (b) encrypted using key , (c) encrypted using key , (d) difference of images: |(b) − (c)|, (e) decrypted using key , (f) decrypted using key , (g) decrypted using key , (h) difference of images: |(f) − (g)|.
Table 1.
An example of the generation of Matrix 1 () from the logistic map.
Table 1.
An example of the generation of Matrix 1 () from the logistic map.
|
22 | 140 | 246 | 206 | 238 |
| 76 | 186 | 252 | 20 | 134 |
| 78 | 251 | 21 | 164 | 214 |
| 82 | 68 | 86 | 180 | 12 |
| 166 | 226 | 136 | 215 | 144 |
Table 2.
Average encryption time (in seconds) of the proposed algorithm for different image dimensions.
Table 2.
Average encryption time (in seconds) of the proposed algorithm for different image dimensions.
| Image Size | Color | Time (s) |
|---|
| Gray | 0.0235 |
| Color | 0.0287 |
| Gray | 0.0915 |
| Color | 0.1056 |
| Gray | 0.4124 |
| Color | 0.4386 |
Table 3.
Average encryption time (in seconds) of several color and gray scale images for the proposed algorithm compared to different related methods.
Table 3.
Average encryption time (in seconds) of several color and gray scale images for the proposed algorithm compared to different related methods.
| | Proposed | [5] | [6] | [7] | [9] |
|---|
| Time (s) | 0.09155 | 0.2338 | 0.3033 | 1.28 | 1.489 |
Table 4.
Encryption time (in seconds) for the proposed algorithm compared to different related methods scaled to 3.5 GHz CPU.
Table 4.
Encryption time (in seconds) for the proposed algorithm compared to different related methods scaled to 3.5 GHz CPU.
| | Proposed | [6] | [9] | [17] |
|---|
| Time (s) | 0.09155 | 0.2166 | 1.4039 | 0.2102 |
| Speed up | - | 2.36 | 15.33 | 2.30 |
Table 5.
Vertical, horizontal, and diagonal correlation coefficients of adjacent pixels of encrypted images.
Table 5.
Vertical, horizontal, and diagonal correlation coefficients of adjacent pixels of encrypted images.
| | | Correlation Coefficient |
|---|
| Image | Color and Size | Vertical | Horizontal | Diagonal |
|---|
| Baboon | Color | −0.0001 | 0.0006 | −0.0021 |
| Cameraman | Gray | −0.0039 | −0.0003 | 0.0037 |
| Male | Gray | 0.0004 | 0.0017 | −0.0009 |
| Peppers | Color | −0.0003 | 0.0009 | −0.0006 |
| Sailboat | Color | −0.0012 | 0.0016 | 0.0001 |
| Average | | 0.0005 | 0.0004 | −0.0004 |
Table 6.
Vertical, horizontal, and diagonal correlation coefficients of encrypted Baboon image of the proposed algorithm compared to different encryption methods.
Table 6.
Vertical, horizontal, and diagonal correlation coefficients of encrypted Baboon image of the proposed algorithm compared to different encryption methods.
| | Correlation Coefficient |
|---|
| | Vertical | Horizontal | Diagonal |
|---|
| Proposed | −0.0001 | 0.0006 | −0.0021 |
| [5] | −0.0086 | 0.0023 | 0.0402 |
| [6] | −0.0001 | −0.0002 | 0.0011 |
| [7] | −0.0036 | −0.0019 | −0.0033 |
| [9] | −0.0004 | 0.0007 | 0.0029 |
Table 7.
Vertical, horizontal, and diagonal correlation coefficients of plaintext and cipher images.
Table 7.
Vertical, horizontal, and diagonal correlation coefficients of plaintext and cipher images.
| | | Correlation Coefficient |
|---|
| Image | Color and Size | Vertical | Horizontal | Diagonal |
|---|
| Baboon | Color | −0.0029 | −0.0550 | −0.0005 |
| Cameraman | Gray | −0.0912 | −0.0353 | 0.0035 |
| Male | Gray | 0.0164 | −0.0226 | −0.0007 |
| Peppers | Color | −0.0025 | 0.0023 | 0.0002 |
| Sailboat | Color | −0.1277 | 0.0265 | 0.0012 |
| Average | | −0.0372 | −0.0061 | 0.0003 |
Table 8.
Chi-square test values for plaintext images and cipher images encrypted by our proposed algorithm.
Table 8.
Chi-square test values for plaintext images and cipher images encrypted by our proposed algorithm.
| | | Chi-Square |
|---|
| Image | Size and Color | Plaintext Image | Cipher Image |
|---|
| Baboon | color | 10,429,131.335 | 258.671 |
| Cameraman | gray | 2,193,251.085 | 247.173 |
| Male | gray | 26,095,050.882 | 299.851 |
| Peppers | color | 557,983.062 | 286.742 |
| Sailboat | color | 424,683.429 | 273.918 |
| Average | | | 273.271 |
Table 9.
Global and local Shannon entropy values of images encrypted by our proposed algorithm.
Table 9.
Global and local Shannon entropy values of images encrypted by our proposed algorithm.
| | | Entropy |
|---|
| Image | Size and Color | Global | Local |
|---|
| Baboon | Color | 7.9997 | 7.8979 |
| Cameraman | Gray | 7.9991 | 7.8978 |
| Male | Gray | 7.9996 | 7.9026 |
| Peppers | Color | 7.9990 | 7.8883 |
| Sailboat | Color | 7.9988 | 7.8880 |
| Average | | 7.9992 | 7.8949 |
Table 10.
Global entropy of cipher image Baboon of the proposed algorithm compared with different encryption algorithms.
Table 10.
Global entropy of cipher image Baboon of the proposed algorithm compared with different encryption algorithms.
| | Proposed | [5] | [6] | [7] | [9] |
|---|
| Entropy | 7.9997 | 7.9024 | 7.9991 | 7.9992 | 7.9971 |
Table 11.
MSE values of images encrypted by the proposed algorithm.
Table 11.
MSE values of images encrypted by the proposed algorithm.
| Image | Size and Color | MSE |
|---|
| Baboon | color | 46.0304 |
| Cameraman | gray | 49.8847 |
| Male | gray | 53.8392 |
| Peppers | color | 23.5767 |
| Sailboat | color | 53.6684 |
| Average | | 42.3794 |
Table 12.
Mean square error (MSE) for images encrypted by the proposed algorithm compared to related methods.
Table 12.
Mean square error (MSE) for images encrypted by the proposed algorithm compared to related methods.
| | Proposed | [7] | [22] | [23] |
|---|
| MSE | 42.3794 | 39.6794 | 33.4275 | 40.3295 |
Table 13.
MAE values of images encrypted by the proposed algorithm.
Table 13.
MAE values of images encrypted by the proposed algorithm.
| Image | Size and Color | MAE |
|---|
| Baboon | color | 89.69 |
| Cameraman | gray | 96.56 |
| Male | gray | 97.55 |
| Peppers | color | 86.47 |
| Sailboat | color | 87.64 |
| Average | | 91.58 |
Table 14.
Average MAE values for images encrypted by the proposed algorithm compared to related methods.
Table 14.
Average MAE values for images encrypted by the proposed algorithm compared to related methods.
| | Proposed | [24] | [25] | [26] |
|---|
| MAE | 91.58 | 79.57 | 78.10 | 90 |
Table 15.
Peak signal-to-noise ratio (PSNR) of images encrypted by the proposed algorithm.
Table 15.
Peak signal-to-noise ratio (PSNR) of images encrypted by the proposed algorithm.
| Image | Size and Color | PSNR |
|---|
| Baboon | color | 8.7880 |
| Cameraman | gray | 8.4124 |
| Male | gray | 8.0008 |
| Peppers | color | 8.6210 |
| Sailboat | color | 8.7439 |
| Average | | 8.4458 |
Table 16.
Peak signal-to-noise ratio (PSNR) of the images encrypted by the proposed algorithm compared to other encryption methods.
Table 16.
Peak signal-to-noise ratio (PSNR) of the images encrypted by the proposed algorithm compared to other encryption methods.
| | Proposed | [6] | [7] | [24] | [17] |
|---|
| PSNR | 8.4458 | 8.6449 | 9.5424 | 9.0996 | 9.7936 |
Table 17.
Maximum deviation results for proposed algorithm compared to related methods.
Table 17.
Maximum deviation results for proposed algorithm compared to related methods.
| Image | Proposed | [7] | [28] |
|---|
| Baboon | 363,121 | 199,158 | - |
| Cameraman | 64,382 | 64,998 | 18,007 |
| Peppers | 209,618 | 146,408 | 22,935 |
| Average | 167,482 | 102,022 | 20,109 |
Table 18.
Irregular deviation results for the proposed algorithm compared to other encryption methods.
Table 18.
Irregular deviation results for the proposed algorithm compared to other encryption methods.
| Image | Proposed | [7] | [28] |
|---|
| Baboon | 59,921 | 80,203 | - |
| Cameraman | 32,165 | 32,706 | 39,244 |
| Peppers | 76,075 | 84,465 | 35,088 |
| Average | 91,460 | 129,253 | 40,739 |
Table 19.
Deviation from uniform histogram for the proposed algorithm compared with other encryption methods.
Table 19.
Deviation from uniform histogram for the proposed algorithm compared with other encryption methods.
| Image | Proposed | [28] | [29] |
|---|
| Baboon | 0.0256 | - | 0.0496 |
| Cameraman | 0.0305 | 0.0942 | 0.0502 |
| Peppers | 0.0315 | 0.0917 | - |
| Average | 0.0382 | 0.0534 | 0.04965 |
Table 20.
Avalanche effect , NPCR, and UACI values of images encrypted by the proposed algorithm.
Table 20.
Avalanche effect , NPCR, and UACI values of images encrypted by the proposed algorithm.
| Image | Size and Color | MSE | NPCR | UACI |
|---|
| Baboon | color | 57.3895 | 99.6125 | 33.5531 |
| Cameraman | gray | 57.3470 | 99.6368 | 33.3911 |
| Male | gray | 57.2375 | 99.6146 | 33.4947 |
| Peppers | color | 57.4122 | 99.6218 | 33.4862 |
| Sailboat | color | 57.4562 | 99.6176 | 33.4993 |
| Average | | 57.3533 | 99.6153 | 33.4718 |
Table 21.
NPCR and UACI of the proposed algorithm compared with other encryption methods.
Table 21.
NPCR and UACI of the proposed algorithm compared with other encryption methods.
| | NPCR | UACI |
|---|
| Proposed | 99.6153 | 33.4718 |
| [5] | 99.5893 | 33.3730 |
| [6] | 99.6239 | 33.5615 |
| [7] | 99.6059 | 33.4375 |
| [9] | 99.5743 | 33.3941 |
| [32] | 99.6146 | 33.4501 |
Table 22.
Vertical, horizontal, and diagonal correlation coefficient, PSNR, NPCR, UACI, and the encryption time of the proposed algorithm compared to other encryption methods.
Table 22.
Vertical, horizontal, and diagonal correlation coefficient, PSNR, NPCR, UACI, and the encryption time of the proposed algorithm compared to other encryption methods.
| Algorithm | | Proposed | [5] | [6] | [7] | [9] | [24] | [17] |
|---|
| Correlation coefficient | Vertical | 0.0005 | −0.0086 | −0.0001 | −0.0036 | −0.0004 | −0.0357 | - |
| | Horizontal | 0.0004 | 0.0023 | −0.0002 | −0.0019 | 0.0007 | −0.0357 | - |
| | Diagonal | −0.0004 | 0.04024 | 0.0011 | −0.0033 | 0.0029 | −0.0223 | - |
| Entropy | | 7.9997 | 7.9024 | 7.9991 | 7.9992 | 7.9971 | 7.9985 | 7.9969 |
| PSNR | | 8.4458 | - | 8.6449 | 9.5424 | - | 9.0996 | 9.7936 |
| NPCR | | 99.6153 | 99.5893 | 99.6239 | 99.6059 | 99.5743 | 99.6269 | 99.6100 |
| UACI | | 33.4718 | 33.3730 | 33.5615 | 33.4375 | 33.4561 | 33.3514 | 33.5200 |
| Encryption time | () | 0.09155 s | 0.2332 s | 0.3033 s | 1.28 s | 1.243 s | 22.43 s | 0.736 |
Table 23.
Homogeneity analysis for plaintext and cipher images.
Table 23.
Homogeneity analysis for plaintext and cipher images.
| Image | Size and Color | Plaintext Image | Cipher Image |
|---|
| Baboon | color | 0.7652 | 0.3893 |
| Cameraman | gray | 0.8979 | 0.3898 |
| Male | gray | 0.8475 | 0.3897 |
| Peppers | color | 0.9353 | 0.3896 |
| Sailboat | color | 0.8664 | 0.3897 |
| Average | | | 0.3897 |
Table 24.
Comparison of homogeneity, contrast, and energy analysis of cipher image of the proposed algorithm and related methods.
Table 24.
Comparison of homogeneity, contrast, and energy analysis of cipher image of the proposed algorithm and related methods.
| | Image Color | Homogeneity | Contrast | Energy |
|---|
| Proposed | Color | 0.3837 | 10.5081 | 0.01563 |
| [24] | Color | 0.3895 | 10.5079 | 0.01562 |
| [35] | Gray scale | 0.4208 | 8.3301 | 0.01760 |
| [36] | Color | 0.4110 | 8.6448 | 0.01561 |
| [37] | Gray scale | 0.3916 | 10.4252 | 0.01563 |
Table 25.
Contrast analysis for plaintext and cipher images.
Table 25.
Contrast analysis for plaintext and cipher images.
| Image | Size and Color | Plaintext Image | Cipher Image |
|---|
| Baboon | color | 0.7425 | 10.5152 |
| Cameraman | gray | 0.1978 | 10.4670 |
| Male | gray | 0.2527 | 10.4918 |
| Peppers | color | 0.2665 | 10.4893 |
| Sailboat | color | 0.4140 | 10.4868 |
| Average | | | 10.5081 |
Table 26.
Energy analysis for plaintext and cipher images.
Table 26.
Energy analysis for plaintext and cipher images.
| Image | Size and Color | Plaintext Image | Cipher Image |
|---|
| Baboon | color | 0.0639 | 0.01564 |
| Cameraman | gray | 0.1939 | 0.01565 |
| Male | gray | 0.1199 | 0.01563 |
| Peppers | color | 0.1437 | 0.01563 |
| Sailboat | color | 0.1155 | 0.01563 |
| Average | | | 0.01563 |
Table 27.
Results of NIST SP 800-22 tests for the encrypted Baboon image.
Table 27.
Results of NIST SP 800-22 tests for the encrypted Baboon image.
| Test | | p-Value | Passed |
|---|
| Frequency | | 0.213309 | ✓ |
| Block Frequency | | 0.350485 | ✓ |
| Cumulative Sums | Reverse | 0.350485 | ✓ |
| Cumulative Sums | Forward | 0.534146 | ✓ |
| Runs | | 0.066882 | ✓ |
| Longest Run of Ones | | 0.534146 | ✓ |
| Rank | | 0.534146 | ✓ |
| FFT | | 0.739918 | ✓ |
| Non-Overlapping Template | | 0.911413 | ✓ |
| Overlapping Template | | 0.911413 | ✓ |
| Universal | | 0.122325 | ✓ |
| Approximate Entropy | | 0.213309 | ✓ |
| Random Excursions | | 0.742591 | ✓ |
| Random Excursions Variant | | 0.728588 | ✓ |
| Serial | Test 1 | 0.739918 | ✓ |
| Serial | Test 2 | 0.213309 | ✓ |
| Linear Complexity | | 0.350485 | ✓ |


