
Boosting COVID-19 Image Classification Using MobileNetV3 and Aquila Optimizer Algorithm

 ,
,  ,
,  ,
,
Abstract
:1. Introduction
- Develop a COVID-19 cases detection framework by incorporating MobileNetV3 and Aquila Optimizer as feature extraction and selection algorithms, respectively.
- Propose a new feature selection using the binary version of Aquila Optimizer, in addition, using MobileNetV3 to learn and extract the image embedding from the COVID-19 images.
- Evaluate the performance of the developed method using two datasets with X-ray and CT images of COVID-19.
- Compare the efficiency of the developed approach with other methods.
2. Background
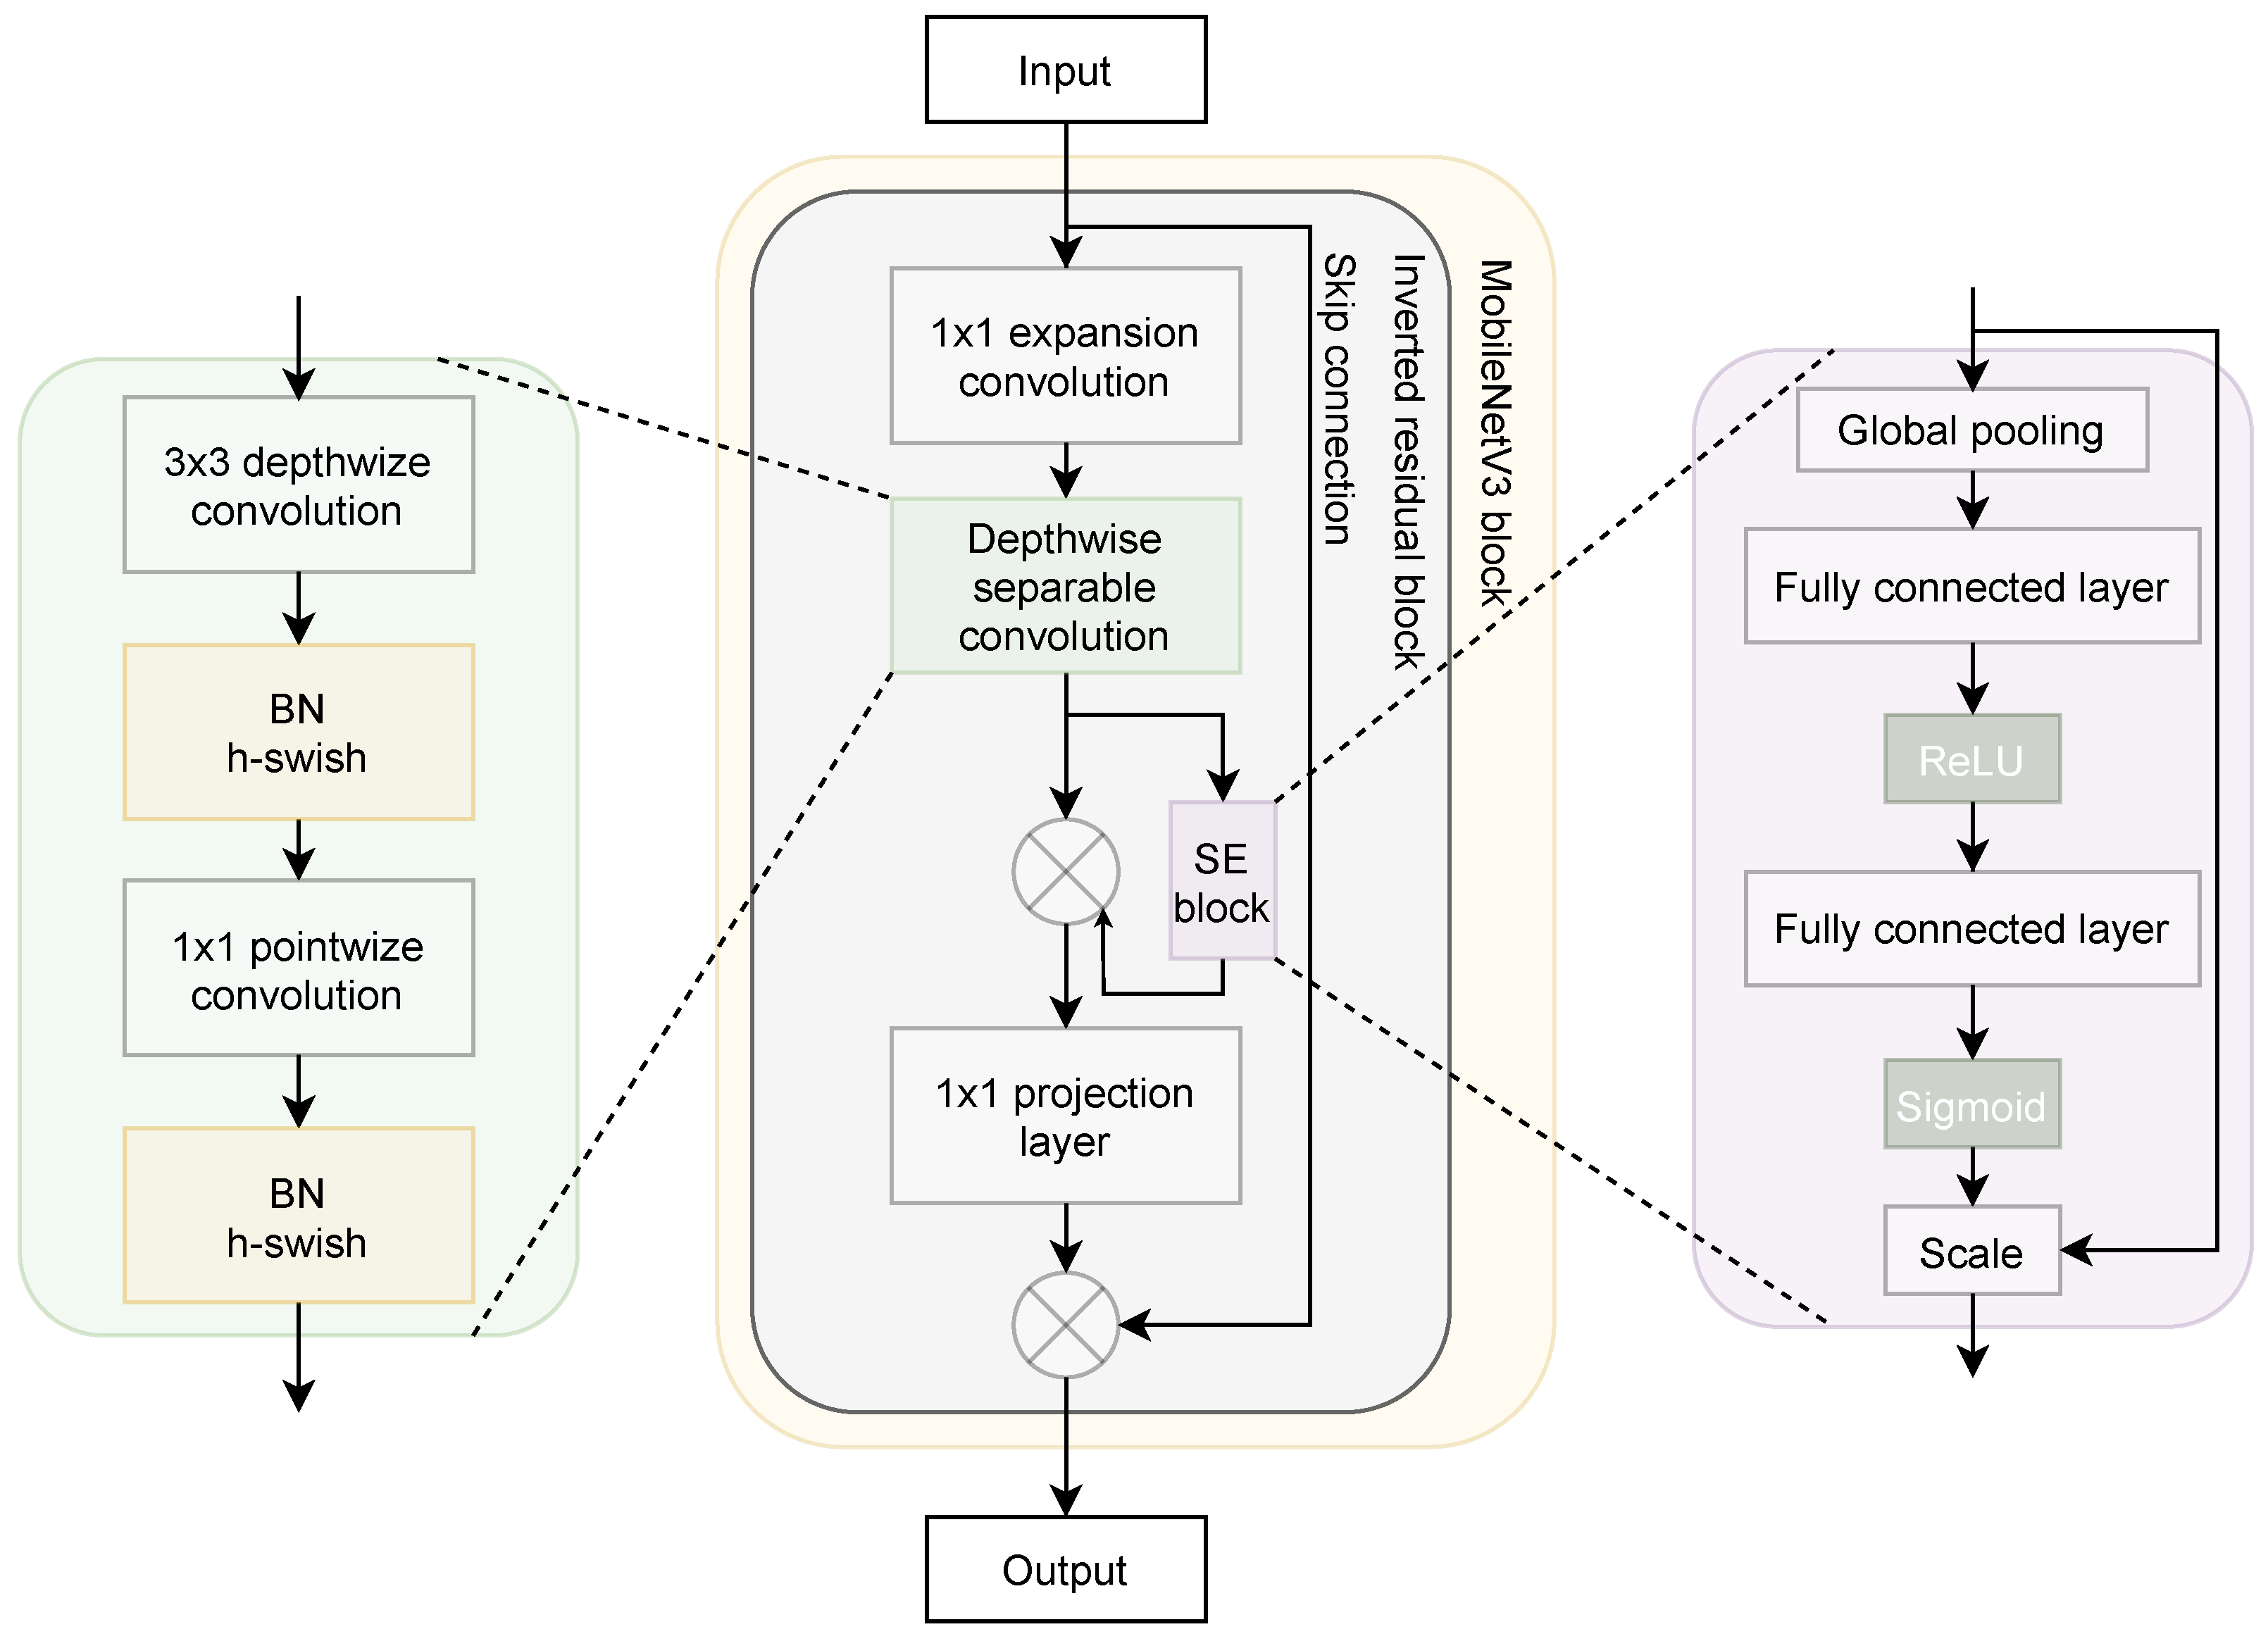
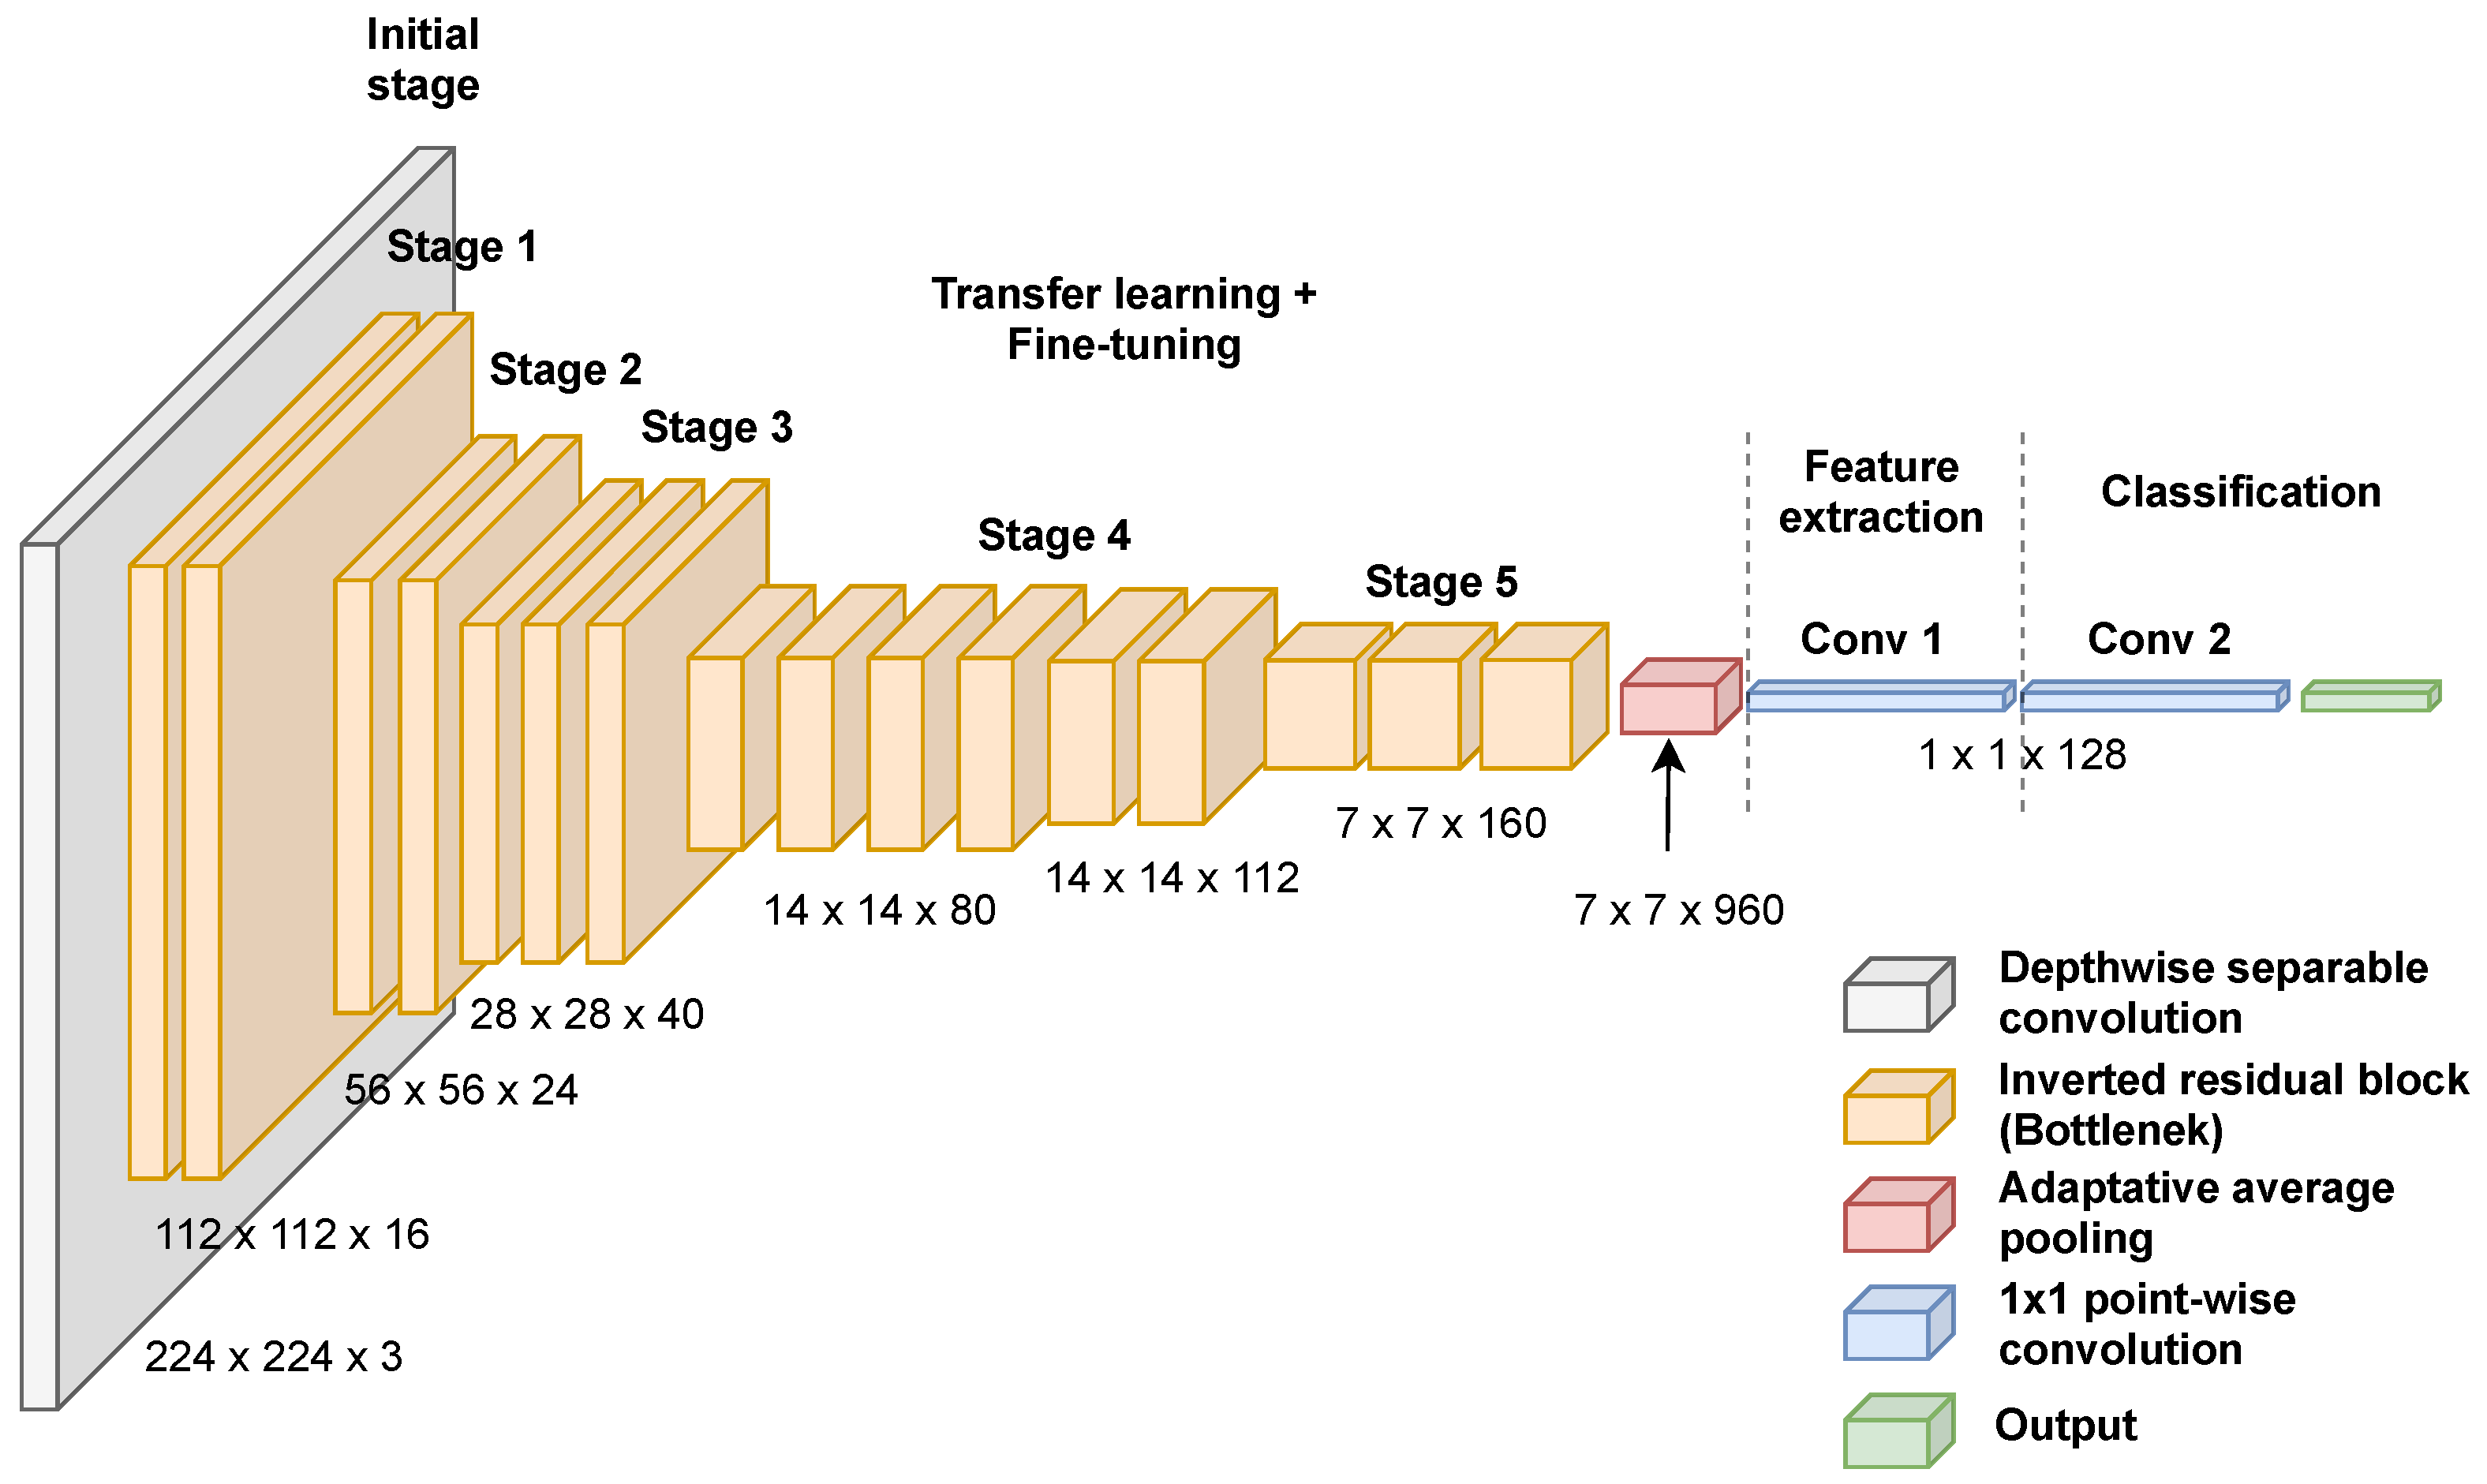
2.1. MobileNetV3
2.2. Aquila Optimizer (Aqu)
3. Proposed Framework
3.1. MobileNetV3 for Feature Extraction
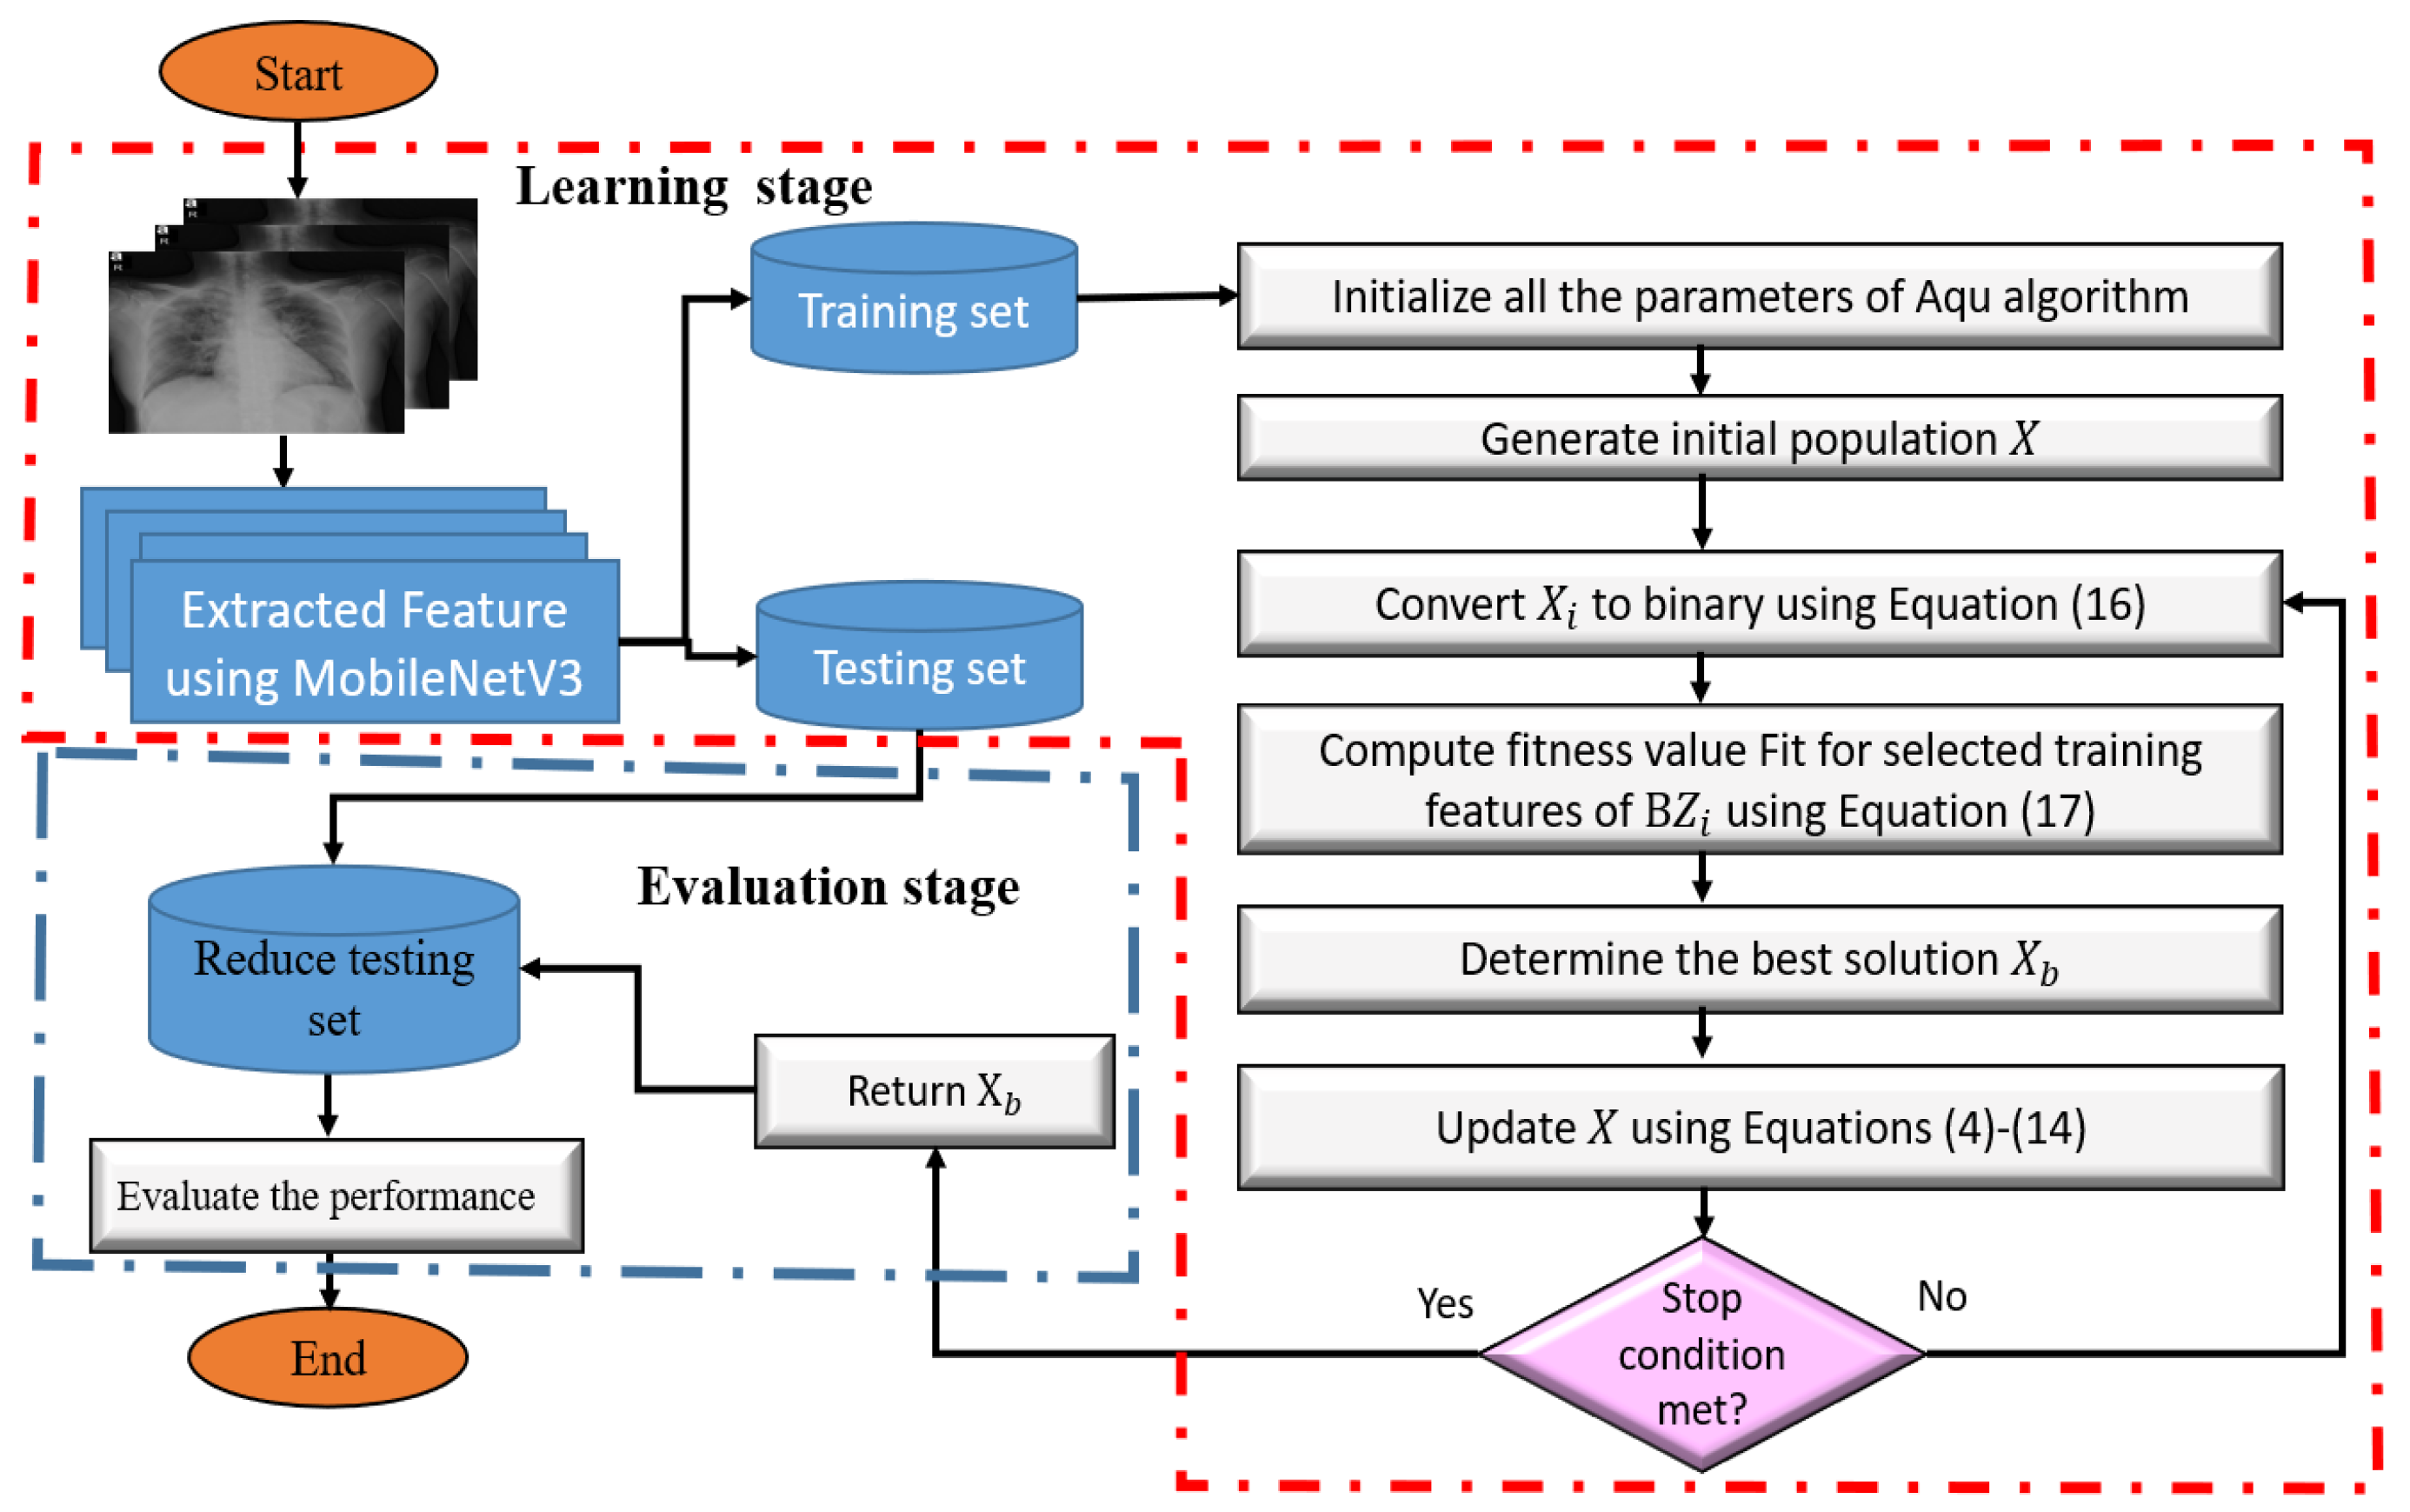
3.2. Developed Aqu FS Algorithm
3.2.1. First Stage: Learning of Model
3.2.2. Second Stage: Evaluation of the Selected Features
4. Experimental Results
4.1. Dataset Description
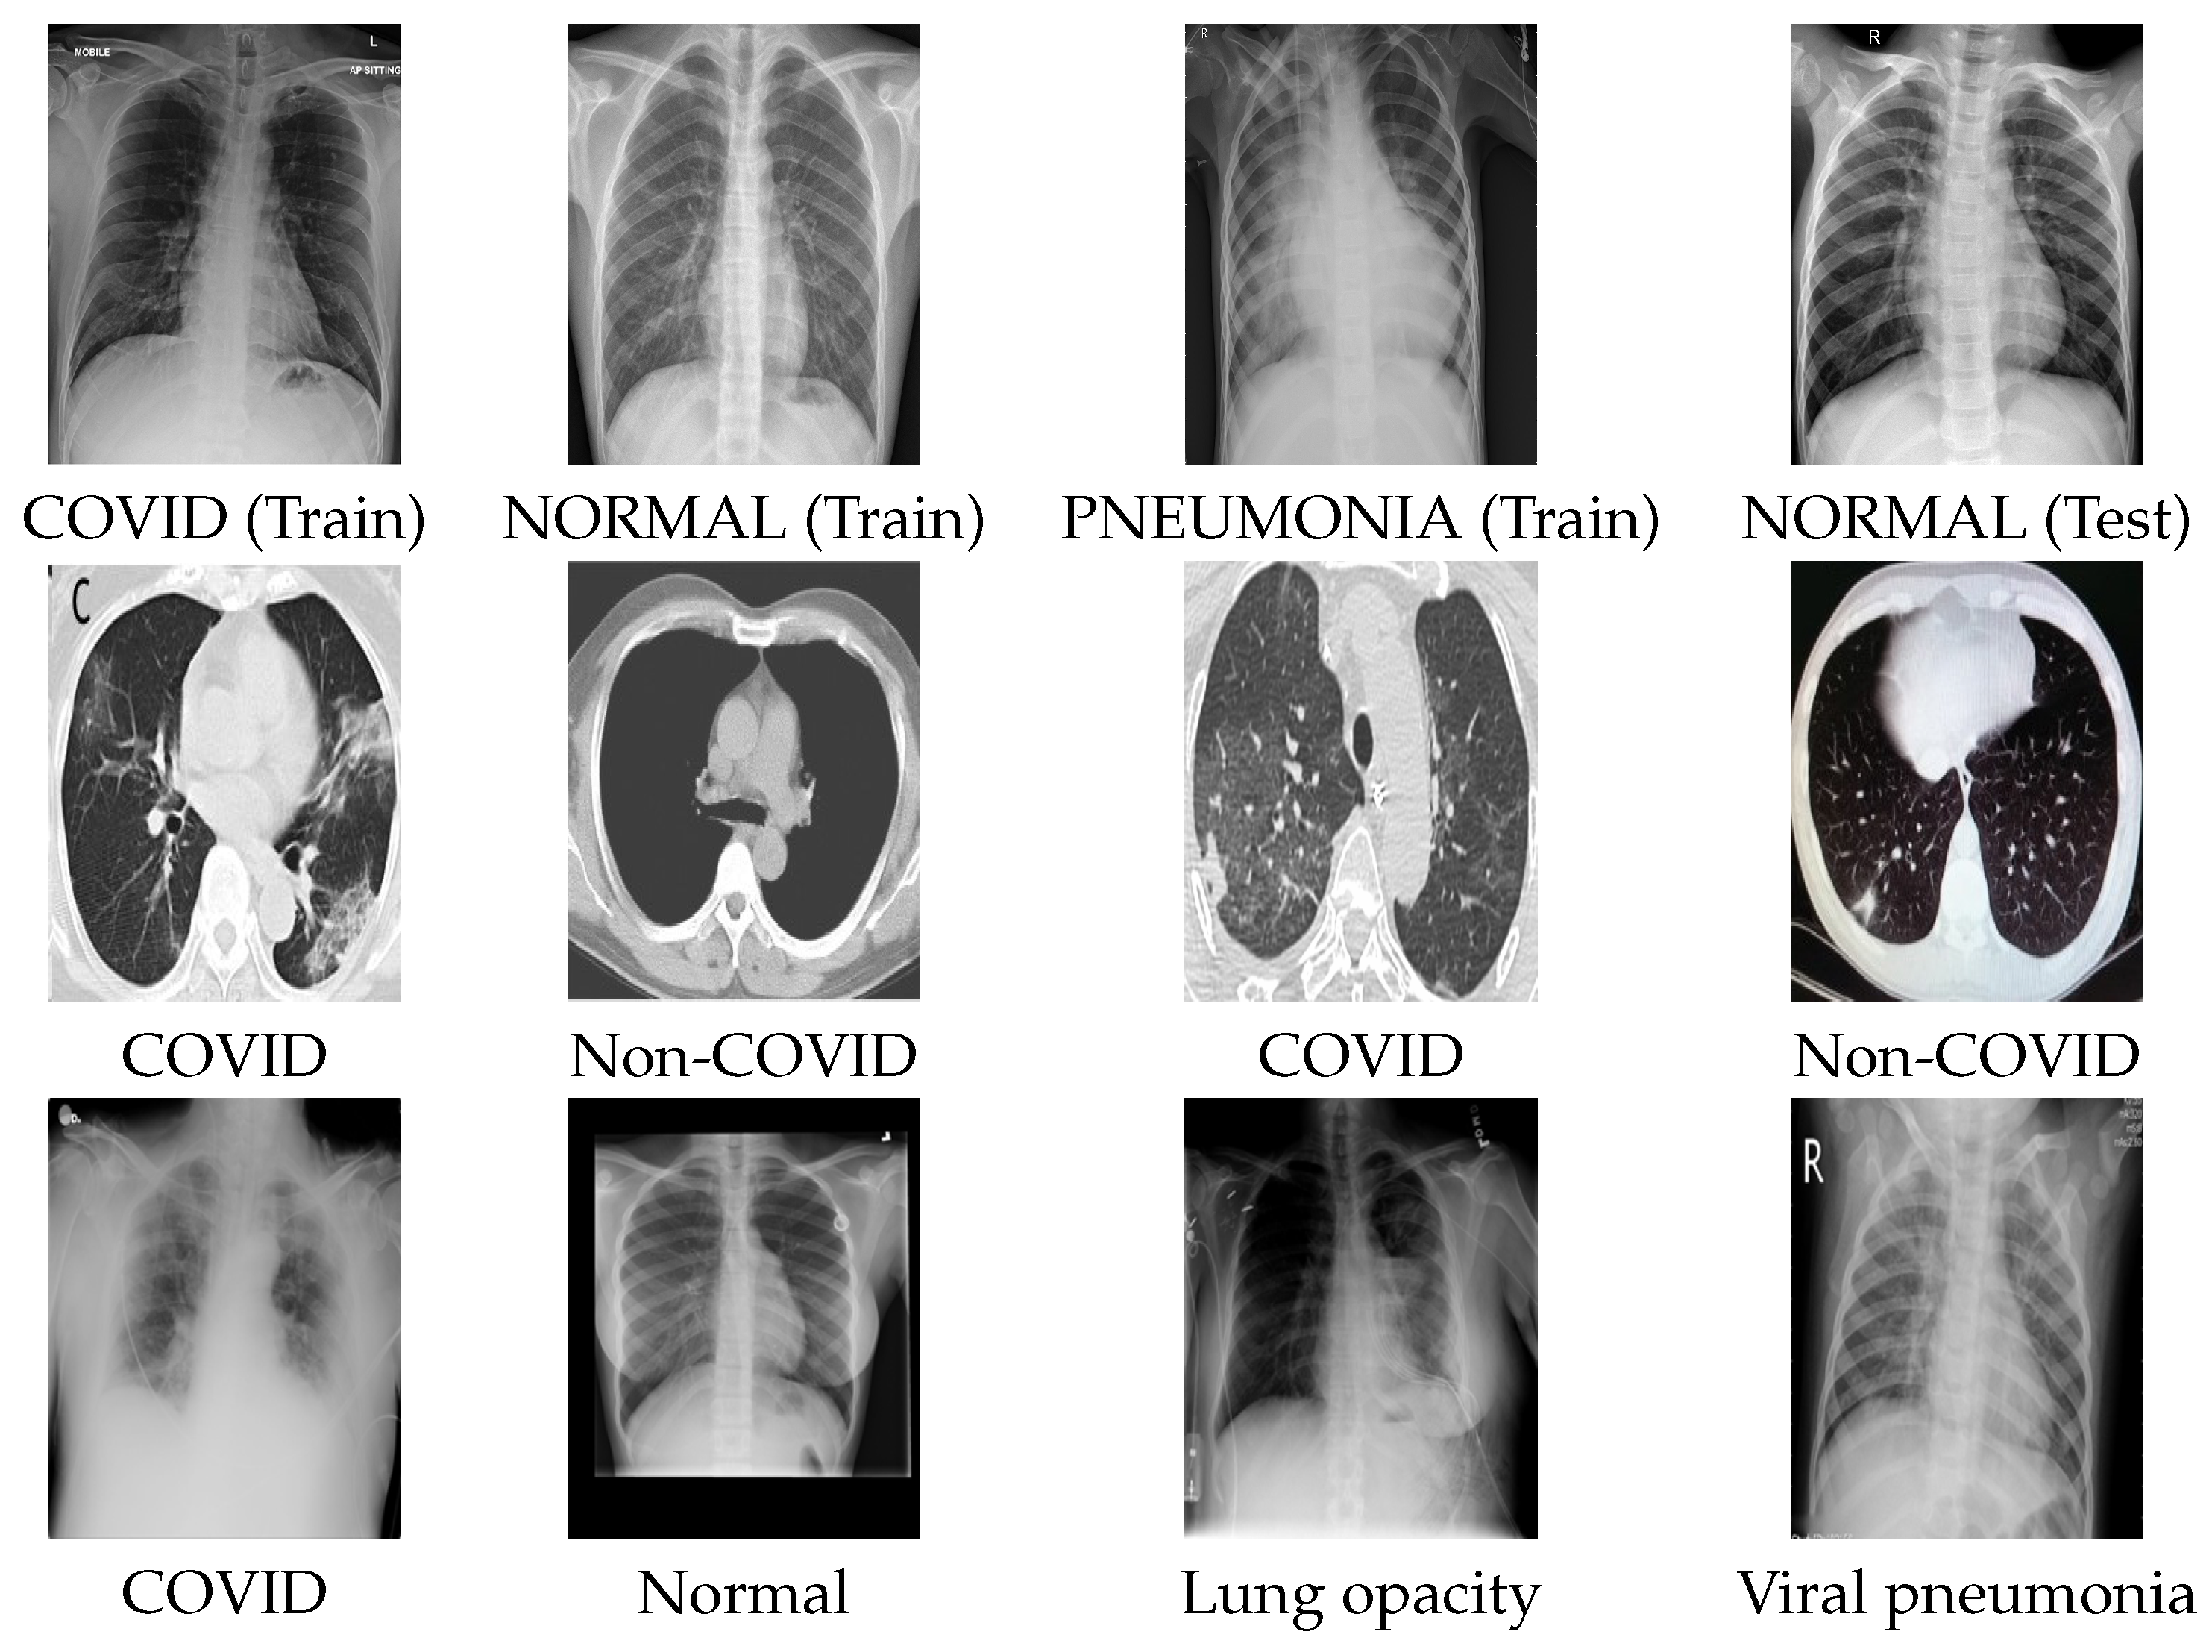
- COVID-CT dataset: This dataset was collected from two sources, including research papers (for training) and original CT scans donated by hospitals (for testing). For the research papers, the authors [42] collected 760 preprints from two databases including medRxiv https://www.medrxiv.org/ (accessed on 12 October 2021) and bioRxiv https://www.biorxiv.org/ (accessed on 12 October 2021). The preprints were collected from papers posted from 19 January to 25 March 2020. In total, 349 CT images labeled as positive were collected from 216 patient cases for COVID-19. In addition, the authors collected 397 negative CT images (Non-Covid19) to build their dataset for a binary classification task from sources including MedPix https://medpix.nlm.nih.gov/home (accessed on 12 October 2021) database, the LUNA7 https://luna16.grand-challenge.org/ (accessed on 12 October 2021) dataset, the Radiopaedia https://radiopaedia.org/articles/covid-19-3 (accessed on 12 October 2021) website, and PubMed https://www.ncbi.nlm.nih.gov/pmc/ (accessed on 12 October 2021) Central (PMC). Table 1 lists the number of positive and negative Covid-19 CT images used in our experiments.
- COVID-XRay-6432 dataset: The dataset is publicly available on Kaggle https://www.kaggle.com/prashant268/chest-xray-covid19-pneumonia (accessed on 12 October 2021) and was gathered from various public resources. The dataset includes 6432 X-ray COVID-19 images distributed on three classes which are COVID-19, PNEUMONIA, and NORMAL (Non-COVID). The training set comprises 80% of the dataset, and the test set comprises 20% of the dataset. In our experiments, 15% of the training sample is used in the validation set and fine-tuning. Table 2 lists the number of samples in each class.
- COVID-19 radiography dataset: The dataset was collected by a team of researchers from different countries and universities, including Qatar, Bangladesh, Pakistan, and Malaysia, collaborating with medical doctors. The dataset is freely available and frequently updated on Kaggle https://www.kaggle.com/tawsifurrahman/covid19-radiography-database (accessed on 12 October 2021). The dataset consists of 21,165 chest X-ray (CXR) COVID-19 images distributed on four categories which are COVID19, lung opacity, viral pneumonia, and NORMAL (Non-COVID). In our experiment, we randomly split the data into 70%, 10%, and 20% for training, validation, and testing sets, respectively. Table 3 lists the number of samples in each class after splitting the data.
4.2. Performance Metrics
- Best accuracy:where r denotes the run numbers. represents a fitness function value.
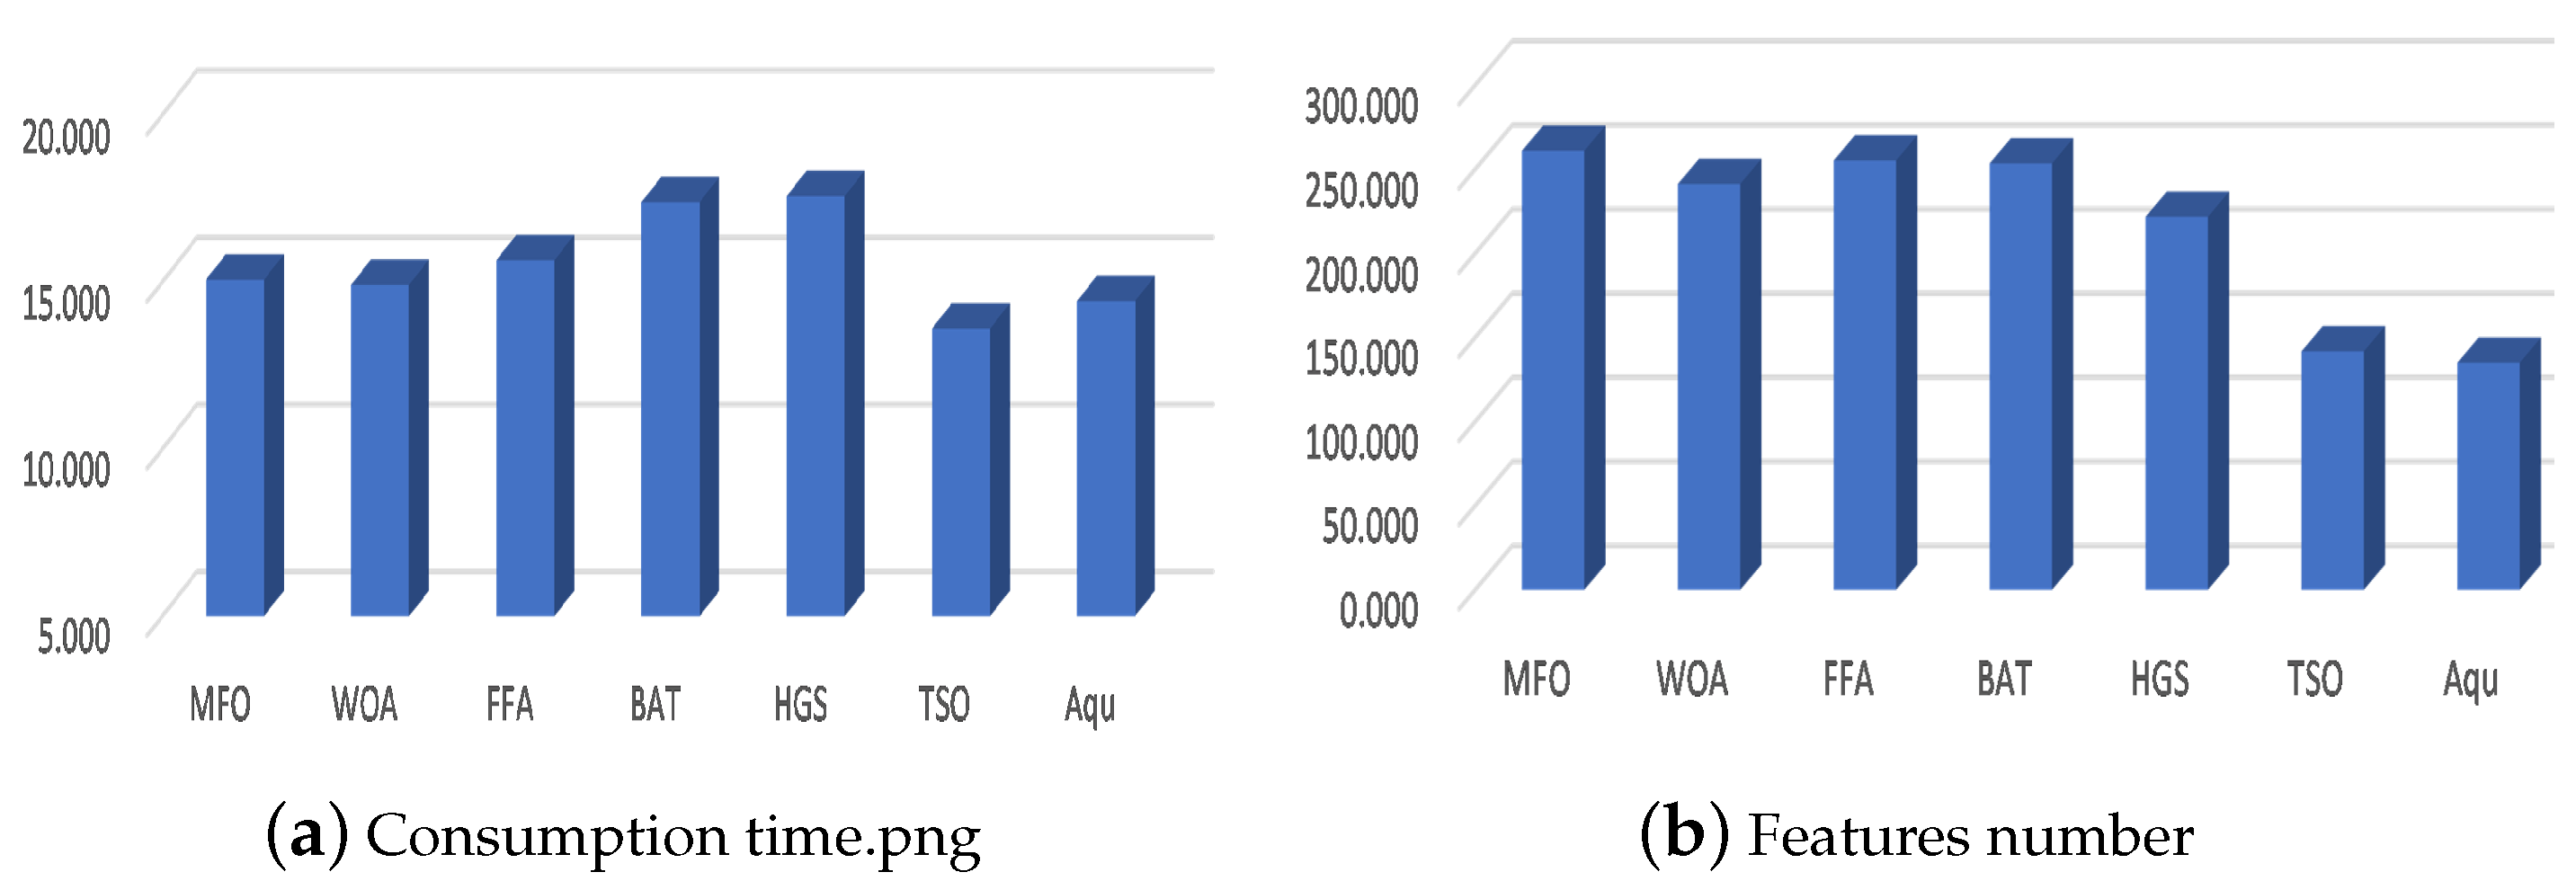
4.3. Results and Discussion
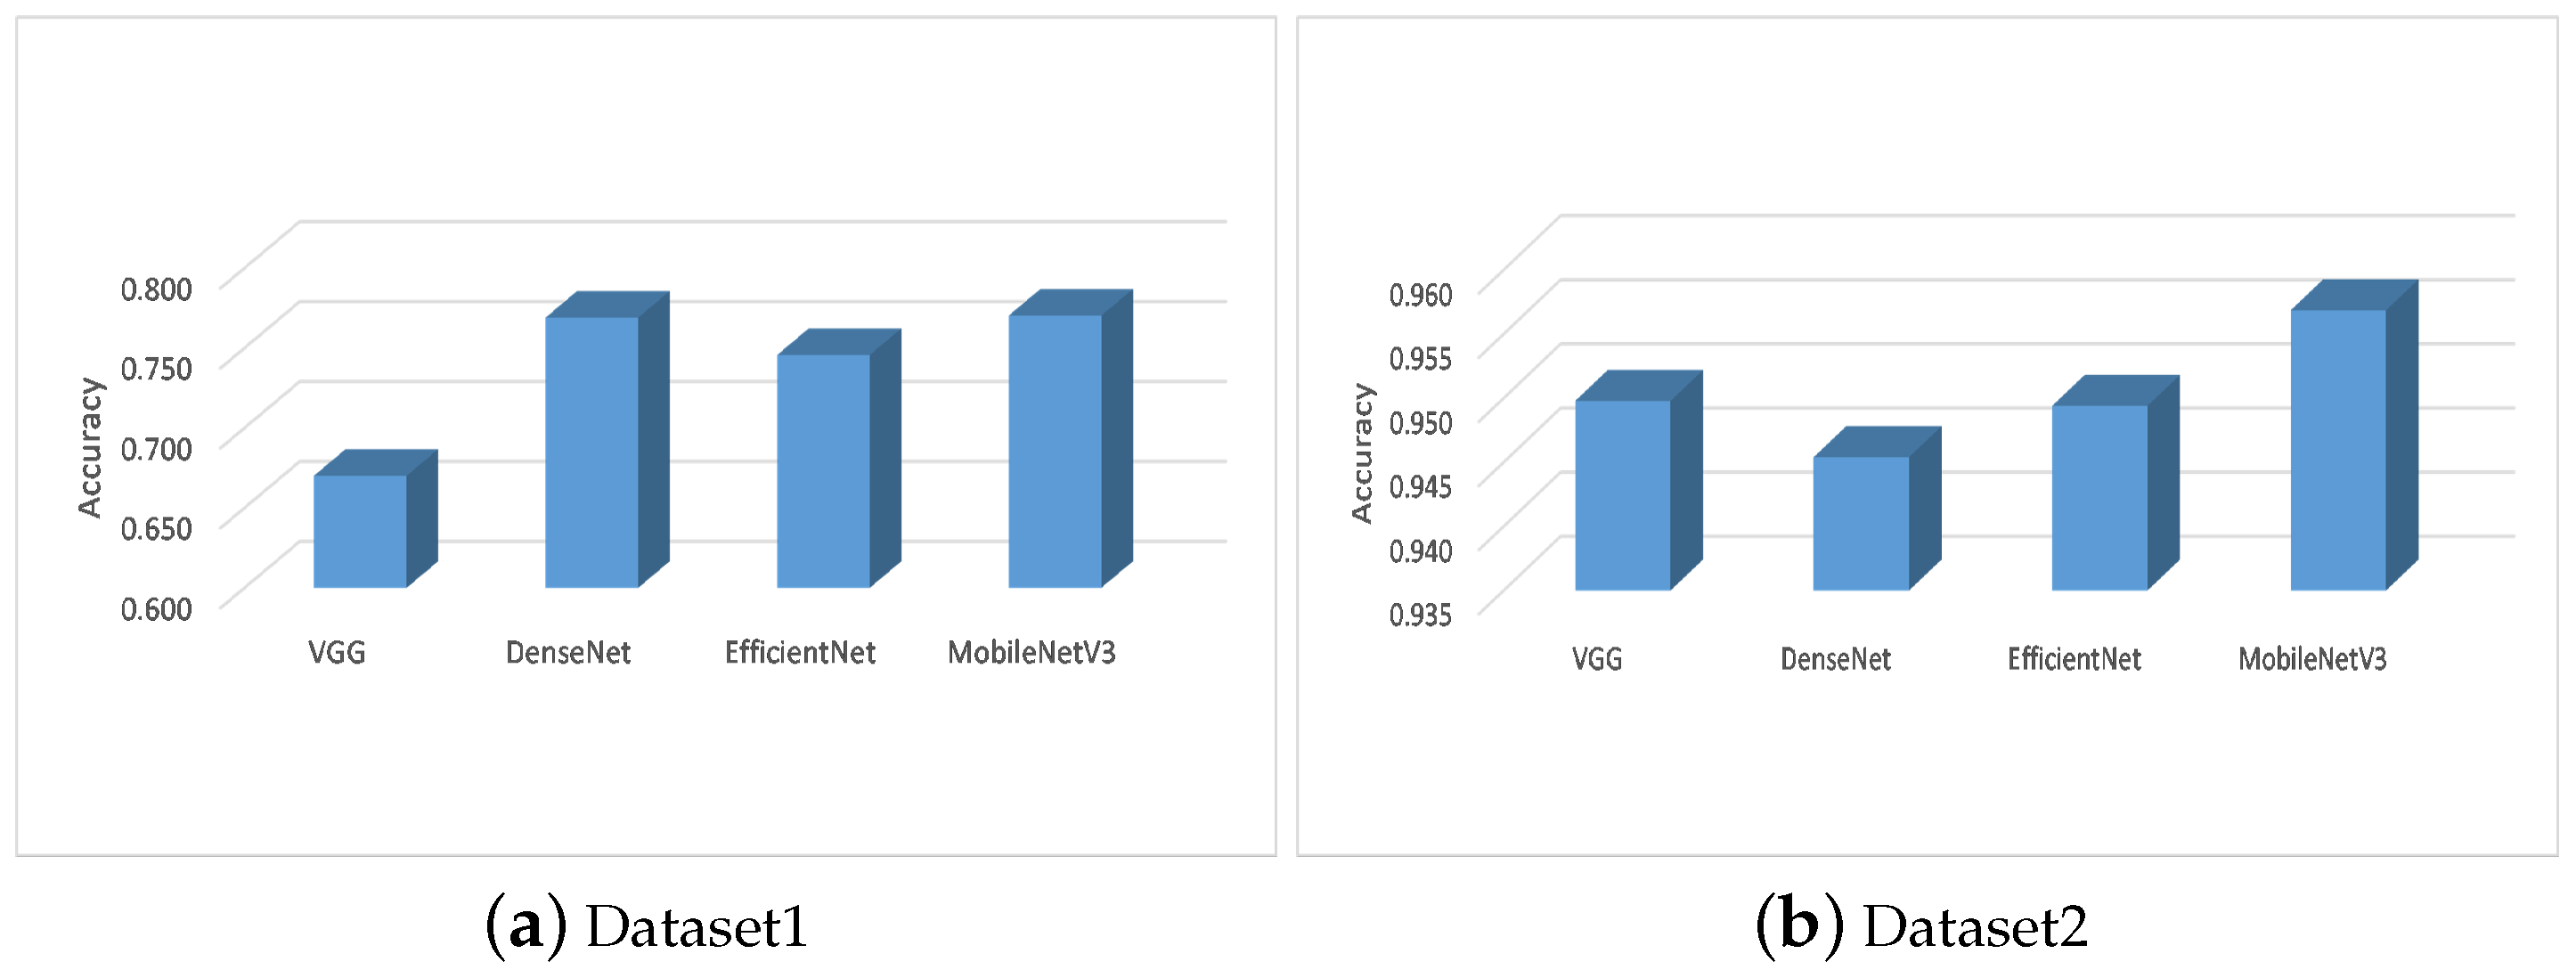
4.4. Comparison with Other CNN Types
4.5. Influence of the Size of COVID19 Dataset
5. Conclusions
Author Contributions
Funding
Data Availability Statement
Acknowledgments
Conflicts of Interest
References
- Chen, D.; Xu, W.; Lei, Z.; Huang, Z.; Liu, J.; Gao, Z.; Peng, L. Recurrence of positive SARS-CoV-2 RNA in COVID-19: A case report. Int. J. Infect. Dis. 2020, 93, 297–299. [Google Scholar] [CrossRef] [PubMed]
- Liu, Y.C.; Kuo, R.L.; Shih, S.R. COVID-19: The first documented coronavirus pandemic in history. Biomed. J. 2020, 43, 328–333. [Google Scholar] [CrossRef] [PubMed]
- Huang, C.; Wang, Y.; Li, X.; Ren, L.; Zhao, J.; Hu, Y.; Zhang, L.; Fan, G.; Xu, J.; Gu, X.; et al. Clinical features of patients infected with 2019 novel coronavirus in Wuhan, China. Lancet 2020, 395, 497–506. [Google Scholar] [CrossRef] [Green Version]
- Serena Low, W.C.; Chuah, J.H.; Tee, C.A.T.; Anis, S.; Shoaib, M.A.; Faisal, A.; Khalil, A.; Lai, K.W. An Overview of Deep Learning Techniques on Chest X-Ray and CT Scan Identification of COVID-19. Comput. Math. Methods Med. 2021, 2021, 5528144. [Google Scholar] [CrossRef] [PubMed]
- Brady, A.P. Error and discrepancy in radiology: Inevitable or avoidable? Insights Imaging 2017, 8, 171–182. [Google Scholar] [CrossRef] [Green Version]
- Briganti, G.; Le Moine, O. Artificial intelligence in medicine: Today and tomorrow. Front. Med. 2020, 7, 27. [Google Scholar] [CrossRef] [PubMed]
- Kumar, L.K.; Alphonse, P. Automatic Diagnosis of COVID-19 Disease using Deep Convolutional Neural Network with Multi-Feature Channel from Respiratory Sound Data: Cough, Voice, and Breath. Alex. Eng. J. 2021. [Google Scholar] [CrossRef]
- Al-Qaness, M.A.; Saba, A.I.; Elsheikh, A.H.; Abd Elaziz, M.; Ibrahim, R.A.; Lu, S.; Hemedan, A.A.; Shanmugan, S.; Ewees, A.A. Efficient artificial intelligence forecasting models for COVID-19 outbreak in Russia and Brazil. Process Saf. Environ. Prot. 2021, 149, 399–409. [Google Scholar] [CrossRef] [PubMed]
- Göreke, V.; Sarı, V.; Kockanat, S. A novel classifier architecture based on deep neural network for COVID-19 detection using laboratory findings. Appl. Soft Comput. 2021, 106, 107329. [Google Scholar] [CrossRef] [PubMed]
- Elsheikh, A.H.; Saba, A.I.; Abd Elaziz, M.; Lu, S.; Shanmugan, S.; Muthuramalingam, T.; Kumar, R.; Mosleh, A.O.; Essa, F.; Shehabeldeen, T.A. Deep learning-based forecasting model for COVID-19 outbreak in Saudi Arabia. Process Saf. Environ. Prot. 2021, 149, 223–233. [Google Scholar] [CrossRef] [PubMed]
- Saba, A.I.; Elsheikh, A.H. Forecasting the prevalence of COVID-19 outbreak in Egypt using nonlinear autoregressive artificial neural networks. Process Saf. Environ. Prot. 2020, 141, 1–8. [Google Scholar] [CrossRef]
- Mohammadi, F.; Pourzamani, H.; Karimi, H.; Mohammadi, M.; Mohammadi, M.; Ardalan, N.; Khoshravesh, R.; Pooresmaeil, H.; Shahabi, S.; Sabahi, M.; et al. Artificial neural network and logistic regression modelling to characterize COVID-19 infected patients in local areas of Iran. Biomed. J. 2021. [Google Scholar] [CrossRef] [PubMed]
- Albahli, S. A deep neural network to distinguish covid-19 from other chest diseases using X-ray images. Curr. Med. Imaging 2021, 17, 109–119. [Google Scholar] [CrossRef]
- Zhao, W.; Zhong, Z.; Xie, X.; Yu, Q.; Liu, J. Relation between chest CT findings and clinical conditions of coronavirus disease (COVID-19) pneumonia: A multicenter study. Am. J. Roentgenol. 2020, 214, 1072–1077. [Google Scholar] [CrossRef] [PubMed]
- Bernheim, A.; Mei, X.; Huang, M.; Yang, Y.; Fayad, Z.A.; Zhang, N.; Diao, K.; Lin, B.; Zhu, X.; Li, K.; et al. Chest CT findings in coronavirus disease-19 (COVID-19): Relationship to duration of infection. Radiology 2020, 200463. [Google Scholar] [CrossRef] [PubMed] [Green Version]
- Pezzano, G.; Díaz, O.; Ripoll, V.R.; Radeva, P. CoLe-CNN+: Context learning-Convolutional neural network for COVID-19-Ground-Glass-Opacities detection and segmentation. Comput. Biol. Med. 2021, 136, 104689. [Google Scholar] [CrossRef] [PubMed]
- Yasin, R.; Gouda, W. Chest X-ray findings monitoring COVID-19 disease course and severity. Egypt. J. Radiol. Nucl. Med. 2020, 51, 1–18. [Google Scholar] [CrossRef]
- Wang, L.; Lin, Z.Q.; Wong, A. Covid-net: A tailored deep convolutional neural network design for detection of covid-19 cases from chest X-ray images. Sci. Rep. 2020, 10, 1–12. [Google Scholar]
- Das, A.K.; Ghosh, S.; Thunder, S.; Dutta, R.; Agarwal, S.; Chakrabarti, A. Automatic COVID-19 detection from X-ray images using ensemble learning with convolutional neural network. Pattern Anal. Appl. 2021, 1–14. [Google Scholar] [CrossRef]
- Oliva, D.; Abd Elaziz, M.; Elsheikh, A.H.; Ewees, A.A. A review on meta-heuristics methods for estimating parameters of solar cells. J. Power Sources 2019, 435, 126683. [Google Scholar] [CrossRef]
- Abd Elaziz, M.; Elsheikh, A.H.; Oliva, D.; Abualigah, L.; Lu, S.; Ewees, A.A. Advanced Metaheuristic Techniques for Mechanical Design Problems. Arch. Comput. Methods Eng. 2021, 1–22. [Google Scholar] [CrossRef]
- Canayaz, M. MH-COVIDNet: Diagnosis of COVID-19 using deep neural networks and meta-heuristic-based feature selection on X-ray images. Biomed. Signal Process. Control 2021, 64, 102257. [Google Scholar] [CrossRef]
- Sahlol, A.T.; Yousri, D.; Ewees, A.A.; Al-Qaness, M.A.; Damasevicius, R.; Abd Elaziz, M. COVID-19 image classification using deep features and fractional-order marine predators algorithm. Sci. Rep. 2020, 10, 1–15. [Google Scholar] [CrossRef] [PubMed]
- Abd Elaziz, M.; Ewees, A.A.; Yousri, D.; Alwerfali, H.S.N.; Awad, Q.A.; Lu, S.; Al-Qaness, M.A. An improved Marine Predators algorithm with fuzzy entropy for multi-level thresholding: Real world example of COVID-19 CT image segmentation. IEEE Access 2020, 8, 125306–125330. [Google Scholar] [CrossRef] [PubMed]
- Yousri, D.; Abd Elaziz, M.; Abualigah, L.; Oliva, D.; Al-Qaness, M.A.; Ewees, A.A. COVID-19 X-ray images classification based on enhanced fractional-order cuckoo search optimizer using heavy-tailed distributions. Appl. Soft Comput. 2021, 101, 107052. [Google Scholar] [CrossRef] [PubMed]
- Elaziz, M.A.; Hosny, K.M.; Salah, A.; Darwish, M.M.; Lu, S.; Sahlol, A.T. New machine learning method for image-based diagnosis of COVID-19. PLoS ONE 2020, 15, e0235187. [Google Scholar] [CrossRef]
- Abualigah, L.; Yousri, D.; Abd Elaziz, M.; Ewees, A.A.; Al-qanes, M.; Gandomi, A.H. Aquila Optimizer: A novel meta-heuristic optimization Algorithm. Comput. Ind. Eng. 2021, 157, 107250. [Google Scholar] [CrossRef]
- AlRassas, A.M.; Al-qaness, M.A.; Ewees, A.A.; Ren, S.; Abd Elaziz, M.; Damaševičius, R.; Krilavičius, T. Optimized ANFIS model using Aquila Optimizer for oil production forecasting. Processes 2021, 9, 1194. [Google Scholar] [CrossRef]
- Wang, S.; Jia, H.; Liu, Q.; Zheng, R. An improved hybrid Aquila Optimizer and Harris Hawks Optimization for global optimization. Math. Biosci. Eng. 2021, 18, 7076–7109. [Google Scholar] [CrossRef]
- Zoph, B.; Vasudevan, V.; Shlens, J.; Le, Q.V. Learning transferable architectures for scalable image recognition. In Proceedings of the IEEE Conference on Computer Vision and Pattern Recognition, Salt Lake City, UT, USA, 18–22 June 2018; pp. 8697–8710. [Google Scholar]
- Howard, A.G.; Zhu, M.; Chen, B.; Kalenichenko, D.; Wang, W.; Weyand, T.; Andreetto, M.; Adam, H. Mobilenets: Efficient convolutional neural networks for mobile vision applications. arXiv 2017, arXiv:1704.04861. [Google Scholar]
- Howard, A.; Sandler, M.; Chu, G.; Chen, L.C.; Chen, B.; Tan, M.; Wang, W.; Zhu, Y.; Pang, R.; Vasudevan, V.; et al. Searching for mobilenetv3. In Proceedings of the IEEE International Conference on Computer Vision, Seoul, Korea, 2 September–27 October 2019; pp. 1314–1324. [Google Scholar]
- Tan, M.; Le, Q. Efficientnet: Rethinking model scaling for convolutional neural networks. In Proceedings of the International Conference on Machine Learning, Long Beach, CA, USA, 9–15 June 2019; pp. 6105–6114. [Google Scholar]
- Tan, M.; Chen, B.; Pang, R.; Vasudevan, V.; Sandler, M.; Howard, A.; Le, Q.V. Mnasnet: Platform-aware neural architecture search for mobile. In Proceedings of the IEEE/CVF Conference on Computer Vision and Pattern Recognition, Long Beach, CA, USA, 15–20 June 2019; pp. 2820–2828. [Google Scholar]
- Zhang, X.; Zhou, X.; Lin, M.; Sun, J. Shufflenet: An extremely efficient convolutional neural network for mobile devices. In Proceedings of the IEEE Conference on Computer Vision and Pattern Recognition, Salt Lake City, UT, USA, 18–23 June 2018; pp. 6848–6856. [Google Scholar]
- Tran, D.; Wang, H.; Torresani, L.; Feiszli, M. Video classification with channel-separated convolutional networks. In Proceedings of the IEEE/CVF International Conference on Computer Vision, Seoul, Korea, 27–28 October 2019; pp. 5552–5561. [Google Scholar]
- Ji, J.; Krishna, R.; Fei-Fei, L.; Niebles, J.C. Action genome: Actions as compositions of spatio-temporal scene graphs. In Proceedings of the IEEE/CVF Conference on Computer Vision and Pattern Recognition, Seattle, WA, USA, 13–19 June 2020; pp. 10236–10247. [Google Scholar]
- Liu, J.; Inkawhich, N.; Nina, O.; Timofte, R. NTIRE 2021 multi-modal aerial view object classification challenge. In Proceedings of the IEEE/CVF Conference on Computer Vision and Pattern Recognition, Nashville, TN, USA, 19–25 June 2021; pp. 588–595. [Google Scholar]
- Ignatov, A.; Romero, A.; Kim, H.; Timofte, R. Real-time video super-resolution on smartphones with deep learning, mobile ai 2021 challenge: Report. In Proceedings of the IEEE/CVF Conference on Computer Vision and Pattern Recognition, Nashville, TN, USA, 19–25 June 2021; pp. 2535–2544. [Google Scholar]
- Ramachandran, P.; Zoph, B.; Le, Q.V. Searching for activation functions. arXiv 2017, arXiv:1710.05941. [Google Scholar]
- He, K.; Zhang, X.; Ren, S.; Sun, J. Deep residual learning for image recognition. In Proceedings of the IEEE Conference on Computer Vision and Pattern Recognition, Las Vegas, NV, USA, 27–30 June 2016; pp. 770–778. [Google Scholar]
- Yang, X.; He, X.; Zhao, J.; Zhang, Y.; Zhang, S.; Xie, P. COVID-CT-dataset: A CT scan dataset about COVID-19. arXiv 2020, arXiv:2003.13865. [Google Scholar]
- Mirjalili, S.; Lewis, A. The whale optimization algorithm. Adv. Eng. Softw. 2016, 95, 51–67. [Google Scholar] [CrossRef]
- Mirjalili, S. Moth-flame optimization algorithm: A novel nature-inspired heuristic paradigm. Knowl. Based Syst. 2015, 89, 228–249. [Google Scholar] [CrossRef]
- Abd Elaziz, M.; Ewees, A.A.; Ibrahim, R.A.; Lu, S. Opposition-based moth-flame optimization improved by differential evolution for feature selection. Math. Comput. Simul. 2020, 168, 48–75. [Google Scholar] [CrossRef]
- Yang, X.S.; He, X. Firefly algorithm: Recent advances and applications. Int. J. Swarm Intell. 2013, 1, 36–50. [Google Scholar] [CrossRef] [Green Version]
- Nakamura, R.Y.; Pereira, L.A.; Costa, K.A.; Rodrigues, D.; Papa, J.P.; Yang, X.S. BBA: A binary bat algorithm for feature selection. In Proceedings of the 2012 25th SIBGRAPI Conference on Graphics, Patterns and Images, Ouro Preto, Brazil, 22–25 August 2012; pp. 291–297. [Google Scholar]
- AbuShanab, W.S.; Abd Elaziz, M.; Ghandourah, E.I.; Moustafa, E.B.; Elsheikh, A.H. A new fine-tuned random vector functional link model using Hunger games search optimizer for modeling friction stir welding process of polymeric materials. J. Mater. Res. Technol. 2021, 14, 1482–1493. [Google Scholar] [CrossRef]
- Qais, M.H.; Hasanien, H.M.; Alghuwainem, S. Transient search optimization: A new meta-heuristic optimization algorithm. Appl. Intell. 2020, 50, 3926–3941. [Google Scholar] [CrossRef]
- Simonyan, K.; Zisserman, A. Very deep convolutional networks for large-scale image recognition. arXiv 2014, arXiv:1409.1556. [Google Scholar]
- Huang, G.; Liu, Z.; Van Der Maaten, L.; Weinberger, K.Q. Densely connected convolutional networks. In Proceedings of the IEEE Conference on Computer Vision and Pattern Recognition, Honolulu, HI, USA, 21–26 July 2017; pp. 4700–4708. [Google Scholar]


| Class | Train | Validation | Test | |
|---|---|---|---|---|
| # patients | COVID | 130 | 32 | 54 |
| Non-COVID | 105 | 24 | 42 | |
| # images | COVID | 191 | 60 | 98 |
| Non-COVID | 234 | 58 | 105 |
| Class | Train | Test | |
|---|---|---|---|
| # images | COVID | 460 | 116 |
| Non-COVID | 1266 | 317 | |
| PNEUMONIA | 3418 | 855 |
| Train | Validation | Test | |
|---|---|---|---|
| # images | 15,238 | 1694 | 4233 |
| Dataset1 | Dataset2 | |||||||
|---|---|---|---|---|---|---|---|---|
| Accuracy | Recall | Precision | F1-Score | Accuracy | Recall | Precision | F1-Score | |
| MFO | 0.769 | 0.769 | 0.771 | 0.767 | 0.957 | 0.956 | 0.928 | 0.942 |
| WOA | 0.761 | 0.761 | 0.764 | 0.760 | 0.925 | 0.920 | 0.967 | 0.943 |
| FFA | 0.769 | 0.769 | 0.771 | 0.767 | 0.958 | 0.812 | 0.873 | 0.841 |
| BAT | 0.771 | 0.771 | 0.775 | 0.769 | 0.963 | 0.944 | 0.802 | 0.867 |
| HGS | 0.773 | 0.773 | 0.776 | 0.772 | 0.963 | 0.958 | 0.959 | 0.959 |
| TSO | 0.766 | 0.766 | 0.770 | 0.764 | 0.958 | 0.827 | 0.967 | 0.892 |
| Aqu | 0.783 | 0.783 | 0.785 | 0.782 | 0.974 | 0.974 | 0.974 | 0.974 |
| Dataset1 | Dataset2 | |||
|---|---|---|---|---|
| CPU Time (s) | #FS | CPU Time (s) | #FS | |
| MFO | 3.481 | 278.5 | 26.654 | 243.5 |
| WOA | 3.260 | 248.5 | 26.572 | 234 |
| FFA | 4.294 | 260.5 | 27.009 | 250 |
| BAT | 3.602 | 256.5 | 31.179 | 250.5 |
| HGS | 4.115 | 281 | 31.028 | 162.5 |
| TSO | 3.197 | 141.5 | 24.013 | 142 |
| Aqu | 3.123 | 130 | 25.737 | 140 |
| Dataset1 | Dataset2 | |||||||
|---|---|---|---|---|---|---|---|---|
| VGG | DenseNet | EfficientNet | MobileNetV3 | VGG | DenseNet | EfficientNet | MobileNetV3 | |
| MFO | 0.667 | 0.766 | 0.757 | 0.769 | 0.939 | 0.947 | 0.938 | 0.957 |
| WOA | 0.672 | 0.751 | 0.742 | 0.761 | 0.937 | 0.936 | 0.936 | 0.925 |
| FFA | 0.670 | 0.784 | 0.742 | 0.769 | 0.960 | 0.934 | 0.959 | 0.958 |
| BAT | 0.667 | 0.756 | 0.761 | 0.771 | 0.935 | 0.959 | 0.935 | 0.963 |
| HGS | 0.672 | 0.764 | 0.742 | 0.773 | 0.944 | 0.935 | 0.945 | 0.963 |
| TSO | 0.665 | 0.785 | 0.725 | 0.766 | 0.961 | 0.934 | 0.961 | 0.958 |
| Aqu | 0.676 | 0.777 | 0.751 | 0.783 | 0.972 | 0.973 | 0.971 | 0.974 |
| Accuracy | Recall | Precision | F1-Score | CPU Time (s) | #FS | |
|---|---|---|---|---|---|---|
| MFO | 0.889 | 0.897 | 0.840 | 0.868 | 15.347 | 61 |
| WOA | 0.886 | 0.885 | 0.828 | 0.855 | 15.593 | 58.5 |
| FFA | 0.910 | 0.885 | 0.828 | 0.855 | 15.632 | 56 |
| BAT | 0.887 | 0.909 | 0.852 | 0.880 | 18.185 | 57 |
| HGS | 0.894 | 0.884 | 0.827 | 0.855 | 18.306 | 69 |
| TSO | 0.910 | 0.884 | 0.827 | 0.855 | 15.179 | 63 |
| Aqu | 0.924 | 0.924 | 0.866 | 0.894 | 15.290 | 57 |
Publisher’s Note: MDPI stays neutral with regard to jurisdictional claims in published maps and institutional affiliations. |
© 2021 by the authors. Licensee MDPI, Basel, Switzerland. This article is an open access article distributed under the terms and conditions of the Creative Commons Attribution (CC BY) license (https://creativecommons.org/licenses/by/4.0/).
Share and Cite
Abd Elaziz, M.; Dahou, A.; Alsaleh, N.A.; Elsheikh, A.H.; Saba, A.I.; Ahmadein, M. Boosting COVID-19 Image Classification Using MobileNetV3 and Aquila Optimizer Algorithm. Entropy 2021, 23, 1383. https://doi.org/10.3390/e23111383
Abd Elaziz M, Dahou A, Alsaleh NA, Elsheikh AH, Saba AI, Ahmadein M. Boosting COVID-19 Image Classification Using MobileNetV3 and Aquila Optimizer Algorithm. Entropy. 2021; 23(11):1383. https://doi.org/10.3390/e23111383
Chicago/Turabian StyleAbd Elaziz, Mohamed, Abdelghani Dahou, Naser A. Alsaleh, Ammar H. Elsheikh, Amal I. Saba, and Mahmoud Ahmadein. 2021. "Boosting COVID-19 Image Classification Using MobileNetV3 and Aquila Optimizer Algorithm" Entropy 23, no. 11: 1383. https://doi.org/10.3390/e23111383