
Entropy-Based Graph Clustering of PPI Networks for Predicting Overlapping Functional Modules of Proteins


Abstract
:1. Introduction
2. Materials and Methods
2.1. PPI Datasets
2.2. References
2.3. Graph Clustering Algorithms
2.3.1. Graph Entropy Algorithm
- Select a seed node. Among the nodes that are not in the output clusters from Step 6, select the one with the highest degree as the seed node.
- Form an initial seed cluster including the seed node and its neighbors.
- Delete each neighbor of the seed node iteratively from the seed cluster if GE decreases. Check the neighbors in descending order of their degrees.
- Add each neighbor of the seed cluster iteratively into the seed cluster if GE decreases. Check the neighbors in descending order of their degrees.
- Output the seed cluster if partitioning the graph by the cluster results in the lowest GE.
- Repeat Steps 1–5 to output a set of clusters until no seed node remains.
2.3.2. Weighted GE Algorithm
2.4. Evaluation of Clustering Accuracy
3. Results
3.1. Experimental Settings
3.2. Clustering Results
3.3. Accuracy Evaluation of Clusters
3.4. Accuracy Evaluation of Overlapping Clusters
3.5. Biological Aspects of Clusters from GE Algorithms
4. Discussion and Conclusions
Author Contributions
Funding
Institutional Review Board Statement
Informed Consent Statement
Data Availability Statement
Acknowledgments
Conflicts of Interest
Abbreviations
| PPI | Protein–Protein Interaction |
| GE | Graph Entropy |
| GO | Gene Ontology |
| Average F-Score | |
| Average Precision Score | |
| MCL | Markov Clustering |
References
- Barabasi, A.L.; Oltvai, Z.N. Network biology: Understanding the cell’s functional organization. Nat. Rev. Genet. 2004, 5, 101–113. [Google Scholar] [CrossRef]
- Pereira-Leal, J.B.; Enright, A.J.; Ouzounis, C.A. Detection of functional modules from protein interaction networks. Proteins Struct. Funct. Bioinform. 2004, 54, 49–57. [Google Scholar] [CrossRef]
- Pereira-Leal, J.B.; Levy, E.D.; Teichmann, S.A. The origins and evolution of functional modules: Lessons from protein complexes. Philos. Trans. R. Soc. Biol. Sci. 2006, 361, 507–517. [Google Scholar] [CrossRef] [Green Version]
- Enright, A.J.; Van Dongen, S.; Ouzounis, C.A. An efficient algorithm for large-scale detection of protein families. Nucleic Acids Res. 2002, 30, 1575–1584. [Google Scholar] [CrossRef]
- Rosvall, M.; Bergstrom, C.T. Maps of random walks on complex networks reveal community structure. Proc. Natl. Acad. Sci. USA 2008, 105, 1118–1123. [Google Scholar] [CrossRef] [Green Version]
- Bohlin, L.; Edler, D.; Lancichinetti, A.; Rosvall, M. Community detection and visualization of networks with the map equation framework. In Measuring Scholarly Impact; Springer: Berlin/Heidelberg, Germany, 2014; pp. 3–34. [Google Scholar]
- Bader, G.D.; Hogue, C.W. An automated method for finding molecular complexes in large protein interaction networks. BMC Bioinform. 2003, 4, 1–27. [Google Scholar] [CrossRef] [Green Version]
- Palla, G.; Derényi, I.; Farkas, I.; Vicsek, T. Uncovering the overlapping community structure of complex networks in nature and society. Nature 2005, 435, 814–818. [Google Scholar] [CrossRef] [Green Version]
- Kenley, E.; Cho, Y. Entropy-Based Graph Clustering: Application to Biological and Social Networks. In Proceedings of the 2011 IEEE 11th International Conference on Data Mining, Vancouver, BC, Canada, 11–14 December 2011; pp. 1116–1121. [Google Scholar] [CrossRef]
- Kenley, E.; Cho, Y. Detecting protein complexes and functional modules from protein interaction networks: A graph entropy approach. Proteomics 2011, 11, 3835–3844. [Google Scholar] [CrossRef]
- Shih, Y.K.; Parthasarathy, S. Identifying functional modules in interaction networks through overlapping Markov clustering. Bioinformatics 2012, 28, i473–i479. [Google Scholar] [CrossRef] [Green Version]
- Becker, E.; Robisson, B.; Chapple, C.E.; Guénoche, A.; Brun, C. Multifunctional proteins revealed by overlapping clustering in protein interaction network. Bioinformatics 2012, 28, 84–90. [Google Scholar] [CrossRef] [Green Version]
- Liu, G.; Chai, B.; Yang, K.; Yu, J.; Zhou, X. Overlapping functional modules detection in PPI network with pair-wise constrained non-negative matrix tri-factorisation. IET Syst. Biol. 2018, 12, 45–54. [Google Scholar] [CrossRef]
- Nepusz, T.; Yu, H.; Paccanaro, A. Detecting overlapping protein complexes in protein-protein interaction networks. Nat. Methods 2012, 9, 471–472. [Google Scholar] [CrossRef]
- Szklarczyk, D.; Franceschini, A.; Wyder, S.; Forslund, K.; Heller, D.; Huerta-Cepas, J.; Simonovic, M.; Roth, A.; Santos, A.; Tsafou, K.P.; et al. STRING v10: Protein–protein interaction networks, integrated over the tree of life. Nucleic Acids Res. 2015, 43, D447–D452. [Google Scholar] [CrossRef]
- Szklarczyk, D.; Morris, J.H.; Cook, H.; Kuhn, M.; Wyder, S.; Simonovic, M.; Santos, A.; Doncheva, N.T.; Roth, A.; Bork, P.; et al. The STRING database in 2017: Quality-controlled protein–protein association networks, made broadly accessible. Nucleic Acids Res. 2016, 45, D362–D368. [Google Scholar] [CrossRef]
- Von Mering, C.; Jensen, L.J.; Snel, B.; Hooper, S.D.; Krupp, M.; Foglierini, M.; Jouffre, N.; Huynen, M.A.; Bork, P. STRING: Known and predicted protein–protein associations, integrated and transferred across organisms. Nucleic Acids Res. 2005, 33, D433–D437. [Google Scholar] [CrossRef]
- Kanehisa, M.; Goto, S.; Kawashima, S.; Okuno, Y.; Hattori, M. The KEGG resource for deciphering the genome. Nucleic Acids Res. 2004, 32, D277–D280. [Google Scholar] [CrossRef] [Green Version]
- Huttlin, E.L.; Ting, L.; Bruckner, R.J.; Gebreab, F.; Gygi, M.P.; Szpyt, J.; Tam, S.; Zarraga, G.; Colby, G.; Baltier, K.; et al. The BioPlex network: A systematic exploration of the human interactome. Cell 2015, 162, 425–440. [Google Scholar] [CrossRef] [Green Version]
- Ruepp, A.; Waegele, B.; Lechner, M.; Brauner, B.; Dunger-Kaltenbach, I.; Fobo, G.; Frishman, G.; Montrone, C.; Mewes, H.W. CORUM: The comprehensive resource of mammalian protein complexes—2009. Nucleic Acids Res. 2010, 38, D497–D501. [Google Scholar] [CrossRef] [Green Version]
- Kikugawa, S.; Nishikata, K.; Murakami, K.; Sato, Y.; Suzuki, M.; Altaf-Ul-Amin, M.; Kanaya, S.; Imanishi, T. PCDq: Human protein complex database with quality index which summarizes different levels of evidences of protein complexes predicted from H-Invitational protein-protein interactions integrative dataset. BMC Syst. Biol. 2012, 6, S7. [Google Scholar] [CrossRef] [Green Version]
- The Gene Ontology Consortium. The Gene Ontology Resource: 20 years and still GOing strong. Nucleic Acids Res. 2019, 47, D330–D338. [Google Scholar] [CrossRef] [Green Version]
- Klopfenstein, D.; Zhang, L.; Pedersen, B.S.; Ramírez, F.; Vesztrocy, A.W.; Naldi, A.; Mungall, C.J.; Yunes, J.M.; Botvinnik, O.; Weigel, M.; et al. GOATOOLS: A Python library for Gene Ontology analyses. Sci. Rep. 2018, 8, 10872. [Google Scholar] [CrossRef]
- Liu, G.; Wang, H.; Chu, H.; Yu, J.; Zhou, X. Functional diversity of topological modules in human protein-protein interaction networks. Sci. Rep. 2017, 7, 16199. [Google Scholar] [CrossRef] [Green Version]
- Rossetti, G.; Milli, L.; Cazabet, R. CDLIB: A python library to extract, compare and evaluate communities from complex networks. Appl. Netw. Sci. 2019, 4, 52. [Google Scholar] [CrossRef] [Green Version]
- Hagberg, A.A.; Schult, D.A.; Swart, P.J. Exploring Network Structure, Dynamics, and Function using NetworkX. In Proceedings of the 7th Python in Science Conference, Pasadena, CA, USA, 19–24 August 2008; pp. 11–15. [Google Scholar]
- Cavieres, V.A.; Cerda-Troncoso, C.; Rivera-Dictter, A.; Castro, R.I.; Luchsinger, C.; Santibañez, N.; Burgos, P.V.; Mardones, G.A. Human Golgi phosphoprotein 3 is an effector of RAB1A and RAB1B. PLoS ONE 2020, 15, e0237514. [Google Scholar] [CrossRef]
- Mizuno-Yamasaki, E.; Rivera-Molina, F.; Novick, P. GTPase networks in membrane traffic. Annu. Rev. Biochem. 2012, 81, 637–659. [Google Scholar] [CrossRef] [PubMed] [Green Version]
- Hunter, M.P.; Russo, A.; O’Bryan, J.P. Emerging roles for intersectin (ITSN) in regulating signaling and disease pathways. Int. J. Mol. Sci. 2013, 14, 7829–7852. [Google Scholar] [CrossRef] [Green Version]
- Herrero-Garcia, E.; O’Bryan, J.P. Intersectin scaffold proteins and their role in cell signaling and endocytosis. Biochim. Biophys. Acta (BBA)-Mol. Cell Res. 2017, 1864, 23–30. [Google Scholar] [CrossRef]
- Boczek, N.J.; Gomez-Hurtado, N.; Ye, D.; Calvert, M.L.; Tester, D.J.; Kryshtal, D.O.; Hwang, H.S.; Johnson, C.N.; Chazin, W.J.; Loporcaro, C.G.; et al. Spectrum and Prevalence of CALM1-, CALM2-, and CALM3-Encoded Calmodulin Variants in Long QT Syndrome and Functional Characterization of a Novel Long QT Syndrome–Associated Calmodulin Missense Variant, E141G. Circ. Cardiovasc. Genet. 2016, 9, 136–146. [Google Scholar] [CrossRef] [Green Version]
- Chin, D.; Means, A.R. Calmodulin: A prototypical calcium sensor. Trends Cell Biol. 2000, 10, 322–328. [Google Scholar] [CrossRef]
- Yang, L.; Wang, R.; Yang, S.; Ma, Z.; Lin, S.; Nan, Y.; Li, Q.; Tang, Q.; Zhang, Y.J. Karyopherin alpha 6 is required for replication of porcine reproductive and respiratory syndrome virus and zika virus. J. Virol. 2018, 92, e00072-18. [Google Scholar] [CrossRef] [Green Version]
- Richter, R.; Rorbach, J.; Pajak, A.; Smith, P.M.; Wessels, H.J.; Huynen, M.A.; Smeitink, J.A.; Lightowlers, R.N.; Chrzanowska-Lightowlers, Z.M. A functional peptidyl-tRNA hydrolase, ICT1, has been recruited into the human mitochondrial ribosome. EMBO J. 2010, 29, 1116–1125. [Google Scholar] [CrossRef] [PubMed] [Green Version]
- Hansen, L.L.; Jørgensen, R.; Justesen, J. Assignment of the Human Mitochondrial Translational Release Factor 1 (MTRF1) to Chromosome 13q14. 1–> q14. 3 and of the Human Mitochondrial Ribosome Recycling Factor (MRRF) to Chromosome 9q32–> q34. 1 With Radiation Hybrid Mapping. Cytogenet. Cell Genet. 2000, 88, 91–92. [Google Scholar] [CrossRef]
- Rudler, D.L.; Hughes, L.A.; Perks, K.L.; Richman, T.R.; Kuznetsova, I.; Ermer, J.A.; Abudulai, L.N.; Shearwood, A.M.J.; Viola, H.M.; Hool, L.C.; et al. Fidelity of translation initiation is required for coordinated respiratory complex assembly. Sci. Adv. 2019, 5, eaay2118. [Google Scholar] [CrossRef] [Green Version]
- Desai, N.; Yang, H.; Chandrasekaran, V.; Kazi, R.; Minczuk, M.; Ramakrishnan, V. Elongational stalling activates mitoribosome-associated quality control. Science 2020, 370, 1105–1110. [Google Scholar] [CrossRef] [PubMed]
- Maiti, P.; Antonicka, H.; Gingras, A.C.; Shoubridge, E.A.; Barrientos, A. Human GTPBP5 (MTG2) fuels mitoribosome large subunit maturation by facilitating 16S rRNA methylation. Nucleic Acids Res. 2020, 48, 7924–7943. [Google Scholar] [CrossRef]
- Renyi, E. On random graph. Publ. Math. 1959, 6, 290–297. [Google Scholar]
- Knuth, D.E. Art of Computer Programming, Volume 2: Seminumerical Algorithms; Addison-Wesley Professional: Boston, MA, USA, 2014. [Google Scholar]
- Sorkin, A.; Von Zastrow, M. Endocytosis and signalling: Intertwining molecular networks. Nat. Rev. Mol. Cell Biol. 2009, 10, 609–622. [Google Scholar] [CrossRef] [Green Version]
- Afiqah-Aleng, N.; Altaf-Ul-Amin, M.; Kanaya, S.; Mohamed-Hussein, Z.A. Graph cluster approach in identifying novel proteins and significant pathways involved in polycystic ovary syndrome. Reprod. Biomed. Online 2020, 40, 319–330. [Google Scholar] [CrossRef]
- Eguchi, R.; Karim, M.B.; Hu, P.; Sato, T.; Ono, N.; Kanaya, S.; Altaf-Ul-Amin, M. An integrative network-based approach to identify novel disease genes and pathways: A case study in the context of inflammatory bowel disease. BMC Bioinform. 2018, 19, 1–12. [Google Scholar] [CrossRef]
- Schaefer, M.H.; Serrano, L.; Andrade-Navarro, M.A. Correcting for the study bias associated with protein–protein interaction measurements reveals differences between protein degree distributions from different cancer types. Front. Genet. 2015, 6, 260. [Google Scholar] [CrossRef] [Green Version]
- Luck, K.; Kim, D.K.; Lambourne, L.; Spirohn, K.; Begg, B.E.; Bian, W.; Brignall, R.; Cafarelli, T.; Campos-Laborie, F.J.; Charloteaux, B.; et al. A reference map of the human binary protein interactome. Nature 2020, 580, 402–408. [Google Scholar] [CrossRef] [PubMed]


| PPI Network | Algorithm | Weight | Number of Clusters | Average Cluster Size |
|---|---|---|---|---|
| STRING | GE | Unweighted | 995 | 19.9 |
| Probabilistic | 982 | 20.5 | ||
| Topological | 444 | 29.9 | ||
| MCODE | Unweighted | 298 | 71.2 | |
| Probabilistic | 85 | 172.7 | ||
| Topological | 296 | 65.2 | ||
| InfoMap | Unweighted | 217 | 44.0 | |
| Probabilistic | 219 | 43.6 | ||
| Topological | 90 | 79.3 | ||
| MCL | Unweighted | 1061 | 8.9 | |
| Probabilistic | 781 | 11.2 | ||
| Topological | 478 | 9.2 | ||
| BioPlex | GE | Unweighted | 126 | 4.2 |
| Topological | 1188 | 7.8 | ||
| MCODE | Unweighted | 113 | 237.8 | |
| Topological | 237 | 70.5 | ||
| CFinder | Unweighted | 823 | 13.1 | |
| Topological | 145 | 10.4 | ||
| InfoMap | Unweighted | 514 | 27.2 | |
| Topological | 79 | 109.5 | ||
| MCL | Unweighted | 3087 | 3.2 | |
| Topological | 154 | 7.0 |
| PPI Network | Algorithm | Weight | Score with Protein Complexes | Score with GO Annotations |
|---|---|---|---|---|
| STRING | GE | Unweighted | 0.567 | 0.554 |
| Probabilistic | 0.572 | 0.552 | ||
| Topological | 0.521 | 0.517 | ||
| MCODE | Unweighted | 0.465 | 0.487 | |
| Probabilistic | 0.297 | 0.397 | ||
| Topological | 0.483 | 0.494 | ||
| InfoMap | Unweighted | 0.597 | 0.587 | |
| Probabilistic | 0.570 | 0.584 | ||
| Topological | 0.593 | 0.600 | ||
| MCL | Unweighted | 0.547 | 0.495 | |
| Probabilistic | 0.538 | 0.494 | ||
| Topological | 0.592 | 0.533 | ||
| BioPlex | GE | Unweighted | 0.506 | 0.435 |
| Topological | 0.536 | 0.389 | ||
| MCODE | Unweighted | 0.316 | 0.254 | |
| Topological | 0.396 | 0.318 | ||
| CFinder | Unweighted | 0.483 | 0.377 | |
| Topological | 0.661 | 0.433 | ||
| InfoMap | Unweighted | 0.440 | 0.296 | |
| Topological | 0.372 | 0.388 | ||
| MCL | Unweighted | 0.534 | 0.378 | |
| Topological | 0.643 | 0.456 |
| PPI Network | Algorithm | Weight | Score with Protein Complexes | Score with GO Annotations | Proportion of Functionally Homogeneous Modules (%) |
|---|---|---|---|---|---|
| STRING | GE | Unweighted | 0.542 | 0.902 | 98.2 |
| Probabilistic | 0.543 | 0.902 | 98.2 | ||
| Topological | 0.482 | 0.881 | 97.5 | ||
| MCODE | Unweighted | 0.432 | 0.856 | 94.3 | |
| Probabilistic | 0.238 | 0.806 | 94.1 | ||
| Topological | 0.451 | 0.875 | 95.6 | ||
| InfoMap | Unweighted | 0.692 | 0.932 | 93.6 | |
| Probabilistic | 0.660 | 0.929 | 93.7 | ||
| Topological | 0.580 | 0.892 | 95.6 | ||
| MCL | Unweighted | 0.583 | 0.895 | 92.5 | |
| Probabilistic | 0.578 | 0.903 | 96.4 | ||
| Topological | 0.619 | 0.943 | 97.7 | ||
| BioPlex | GE | Unweighted | 0.775 | 0.911 | 93.2 |
| Topological | 0.577 | 0.791 | 82.3 | ||
| MCODE | Unweighted | 0.296 | 0.690 | 79.6 | |
| Topological | 0.377 | 0.769 | 81.0 | ||
| CFinder | Unweighted | 0.538 | 0.745 | 74.5 | |
| Topological | 0.714 | 0.930 | 97.9 | ||
| InfoMap | Unweighted | 0.413 | 0.658 | 64.1 | |
| Topological | 0.356 | 0.795 | 86.1 | ||
| MCL | Unweighted | 0.657 | 0.754 | 64.0 | |
| Topological | 0.787 | 0.947 | 95.8 |
| PPI Network | Algorithm | Weight | Number of Clusters | Number of Overlapping Clusters | Proportion (%) |
|---|---|---|---|---|---|
| STRING | GE | unweighted | 995 | 778 | 78.1 |
| probabilistic | 982 | 756 | 76.9 | ||
| topological | 444 | 277 | 62.3 | ||
| MCODE | unweighted | 298 | 250 | 83.8 | |
| probabilistic | 85 | 80 | 94.1 | ||
| topological | 296 | 230 | 77.7 | ||
| BioPlex | GE | unweighted | 126 | 55 | 43.6 |
| topological | 1188 | 854 | 71.8 | ||
| MCODE | unweighted | 113 | 112 | 99.1 | |
| topological | 237 | 192 | 81.0 | ||
| CFinder | unweighted | 823 | 783 | 95.1 | |
| topological | 145 | 41 | 28.2 |
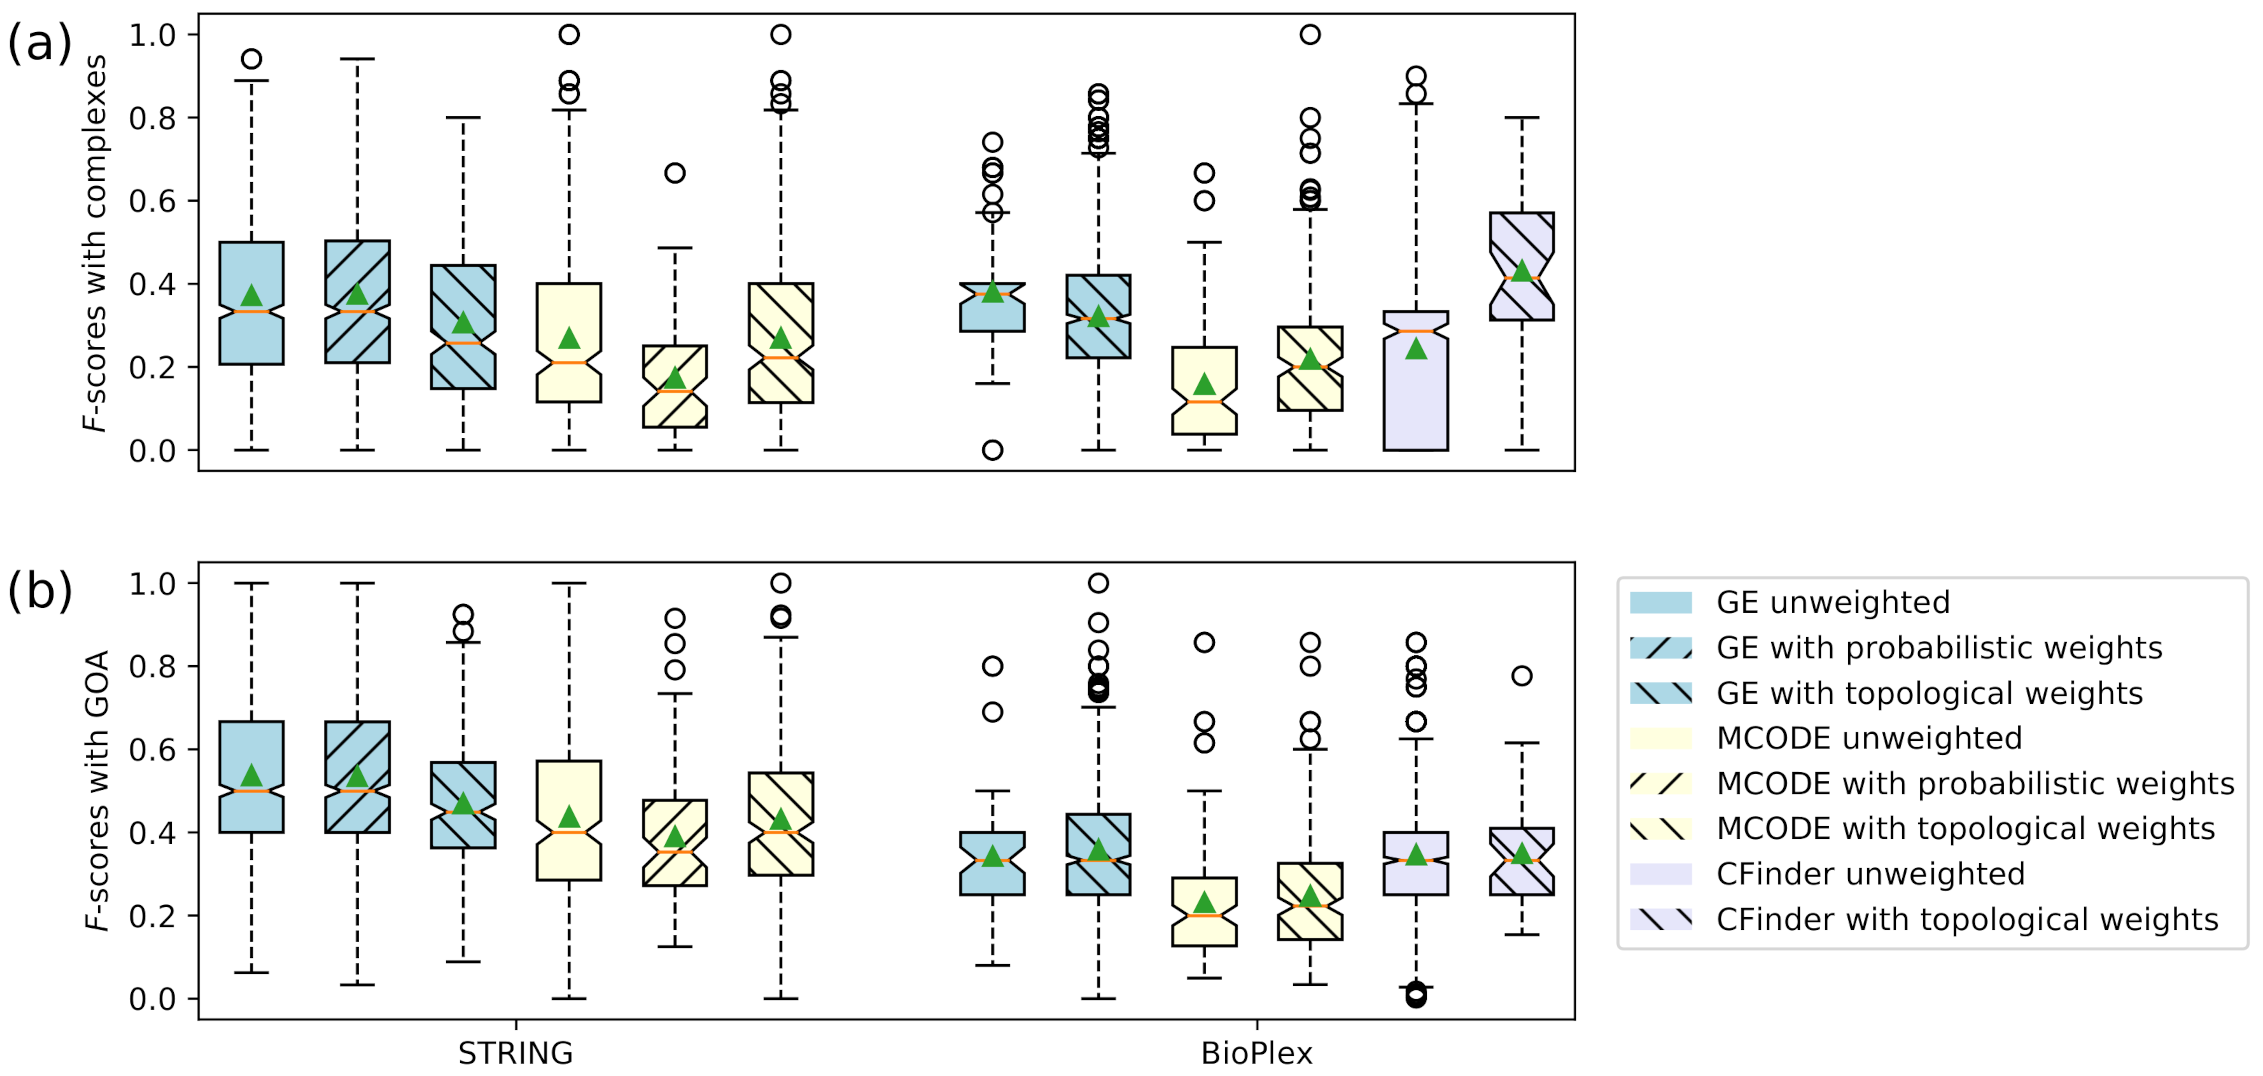
| Graph Clustering Algorithm | Score with Protein Complexes | Score with GO Annotations |
|---|---|---|
| STRING GE unweighted | 0.371 | 0.537 |
| STRING GE with probabilistic weights | 0.375 | 0.535 |
| STRING GE with topological weights | 0.307 | 0.470 |
| STRING MCODE unweighted | 0.269 | 0.438 |
| STRING MCODE with probabilistic weights | 0.174 | 0.390 |
| STRING MCODE with topological weights | 0.270 | 0.432 |
| BioPlex GE unweighted | 0.381 | 0.342 |
| BioPlex GE with topological weights | 0.321 | 0.359 |
| BioPlex MCODE unweighted | 0.159 | 0.231 |
| BioPlex MCODE with topological weights | 0.219 | 0.248 |
| BioPlex CFinder unweighted | 0.244 | 0.347 |
| BioPlex CFinder with topological weights | 0.432 | 0.349 |
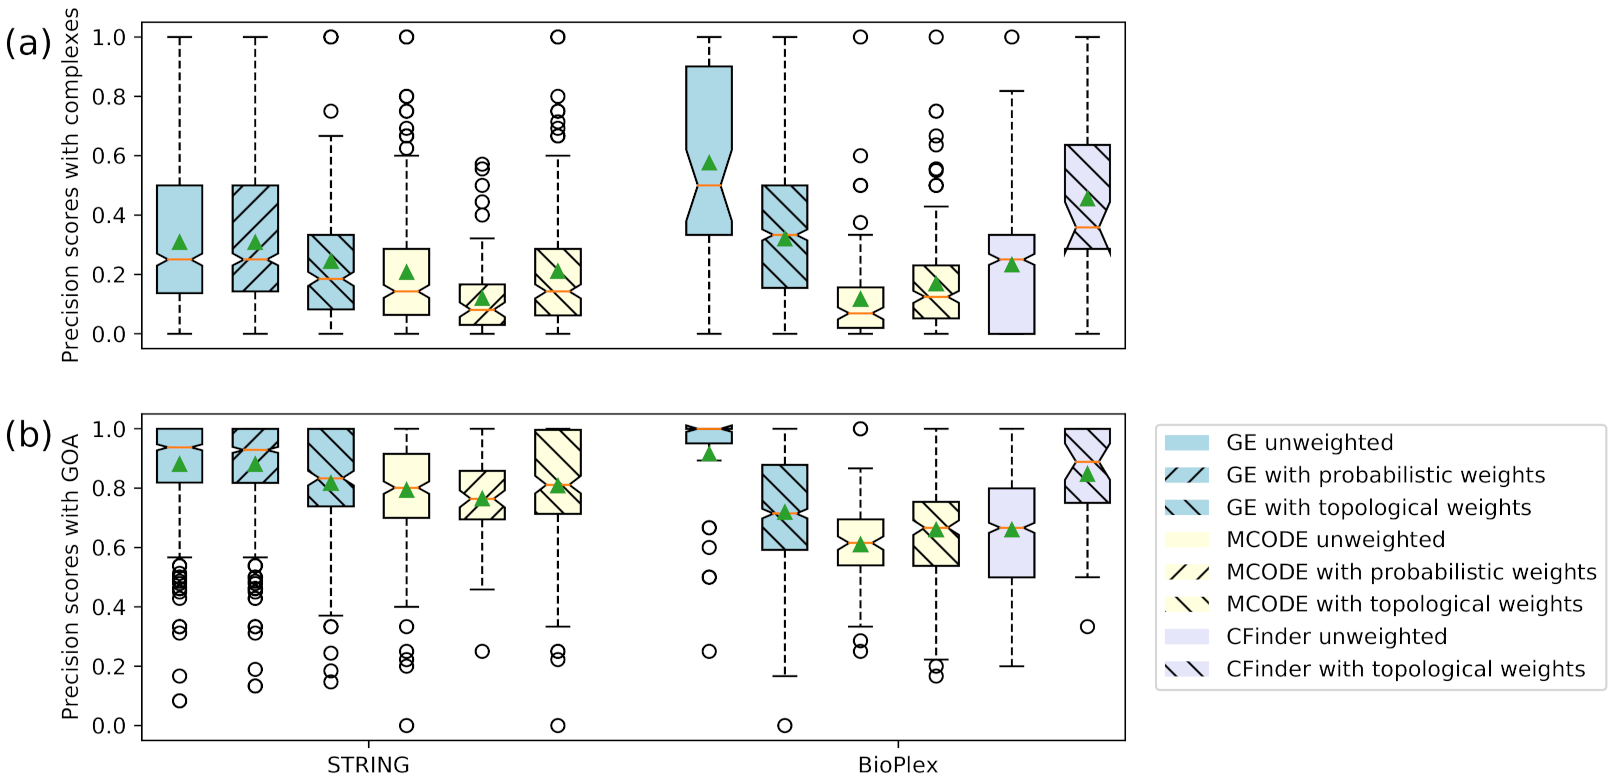
| Graph Clustering Algorithm | Score with Protein Complexes | Score with GO Annotations |
|---|---|---|
| STRING GE unweighted | 0.308 | 0.880 |
| STRING GE with probabilistic weights | 0.308 | 0.880 |
| STRING GE with topological weights | 0.244 | 0.817 |
| STRING MCODE unweighted | 0.207 | 0.793 |
| STRING MCODE with probabilistic weights | 0.119 | 0.764 |
| STRING MCODE with topological weights | 0.211 | 0.807 |
| BioPlex GE unweighted | 0.575 | 0.915 |
| BioPlex GE with topological weights | 0.319 | 0.718 |
| BioPlex MCODE unweighted | 0.117 | 0.610 |
| BioPlex MCODE with topological weights | 0.168 | 0.659 |
| BioPlex CFinder unweighted | 0.232 | 0.659 |
| BioPlex CFinder with topological weights | 0.455 | 0.847 |
| Overlapping Proteins | Frequency of Appearance | Reported Function | ||
|---|---|---|---|---|
| STRING GE Unweighted | STRING GE with Probabilistic Weights | STRING GE with Topological Weights | ||
| RAB1A | 60 | 60 | 10 | Rab1 proteins regulate vesicular transport [27]. Rab GTPases regulate membrane traffic and are involved in many cell types [28]. |
| RAB1B | 60 | 60 | 10 | |
| ITSN1 | 55 | 54 | 10 | Intersectins (ITSNs) regulate endocytosis and cell signaling [29]. ITSNs may regulate the interactions of various functions [30]. |
| ITSN2 | 55 | 54 | 10 | |
| CALM1 | 53 | 51 | 15 | Calmodulin (CaM) is an essential protein for calcium ion sensing and signal transduction [31]. CaM enhances the interaction affinity of many proteins [32]. |
| CALM2 | 53 | 51 | 15 | |
| CALM3 | 53 | 51 | 15 | |
| GO Term | GO Name | GO Annotated Proteins | Novel Proteins | Algorithm | F-Score |
|---|---|---|---|---|---|
| GO:0019054 | modulation by virus of host cellular process | KPNA1, KPNA2, KPNA3, KPNA4, KPNA5, KPNA7, KPNB1 | KPNA6 | GE unweighted | 0.933 |
| KPNA6 | GE with probabilistic weights | 0.933 | |||
| GO:0070125 | mitochondrial translational elongation | AURKAIP1, CHCHD1, DAP3, ERAL1, GADD45GIP1, GFM1, GFM2, MRPL1, MRPL10, MRPL11, MRPL12, MRPL13, MRPL14, MRPL15, MRPL16, MRPL17, MRPL18, MRPL19, MRPL2, MRPL20, MRPL21, MRPL22, MRPL23, MRPL24, MRPL27, MRPL28, MRPL3, MRPL30, MRPL32, MRPL33, MRPL34, MRPL35, MRPL36, MRPL37, MRPL38, MRPL39, MRPL4, MRPL40, MRPL41, MRPL42, MRPL43, MRPL44, MRPL45, MRPL46, MRPL47, MRPL48, MRPL49, MRPL50, MRPL51, MRPL52, MRPL53, MRPL54, MRPL55, MRPL57, MRPL58, MRPL9, MRPS10, MRPS11, MRPS12, MRPS14, MRPS15, MRPS16, MRPS17, MRPS18A, MRPS18B, MRPS18C, MRPS2, MRPS21, MRPS22, MRPS23, MRPS24, MRPS25, MRPS26, MRPS27, MRPS28, MRPS30, MRPS31, MRPS33, MRPS34, MRPS35, MRPS36, MRPS5, MRPS6, MRPS7, MRPS9, OXA1L, PTCD3, TSFM, TUFM | AC004556.3, AC139530.2, C12ORF65, HDDC3, HIBCH, ICT1, MRRF, MTG2, MTIF2, MTIF3, MTRF1L, RPL23L, RPMS17 | GE unweighted | 0.914 |
| AC004556.3, AC139530.2, C12ORF65, HDDC3, HIBCH, ICT1, MRRF, MTG2, MTIF2, MTIF3, MTRF1L, RPL23L, RPMS17 | GE with probabilistic weights | 0.920 | |||
| AC004556.3, AC139530.2, GUF1, HDDC3, HIBCH, ICT1, MRRF, MTIF2, MTIF3, MTRF1L, PDF, RPL23L, RPMS17, SOD2 | GE with topological weights | 0.910 |
Publisher’s Note: MDPI stays neutral with regard to jurisdictional claims in published maps and institutional affiliations. |
© 2021 by the authors. Licensee MDPI, Basel, Switzerland. This article is an open access article distributed under the terms and conditions of the Creative Commons Attribution (CC BY) license (https://creativecommons.org/licenses/by/4.0/).
Share and Cite
Jeong, H.; Kim, Y.; Jung, Y.-S.; Kang, D.R.; Cho, Y.-R. Entropy-Based Graph Clustering of PPI Networks for Predicting Overlapping Functional Modules of Proteins. Entropy 2021, 23, 1271. https://doi.org/10.3390/e23101271
Jeong H, Kim Y, Jung Y-S, Kang DR, Cho Y-R. Entropy-Based Graph Clustering of PPI Networks for Predicting Overlapping Functional Modules of Proteins. Entropy. 2021; 23(10):1271. https://doi.org/10.3390/e23101271
Chicago/Turabian StyleJeong, Hoyeon, Yoonbee Kim, Yi-Sue Jung, Dae Ryong Kang, and Young-Rae Cho. 2021. "Entropy-Based Graph Clustering of PPI Networks for Predicting Overlapping Functional Modules of Proteins" Entropy 23, no. 10: 1271. https://doi.org/10.3390/e23101271