Spatial Variation of b-Values and Their Relationship with the Fault Blocks in the Western Part of the Tibetan Plateau and Its Surrounding Areas


Abstract
:1. Introduction
2. Background of the b-Value
3. Previous Studies of b-Value in Tibet
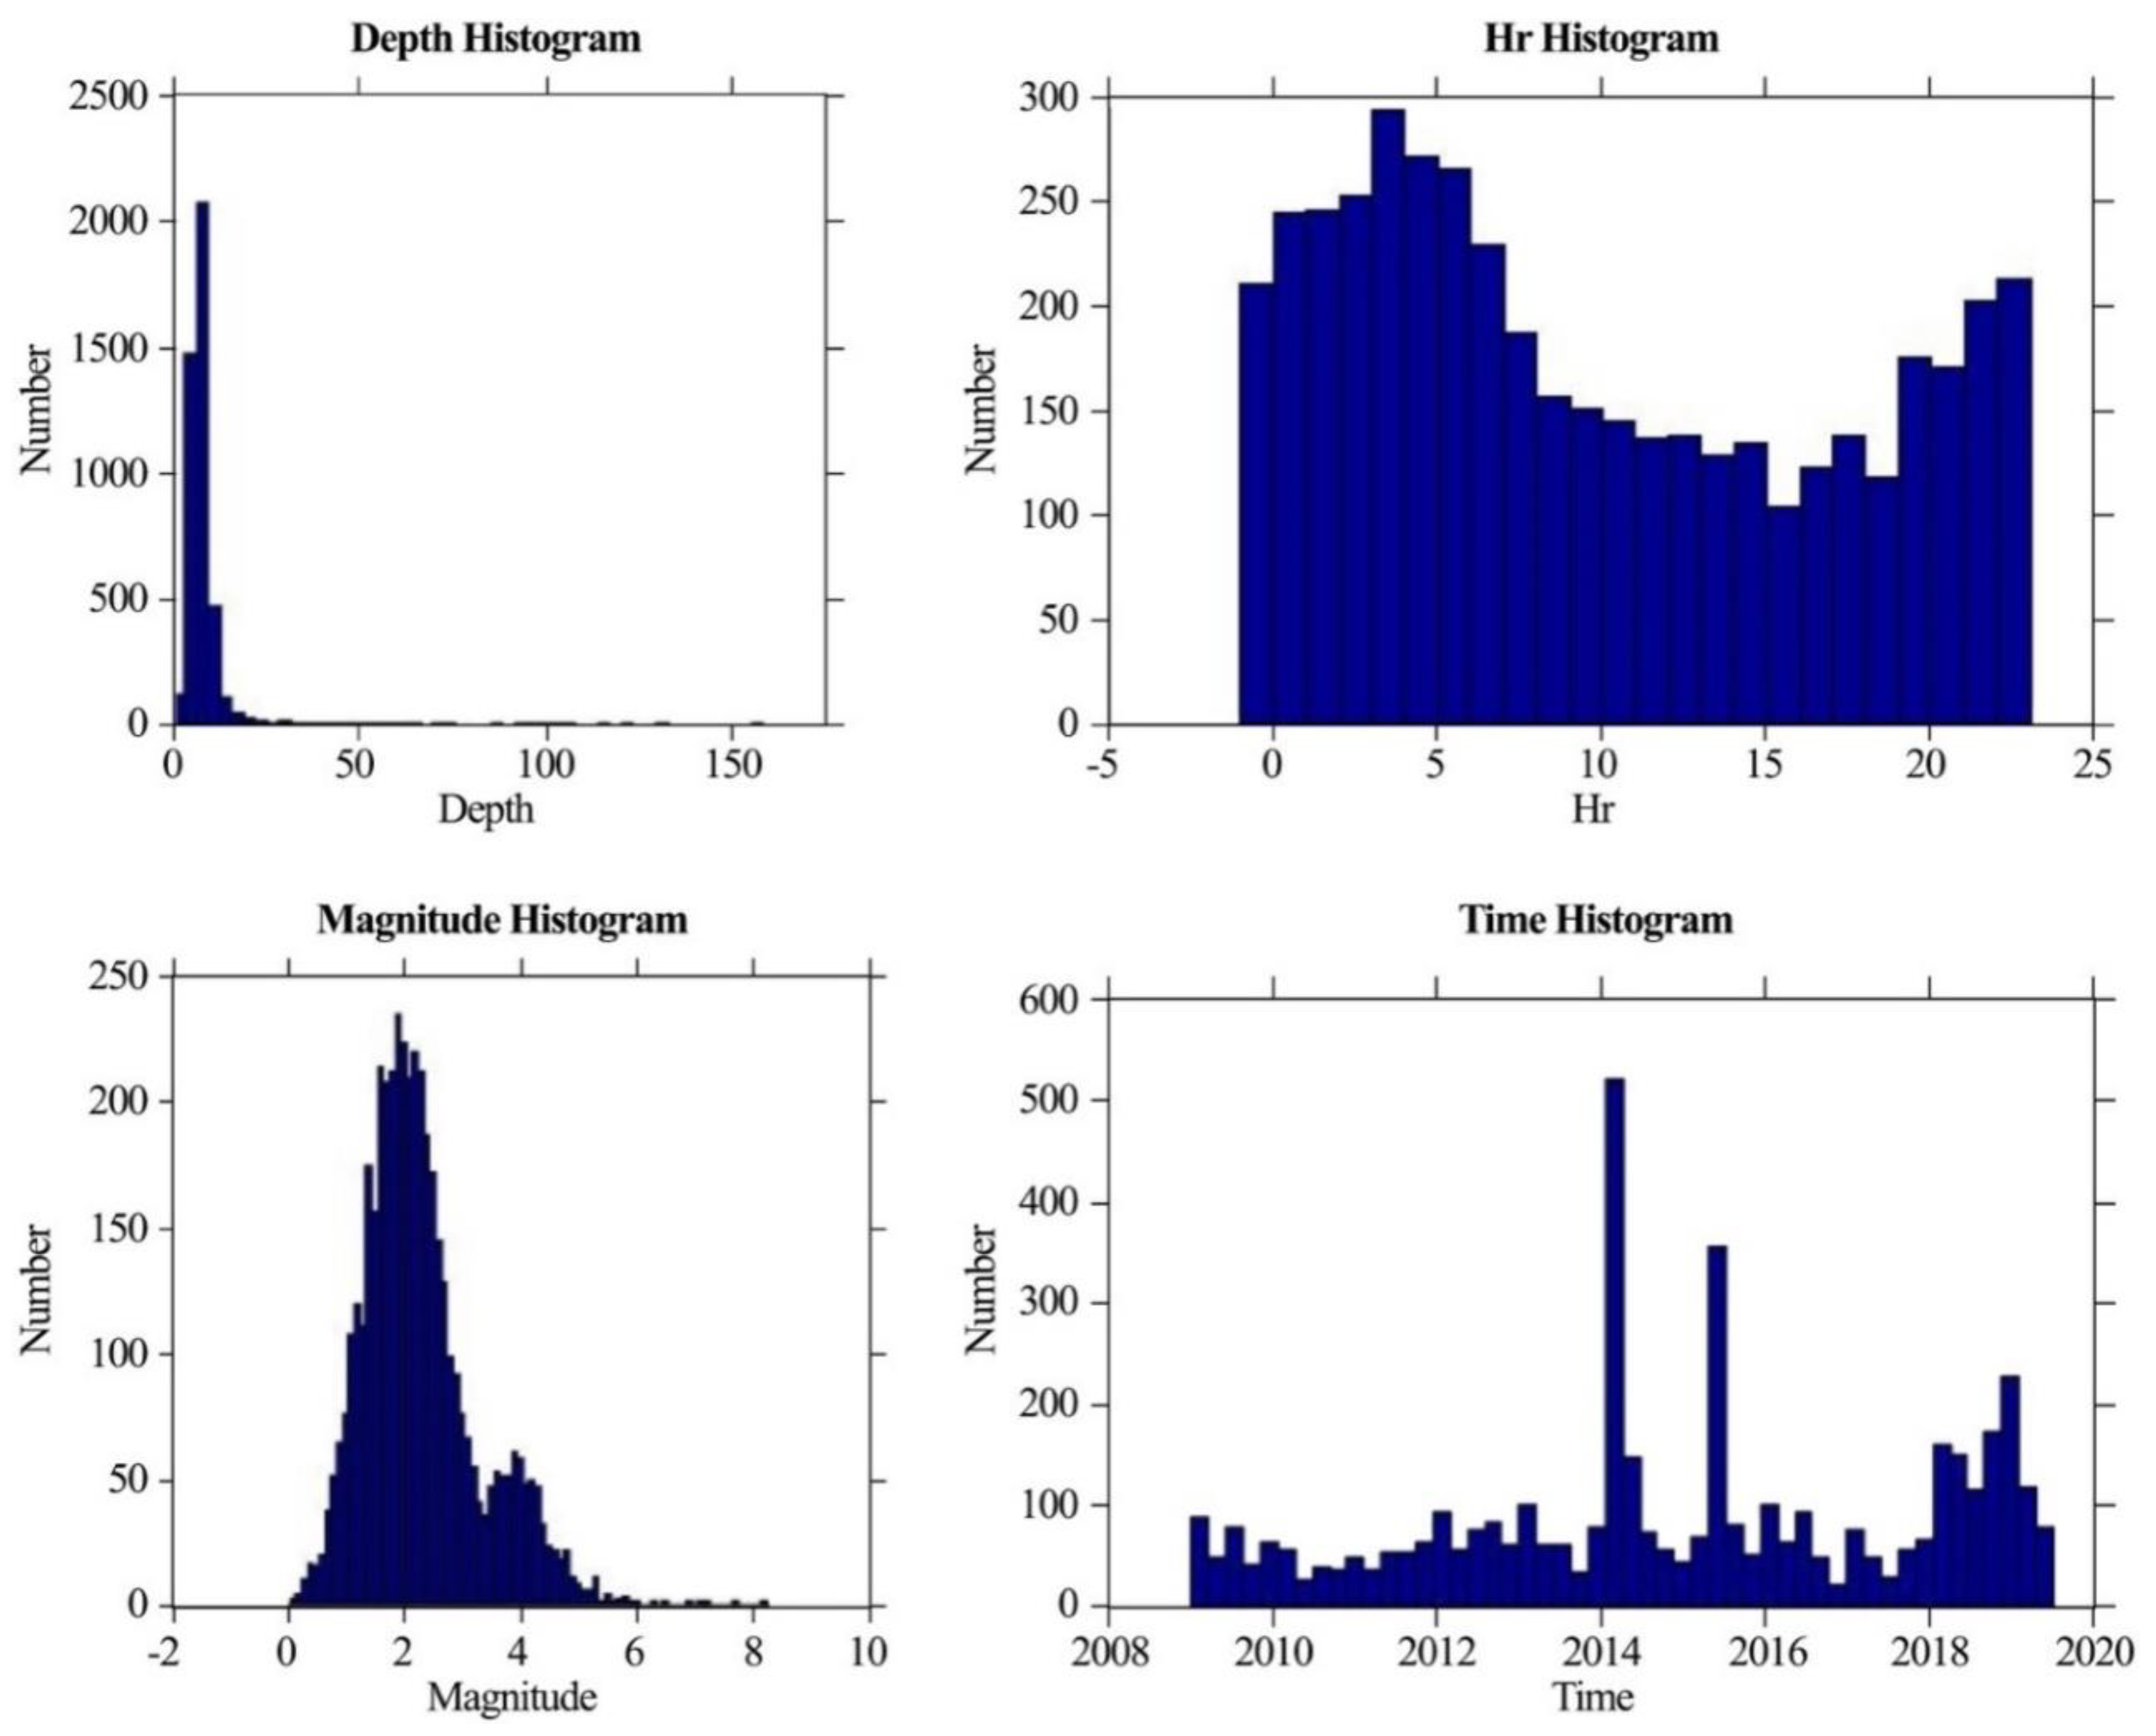
4. Earthquake Data
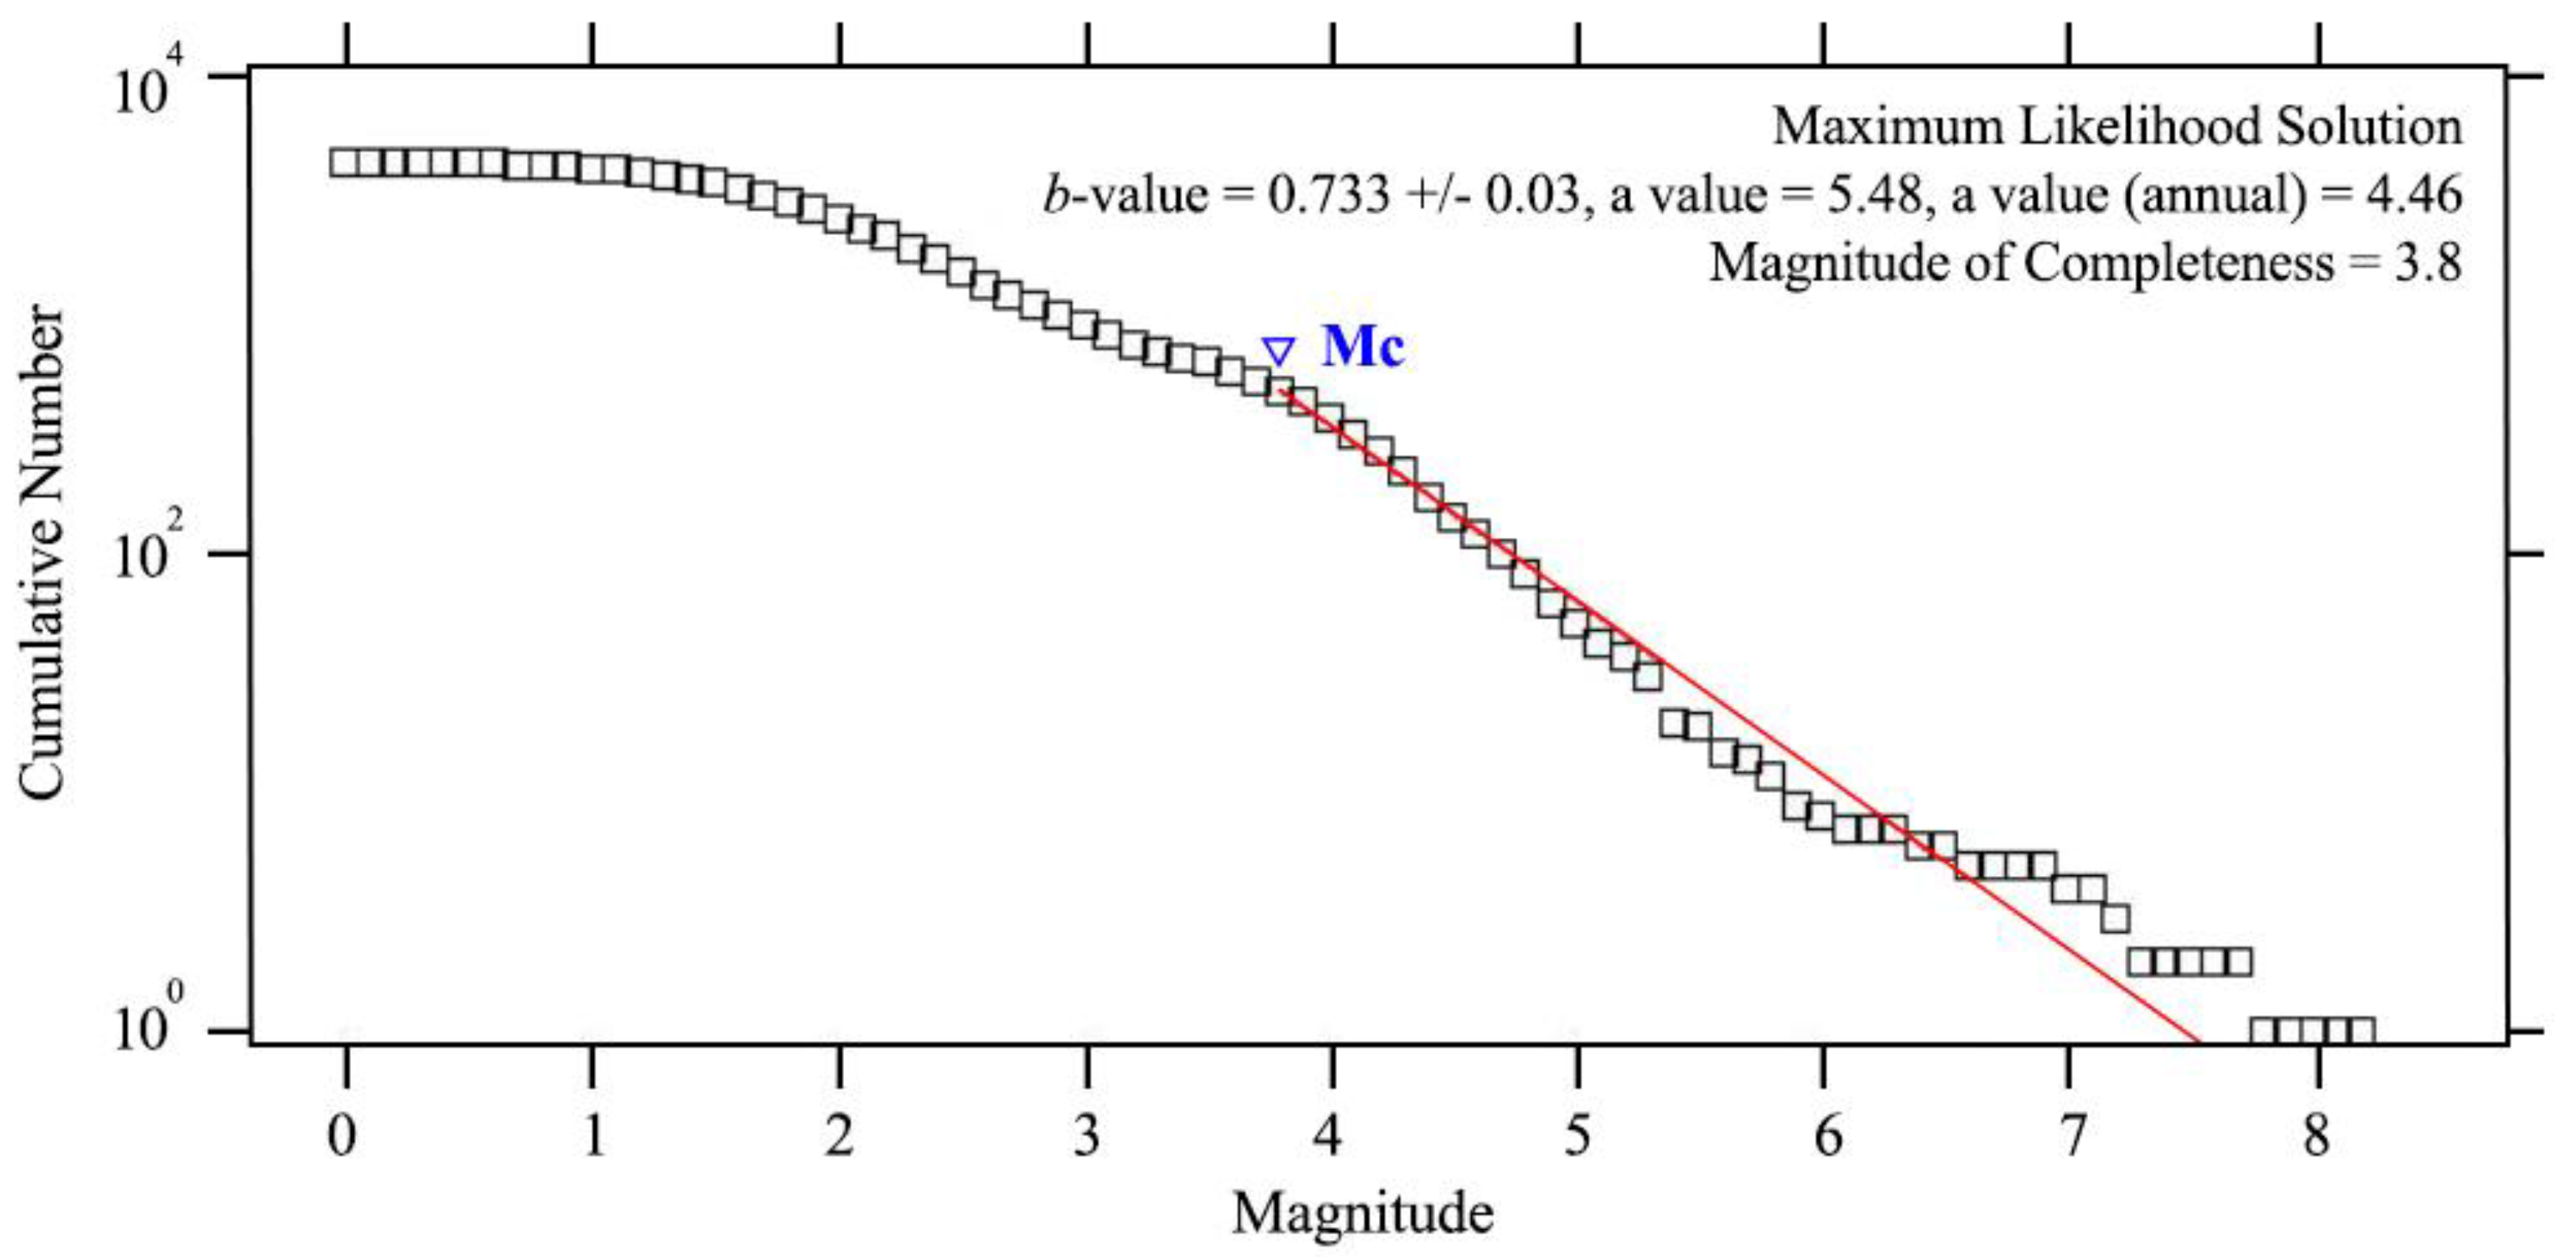
5. Analysis Method
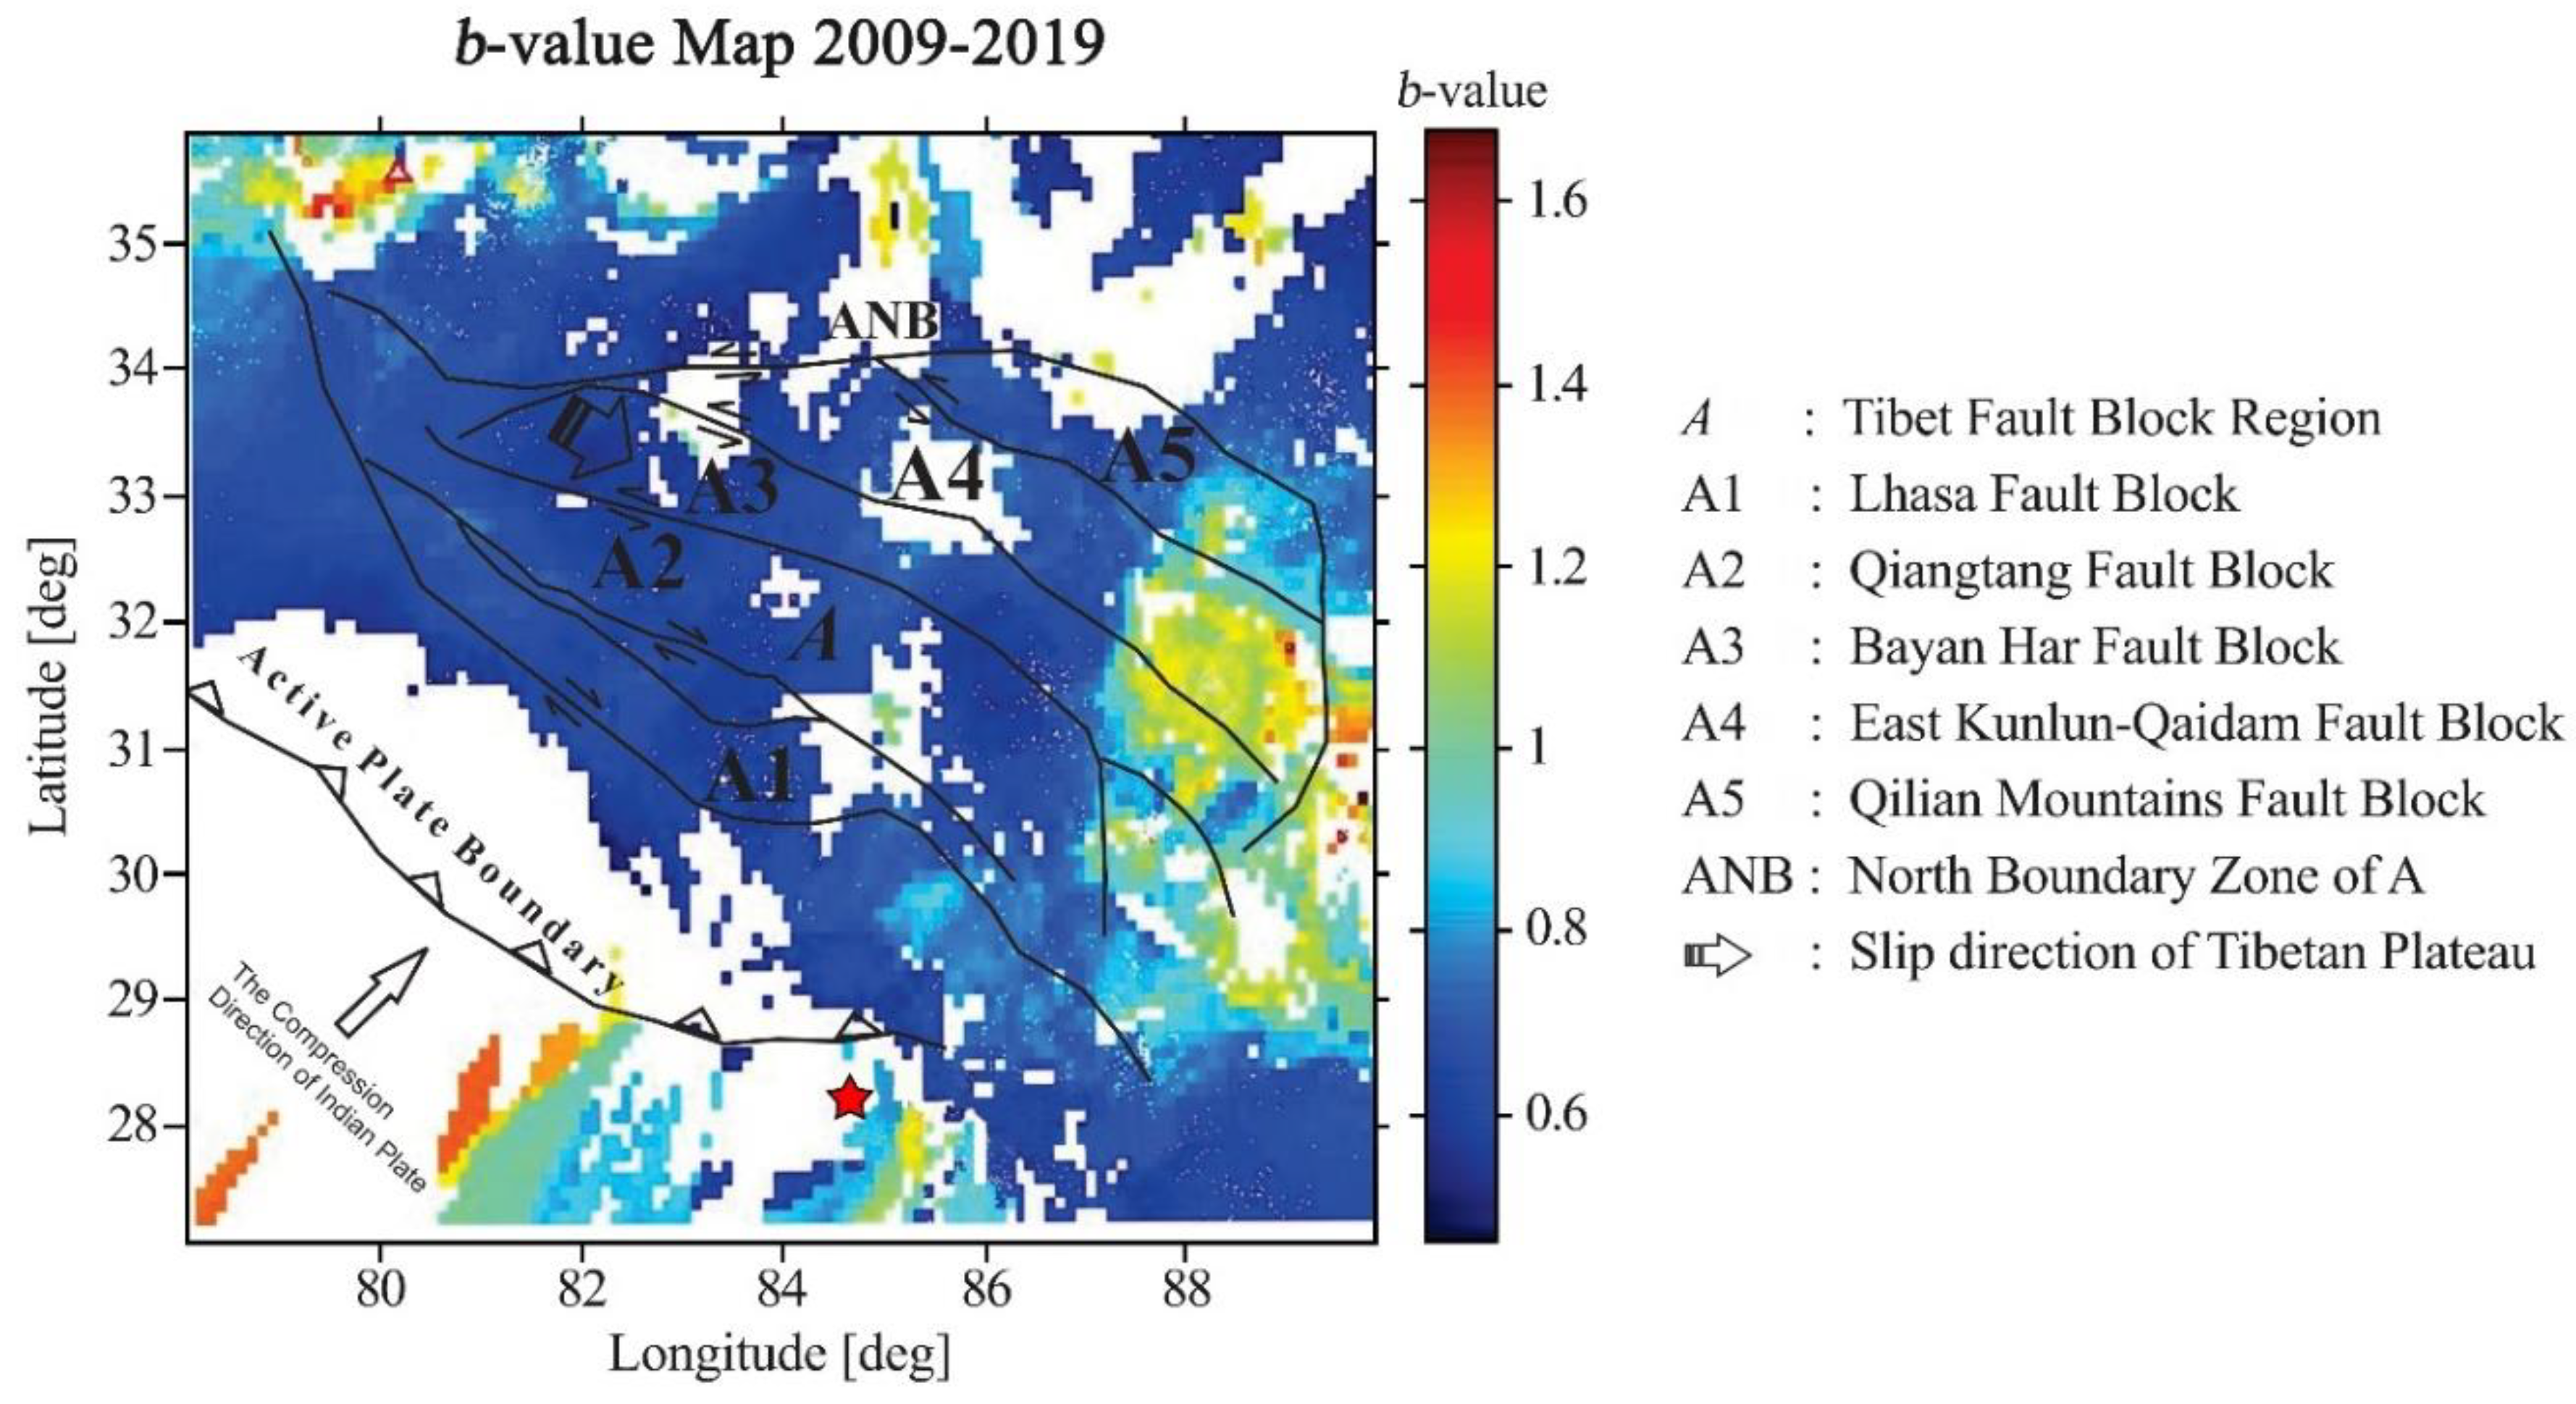
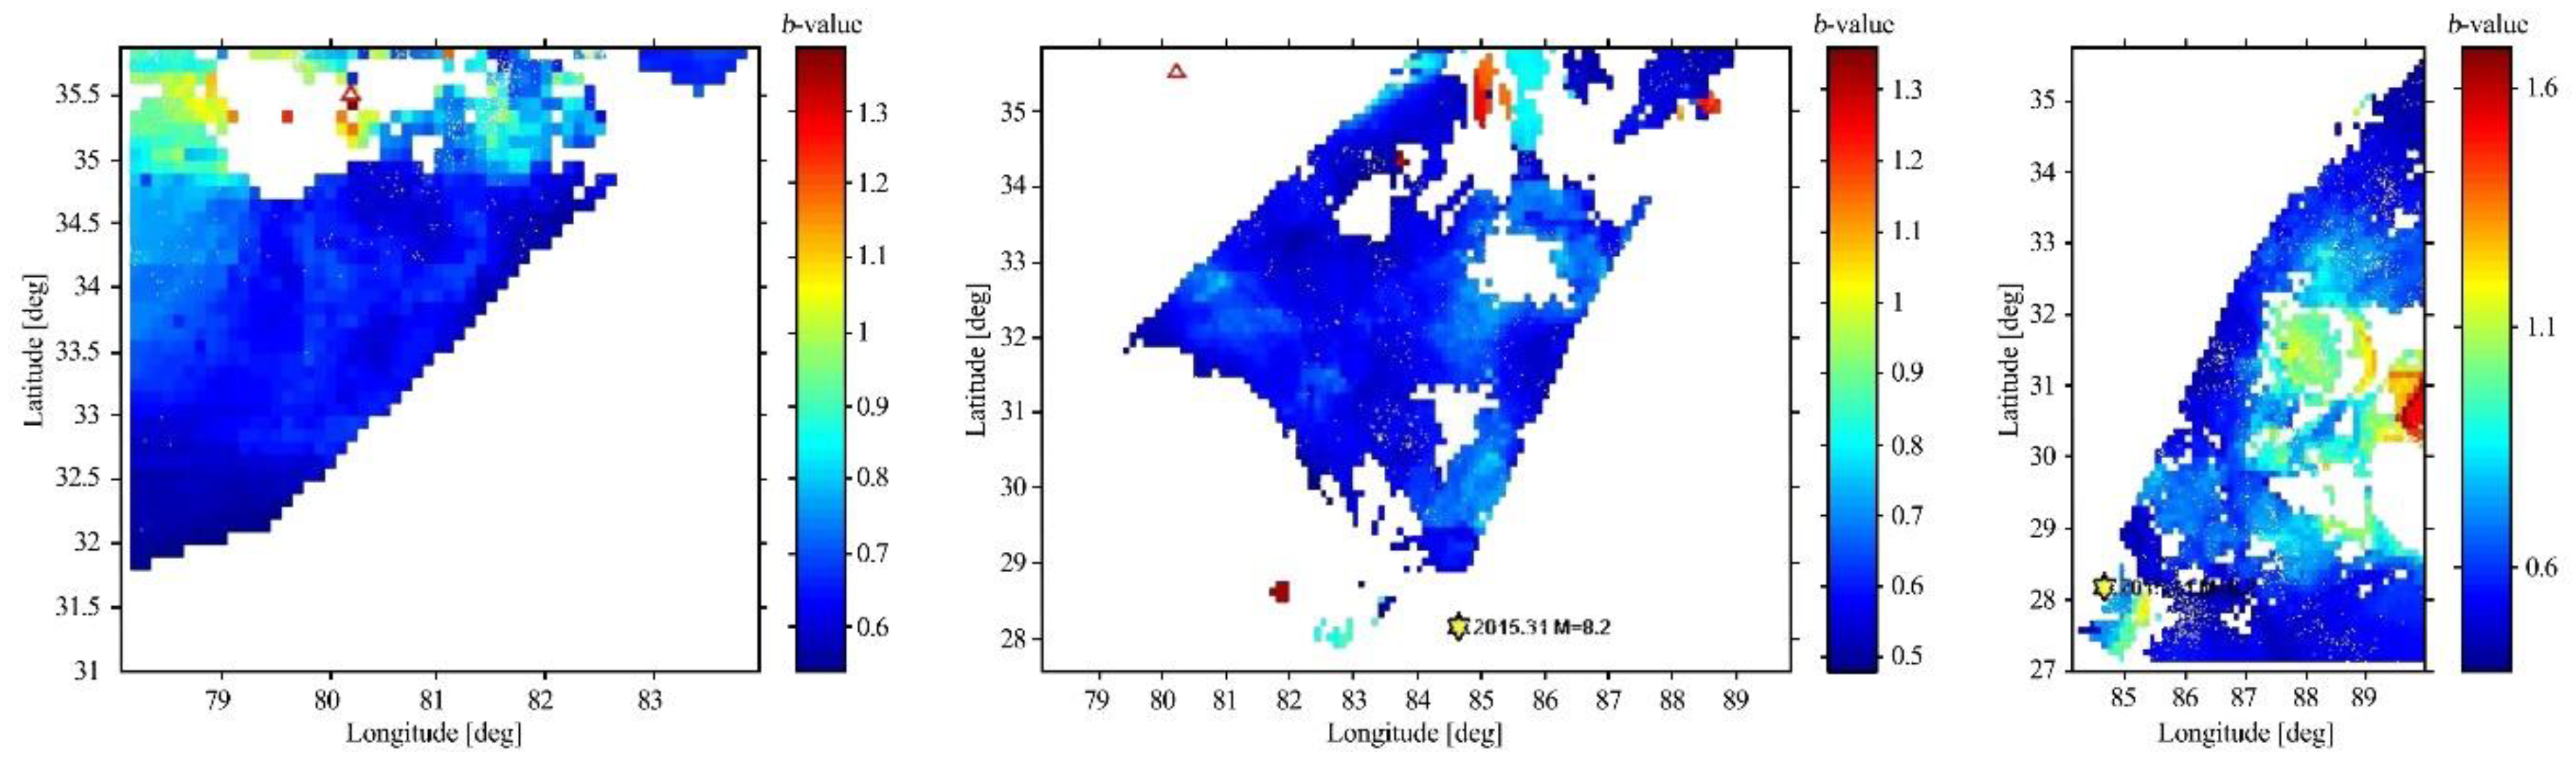
6. Results
7. Discussion
8. Conclusions
Author Contributions
Funding
Acknowledgments
Conflicts of Interest
References
- Du, J.; Li, D.; Wang, Y.; Ma, Y. Late quaternary activity of the Huashan piedmont fault and associated hazard in the southeastern WeiheGraben, Central China. Acta Geol. Sin. 2017, 91, 76–92. [Google Scholar] [CrossRef]
- Housner, W.G.; Duxin, H. The Great Tangshan earthquake of 1976. In Earthquake Engineering Research Laboratory; English Translation of the Chinese Report of 1986; California Institute of Technology: Pasadena, CA, USA, 2002. [Google Scholar]
- Zhou, R.J.; Ma, S.H.; Cai, C.X. Late quaternary active features of the Ganzi-Yushu fault zone. Earthq. Res. China 1996, 12, 250–260. (In Chinese) [Google Scholar]
- Molnar, P. The geologic evolution of the Tibetan plateau. Am. Sci. 1989, 77, 350–360. [Google Scholar]
- Bai, L.; Li, G.; Khan, N.G.; Zhao, J.; Ding, L. Focal depths and mechanisms of swallow earthquakes in the Himalayan-Tibetan region. Gondwana Res. 2015, 41, 390–399. [Google Scholar] [CrossRef]
- Yin, A.; Harrison, T.M. Geologic evolution of the Himalayan-Tibetan orogen. Annu. Rev. Earth Planet. Sci. 2000, 34, 76–89. [Google Scholar] [CrossRef] [Green Version]
- Ciren, L. Seismo-Tectonics around Lhasa, Tibet. Master’s Thesis, The University of Bergen, Bergen, Norway, 2011. [Google Scholar]
- Zhang, X.M.; Sun, R.M.; Yang, H.; Teng, J.W. Application of improved simulated annealing algorithm in the study of depth of interfaces in the crust and upper mantle. Prog. Geophys. 2008, 23, 1023–1029. (In Chinese) [Google Scholar]
- Deng, Q.D.; Cheng, S.P.; Ma, J.; Peng, D. Seismic activities and earthquake potential in the Tibetan plateau. Chin. J. Geophys. 2014, 57, 678–697. [Google Scholar] [CrossRef]
- Deng, Q.D. Kinematic features and slip rates of late quaternary active faulting of Qinghai-Xizang (Tibet) Plateau and kinematic characteristics of the plateau and secondary blocks within it. In Himalayan Geology International Symposium Abstracts; Wadia Institute of Himalayan Geology: Dehradun, Indai, 1984; pp. 70–72. (In Chinese) [Google Scholar]
- Paiboon, N. The potential of b Value Variation as Earthquake Precursors for Small and Large Events. Master’s Thesis, Uppsala University, Uppsala, Sweden, 2006. [Google Scholar]
- Mogi, K. Magnitude-frequency relation for elastic shocks accompanying fractures of various materials and some related problems in earthquakes (2nd paper). Bull. Earthq. Res. Inst. 1963, 40, 831–853. [Google Scholar]
- Mori, J.; Rachel, E.A. Depth dependence of earthquake frequency magnitude distributions in California: Implications for rupture initiation. J. Geophys. Res. Solid Earth 1997, 102, 15081–15090. [Google Scholar] [CrossRef]
- Scholz, C.H. The frequency-magnitude relation of micro fracturing in rock and its relation to earthquakes. Bull. Seism. Soc. Am. 1968, 58, 399–415. [Google Scholar]
- Smith, D.W. The b-value as an earthquake precursor. Nature 1981, 289, 136–139. [Google Scholar] [CrossRef]
- Nicholas, W.W.; Gary, V.L. An experimental study of thermally induced micro fracturing and its relation to volcanic seismicity. J. Geophys. Res. 1970, 75, 4455–4464. [Google Scholar]
- Wyss, M. Towards a physical understanding of the earthquake frequency distribution. Geophys. J. Int. 1973, 31, 341–359. [Google Scholar] [CrossRef] [Green Version]
- Jafari, M.A. The distribution of b-value in different seismic provinces of Iran. In Proceedings of the 14th World Conference on Earthquake Engineering, Beijing, China, 12–17 October 2008. [Google Scholar]
- Cliff, F.; Davis, S. Teleseismic b values; or, much ado about 1.0. J. Geophys. Res. Solid Earth 1993, 98, 631–644. [Google Scholar]
- Schorlemmer, D.; Wiemer, S.; Wyss, M. Variations in earthquake Size distribution across different stress regimes. Nature 2005, 437, 539–542. [Google Scholar] [CrossRef] [PubMed]
- Yu, D. Investigations of the b-Value and Its Variations on Possible Earthquake Prediction in the North-South China Seismic Belt. Master’s Thesis, Massachusetts Institute of Technology, Cambridge, MA, USA, 2016. [Google Scholar]
- Jiu, X.; Glacidogna, G. Spatial variation of seismic b-values distribution in China. Appl. Mech. Mater. 2011, 71–78, 4819–4822. [Google Scholar]
- Chandrani, S.; Arun, S.; Chadha, R.K. Fractal and b-value mapping in Eastern Himalaya and Southern Tibet. Bull. Seismo. Soc. Am. 2009, 99, 3529–3533. [Google Scholar]
- Ramesh, P.; Martha, R.T.; Kumar, V.K. Regional variation of stress level in the Himalayas after the 25 April 2015 Gorkha earthquake (Nepal) estimated using b-values. J. Geophys. Eng. 2018, 15, 921–927. [Google Scholar] [CrossRef] [Green Version]
- Liu, L.U.; Pei, S.P. Temporal and spatial variations of b-value before and after Wenchuan earthquake and its tectonic implication. Chin. J. Geophys. 2017, 60, 2104–2122. (In Chinese) [Google Scholar]
- Gutenberg, B.; Richter, C. Frequency of an earthquake in California. Bull. Seism. Soc. Am. 1944, 34, 185–188. [Google Scholar]
- Wu, Y.M.; Chen, S.K.; Huang, T.C.; Huang, H.H.; Chao, W.A.; Koulakov, I. Relationship between Earthquake b-values and crustal stresses in a young Orogenic belt. Geophys. Res. Lett. 2018, 45, 1832–1837. [Google Scholar] [CrossRef]
- Wyss, M.; Wiemer, S.; Zuniga, R. ZMAP A Tool for Analysis of Seismicity Patterns: Typical Applications and Uses: A Cookbook. 2001. Available online: http//:www.researchgate.net/publication/261508570_cookbook (accessed on 28 March 2020).
- Aki, K. Maximum likelihood estimate of b in a formula log n = a-bM and its confidence limits. Bull. Earthq. Res. Inst. 1965, 43, 237–239. [Google Scholar]
- Wiemer, S.; Zuniga, R. Zmap software package to analyze seismicity (abstract), EOS Transaction AGU. Fall Meet. Suppl. 1994, 75, 456. [Google Scholar]
- Xie, W.; Hattori, K.; Han, P. Temporal variation and statistical Assessment of the b Value off the Pacific Coast of Tokachi, Hokkaido, Japan. Entropy 2019, 21, 249. [Google Scholar] [CrossRef] [Green Version]
- Abu El-Nader, I.F.; Shater, M.; Hussein, H.M. Mapping b-values beneath Abu Dabbab from June to August 2004 earthquake swarm. NRIAG J. Astron. Geophys. 2016, 5, 403–412. [Google Scholar] [CrossRef]
- Park, S.C.; Mori, J. Triggering of earthquakes during the 2000 Papua New Guinea earthquake sequence. Am. Geophys. Union 2007, 112. [Google Scholar] [CrossRef]
- Varotsos, P.A.; Sarlis, N.V.; Skordas, E.S. Order parameter fluctuations in natural time and b-value variations before large earthquakes. Nat. Hazard Earth Syst. Sci. 2012, 12, 3473–3481. [Google Scholar] [CrossRef] [Green Version]
- Varotsos, P.A.; Sarlis, N.V.; Skordas, E.S. Scale specific order parameter fluctuations of seismicity in natural time before mainshocks. EPL 2011, 96, 59002. [Google Scholar] [CrossRef] [Green Version]
- Varotsos, P.A.; Skordas, E.S.; Sarlis, N.V. Fluctations of the entropy change under time reversal: Further investigations on identifying the occurrence time of an impending major earthquake. EPL 2020, 130, 29001. [Google Scholar] [CrossRef]
- Varotsos, P.A.; Sarlis, N.V.; Skordas, E.S.; Lazaridou, M.S. Identifying sudden cardiac death risk and specifying its occurrence time by analyzing electrocardiograms in natural time. App. Phys. Lett. 2007, 91, 064106. [Google Scholar] [CrossRef]


| M | 0.1 | 0.2 | 0.3 | 0.4 | 0.5 | 0.6 | 0.7 | 0.8 | 0.9 | 1.0 | 1.1 | 1.2 |
| N | 2 | 4 | 10 | 16 | 15 | 20 | 37 | 41 | 64 | 76 | 107 | 119 |
| M | 1.3 | 1.4 | 1.5 | 1.6 | 1.7 | 1.8 | 1.9 | 2.0 | 2.1 | 2.2 | 2.3 | 2.4 |
| N | 111 | 174 | 156 | 214 | 208 | 212 | 235 | 223 | 209 | 220 | 212 | 187 |
| M | 2.5 | 2.6 | 2.7 | 2.8 | 2.9 | 3.0 | 3.1 | 3.2 | 3.3 | 3.4 | 3.5 | 3.6 |
| N | 172 | 145 | 129 | 98 | 91 | 76 | 66 | 55 | 41 | 35 | 47 | 53 |
| M | 3.7 | 3.8 | 3.9 | 4.0 | 4.1 | 4.2 | 4.3 | 4.4 | 4.5 | 4.6 | 4.7 | 4.8 |
| N | 51 | 51 | 61 | 58 | 49 | 49 | 47 | 32 | 23 | 21 | 18 | 21 |
| M | 4.9 | 5.0 | 5.1 | 5.2 | 5.3 | 5.4 | 5.5 | 5.6 | 5.7 | 5.8 | 5.9 | 6.0 |
| N | 11 | 8 | 6 | 6 | 11 | 1 | 4 | 1 | 2 | 3 | 1 | 1 |
| M | 6.3 | 6.5 | 6.9 | 7.1 | 7.2 | 7.7 | 8.2 | |||||
| N | 1 | 1 | 1 | 1 | 1 | 1 | 1 |
© 2020 by the authors. Licensee MDPI, Basel, Switzerland. This article is an open access article distributed under the terms and conditions of the Creative Commons Attribution (CC BY) license (http://creativecommons.org/licenses/by/4.0/).
Share and Cite
Hussain, H.; Shuangxi, Z.; Usman, M.; Abid, M. Spatial Variation of b-Values and Their Relationship with the Fault Blocks in the Western Part of the Tibetan Plateau and Its Surrounding Areas. Entropy 2020, 22, 1016. https://doi.org/10.3390/e22091016
Hussain H, Shuangxi Z, Usman M, Abid M. Spatial Variation of b-Values and Their Relationship with the Fault Blocks in the Western Part of the Tibetan Plateau and Its Surrounding Areas. Entropy. 2020; 22(9):1016. https://doi.org/10.3390/e22091016
Chicago/Turabian StyleHussain, Hamid, Zhang Shuangxi, Muhammad Usman, and Muhammad Abid. 2020. "Spatial Variation of b-Values and Their Relationship with the Fault Blocks in the Western Part of the Tibetan Plateau and Its Surrounding Areas" Entropy 22, no. 9: 1016. https://doi.org/10.3390/e22091016