Complexity Analysis of EEG, MEG, and fMRI in Mild Cognitive Impairment and Alzheimer’s Disease: A Review


Abstract
:1. Introduction
2. Methods
2.1. The Analysis of Complexity
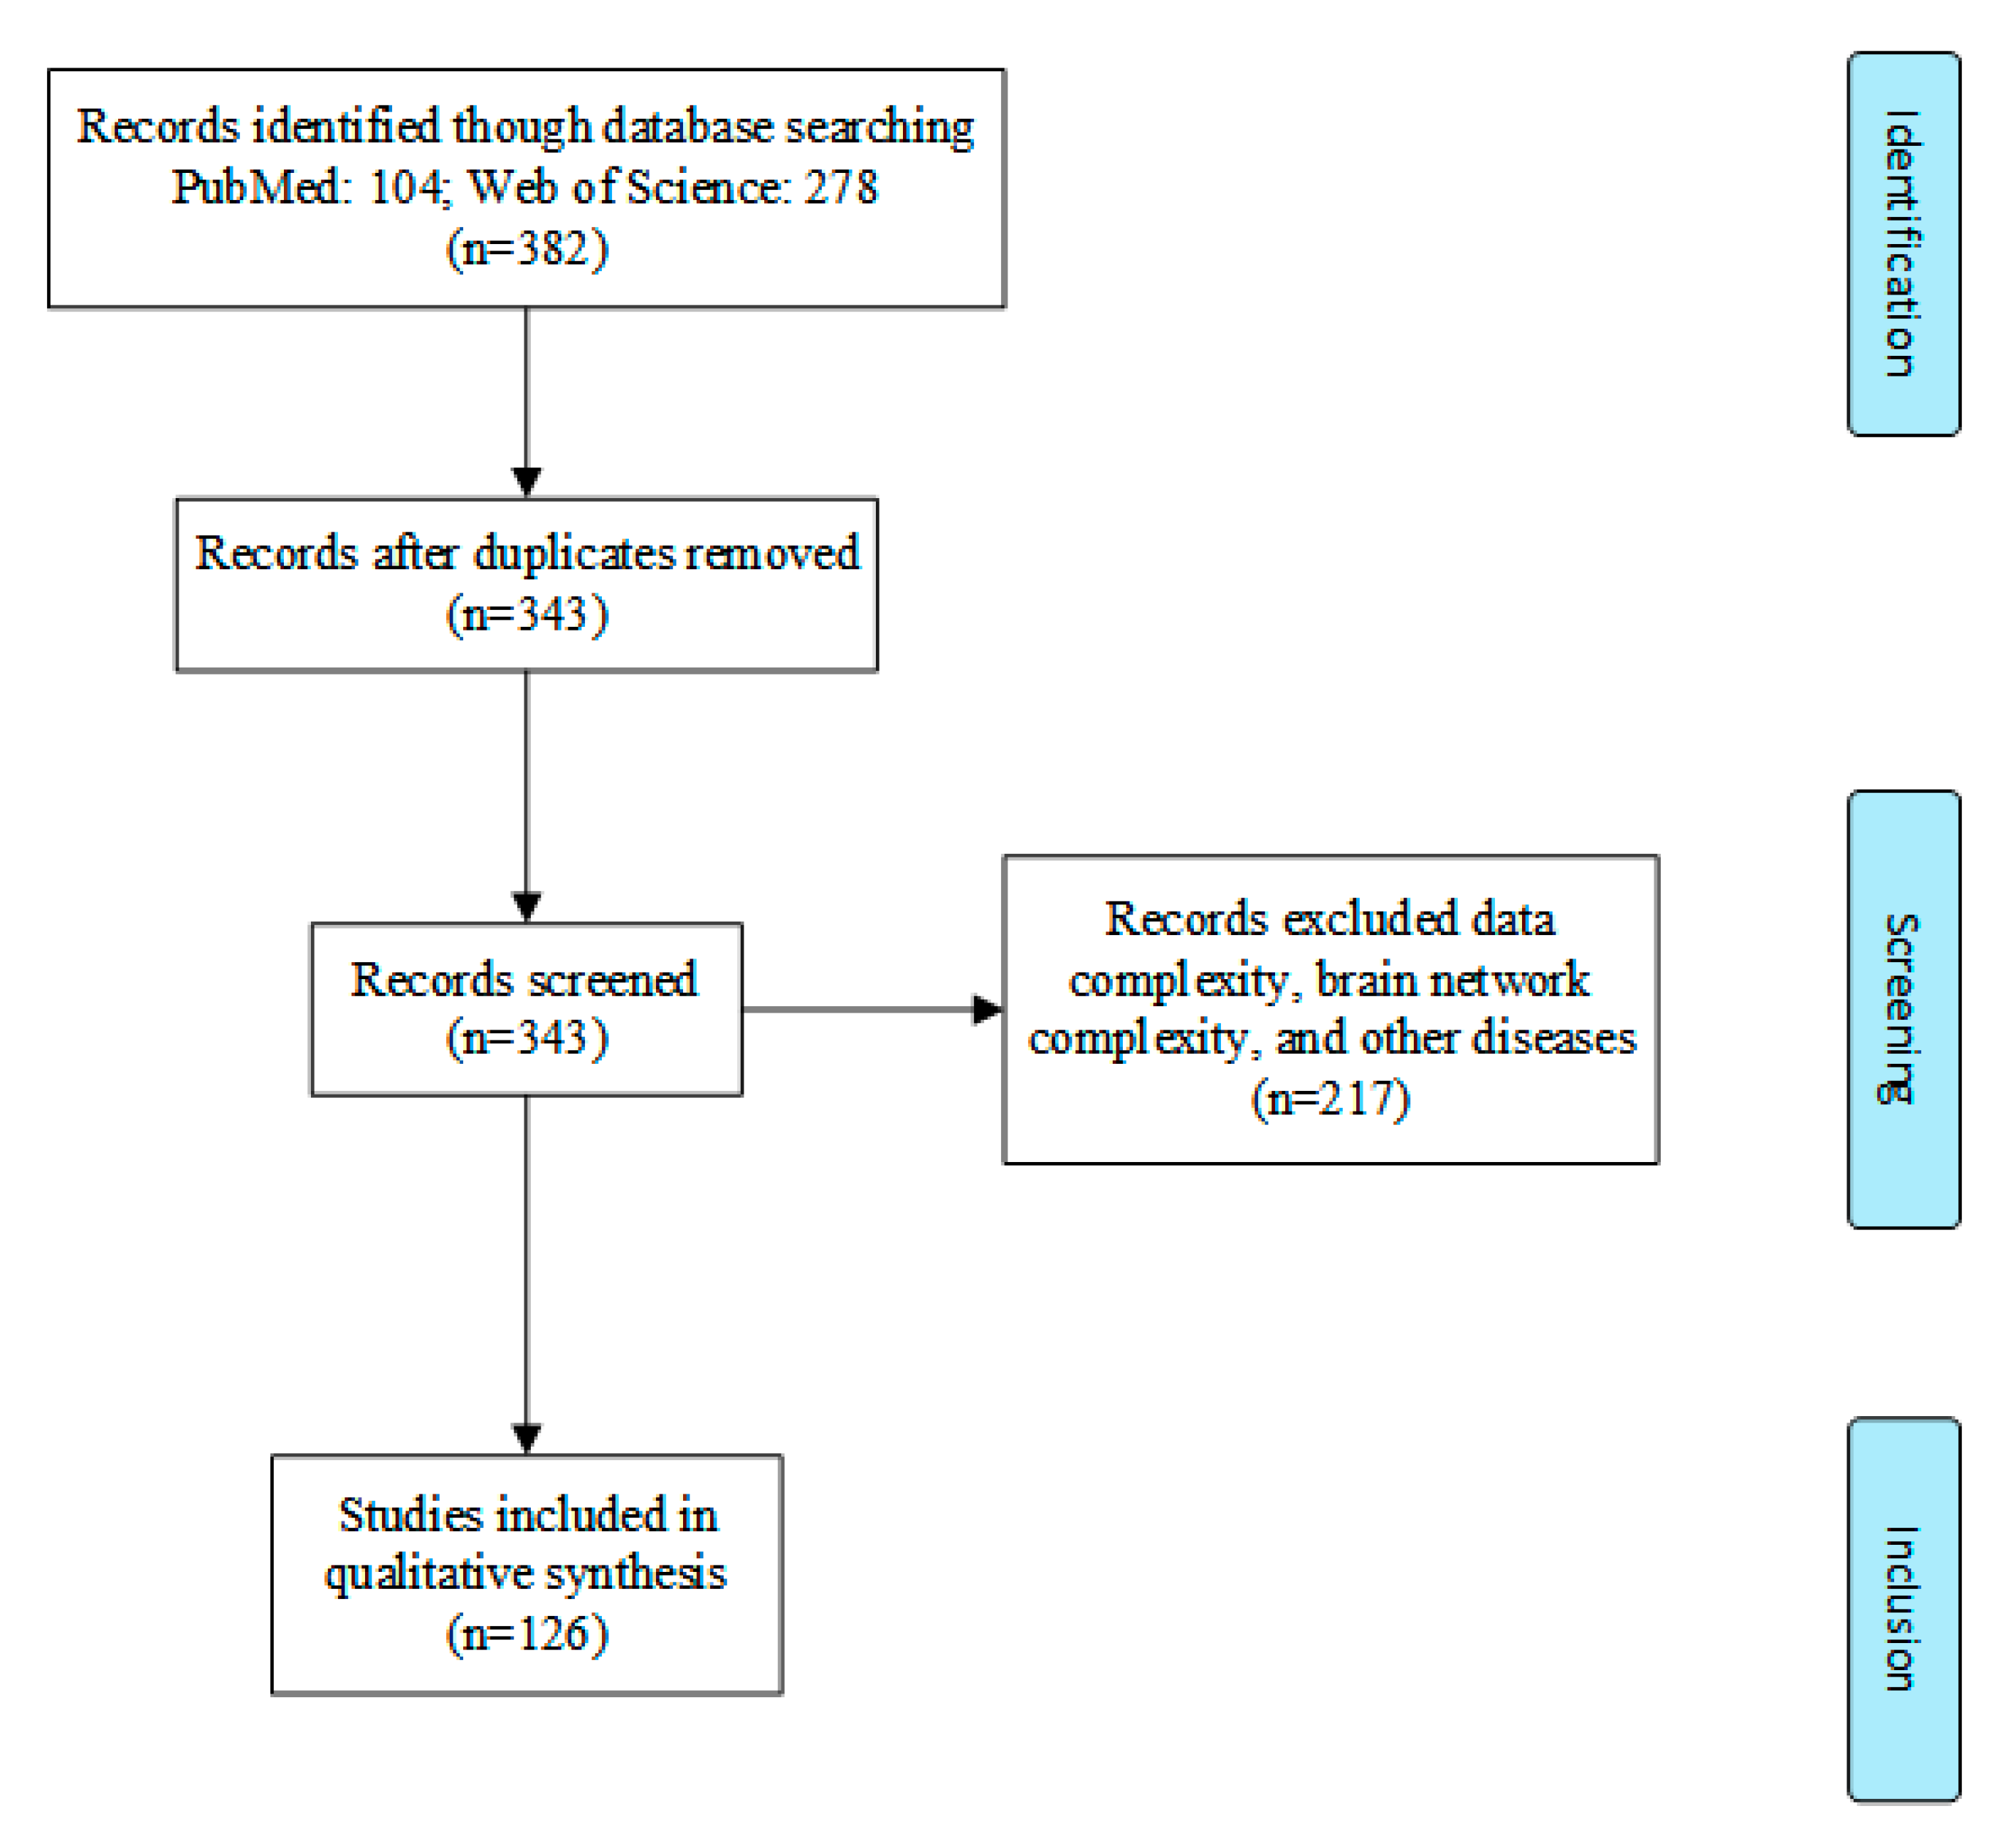
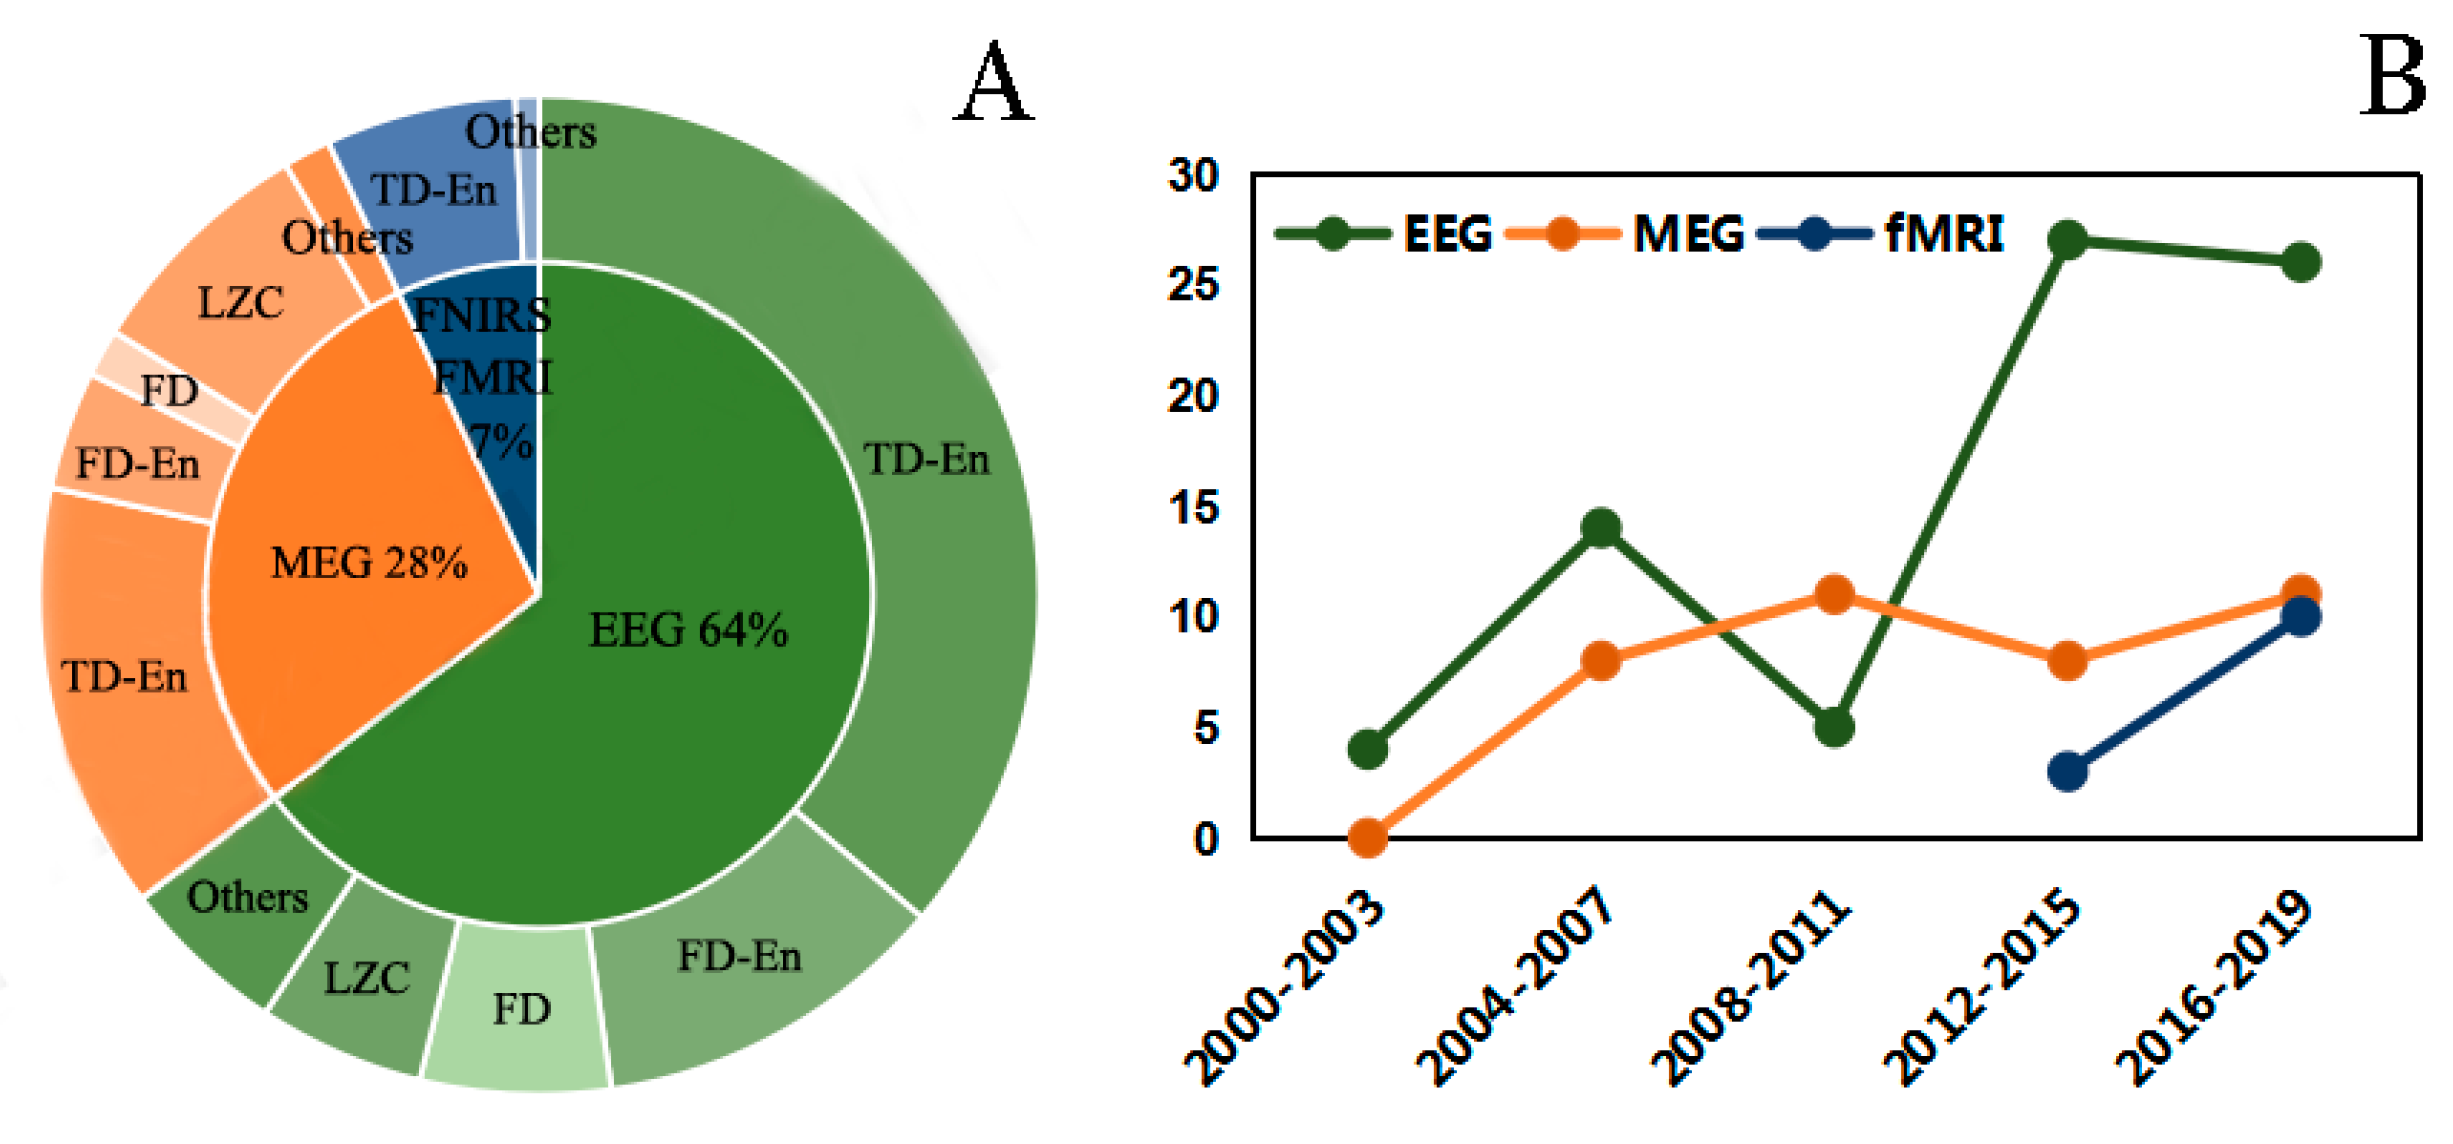
2.2. Literature Search
3. Results
3.1. Complexity Analysis of EEG Signals in AD
3.1.1. Complexity Analysis in Entropy
3.1.2. Complexity Analysis in Multiscale Entropy
3.1.3. Complexity Analysis in Frequency Entropy
3.1.4. Complexity Analysis in Other Methods
3.1.5. Identification of AD
3.2. Complexity Analysis of MEG in AD and MCI
3.2.1. Complexity Analysis in Domain Entropy
3.2.2. Complexity Analysis in Frequency Entropy
3.2.3. Complexity Analysis in Other Methods
3.2.4. Identification of AD
3.3. Complexity Analysis of fMRI and fNIRS Signals in AD and MCI
4. Discussion
Author Contributions
Funding
Conflicts of Interest
References
- Stern, Y. Cognitive reserve in ageing and Alzheimer’s disease. Lancet Neurol. 2012, 11, 1006–1012. [Google Scholar] [CrossRef] [Green Version]
- Kumar, A.; Singh, A. A review on Alzheimer’s disease pathophysiology and its management: An update. Pharmacol. Rep. 2015, 67, 195–203. [Google Scholar] [CrossRef] [PubMed]
- Takahashi, R.H.; Nagao, T.; Gouras, G.K. Plaque formation and the intraneuronal accumulation of β-amyloid in Alzheimer’s disease. Pathol. Int. 2017, 67, 185–193. [Google Scholar] [CrossRef]
- Thies, W.; Bleiler, L. 2012 Alzheimer’s disease facts and figures. Alzheimer’s Dement. J. Alzheimer’s Assoc. 2012, 8, 131–168. [Google Scholar] [CrossRef]
- Buckley, R.F.; Villemagne, V.L.; Masters, C.L.; Ellis, K.A.; Rowe, C.C.; Johnson, K.; Sperling, R.; Amariglio, R. A Conceptualization of the Utility of Subjective Cognitive Decline in Clinical Trials of Preclinical Alzheimer’s Disease. J. Mol. Neurosci. 2016, 60, 354–361. [Google Scholar] [CrossRef] [PubMed] [Green Version]
- Petersen, R.C. Mild cognitive impairment. Contin. Lifelong Learn. Neurol. 2016, 22, 404. [Google Scholar] [CrossRef]
- Visser, P.J.; Vos, S.; van Rossum, I.; Scheltens, P. Comparison of international working group criteria and national institute on Aging–Alzheimer’s association criteria for Alzheimer’s disease. Alzheimer’s Dement. 2012, 8, 560–563. [Google Scholar] [CrossRef]
- Blennow, K.; Mattsson, N.; Schöll, M.; Hansson, O.; Zetterberg, H. Amyloid biomarkers in Alzheimer’s disease. Trends Pharmacol. Sci. 2015, 36, 297–309. [Google Scholar] [CrossRef]
- Rosenberg, P.B.; Nowrangi, M.A.; Lyketsos, C.G. Neuropsychiatric symptoms in Alzheimer’s disease: What might be associated brain circuits? Mol. Asp. Med. 2015, 43, 25–37. [Google Scholar] [CrossRef] [Green Version]
- Ke, Q.; Zhang, J.; Wei, W.; Damaševičius, R.; Woźniak, M. Adaptive Independent Subspace Analysis of Brain Magnetic Resonance Imaging Data. IEEE Access 2019, 7, 12252–12261. [Google Scholar] [CrossRef]
- Acharya, U.R.; Fernandes, S.L.; WeiKoh, J.E.; Ciaccio, E.J.; Fabell, M.K.M.; Tanik, U.J.; Rajinikanth, V.; Yeong, C.H. Automated detection of Alzheimer’s disease using brain MRI images—A study with various feature extraction techniques. J. Med. Syst. 2019, 43, 302. [Google Scholar] [CrossRef]
- Bi, X.; Wang, H. Early Alzheimer’s disease diagnosis based on EEG spectral images using deep learning. Neural Netw. 2019, 114, 119–135. [Google Scholar] [CrossRef] [PubMed]
- Labate, D.; La Foresta, F.; Morabito, G.; Palamara, I.; Morabito, F.C. Entropic measures of EEG complexity in Alzheimer’s disease through a multivariate multiscale approach. IEEE Sens. J. 2013, 13, 3284–3292. [Google Scholar] [CrossRef]
- Luo, Q.; Xu, D.; Roskos, T.; Stout, J.; Kull, L.; Cheng, X.; Whitson, D.; Boomgarden, E.; Gfeller, J.; Bucholz, R.D. Complexity analysis of resting state magnetoencephalography activity in traumatic brain injury patients. J. Neurotrauma 2013, 30, 1702–1709. [Google Scholar] [CrossRef] [PubMed] [Green Version]
- Wang, B.; Niu, Y.; Miao, L.; Cao, R.; Yan, P.; Guo, H.; Li, D.; Guo, Y.; Yan, T.; Wu, J. Decreased complexity in Alzheimer’s disease: Resting-state fMRI evidence of brain entropy mapping. Front. Aging Neurosci. 2017, 9, 378. [Google Scholar] [CrossRef] [PubMed] [Green Version]
- Staudinger, T.; Polikar, R. Analysis of complexity based EEG features for the diagnosis of Alzheimer’s disease. In Proceedings of the 2011 Annual International Conference of the IEEE Engineering in Medicine and Biology Society, Boston, MA, USA, 30 August–3 September 2011; pp. 2033–2036. [Google Scholar]
- Waser, M.; Deistler, M.; Garn, H.; Benke, T.; Dal-Bianco, P.; Ransmayr, G.; Grossegger, D.; Schmidt, R. EEG in the diagnostics of Alzheimer’s disease. Stat. Pap. 2013, 54, 1095–1107. [Google Scholar] [CrossRef]
- Sharma, A.; Rai, J.; Tewari, R. Relative Measures to Characterize EEG Signals for Early Detection of Alzheimer. In Proceedings of the 2018 5th International Conference on Signal Processing and Integrated Networks (SPIN), Noida, India, 22–23 February 2018; pp. 43–48. [Google Scholar]
- Atluri, G.; Padmanabhan, K.; Fang, G.; Steinbach, M.; Petrella, J.R.; Lim, K.; MacDonald, A., III; Samatova, N.F.; Doraiswamy, P.M.; Kumar, V. Complex biomarker discovery in neuroimaging data: Finding a needle in a haystack. Neuroimage Clin. 2013, 3, 123–131. [Google Scholar] [CrossRef] [Green Version]
- Polanco, J.C.; Li, C.; Bodea, L.-G.; Martinez-Marmol, R.; Meunier, F.A.; Götz, J. Amyloid-β and tau complexity—Towards improved biomarkers and targeted therapies. Nat. Rev. Neurol. 2018, 14, 22. [Google Scholar] [CrossRef]
- Shannon, C.E. A Mathematical Theory of Communication. Bell Syst. Tech. J. 1948, 27, 379–423. [Google Scholar] [CrossRef] [Green Version]
- Pincus, S. Approximate entropy (ApEn) as a complexity measure. Chaos Interdiscip. J. Nonlinear Sci. 1995, 5, 110–117. [Google Scholar] [CrossRef]
- Yentes, J.M.; Hunt, N.; Schmid, K.K.; Kaipust, J.P.; McGrath, D.; Stergiou, N. The appropriate use of approximate entropy and sample entropy with short data sets. Ann. Biomed. Eng. 2013, 41, 349–365. [Google Scholar] [CrossRef] [PubMed]
- Richman, J.S.; Lake, D.E.; Moorman, J.R. Sample Entropy. Methods Enzymol. 2004, 384, 172–184. [Google Scholar] [PubMed]
- Graff, B.; Graff, G.; Kaczkowska, A. Entropy measures of heart rate variability for short ECG datasets in patients with congestive heart failure. Acta Phys. Pol. B Proc. Suppl. 2012, 5, 153–158. [Google Scholar] [CrossRef]
- Kosko, B. Fuzzy entropy and conditioning. Inf. Sci. 1986, 40, 165–174. [Google Scholar] [CrossRef]
- Bandt, C.; Pompe, B. Permutation Entropy: A Natural Complexity Measure for Time Series. Phys. Rev. Lett. 2002, 88, 174102. [Google Scholar] [CrossRef]
- Zanin, M.; Zunino, L.; Rosso, O.A.; Papo, D. Permutation entropy and its main biomedical and econophysics applications: A review. Entropy 2012, 14, 1553–1577. [Google Scholar] [CrossRef]
- Kaufmann, A.; Kraft, B.; Michaleksauberer, A.; Weigl, L.G. Using Permutation Entropy to Measure the Electroencephalographic Effects of Sevoflurane. J. Am. Soc. Anesthesiol. 2008, 109, 448. [Google Scholar]
- Morison, G.; Tieges, Z.; Kilborn, K. Multiscale permutation entropy analysis of EEG in mild probable Alzheimer’s patients during an episodic memory paradigm. Alzheimer’s Dement. J. Alzheimer’s Assoc. 2012, 8, 522. [Google Scholar] [CrossRef]
- Faisal, A.A.; Selen, L.P.J.; Wolpert, D.M. Noise in the nervous system. Nat. Rev. Neurosci. 1966, 9, 292–303. [Google Scholar] [CrossRef]
- Marziani, E.; Pomati, S.; Ramolfo, P.; Cigada, M.; Giani, A.; Mariani, C.; Staurenghi, G. Evaluation of retinal nerve fiber layer and ganglion cell layer thickness in Alzheimer’s disease using spectral-domain optical coherence tomography. Investig. Ophthalmol. Vis. Sci. 2013, 54, 5953–5958. [Google Scholar] [CrossRef]
- Renyi, A. Probability Theory; North-Ho11 and Pub. Co.: Amsterdam, The Netherlands, 1970. [Google Scholar]
- Frank, R.L.; Lieb, E.H. Monotonicity of a relative Rényi entropy. J. Math. Phys. 2013, 54, 122201. [Google Scholar] [CrossRef] [Green Version]
- Tsallis, C. Possible generalization of Boltzmann-Gibbs statistics. J. Stat. Phys. 1988, 52, 479–487. [Google Scholar] [CrossRef]
- Vakkuri, A.; Yli-Hankala, A.; Talja, P.; Mustola, S.; Tolvanen-Laakso, H.; Sampson, T.; Viertiö-Oja, H. Time-frequency balanced spectral entropy as a measure of anesthetic drug effect in central nervous system during sevoflurane, propofol, and thiopental anesthesia & nbsp. Acta Anaesthesiol. Scand. 2004, 48, 145–153. [Google Scholar] [PubMed]
- Sarkar, S.; Das, S. Multilevel image thresholding based on 2D histogram and maximum Tsallis entropy—A differential evolution approach. IEEE Trans. Image Process. 2013, 22, 4788–4797. [Google Scholar] [CrossRef]
- Zaccarelli, N.; Li, B.-L.; Petrosillo, I.; Zurlini, G. Order and disorder in ecological time-series: Introducing normalized spectral entropy. Ecol. Indic. 2013, 28, 22–30. [Google Scholar] [CrossRef]
- Qian, B.; Rasheed, K. Hurst exponent and financial market predictability. In Proceedings of the IASTED Conference on Financial Engineering and Applications, Cambridge, MA, USA, 8–10 November 2004; pp. 203–209. [Google Scholar]
- Aboy, M.; Hornero, R.; Abásolo, D.; Álvarez, D. Interpretation of the Lempel-Ziv complexity measure in the context of biomedical signal analysis. IEEE Trans. Biomed. Eng. 2006, 53, 2282–2288. [Google Scholar] [CrossRef] [Green Version]
- Jeong, J.; Chae, J.H.; Kim, S.Y.; Han, S.H. Nonlinear dynamic analysis of the EEG in patients with Alzheimer’s disease and vascular dementia. J. Clin. Neurophysiol. 2001, 18, 58–67. [Google Scholar] [CrossRef] [Green Version]
- Sriraam, N. Correlation dimension based lossless compression of EEG signals. Biomed. Signal Process. Control 2012, 7, 379–388. [Google Scholar] [CrossRef]
- Grassberger, P.; Procaccia, I. Characterization of strange attractors. Phys. Rev. Lett. 1983, 50, 346. [Google Scholar] [CrossRef]
- Eckmann, J.-P.; Ruelle, D. Fundamental limitations for estimating dimensions and Lyapunov exponents in dynamical systems. Phys. D Nonlinear Phenom. 1992, 56, 185–187. [Google Scholar] [CrossRef]
- Jeong, J.; Kim, S.Y.; Han, S.-H. Non-linear dynamical analysis of the EEG in Alzheimer’s disease with optimal embedding dimension. Electroencephalogr. Clin. Neurophysiol. 1998, 106, 220–228. [Google Scholar] [CrossRef]
- Stam, K.J.; Tavy, D.L.; Jelles, B.; Achtereekte, H.A.; Slaets, J.P.; Keunen, R.W. Non-linear dynamical analysis of multichannel EEG: Clinical applications in dementia and Parkinson’s disease. Brain Topogr. 1994, 7, 141–150. [Google Scholar] [CrossRef] [PubMed]
- Smits, F.M.; Porcaro, C.; Cottone, C.; Cancelli, A.; Rossini, P.M.; Tecchio, F. Electroencephalographic fractal dimension in healthy ageing and Alzheimer’s disease. PLoS ONE 2016, 11, e0149587. [Google Scholar] [CrossRef] [PubMed]
- Bachmann, M.; Lass, J.; Suhhova, A.; Hinrikus, H. Spectral asymmetry and Higuchi’s fractal dimension measures of depression electroencephalogram. Comput. Math. Methods Med. 2013, 2013, 1–8. [Google Scholar] [CrossRef] [PubMed] [Green Version]
- Kesić, S.; Spasić, S.Z. Application of Higuchi’s fractal dimension from basic to clinical neurophysiology: A review. Comput. Methods Programs Biomed. 2016, 133, 55–70. [Google Scholar] [CrossRef] [PubMed]
- Geng, S.J.; Zhou, W.D.; Yao, Q.M.; Ma, Z. Nonlinear analysis of EEG using fractal dimension and approximate entropy. In Advanced Materials Research; Trans Tech Publications Ltd.: Stafa-Zurich, Switzerland; Volume 532, pp. 988–992.
- Pincus, S.M. Approximate entropy as a measure of system complexity. Proc. Natl. Acad. Sci. USA 1991, 88, 2297–2301. [Google Scholar] [CrossRef] [Green Version]
- Richman, J.S.; Moorman, J.R. Physiological time-series analysis using approximate entropy and sample entropy. Am. J. Physiol. Heart Circ. Physiol. 2000, 278, H2039–H2049. [Google Scholar] [CrossRef] [Green Version]
- Costa, M.; Goldberger, A.L.; Peng, C.-K. Multiscale entropy analysis of complex physiologic time series. Phys. Rev. Lett. 2002, 89, 068102. [Google Scholar] [CrossRef] [Green Version]
- Chen, W.; Wang, Z.; Xie, H.; Yu, W. Characterization of surface EMG signal based on fuzzy entropy. IEEE Trans. Neural Syst. Rehabil. Eng. 2007, 15, 266–272. [Google Scholar] [CrossRef]
- Ross, S.B.; Renyi, A.L. Inhibition of the neuronal uptake of 5-hydroxytryptamine and noradrenaline in rat brain by (Z)- and (E)-3-(4-bromophenyl)-N,N-dimethyl-3-(3-pyridyl) allylamines and their secondary analogues. Neuropharmacology 1977, 16, 57–63. [Google Scholar] [CrossRef]
- Powell, G.; Percival, I. A spectral entropy method for distinguishing regular and irregular motion of Hamiltonian systems. J. Phys. A Math. Gen. 1979, 12, 2053. [Google Scholar] [CrossRef]
- Tsallis; Constantino. Generalized entropy-based criterion for consistent testing. Phys. Rev. E Stat. Phys. Plasmas Fluids Relat. Interdiscip. Top. 1998, 58, 1442–1445. [Google Scholar]
- Feller, W. The asymptotic distribution of the range of sums of independent random variables. Ann. Math. Stat. 1951, 22, 427–432. [Google Scholar] [CrossRef]
- Lempel, A.; Ziv, J. On the Complexity of Finite Sequences. IEEE Trans. Inf. Theory 1976, 22, 75–81. [Google Scholar] [CrossRef]
- Grassberger, P. Generalized dimensions of strange attractors. Phys. Lett. A 1983, 97, 227–230. [Google Scholar] [CrossRef]
- Higuchi, T. Approach to an irregular time series on the basis of the fractal theory. Phys. D Nonlinear Phenom. 1988, 31, 277–283. [Google Scholar] [CrossRef]
- Liberati, A.; Altman, D.G.; Tetzlaff, J.; Mulrow, C.; Gotzsche, P.C.; Ioannidis, J.P.A.; Clarke, M.; Devereaux, P.J.; Kleijnen, J.; Moher, D. The PRISMA statement for reporting systematic reviews and meta-analyses of studies that evaluate healthcare interventions: Explanation and elaboration. J. Clin. Epidemiol. 2009, 339, b2700. [Google Scholar] [CrossRef] [PubMed] [Green Version]
- Lehmann, M.; Madison, C.; Ghosh, P.M.; Seeley, W.W.; Greicius, M.D.; Gorno-Tempini, M.-L.; Kramer, J.H.; Miller, B.L.; Jagust, W.J.; Rabinovici, G.D. Loss of functional connectivity is greater outside the default mode network in non-familial early-onset ad variants. J. Alzheimer’s Assoc. 2014, 10, 105. [Google Scholar] [CrossRef]
- Sala-Llonch, R.; Pena-Gómez, C.; Arenaza-Urquijo, E.M.; Vidal-Pi?eiro, D.; Bargalló, N.; Junqué, C.; Bartrés-Faz, D. Brain connectivity during resting state and subsequent working memory task predicts behavioural performance. Cortex 2012, 48, 1187–1196. [Google Scholar] [CrossRef]
- Deco, G.; Jirsa, V.K.; McIntosh, A.R. Resting brains never rest: Computational insights into potential cognitive architectures. Trends Neurosci. 2013, 36, 268–274. [Google Scholar] [CrossRef] [Green Version]
- Ganzetti, M.; Mantini, D. Functional connectivity and oscillatory neuronal activity in the resting human brain. Neuroscience 2013, 240, 297–309. [Google Scholar] [CrossRef] [PubMed]
- Purdon, P.L.; Pierce, E.T.; Mukamel, E.A.; Prerau, M.J.; Walsh, J.L.; Wong, K.F.K.; Salazar-Gomez, A.F.; Harrell, P.G.; Sampson, A.L.; Cimenser, A. Electroencephalogram signatures of loss and recovery of consciousness from propofol. Proc. Natl. Acad. Sci. USA 2013, 110, E1142–E1151. [Google Scholar] [CrossRef] [PubMed] [Green Version]
- Liechti, M.D.; Valko, L.; Müller, U.C.; Döhnert, M.; Drechsler, R.; Steinhausen, H.-C.; Brandeis, D. Diagnostic value of resting electroencephalogram in attention-deficit/hyperactivity disorder across the lifespan. Brain Topogr. 2013, 26, 135–151. [Google Scholar] [CrossRef] [PubMed] [Green Version]
- Hogan, M.J.; Kilmartin, L.; Keane, M.; Collins, P.; Staff, R.T.; Kaiser, J.; Lai, R.; Upton, N. Electrophysiological entropy in younger adults, older controls and older cognitively declined adults. Brain Res. 2012, 1445, 1–10. [Google Scholar] [CrossRef] [Green Version]
- Abásolo, D.; Hornero, R.; Espino, P.; Poza, J.; Sánchez, C.I.; Rosa, R.D.L. Analysis of regularity in the EEG background activity of Alzheimer’s disease patients with Approximate Entropy. Clin. Neurophysiol. 2005, 116, 1826–1834. [Google Scholar] [CrossRef] [Green Version]
- Abásolo, D.; Escudero, J.; Hornero, R.; Gómez, C.; Espino, P. Approximate entropy and auto mutual information analysis of the electroencephalogram in Alzheimer’s disease patients. Med. Biol. Eng. Comput. 2008, 46, 1019–1028. [Google Scholar] [CrossRef] [Green Version]
- Abásolo, D.; Hornero, R.; Espino, P.; Álvarez, D.; Poza, J. Entropy analysis of the EEG background activity in Alzheimer’s disease patients. Physiol. Meas. 2006, 27, 241–253. [Google Scholar] [CrossRef] [Green Version]
- Woon, W.L.; Cichocki, A.; Vialatte, F.; Musha, T. Techniques for early detection of Alzheimer’s disease using spontaneous EEG recordings. Physiol. Meas. 2007, 28, 335–347. [Google Scholar] [CrossRef]
- Hornero, R.; Abásolo, D.; Escudero, J.; Gómez, C. Nonlinear analysis of electroencephalogram and magnetoencephalogram recordings in patients with Alzheimer’s disease. Philos. Trans. R. Soc. A Math. Phys. Eng. Sci. 2008, 367, 317–336. [Google Scholar] [CrossRef] [Green Version]
- Nesma, H.; François, V.; Esteve, G.-J.; Gérard, D.; Vi-Huong, N.-M.; Jean, M.; Kiyoka, K.; D., G.S. Diagnosis of Alzheimer’s disease with Electroencephalography in a differential framework. PLoS ONE 2018, 13, e0193607. [Google Scholar]
- Garn, H.; Waser, M.; Deistler, M.; Schmidt, R.; Dal-Bianco, P.; Ransmayr, G.; Zeitlhofer, J.; Schmidt, H.; Seiler, S.; Sanin, G. Quantitative EEG in Alzheimer’s disease: Cognitive state, resting state and association with disease severity. Int. J. Psychophysiol. 2014, 93, 390–397. [Google Scholar] [CrossRef] [PubMed]
- Liu, X.; Zhang, C.; Ji, Z.; Ma, Y.; Shang, X.; Zhang, Q.; Zheng, W.; Li, X.; Gao, J.; Wang, R. Multiple characteristics analysis of Alzheimer’s electroencephalogram by power spectral density and Lempel—Ziv complexity. Cogn. Neurodyn. 2016, 10, 121–133. [Google Scholar] [CrossRef] [PubMed] [Green Version]
- Al-Nuaimi, A.H.H.; Jammeh, E.; Sun, L.; Ifeachor, E. Complexity measures for quantifying changes in electroencephalogram in Alzheimer’s disease. Complexity 2018, 2018, 33. [Google Scholar] [CrossRef]
- John, T.N.; Dharmapalan, P.S.; Menon, N.R. Exploration of time–frequency reassignment and homologous inter-hemispheric asymmetry analysis of MCI–AD brain activity. BMC Neurosci. 2019, 20, 38. [Google Scholar]
- Reyes-Coronel, C.; Waser, M.; Garn, H.; Deistler, M.; Dal-Bianco, P.; Benke, T.; Ransmayr, G.; Grossegger, D.; Schmidt, R. Predicting rapid cognitive decline in Alzheimer’s disease patients using quantitative EEG markers and neuropsychological test scores. In Proceedings of the 2016 38th Annual International Conference of the IEEE Engineering in Medicine and Biology Society (EMBC), Orlando, FL, USA, 16–20 August 2016; pp. 6078–6081. [Google Scholar]
- Al-Qazzaz, N.K.; Ali, S.H.B.M.; Ahmad, S.A.; Islam, M.S.; Escudero, J. Discrimination of stroke-related mild cognitive impairment and vascular dementia using EEG signal analysis. Med. Biol. Eng. Comput. 2018, 56, 137–157. [Google Scholar] [CrossRef]
- Deng, B.; Cai, L.; Li, S.; Wang, R.; Yu, H.; Chen, Y.; Wang, J. Multivariate multi-scale weighted permutation entropy analysis of EEG complexity for Alzheimer’s disease. Cogn. Neurodyn. 2017, 11, 217–231. [Google Scholar] [CrossRef]
- Mizuno, T.; Takahashi, T.; Cho, R.Y.; Kikuchi, M.; Murata, T.; Takahashi, K.; Wada, Y. Assessment of EEG dynamical complexity in Alzheimer’s disease using multiscale entropy. Clin. Neurophysiol. 2010, 121, 1438–1446. [Google Scholar] [CrossRef] [Green Version]
- Chai, X.; Weng, X.; Zhang, Z.; Lu, Y.; Niu, H. Quantitative EEG in Mild Cognitive Impairment and Alzheimer’s Disease by AR-Spectral and Multi-scale Entropy Analysis. In World Congress on Medical Physics and Biomedical Engineering; Springer: Singapore, 2019. [Google Scholar]
- Maturana-Candelas, A.; Gómez, C.; Poza, J.; Pinto, N.; Hornero, R. EEG characterization of the Alzheimer’s disease continuum by means of multiscale entropies. Entropy 2019, 21, 544. [Google Scholar] [CrossRef] [Green Version]
- Yang, A.C.; Huang, C.-C.; Yeh, H.-L.; Liu, M.-E.; Hong, C.-J.; Tu, P.-C.; Chen, J.-F.; Huang, N.E.; Peng, C.-K.; Lin, C.-P. Complexity of spontaneous BOLD activity in default mode network is correlated with cognitive function in normal male elderly: A multiscale entropy analysis. Neurobiol. Aging 2013, 34, 428–438. [Google Scholar] [CrossRef]
- Al-Qazzaz, N.K.; Ali, S.; Islam, M.S.; Ahmad, S.A.; Escudero, J. EEG markers for early detection and characterization of vascular dementia during working memory tasks. In Proceedings of the 2016 IEEE EMBS Conference on Biomedical Engineering and Sciences (IECBES), Kuala Lumpur, Malaysia, 4–8 December 2016; pp. 347–351. [Google Scholar]
- Sharma, N.; Kolekar, M.; Jha, K.; Kumar, Y. EEG and Cognitive Biomarkers Based Mild Cognitive Impairment Diagnosis. IRBM 2019, 40, 113–121. [Google Scholar] [CrossRef]
- Ruiz-Gómez, S.; Gómez, C.; Poza, J.; Gutiérrez-Tobal, G.; Tola-Arribas, M.; Cano, M.; Hornero, R. Automated multiclass classification of spontaneous EEG activity in Alzheimer’s disease and mild cognitive impairment. Entropy 2018, 20, 35. [Google Scholar] [CrossRef] [Green Version]
- De Bock, T.J.; Das, S.; Mohsin, M.; Munro, N.B.; Hively, L.M.; Jiang, Y.; Smith, C.D.; Wekstein, D.R.; Jicha, G.A.; Lawson, A. Early detection of Alzheimer’s disease using nonlinear analysis of EEG via Tsallis entropy. In Proceedings of the 2010 Biomedical Sciences and Engineering Conference, Oak Ridge, TN, USA, 5–6 May 2010; pp. 1–4. [Google Scholar]
- Coronel, C.; Garn, H.; Waser, M.; Deistler, M.; Benke, T.; Dal-Bianco, P.; Ransmayr, G.; Seiler, S.; Grossegger, D.; Schmidt, R. Quantitative EEG markers of entropy and auto mutual information in relation to MMSE scores of probable Alzheimer’s disease patients. Entropy 2017, 19, 130. [Google Scholar] [CrossRef] [Green Version]
- Dauwels, J.; Vialatte, F.; Cichocki, A. Diagnosis of Alzheimer’s disease from EEG signals: Where are we standing? Curr. Alzheimer Res. 2010, 7, 487–505. [Google Scholar] [CrossRef] [Green Version]
- Hirschmann, J.; Hartmann, C.J.; Butz, M.; Hoogenboom, N.; Özkurt, T.E.; Elben, S.; Vesper, J.; Wojtecki, L.; Schnitzler, A. A direct relationship between oscillatory subthalamic nucleus—Cortex coupling and rest tremor in Parkinson’s disease. Brain 2013, 136, 3659–3670. [Google Scholar] [CrossRef] [PubMed] [Green Version]
- Jelles, B.; Scheltens, P.; Van der Flier, W.; Jonkman, E.; da Silva, F.L.; Stam, C. Global dynamical analysis of the EEG in Alzheimer’s disease: Frequency-specific changes of functional interactions. Clin. Neurophysiol. 2008, 119, 837–841. [Google Scholar] [CrossRef] [PubMed]
- Hutcheon, B.; Yarom, Y. Resonance, oscillation and the intrinsic frequency preferences of neurons. Trends Neurosci. 2000, 23, 216–222. [Google Scholar] [CrossRef]
- Schnitzler, A.; Gross, J. Normal and pathological oscillatory communication in the brain. Nat. Rev. Neurosci. 2005, 6, 285. [Google Scholar] [CrossRef]
- Von Stein, A.; Sarnthein, J. Different frequencies for different scales of cortical integration: From local gamma to long range alpha/theta synchronization. Int. J. Psychophysiol. 2000, 38, 301–313. [Google Scholar] [CrossRef]
- Vakorin, V.A.; Lippé, S.; McIntosh, A.R. Variability of brain signals processed locally transforms into higher connectivity with brain development. J. Neurosci. 2011, 31, 6405–6413. [Google Scholar] [CrossRef] [Green Version]
- Jeong, J. EEG dynamics in patients with Alzheimer’s disease. Clin. Neurophysiol. 2004, 115, 1490–1505. [Google Scholar] [CrossRef]
- Henderson, G.; Ifeachor, E.; Wimalaratna, H.; Allen, E.; Hudson, N. Prospects for routine detection of dementia using the fractal dimension of the human electroencephalogram. IEE Proc. Sci. Meas. Technol. 2000, 147, 321–326. [Google Scholar] [CrossRef]
- Amezquita-Sanchez, J.P.; Mammone, N.; Morabito, F.C.; Marino, S.; Adeli, H. A novel methodology for automated differential diagnosis of mild cognitive impairment and the Alzheimer’s disease using EEG signals. J. Neurosci. Methods 2019, 322, 88–95. [Google Scholar] [CrossRef] [PubMed]
- Al-nuaimi, A.H.; Jammeh, E.; Sun, L.; Ifeachor, E. Higuchi fractal dimension of the electroencephalogram as a biomarker for early detection of Alzheimer’s disease. In Proceedings of the 2017 39th Annual International Conference of the IEEE Engineering in Medicine and Biology Society (EMBC), Seogwipo, Korea, 11–15 July 2017; pp. 2320–2324. [Google Scholar]
- Mcbride, J.C.; Zhao, X.; Munro, N.B.; Smith, C.D.; Jicha, G.A.; Hively, L.; Broster, L.S.; Schmitt, F.A.; Kryscio, R.J.; Jiang, Y. Spectral and complexity analysis of scalp EEG characteristics for mild cognitive impairment and early Alzheimer’s disease. Comput. Methods Programs Biomed. 2014, 114, 153–163. [Google Scholar] [CrossRef] [PubMed] [Green Version]
- Fan, M.; Yang, A.C.; Fuh, J.-L.; Chou, C.-A. Topological Pattern Recognition of Severe Alzheimer’s Disease via Regularized Supervised Learning of EEG Complexity. Front. Neurosci. 2018, 12, 685. [Google Scholar] [CrossRef] [PubMed] [Green Version]
- Simons, S.; Espino, P.; Abásolo, D. Fuzzy entropy analysis of the electroencephalogram in patients with Alzheimer’s disease: Is the method superior to sample entropy? Entropy 2018, 20, 21. [Google Scholar] [CrossRef] [Green Version]
- Cuffin, B.N.; Cohen, D. Comparison of the magnetoencephalogram and electroencephalogram. Electroencephalogr. Clin. Neurophysiol. 1979, 47, 132–146. [Google Scholar] [CrossRef]
- Jirsa, V.K.; Friedrich, R.; Haken, H. Reconstruction of the spatio-temporal dynamics of a human magnetoencephalogram. Phys. D Nonlinear Phenom. 1995, 89, 100–122. [Google Scholar] [CrossRef]
- Gómez, C.; Martínez-Zarzuela, M.; Poza, J.; Díaz-Pernas, F.J.; Fernández, A.; Hornero, R. Synchrony analysis of spontaneous MEG activity in Alzheimer’s disease patients. In Proceedings of the 2012 Annual International Conference of the IEEE Engineering in Medicine and Biology Society, San Diego, CA, USA, 28 August–1 September 2012; pp. 6188–6191. [Google Scholar]
- Gómez, C.; Poza, J.; Monge, J.; Fernández, A.; Hornero, R. Analysis of magnetoencephalography recordings from Alzheimer’s disease patients using embedding entropies. In Proceedings of the 2014 36th Annual International Conference of the IEEE Engineering in Medicine and Biology Society, Chicago, IL, USA, 26–30 August 2014; pp. 702–705. [Google Scholar]
- Amezquita-Sanchez, J.P.; Adeli, A.; Adeli, H. A new methodology for automated diagnosis of mild cognitive impairment (MCI) using magnetoencephalography (MEG). Behav. Brain Res. 2016, 305, 174–180. [Google Scholar] [CrossRef]
- Azami, H.; Rostaghi, M.; Fernández, A.; Escudero, J. Dispersion entropy for the analysis of resting-state MEG regularity in Alzheimer’s disease. In Proceedings of the 2016 38th Annual International Conference of the IEEE Engineering in Medicine and Biology Society (EMBC), Orlando, FL, USA, 16–20 August 2016; pp. 6417–6420. [Google Scholar]
- Gómez, C.; Hornero, R.; Abásolo, D.; Fernandez, A.; Escudero, J. Analysis of MEG recordings from Alzheimer’s disease patients with sample and multiscale entropies. In Proceedings of the 2007 29th Annual International Conference of the IEEE Engineering in Medicine and Biology Society, Lyon, France, 22–26 August 2007; pp. 6183–6186. [Google Scholar]
- Azami, H.; Kinney-Lang, E.; Ebied, A.; Fernández, A.; Escudero, J. Multiscale dispersion entropy for the regional analysis of resting-state magnetoencephalogram complexity in Alzheimer’s disease. In Proceedings of the 2017 39th Annual International Conference of the IEEE Engineering in Medicine and Biology Society (EMBC), Seogwipo, Korea, 11–15 July 2017; pp. 3182–3185. [Google Scholar]
- Engels, M.; van der Flier, W.; Stam, C.; Hillebrand, A.; Scheltens, P.; van Straaten, E. Alzheimer’s disease: The state of the art in resting-state magnetoencephalography. Clin. Neurophysiol. 2017, 128, 1426–1437. [Google Scholar] [CrossRef]
- Poza, J.; Hornero, R.; Abásolo, D.; Fernandez, A.; Escudero, J. Analysis of spontaneous MEG activity in patients with Alzheimer’s disease using spectral entropies. In Proceedings of the 2007 29th Annual International Conference of the IEEE Engineering in Medicine and Biology Society, Lyon, France, 22–26 August 2007; pp. 6179–6182. [Google Scholar]
- Poza, J.; Hornero, R.; Abásolo, D.; Fernández, A.; Mayo, A. Evaluation of spectral ratio measures from spontaneous MEG recordings in patients with Alzheimer’s disease. Comput. Methods Programs Biomed. 2008, 90, 137–147. [Google Scholar] [CrossRef] [Green Version]
- BruñA, R.; Poza, J.; Gómez, C.; García, M.; Fernández, A.; Hornero, R. Analysis of spontaneous MEG activity in mild cognitive impairment and Alzheimer’s disease using spectral entropies and statistical complexity measures. J. Neural Eng. 2012, 9, 036007. [Google Scholar] [CrossRef] [PubMed] [Green Version]
- Gómez, C.; Mediavilla, Á.; Hornero, R.; Abásolo, D.; Fernández, A. Use of the Higuchi’s fractal dimension for the analysis of MEG recordings from Alzheimer’s disease patients. Med. Eng. Phys. 2009, 31, 306–313. [Google Scholar] [CrossRef] [PubMed] [Green Version]
- Shumbayawonda, E.; López-Sanz, D.; Bruña, R.; Serrano, N.; Fernández, A.; Maestú, F.; Abasolo, D. Complexity changes in preclinical Alzheimer’s disease: An MEG study of subjective cognitive decline and mild cognitive impairment. Clin. Neurophysiol. 2020, 131, 437–445. [Google Scholar] [CrossRef] [PubMed]
- Fernández, A.; Hornero, R.; Gómez, C.; Turrero, A.; Ortiz, T. Complexity Analysis of Spontaneous Brain Activity in Alzheimer Disease and Mild Cognitive Impairment an MEG Study. Alzheimer Dis. Assoc. Disord. 2010, 24, 182–189. [Google Scholar] [CrossRef] [PubMed]
- Azami, H.; Escudero, J.; Fernández, A. Refined composite multivariate multiscale entropy based on variance for analysis of resting-state magnetoencephalograms in Alzheimer’s disease. In Proceedings of the 2016 International Conference for Students on Applied Engineering (ICSAE), Newcastle upon Tyne, UK, 20–21 October 2016; pp. 413–418. [Google Scholar]
- Escudero, J.; Acar, E.; Fernández, A.; Bro, R. Multiscale entropy analysis of resting-state magnetoencephalogram with tensor factorisations in Alzheimer’s disease. Brain Res. Bull. 2015, 119, 136–144. [Google Scholar] [CrossRef]
- Poza, J.; Gómez, C.; Bachiller, A.; Hornero, R. Spectral and Non-Linear Analyses of Spontaneous Magnetoencephalographic Activity in Alzheimer’s Disease. J. Healthc. Eng. 2012, 3, 299–322. [Google Scholar] [CrossRef] [Green Version]
- Gómez, C.; Hornero, R. Entropy and complexity analyses in Alzheimer’s disease: An MEG study. Open Biomed. Eng. J. 2010, 4, 223. [Google Scholar] [CrossRef] [Green Version]
- Poza, J.; Hornero, R.; Escudero, J.; Fernández, A.; Sánchez, C.I. Regional analysis of spontaneous MEG rhythms in patients with Alzheimer’s disease using spectral entropies. Ann. Biomed. Eng. 2008, 36, 141–152. [Google Scholar] [CrossRef]
- Hornero, R.; Escudero, J.; Fernández, A.; Poza, J.; Gómez, C. Spectral and nonlinear analyses of MEG background activity in patients with Alzheimer’s disease. IEEE Trans. Biomed. Eng. 2008, 55, 1658–1665. [Google Scholar] [CrossRef] [Green Version]
- Filippi, M.; Rocca, M.A. Functional Magnetic Resonance Imaging; Sinauer Associates: Sunderland, MA, USA, 2002; Volume 1. [Google Scholar]
- Boynton, G.M.; Engel, S.A.; Glover, G.H.; Heeger, D.J. Linear Systems Analysis of Functional Magnetic Resonance Imaging in Human V1. J. Neurosci. 1996, 16, 4207–4221. [Google Scholar] [CrossRef]
- Bunce, S.C.; Izzetoglu, M.; Izzetoglu, K.; Onaral, B.; Pourrezaei, K. Functional near-infrared spectroscopy. Eng. Med. Biol. Mag. IEEE 2006, 25, 54–62. [Google Scholar] [CrossRef] [PubMed]
- Ferrari, M.; Quaresima, V. A brief review on the history of human functional near-infrared spectroscopy (fNIRS) development and fields of application. Neuroimage 2012, 63, 921–925. [Google Scholar] [CrossRef] [PubMed]
- Maxim, V.; Şendur, L.; Fadili, J.; Suckling, J.; Gould, R.; Howard, R.; Bullmore, E. Fractional Gaussian noise, functional MRI and Alzheimer’s disease. Neuroimage 2005, 25, 141–158. [Google Scholar] [CrossRef] [PubMed] [Green Version]
- Liu, F.; Guo, W.; Liu, L.; Long, Z.; Ma, C.; Xue, Z.; Wang, Y.; Li, J.; Hu, M.; Zhang, J. Abnormal amplitude low-frequency oscillations in medication-naive, first-episode patients with major depressive disorder: A resting-state fMRI study. J. Affect. Disord. 2013, 146, 401–406. [Google Scholar] [CrossRef] [PubMed]
- Niu, Y.; Wang, B.; Zhou, M.; Xue, J.; Shapour, H.; Cao, R.; Cui, X.; Wu, J.; Xiang, J. Dynamic Complexity of Spontaneous Bold Activity in Alzheimer’s Disease and Mild Cognitive Impairment Using Multiscale Entropy analysis. Front. Neurosci. 2018, 12, 677. [Google Scholar] [CrossRef] [PubMed]
- Perpetuini, D.; Bucco, R.; Zito, M.; Merla, A. Study of memory deficit in Alzheimer’s disease by means of complexity analysis of fNIRS signal. Neurophotonics 2017, 5, 011010. [Google Scholar] [CrossRef]
- Coleman, P.; Federoff, H.; Kurlan, R. A focus on the synapse for neuroprotection in Alzheimer disease and other dementias. Neurology 2004, 63, 1155–1162. [Google Scholar] [CrossRef]
- Babiloni, C.; Del Percio, C.; Bordet, R.; Bourriez, J.-L.; Bentivoglio, M.; Payoux, P.; Derambure, P.; Dix, S.; Infarinato, F.; Lizio, R. Effects of acetylcholinesterase inhibitors and memantine on resting-state electroencephalographic rhythms in Alzheimer’s disease patients. Clin. Neurophysiol. 2013, 124, 837–850. [Google Scholar] [CrossRef]
- Hasegawa, M.; Morishima-Kawashima, M.; Takio, K.; Suzuki, M.; Titani, K.A.; Ihara, Y. Protein sequence and mass spectrometric analyses of tau in the Alzheimer’s disease brain. J. Biol. Chem. 1992, 267, 17047–17054. [Google Scholar]
- Bondi, M.W.; Houston, W.S.; Eyler, L.T.; Brown, G.G. fMRI evidence of compensatory mechanisms in older adults at genetic risk for Alzheimer disease. Neurology 2005, 64, 501–508. [Google Scholar] [CrossRef] [Green Version]
- Beaunieux, H.; Eustache, F.; Busson, P.; De La Sayette, V.; Viader, F.; Desgranges, B. Cognitive procedural learning in early Alzheimer’s disease: Impaired processes and compensatory mechanisms. J. Neuropsychol. 2012, 6, 31–42. [Google Scholar] [CrossRef] [PubMed] [Green Version]


| Complexity Indices | Abbreviations | Year | Description | |
|---|---|---|---|---|
| Time domain entropy | Approximate entropy | ApEn | Pincus (1991) [51] | Needs only a small dataset and is effective for discriminating the signal from random signals. A higher value indicates more irregularity. |
| Sample entropy | SampEn | Richman (2000) [52] | The exact value of the negative average natural logarithm of the conditional probability. A higher value indicates less predictable signals. | |
| Permutation entropy | PeEn | Bandt (2002) [27] | Only considers the grades of the samples but not their metrics. A higher value indicates a more irregular signal. | |
| Multiscale entropy | MEn | Costa (2005) [53] | Can be observed at multiple different scales of signal change. | |
| Fuzzy entropy | FuzzyEn | Chen (2007) [54] | Provides a mechanism for measuring the degree to which a pattern belongs to a given class. | |
| Frequency domain entropy | Renyi entropy | ReEn | Renyi (1977) [55] | Forms the basis of the concept of generalized dimensionality. If the Renyi entropy is high, the signal has high complexity. |
| Spectral entropy | SpecEn | Powell (1979) [56] | Predictability according to an analysis of the spectral content of a signal. A high value indicates a more irregular and less predictable signal. | |
| Tsallis entropy | TsEn | Tsallis (1998) [57] | Explores the properties of a probability distribution from a new mathematical framework. | |
| Others | Hurst exponent | HE | Hurst (1951) [58] | Used to measure the long-term memory and fractal dimension of a time series. |
| Lempel-Ziv complexity | LZC | Lempel (1976) [59] | Reconstructs the original time series into a binary sequence. A high value indicates a high variation in the binary signal. | |
| Correlation dimension | D2 | Grassberger (1983) [60] | The number of independent variables needed to describe the time series dynamics after the time series is transferred to chaos theory-based state space. | |
| Fractal dimension | FD | Higuchi (1988) [61] | It complements the chaos theory of the dynamic system, showing the similarity with the whole. |
| Research | Method | Class | Sensitivity | Specificity | Accuracy | AUC |
|---|---|---|---|---|---|---|
| Sharma et al. (2019) [88] | SpecEn + FD | NC vs. MCI | 86% | 81% | 84.1% | NR |
| MCI vs. AD | 83% | 63% | 73.4% | NR | ||
| NC vs. AD | 82% | 82% | 82% | NR | ||
| Chai et al. (2019) [84] | MSE | NC vs. MCI | NR | NR | NR | 73% |
| NC vs. AD | NR | NR | NR | 81% | ||
| Fan et al. (2018) [104] | MSE | NC vs. AD | 88.71% | 69.09% | 79.49% | 83% |
| Houmani et al. (2018) [105] | EpEn (epoch-based entropy) | SCI vs. AD | 87.8% | 100% | 91.6% | NR |
| Simons et al. (2018) [75] | ApEn | NC vs. AD | 90.91% | 63.64% | 77.27% | NR |
| SampEn | 90.91% | 63.64% | 77.27% | NR | ||
| Al-Nuaimi (2018) [78] | ApEn | NC vs. AD | 72.73% | 81.82% | 77.27% | 85.95% |
| SampEn | 81.82% | 72.73% | 77.27% | 85.95% | ||
| LZC | 81.82% | 81.82% | 81.82% | 89.26% | ||
| FuzzyEn | 81.82% | 90.91% | 86.36% | 86.78% | ||
| MSE | 90.91% | 90.91% | 90.91% | 93.39% | ||
| AMI | 100% | 81.82% | 90.91% | 93.39% | ||
| HFD | 66.67% | 100% | 80% | NR | ||
| Al-Qazzaz (2016) [87] | TsEn | NC vs. AD | 85.71% | 84.62% | 85% | NR |
| LZC | 100% | 92.31% | 95% | NR | ||
| Liu et al. (2016) [77] | LZC | NC vs. AD | 80.0% | 78.1% | 78.5% | 89.21% |
| MS_LZC (multiscale_LZC) | 86.8% | 84.3% | 85.7% | 91.12% |
| Research | Method | Class | Sensitivity | Specificity | Accuracy | AUC |
|---|---|---|---|---|---|---|
| Azami et al. (2016) [121] | MFE (multiscale fuzzy entropy) | NC vs. AD | NR | NR | 78.22% | NR |
| Juan P. et al. (2016) [110] | PeEn | MCI vs. AD | NR | NR | 98.4% | NR |
| Escuderoa et al. (2015) [122] | MSE | NC vs. AD | 94.4% | 46.2% | NR | 67% |
| Gómez et al. (2014) [109] | SampEn | NC vs. AD | 80.00% | 61.90% | 70.73% | NR |
| LZC | 80.00% | 76.19% | 78.05% | NR | ||
| Bruña et al. (2012) [117] | ShEn | NC vs. AD | NR | NR | 69.4% | 79.0% |
| NC vs. MCI | NR | NR | 65.9% | 64.1% | ||
| MCI vs. AD | NR | NR | 64.8% | 69.1% | ||
| TsEn | NC vs. AD | NR | NR | 75.8% | 85.6% | |
| NC vs. MCI | NR | NR | 61.4% | 60.7% | ||
| MCI vs. AD | NR | NR | 66.7% | 75.6% | ||
| ReEn | NC vs. AD | NR | NR | 83.9% | 89.0% | |
| NC vs. MCI | NR | NR | 63.6% | 65.2% | ||
| MCI vs. AD | NR | NR | 72.2% | 78.5% | ||
| Poza et al. (2012) [123] | SampEn | NC vs. AD | 88.9% | 57.7% | 75.8% | 80.6% |
| Gómez et al. (2010) [124] | SampEn | 77.78% | 50.00% | 66.13% | 71.26% | |
| ApEn | 75.00% | 53.85% | 66.13% | 73.82% | ||
| HFD | 72.22% | 73.08% | 72.58% | 79.11% | ||
| LZC | 80.56% | 61.54% | 72.58% | 78.63% | ||
| ShEn | 91.67% | 57.69% | 77.42% | 79.27% | ||
| Hornero et al. [74] | ApEn | NC vs. AD | 75.0% | 66.7% | 70.7% | NR |
| AMI | 75.0% | 90.5% | 82.9% | NR | ||
| LZC | 85.0% | 85.7% | 85.4% | NR | ||
| Gómez et al. (2007) [112] | SampEn | NC vs. AD | 80% | 76.2% | NR | 84% |
| MSE | 75% | 100% | NR | 87.8% | ||
| Poza et al. (2008) [125] | ShEn | NC vs. AD | 85.0% | 81.0% | 82.9% | NR |
| ReEn | 90.0% | 85.7% | 87.8% | NR | ||
| Hornero et al. (2008) [126] | ApEn | NC vs. AD | 50.0% | 52.4% | 51.2% | NR |
| LZC | 65.0% | 76.2% | 70.7% | NR | ||
| SpecEn | 70.0% | 76.2% | 73.2% | NR |
© 2020 by the authors. Licensee MDPI, Basel, Switzerland. This article is an open access article distributed under the terms and conditions of the Creative Commons Attribution (CC BY) license (http://creativecommons.org/licenses/by/4.0/).
Share and Cite
Sun, J.; Wang, B.; Niu, Y.; Tan, Y.; Fan, C.; Zhang, N.; Xue, J.; Wei, J.; Xiang, J. Complexity Analysis of EEG, MEG, and fMRI in Mild Cognitive Impairment and Alzheimer’s Disease: A Review. Entropy 2020, 22, 239. https://doi.org/10.3390/e22020239
Sun J, Wang B, Niu Y, Tan Y, Fan C, Zhang N, Xue J, Wei J, Xiang J. Complexity Analysis of EEG, MEG, and fMRI in Mild Cognitive Impairment and Alzheimer’s Disease: A Review. Entropy. 2020; 22(2):239. https://doi.org/10.3390/e22020239
Chicago/Turabian StyleSun, Jie, Bin Wang, Yan Niu, Yuan Tan, Chanjuan Fan, Nan Zhang, Jiayue Xue, Jing Wei, and Jie Xiang. 2020. "Complexity Analysis of EEG, MEG, and fMRI in Mild Cognitive Impairment and Alzheimer’s Disease: A Review" Entropy 22, no. 2: 239. https://doi.org/10.3390/e22020239