Functional Linear and Nonlinear Brain–Heart Interplay during Emotional Video Elicitation: A Maximum Information Coefficient Study


Abstract
:1. Introduction
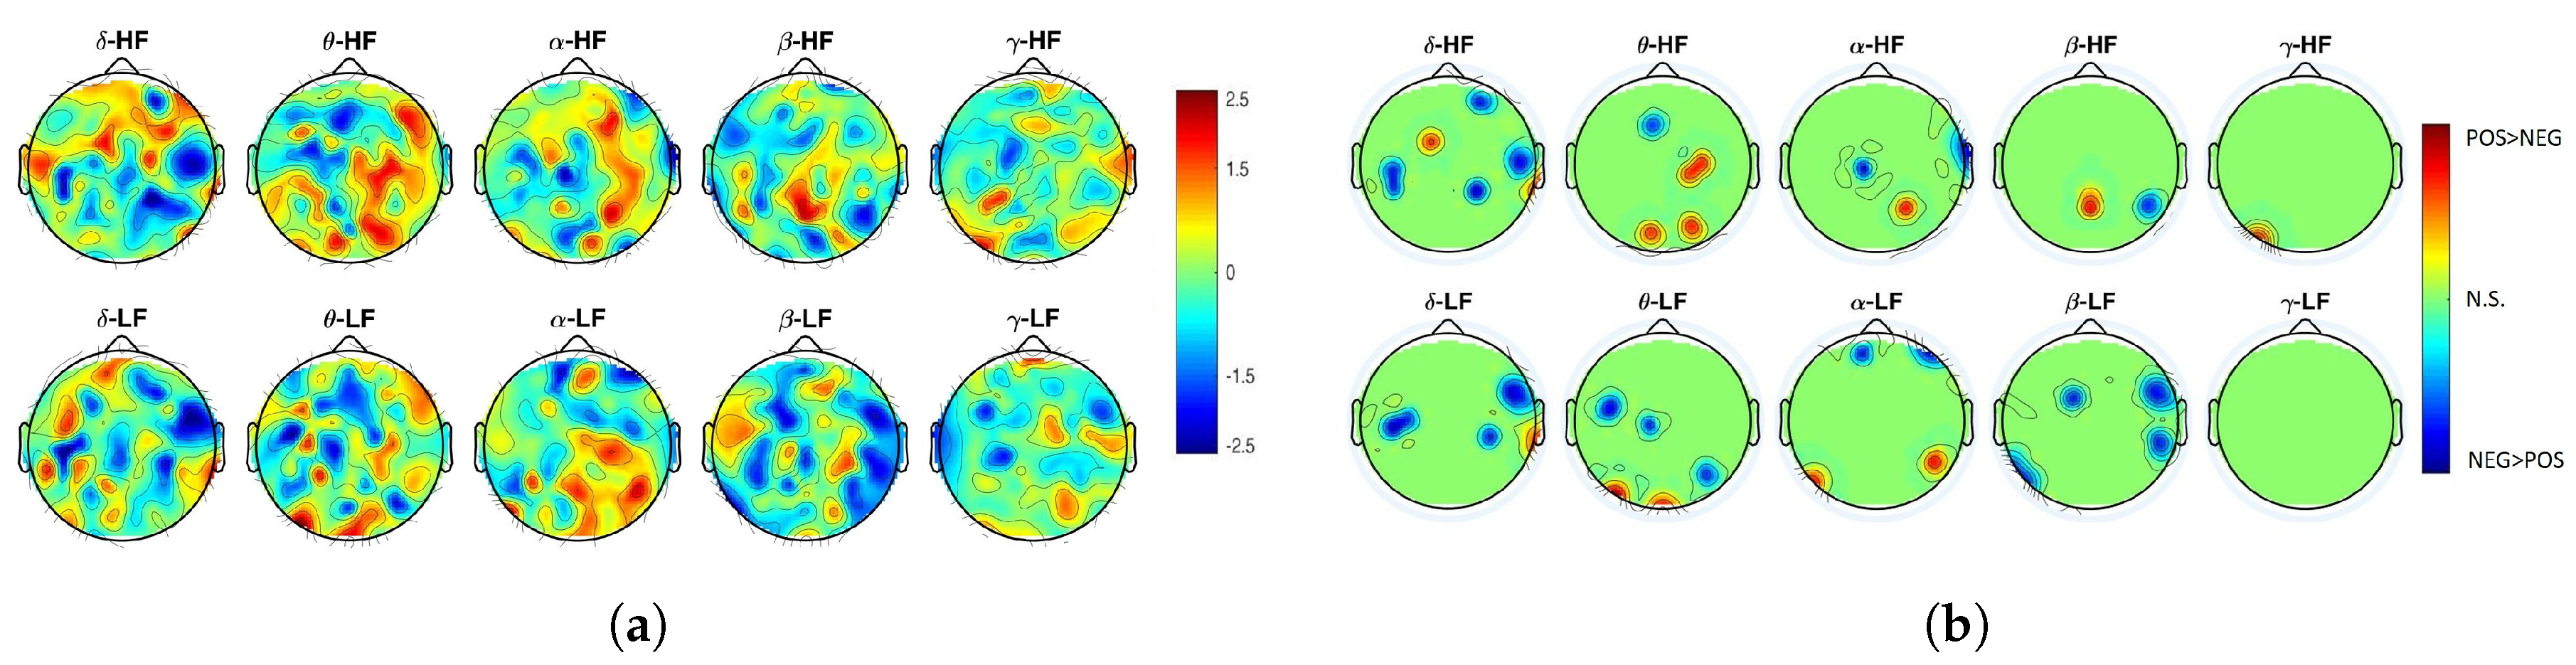
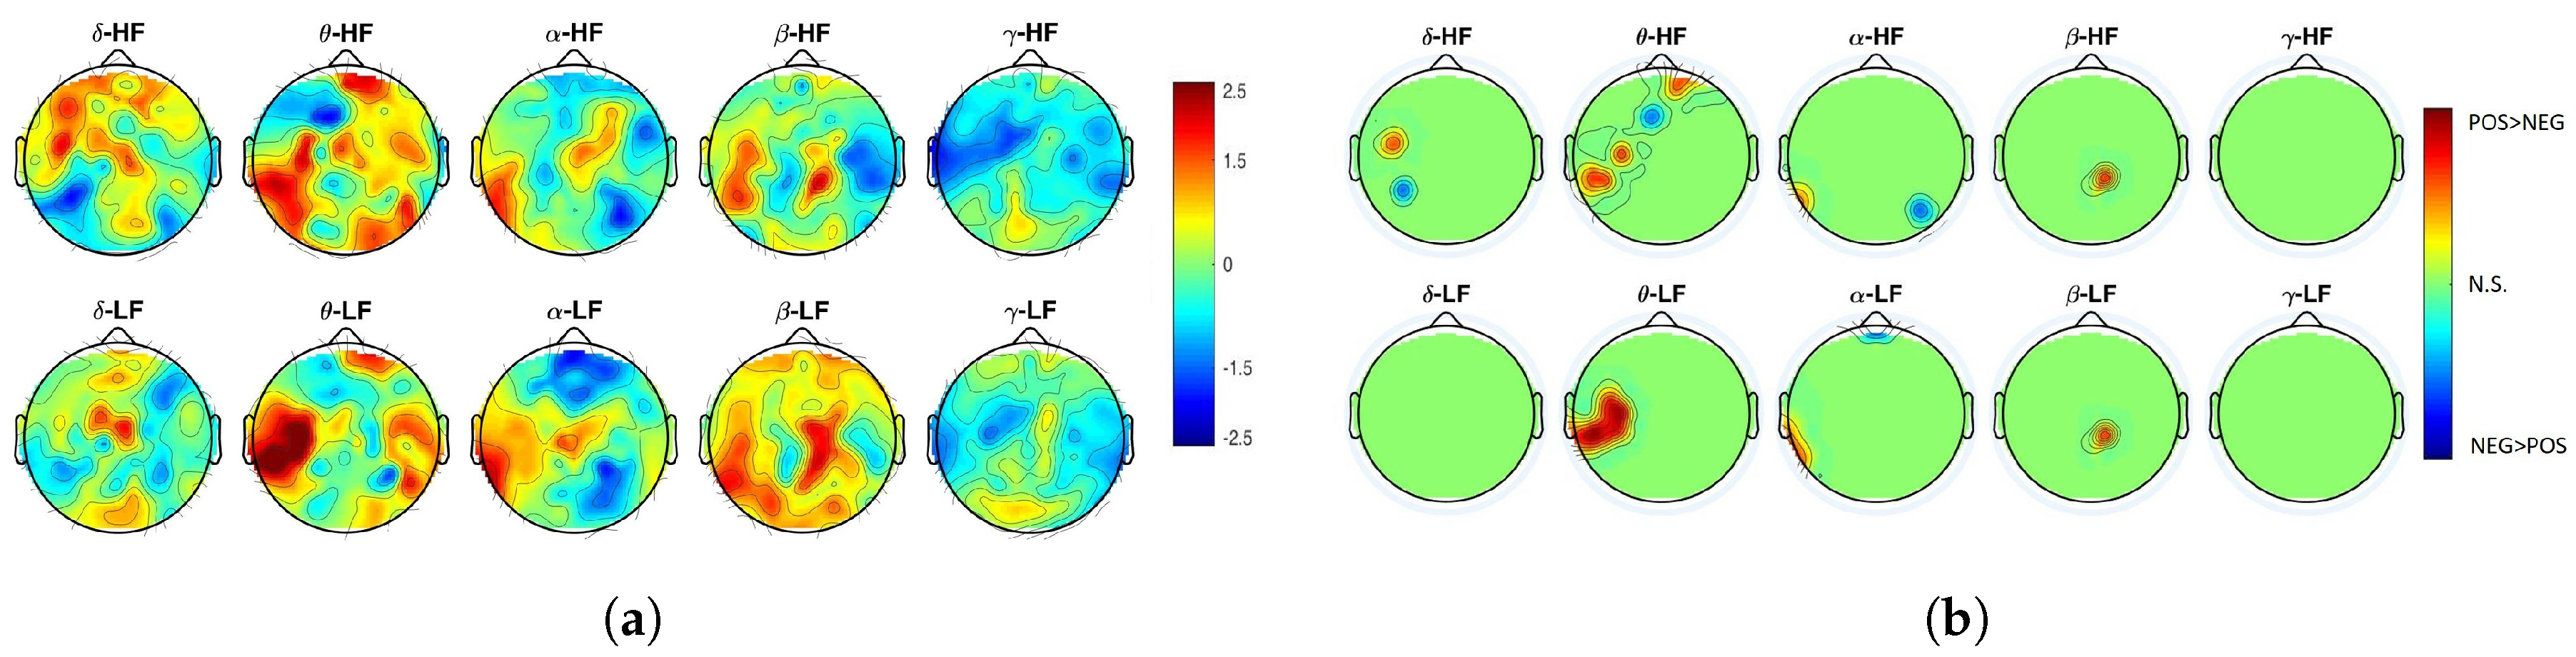
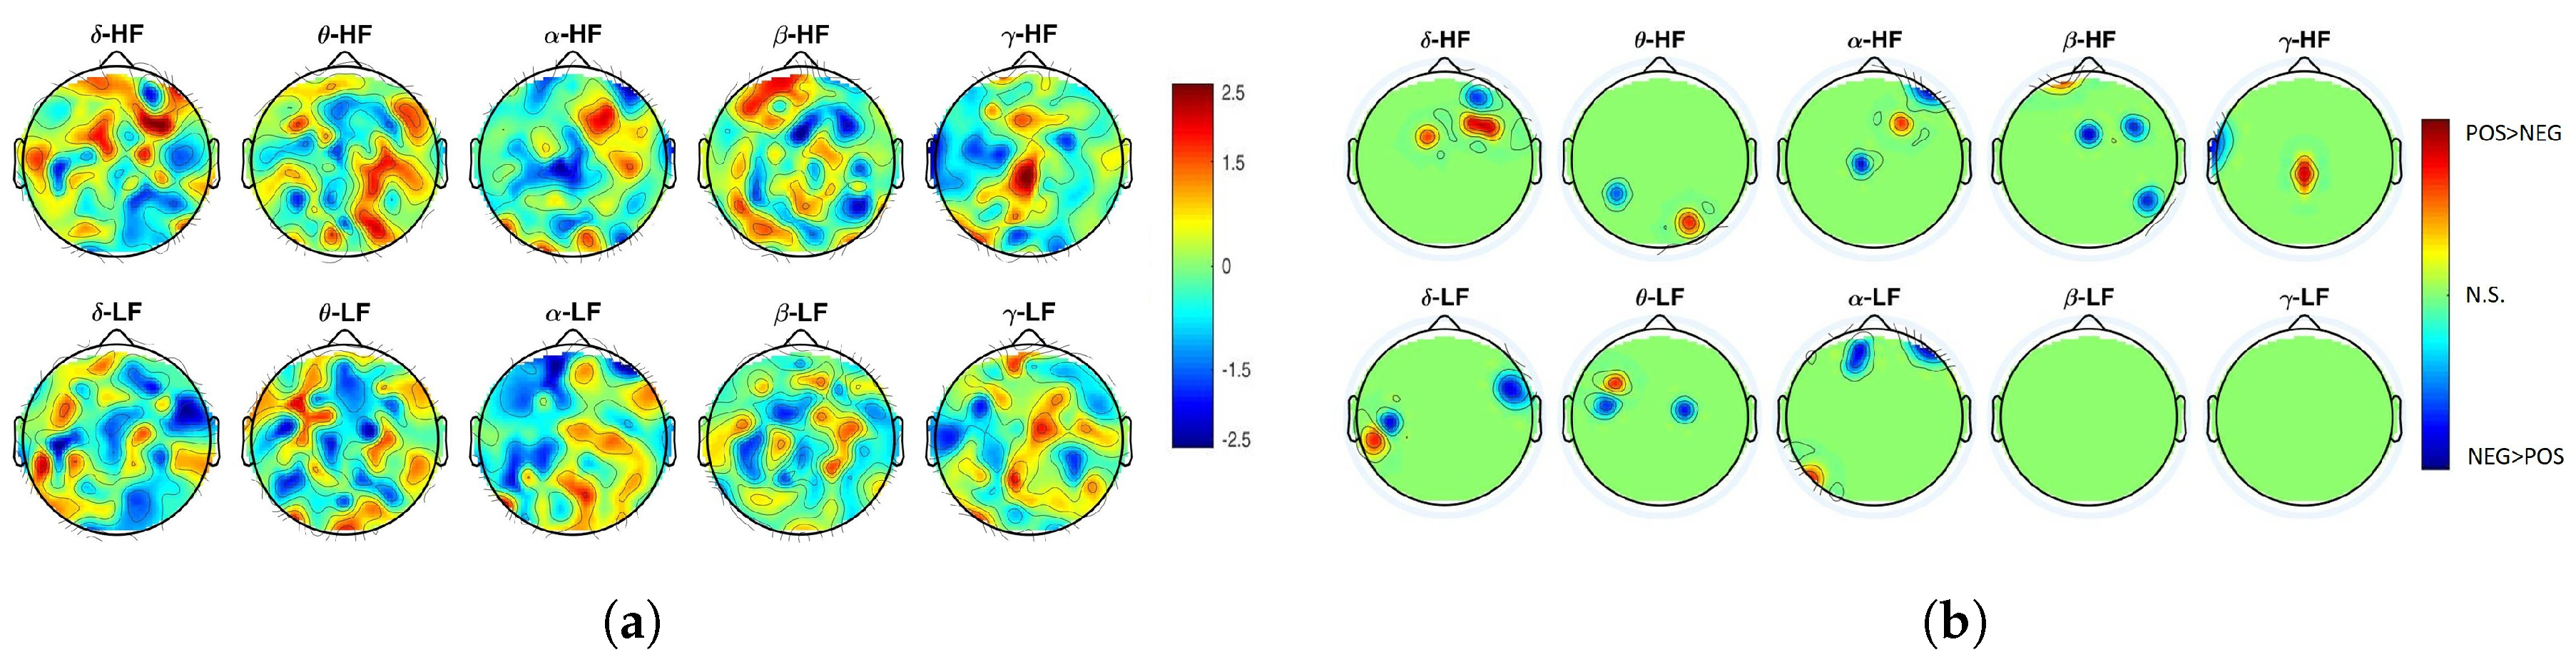
2. Results
3. Discussion
4. Conclusions
5. Materials and Methods
5.1. Experimental Setup
5.2. ECG and EEG Data Pre-Processing
5.3. EEG and HRV Time-Varying Spectra
5.4. Maximum Information Coefficient (MIC) and Linear–Nonlinear Coupling
5.5. Statistical Analysis
Supplementary Materials
Author Contributions
Funding
Conflicts of Interest
References
- Mauss, I.B.; Robinson, M.D. Measures of emotion: A review. Cogn. Emot. 2009, 23, 209–237. [Google Scholar] [CrossRef] [PubMed]
- Damasio, A.R. Emotion and the human brain. Ann. N. Y. Acad. Sci. 2001, 935, 101–106. [Google Scholar] [CrossRef]
- Kreibig, S.D. Autonomic nervous system activity in emotion: A review. Biol. Psychol. 2010, 84, 394–421. [Google Scholar] [CrossRef] [PubMed]
- Lang, P.J. The varieties of emotional experience: a meditation on James-Lange theory. Psychol. Rev. 1994, 101, 211. [Google Scholar] [CrossRef] [PubMed]
- Cannon, W.B. The James-Lange theory of emotions: A critical examination and an alternative theory. Am. J. Psychol. 1927, 39, 106–124. [Google Scholar] [CrossRef]
- Benarroch, E.E. Central autonomic control. In Primer on the Autonomic Nervous System; Elsevier: Amsterdam, The Netherlands, 2012; pp. 9–12. [Google Scholar]
- Beissner, F.; Meissner, K.; Bär, K.J.; Napadow, V. The autonomic brain: An activation likelihood estimation meta-analysis for central processing of autonomic function. J. Neurosci. 2013, 33, 10503–10511. [Google Scholar] [CrossRef] [PubMed]
- Valenza, G.; Sclocco, R.; Duggento, A.; Passamonti, L.; Napadow, V.; Barbieri, R.; Toschi, N. The central autonomic network at rest: uncovering functional MRI correlates of time-varying autonomic outflow. Neuroimage 2019, 197, 383–390. [Google Scholar] [CrossRef] [PubMed]
- Greco, A.; Faes, L.; Catrambone, V.; Barbieri, R.; Scilingo, E.; Valenza, G. Lateralization of Directional Brain-Heart Information Transfer during Visual Emotional Elicitation. Am. J. Physiol.-Regul. Integr. Comp. Physiol. 2019, 317, R25–R38. [Google Scholar] [CrossRef] [PubMed]
- Pereira, V.H.; Cerqueira, J.J.; Palha, J.A.; Sousa, N. Stressed brain, diseased heart: A review on the pathophysiologic mechanisms of neurocardiology. Int. J. Cardiol. 2013, 166, 30–37. [Google Scholar] [CrossRef] [Green Version]
- Lamm, C.; Singer, T. The role of anterior insular cortex in social emotions. Brain Struct. Funct. 2010, 214, 579–591. [Google Scholar] [CrossRef]
- Critchley, H.D.; Wiens, S.; Rotshtein, P.; Öhman, A.; Dolan, R.J. Neural systems supporting interoceptive awareness. Nat. Neurosci. 2004, 7, 189. [Google Scholar] [CrossRef] [PubMed]
- Oppenheimer, S. The anatomy and physiology of cortical mechanisms of cardiac control. Stroke 1993, 24, I3–I5. [Google Scholar] [PubMed]
- Cerqueira, J.J.; Mailliet, F.; Almeida, O.F.; Jay, T.M.; Sousa, N. The prefrontal cortex as a key target of the maladaptive response to stress. J. Neurosci. 2007, 27, 2781–2787. [Google Scholar] [CrossRef] [PubMed]
- Taggart, P.; Lambiase, P. Anger, emotion, and arrhythmias: From brain to heart. Front. Physiol. 2011, 2, 67. [Google Scholar] [CrossRef] [PubMed]
- Adair, J.R.; Manning, J.W. Hypothalamic modulation of baroreceptor afferent unit activity. Am. J. Physiol.-Leg. Content 1975, 229, 1357–1364. [Google Scholar] [CrossRef] [PubMed] [Green Version]
- Foreman, R.; Chandler, M. Vagal afferent modulation of cardiac pain. In Vagal Control of the Heart: Experimental Basis and Clinical Implications; Futura Publishing: Armonk, NY, USA, 1994; pp. 345–368. [Google Scholar]
- Frysinger, R.C.; Harper, R.M. Cardiac and respiratory correlations with unit discharge in epileptic human temporal lobe. Epilepsia 1990, 31, 162–171. [Google Scholar] [CrossRef] [PubMed]
- Kim, M.K.; Kim, M.; Oh, E.; Kim, S.P. A review on the computational methods for emotional state estimation from the human EEG. Comput. Math. Methods Med. 2013, 2013, 573734. [Google Scholar] [CrossRef] [PubMed]
- Singh, M.; Singh, M.; Gangwar, S. Emotion recognition using electroencephalography (EEG): A review. Int. J. Inf. Technol. Knowl. Manag. 2013, 7, 1–5. [Google Scholar]
- Calvo, R.A.; D’Mello, S. Affect detection: An interdisciplinary review of models, methods, and their applications. IEEE Trans. Affect. Comput. 2010, 1, 18–37. [Google Scholar] [CrossRef]
- Coan, J.A.; Allen, J.J. Handbook of Emotion Elicitation and Assessment; Oxford University Press: Oxford, UK, 2007. [Google Scholar]
- Acharya, U.R.; Joseph, K.P.; Kannathal, N.; Lim, C.M.; Suri, J.S. Heart rate variability: A review. Med Biol. Eng. Comput. 2006, 44, 1031–1051. [Google Scholar] [CrossRef]
- Hagemann, D.; Waldstein, S.R.; Thayer, J.F. Central and autonomic nervous system integration in emotion. Brain Cogn. 2003, 52, 79–87. [Google Scholar] [CrossRef]
- Thayer, J.F.; Lane, R.D. Claude Bernard and the heart–brain connection: Further elaboration of a model of neurovisceral integration. Neurosci. Biobehav. Rev. 2009, 33, 81–88. [Google Scholar] [CrossRef] [PubMed]
- Chiu, H.C.; Lin, Y.H.; Lo, M.T.; Tang, S.C.; Wang, T.D.; Lu, H.C.; Ho, Y.L.; Ma, H.P.; Peng, C.K. Complexity of cardiac signals for predicting changes in alpha-waves after stress in patients undergoing cardiac catheterization. Sci. Rep. 2015, 5, 13315. [Google Scholar] [CrossRef] [PubMed] [Green Version]
- Faes, L.; Nollo, G.; Jurysta, F.; Marinazzo, D. Information dynamics of brain–heart physiological networks during sleep. New J. Phys. 2014, 16, 105005. [Google Scholar] [CrossRef]
- Catrambone, V.; Greco, A.; Vanello, N.; Scilingo, E.; Valenza, G. Time-Resolved Directional Brain–Heart Interplay Measurement Through Synthetic Data Generation Models. Ann. Biomed. Eng. 2019, 47, 1479–1489. [Google Scholar] [CrossRef] [PubMed]
- Schulz, S.; Bolz, M.; Bär, K.J.; Voss, A. Central-and autonomic nervous system coupling in schizophrenia. Philos. Trans. R. Soc. A: Math. Phys. Eng. Sci. 2016, 374, 20150178. [Google Scholar] [CrossRef] [PubMed]
- Triggiani, A.I.; Valenzano, A.; Del Percio, C.; Marzano, N.; Soricelli, A.; Petito, A.; Bellomo, A.; Başar, E.; Mundi, C.; Cibelli, G.; et al. Resting state Rolandic mu rhythms are related to activity of sympathetic component of autonomic nervous system in healthy humans. Int. J. Psychophysiol. 2016, 103, 79–87. [Google Scholar] [CrossRef]
- Nagendra, H.; Kumar, V.; Mukherjee, S. Cognitive behavior evaluation based on physiological parameters among young healthy subjects with yoga as intervention. Comput. Math. Methods Med. 2015, 2015, 821061. [Google Scholar] [CrossRef]
- Faes, L.; Marinazzo, D.; Jurysta, F.; Nollo, G. Linear and non-linear brain–heart and brain–brain interactions during sleep. Physiol. Meas. 2015, 36, 683. [Google Scholar] [CrossRef]
- Porta, A.; Faes, L. Assessing causality in brain dynamics and cardiovascular control. Philos. Trans. Ser. A Math. Phys. Eng. Sci. 2013, 371, 20120517. [Google Scholar] [CrossRef]
- Valenza, G.; Citi, L.; Saul, J.P.; Barbieri, R. Measures of sympathetic and parasympathetic autonomic outflow from heartbeat dynamics. J. Appl. Physiol. 2018, 125, 19–39. [Google Scholar] [CrossRef] [PubMed]
- Valenza, G.; Greco, A.; Gentili, C.; Lanata, A.; Sebastiani, L.; Menicucci, D.; Gemignani, A.; Scilingo, E. Combining electroencephalographic activity and instantaneous heart rate for assessing brain–heart dynamics during visual emotional elicitation in healthy subjects. Phil. Trans. R. Soc. A 2016, 374, 20150176. [Google Scholar] [CrossRef] [PubMed]
- Bekkedal, M.Y.; Rossi III, J.; Panksepp, J. Human brain EEG indices of emotions: delineating responses to affective vocalizations by measuring frontal theta event-related synchronization. Neurosci. Biobehav. Rev. 2011, 35, 1959–1970. [Google Scholar] [CrossRef] [PubMed]
- Aftanas, L.; Varlamov, A.; Pavlov, S.; Makhnev, V.; Reva, N. Affective picture processing: Event-related synchronization within individually defined human theta band is modulated by valence dimension. Neurosci. Lett. 2001, 303, 115–118. [Google Scholar] [CrossRef]
- Knyazev, G.G.; Barchard, K.A.; Razumnikova, O.M.; Mitrofanova, L.G. The relationship of positive and negative expressiveness to the processing of emotion information. Scand. J. Psychol. 2012, 53, 206–215. [Google Scholar] [CrossRef]
- Reshef, D.N.; Reshef, Y.A.; Finucane, H.K.; Grossman, S.R.; McVean, G.; Turnbaugh, P.J.; Lander, E.S.; Mitzenmacher, M.; Sabeti, P.C. Detecting novel associations in large data sets. Science 2011, 334, 1518–1524. [Google Scholar] [CrossRef]
- Wang, S.; Zhu, Y.; Wu, G.; Ji, Q. Hybrid video emotional tagging using users’ EEG and video content. Multimed. Tools Appl. 2014, 72, 1257–1283. [Google Scholar] [CrossRef]
- Philippot, P. Inducing and assessing differentiated emotion-feeling states in the laboratory. Cogn. Emot. 1993, 7, 171–193. [Google Scholar] [CrossRef]
- Gross, J.J.; Levenson, R.W. Emotion elicitation using films. Cogn. Emot. 1995, 9, 87–108. [Google Scholar] [CrossRef]
- Soleymani, M.; Pantic, M.; Pun, T. Multimodal emotion recognition in response to videos. IEEE Trans. Affect. Comput. 2012, 3, 211–223. [Google Scholar] [CrossRef]
- Schreuder, E.; van Erp, J.; Toet, A.; Kallen, V.L. Emotional responses to multisensory environmental stimuli: A conceptual framework and literature review. SAGE Open 2016, 6. [Google Scholar] [CrossRef]
- Amrhein, V.; Greenland, S.; McShane, B. Scientists rise up against statistical significance. Nature 2019, 567, 305. [Google Scholar] [CrossRef] [PubMed]
- Wasserstein, R.L.; Schirm, A.L.; Lazar, N.A. Moving to a World Beyond p < 0.05. Am. Stat. 2019, 73, 1–19. [Google Scholar]
- Güntekin, B.; Başar, E. A review of brain oscillations in perception of faces and emotional pictures. Neuropsychologia 2014, 58, 33–51. [Google Scholar] [CrossRef] [PubMed]
- Gainotti, G. Emotions and the Right Hemisphere: Can New Data Clarify Old Models? Neurosci. 2019, 25, 258–270. [Google Scholar] [CrossRef]
- Reyes del Paso, G.A.; Langewitz, W.; Mulder, L.J.; Van Roon, A.; Duschek, S. The utility of low frequency heart rate variability as an index of sympathetic cardiac tone: A review with emphasis on a reanalysis of previous studies. Psychophysiology 2013, 50, 477–487. [Google Scholar] [CrossRef]
- Citi, L.; Brown, E.N.; Barbieri, R. A real-time automated point-process method for the detection and correction of erroneous and ectopic heartbeats. IEEE Trans. Biomed. Eng. 2012, 59, 2828–2837. [Google Scholar] [CrossRef]
- Särelä, J.; Vigário, R. Overlearning in marginal distribution-based ICA: analysis and solutions. J. Mach. Learn. Res. 2003, 4, 1447–1469. [Google Scholar]
- Gabard-Durnam, L.J.; Mendez Leal, A.S.; Wilkinson, C.L.; Levin, A.R. The Harvard Automated Processing Pipeline for Electroencephalography (HAPPE): Standardized processing software for developmental and high-artifact data. Front. Neurosci. 2018, 12, 97. [Google Scholar] [CrossRef]
- Orini, M.; Bailón, R.; Mainardi, L.T.; Laguna, P.; Flandrin, P. Characterization of dynamic interactions between cardiovascular signals by time-frequency coherence. IEEE Trans. Biomed. Eng. 2012, 59, 663–673. [Google Scholar] [CrossRef]


| Power | Units | Resting Phase | Positive Valence | Negative Valence | |
|---|---|---|---|---|---|
| EEG | |||||
| HRV | |||||
© 2019 by the authors. Licensee MDPI, Basel, Switzerland. This article is an open access article distributed under the terms and conditions of the Creative Commons Attribution (CC BY) license (http://creativecommons.org/licenses/by/4.0/).
Share and Cite
Catrambone, V.; Greco, A.; Scilingo, E.P.; Valenza, G. Functional Linear and Nonlinear Brain–Heart Interplay during Emotional Video Elicitation: A Maximum Information Coefficient Study. Entropy 2019, 21, 892. https://doi.org/10.3390/e21090892
Catrambone V, Greco A, Scilingo EP, Valenza G. Functional Linear and Nonlinear Brain–Heart Interplay during Emotional Video Elicitation: A Maximum Information Coefficient Study. Entropy. 2019; 21(9):892. https://doi.org/10.3390/e21090892
Chicago/Turabian StyleCatrambone, Vincenzo, Alberto Greco, Enzo Pasquale Scilingo, and Gaetano Valenza. 2019. "Functional Linear and Nonlinear Brain–Heart Interplay during Emotional Video Elicitation: A Maximum Information Coefficient Study" Entropy 21, no. 9: 892. https://doi.org/10.3390/e21090892