Macroscopic Cluster Organizations Change the Complexity of Neural Activity

 , ,
, ,
Abstract
:1. Introduction
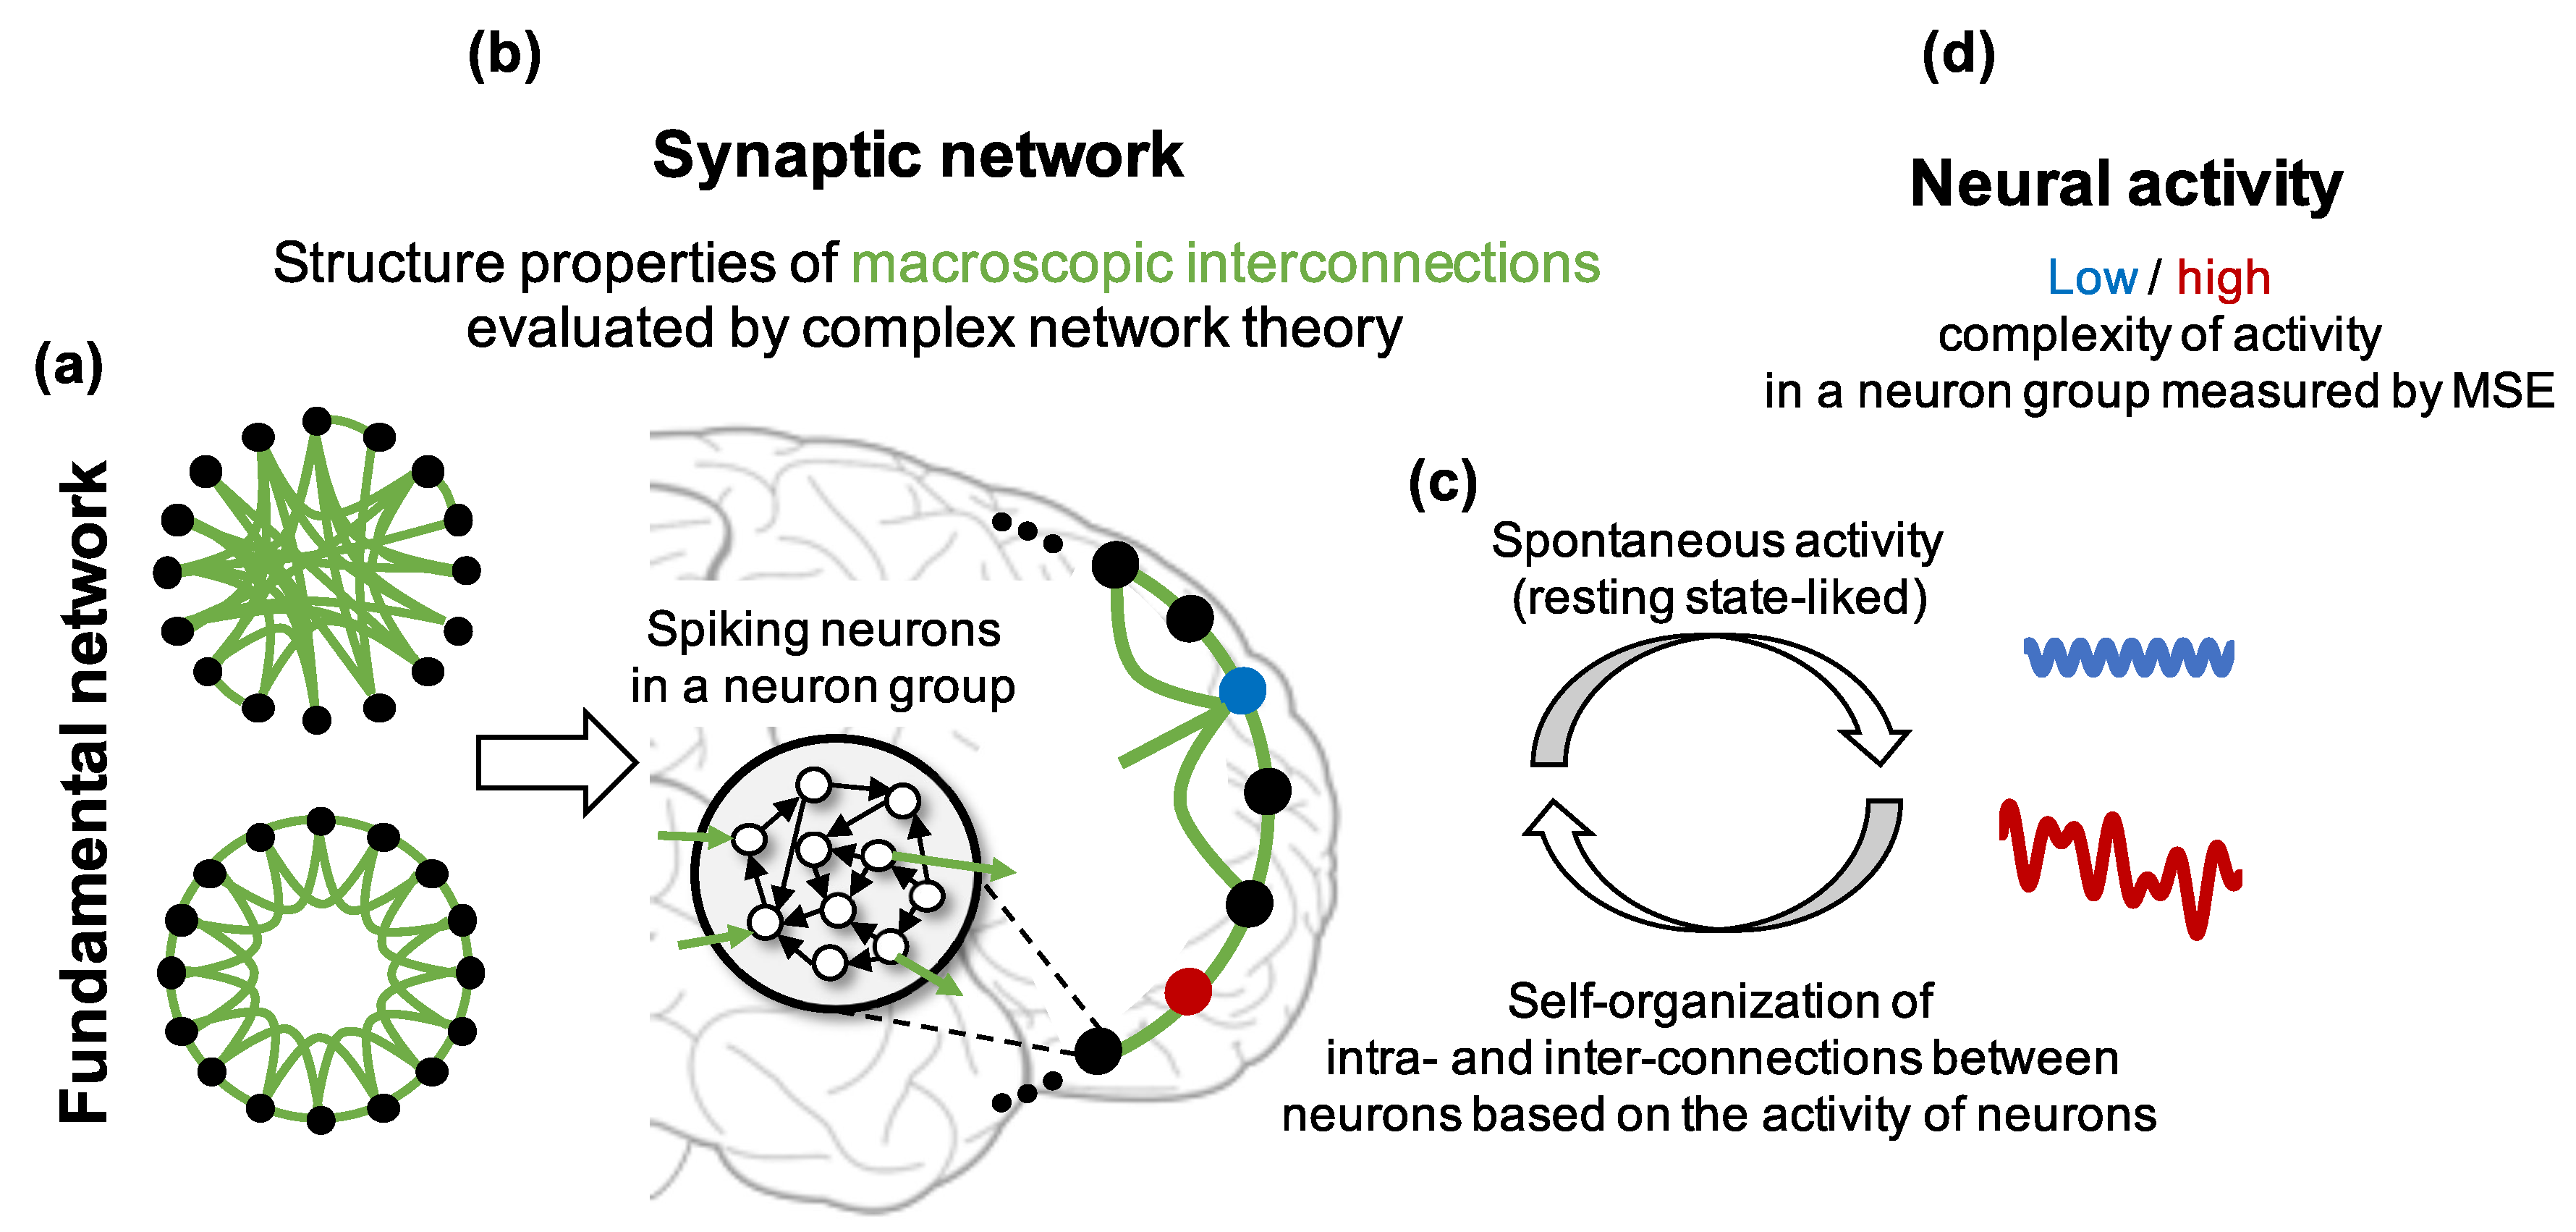
- Construct neuron groups consisting of spiking neurons that have weighted connections to randomly selected neurons in the same neuron group (intraconnections). We assumed that a neuron group and the intraconnections inside it correspond to a brain region and the intraconnections in the regions, respectively.
- Determine the initial macroscopic network structure of neuron groups (fundamental network) based on the WS model. Then, if an edge exists between two neuron groups in the fundamental network, construct synaptic connections from the neurons in the group to the neurons in the other group (interconnections). We assumed that the average of interconnections between neuron groups correspond to the long-ranged interconnectivity between brain regions (synaptic network, Figure 1b).
- Apply a plasticity rule to synaptic weights and self-organize the network (Figure 1c). If an edge does not exist between two neuron groups in the fundamental network, the weights between them remain zero to keep the given small-world structure.
- Analyze the complexity of the activity and structural properties of the self-organized synaptic network using MSE and complex network theory to show their relationship (Figure 1d).
- Investigate the frequency characteristics, firing rate, and intraconnections in each neuron group to explore the possible mechanisms of decrease in the complexity of neural activity.
2. Materials and Methods
2.1. Spiking Neural Network Model
2.1.1. Neuron Model
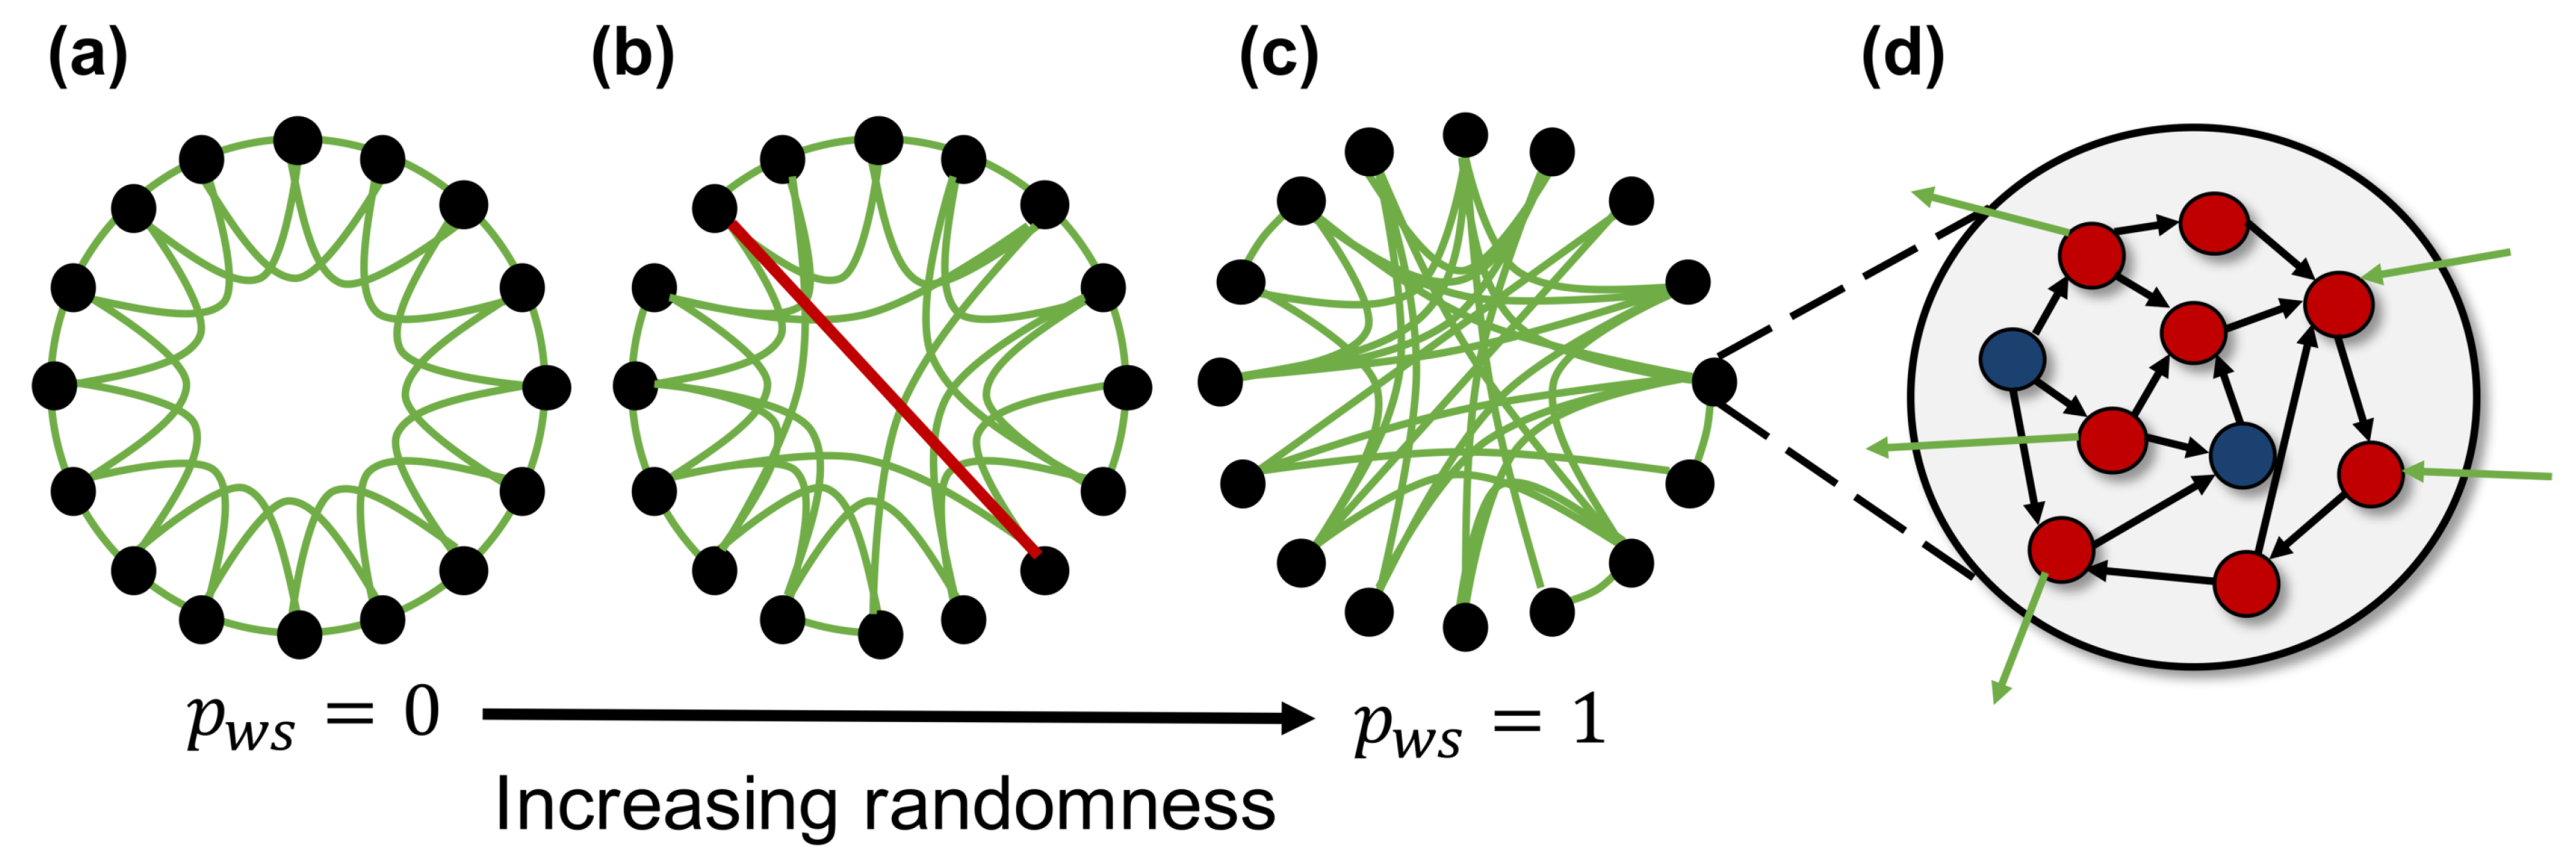
2.1.2. Construction of Fundamental Network Using the Watts and Strogatz Model
- Construct a lattice (regular) network, where each neuron group is connected to k neighboring neuron groups (Figure 2a). the lattice network has numerous clusters and a long path length.
- Randomly rewire each edge according to a rewiring probability, . This creates a shortcut between neuron groups, as shown by the red line in Figure 2b. The network structure becomes random, and the number of clusters and path length decrease as increases (Figure 2c). The typical value of used to construct the small-world network is between and .
2.2. Parameters and Simulation Setting
2.3. Analysis Method for Neural Activity and Network Structure
2.3.1. Analysis Method for Complexity of Neural Activity
2.3.2. Analysis Method for Neural Activation in Neuron Groups
2.3.3. Complex Network Analyses of Structural Properties
- Clustering coefficient: The proportion of connections with the shape of a closed triplet over all possible combinations of triplets formed by three nodes in a network. This is defined as follows:
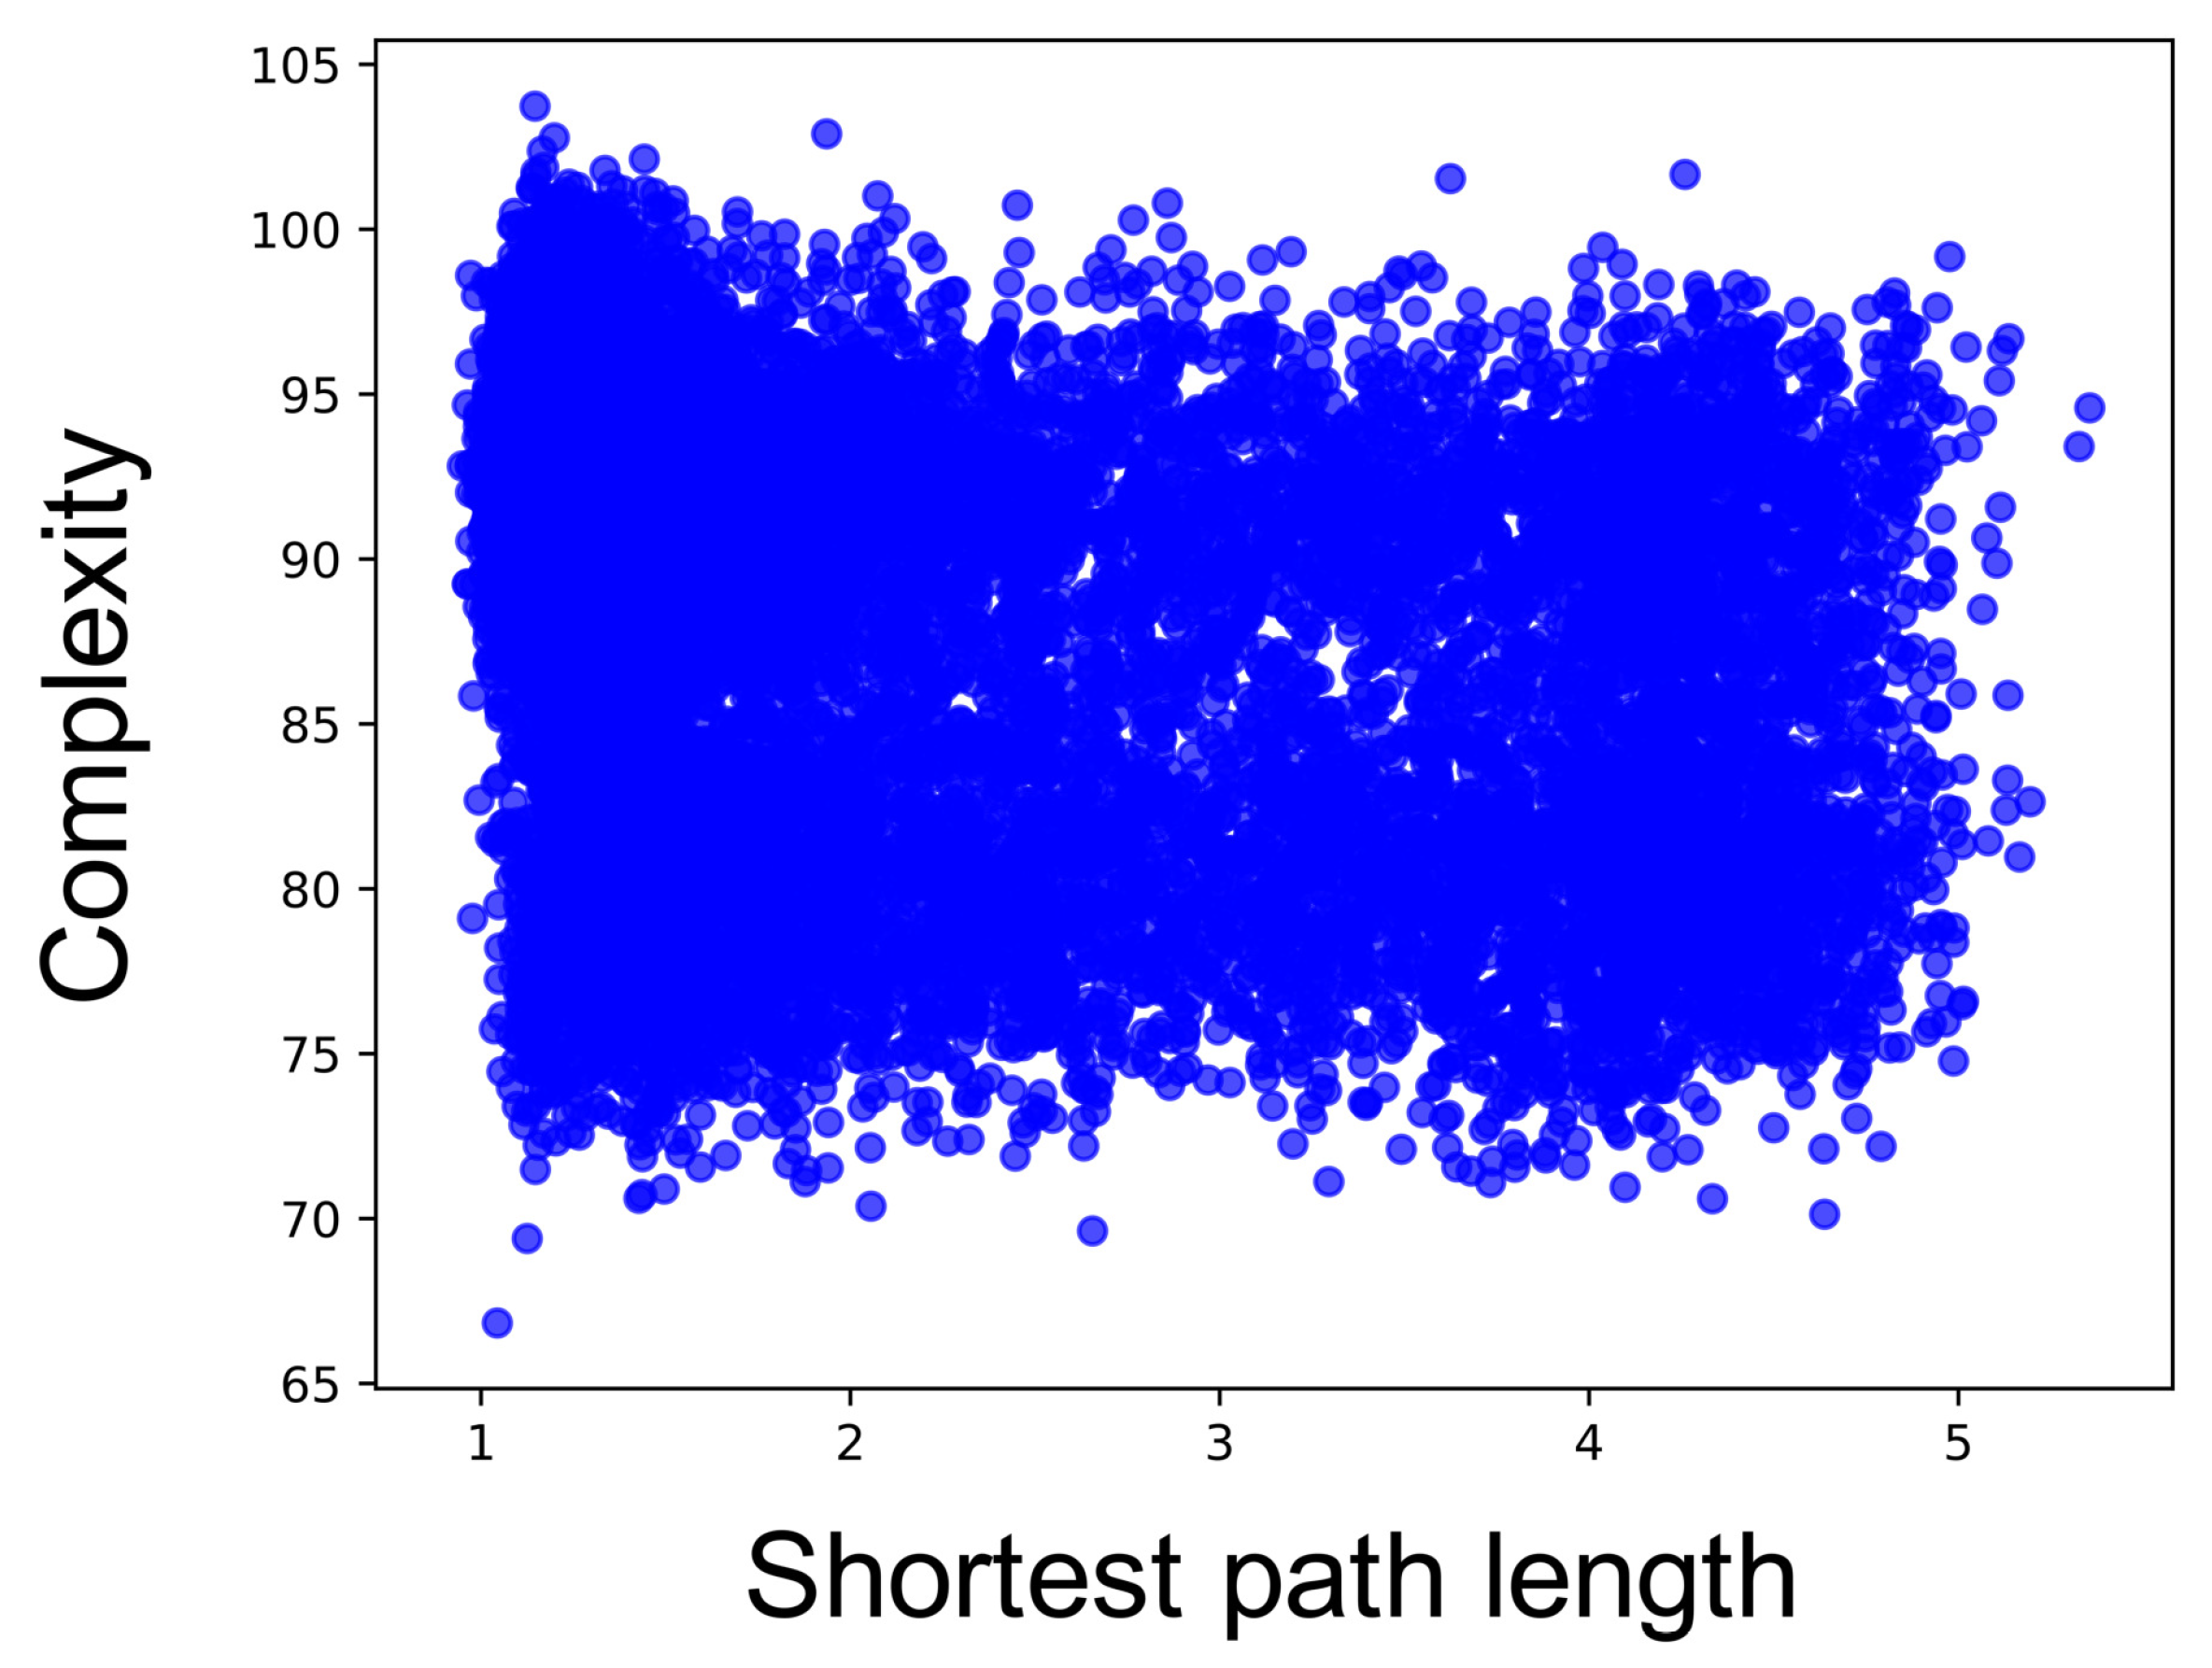
- Average shortest path length: the shortest path length is defined as the minimum number of steps required to pass from one node to another node in a network [26].
- Degree centrality: it refers to the number of connections of a node [27].
3. Results
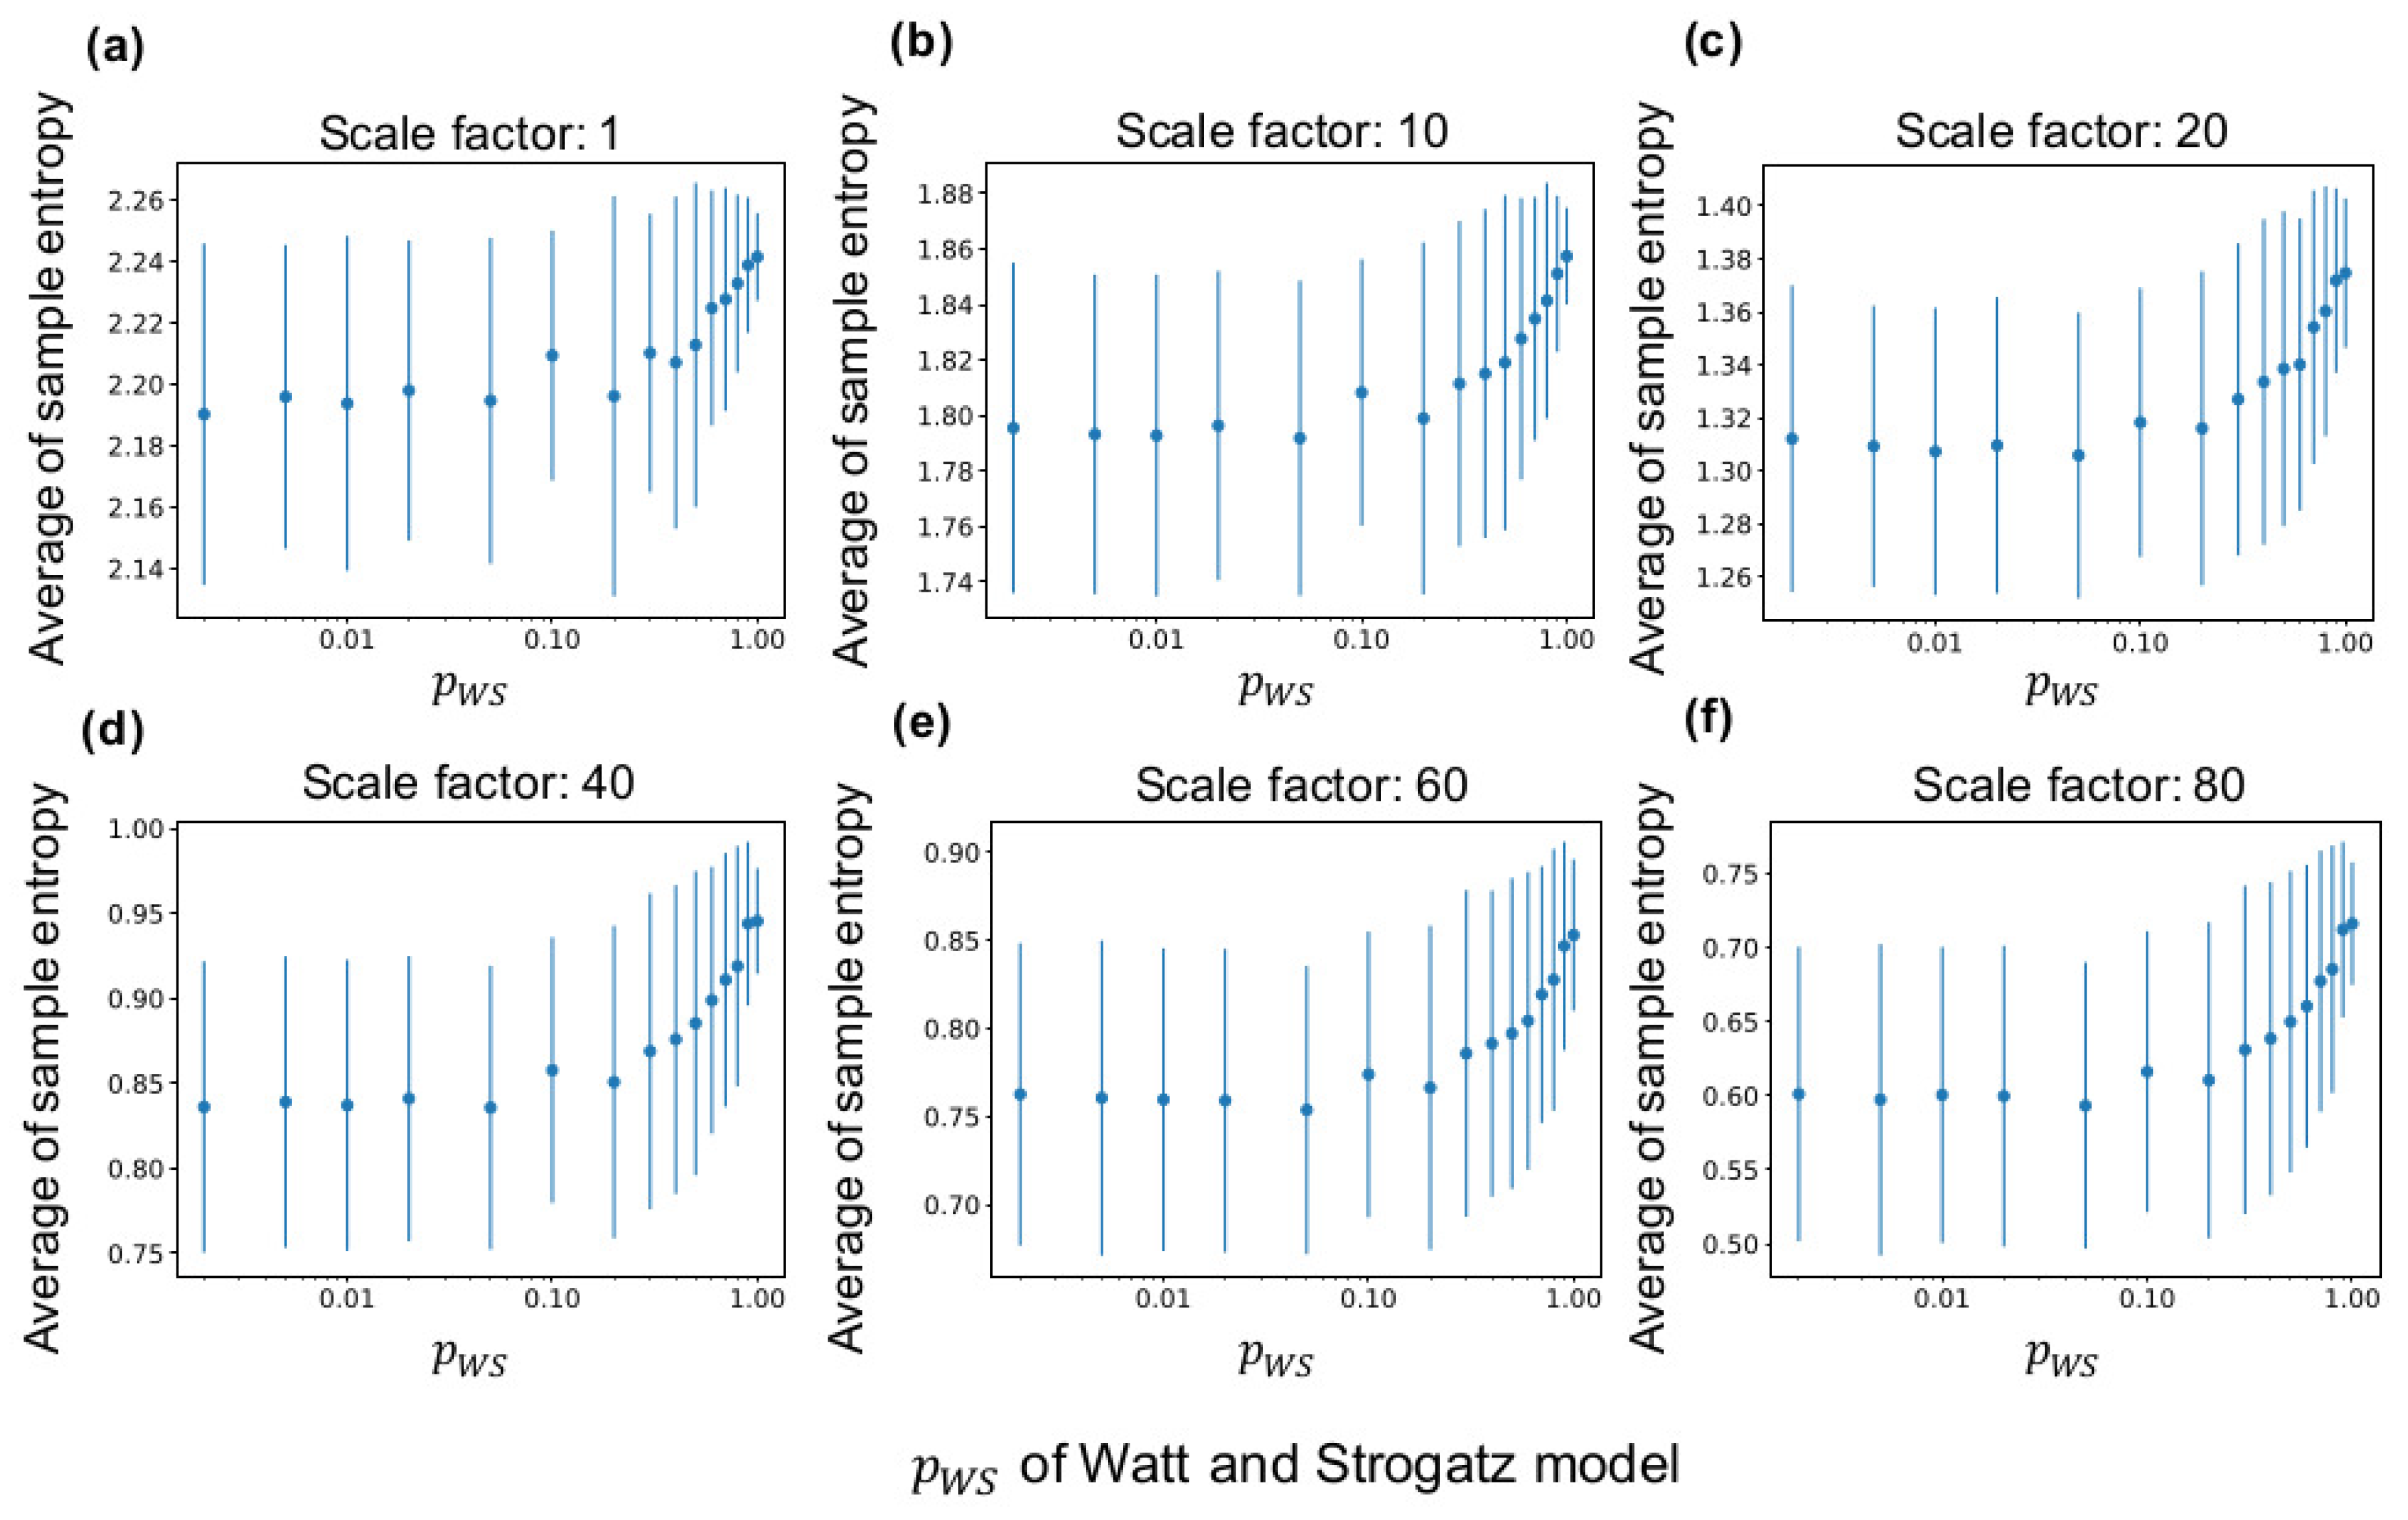
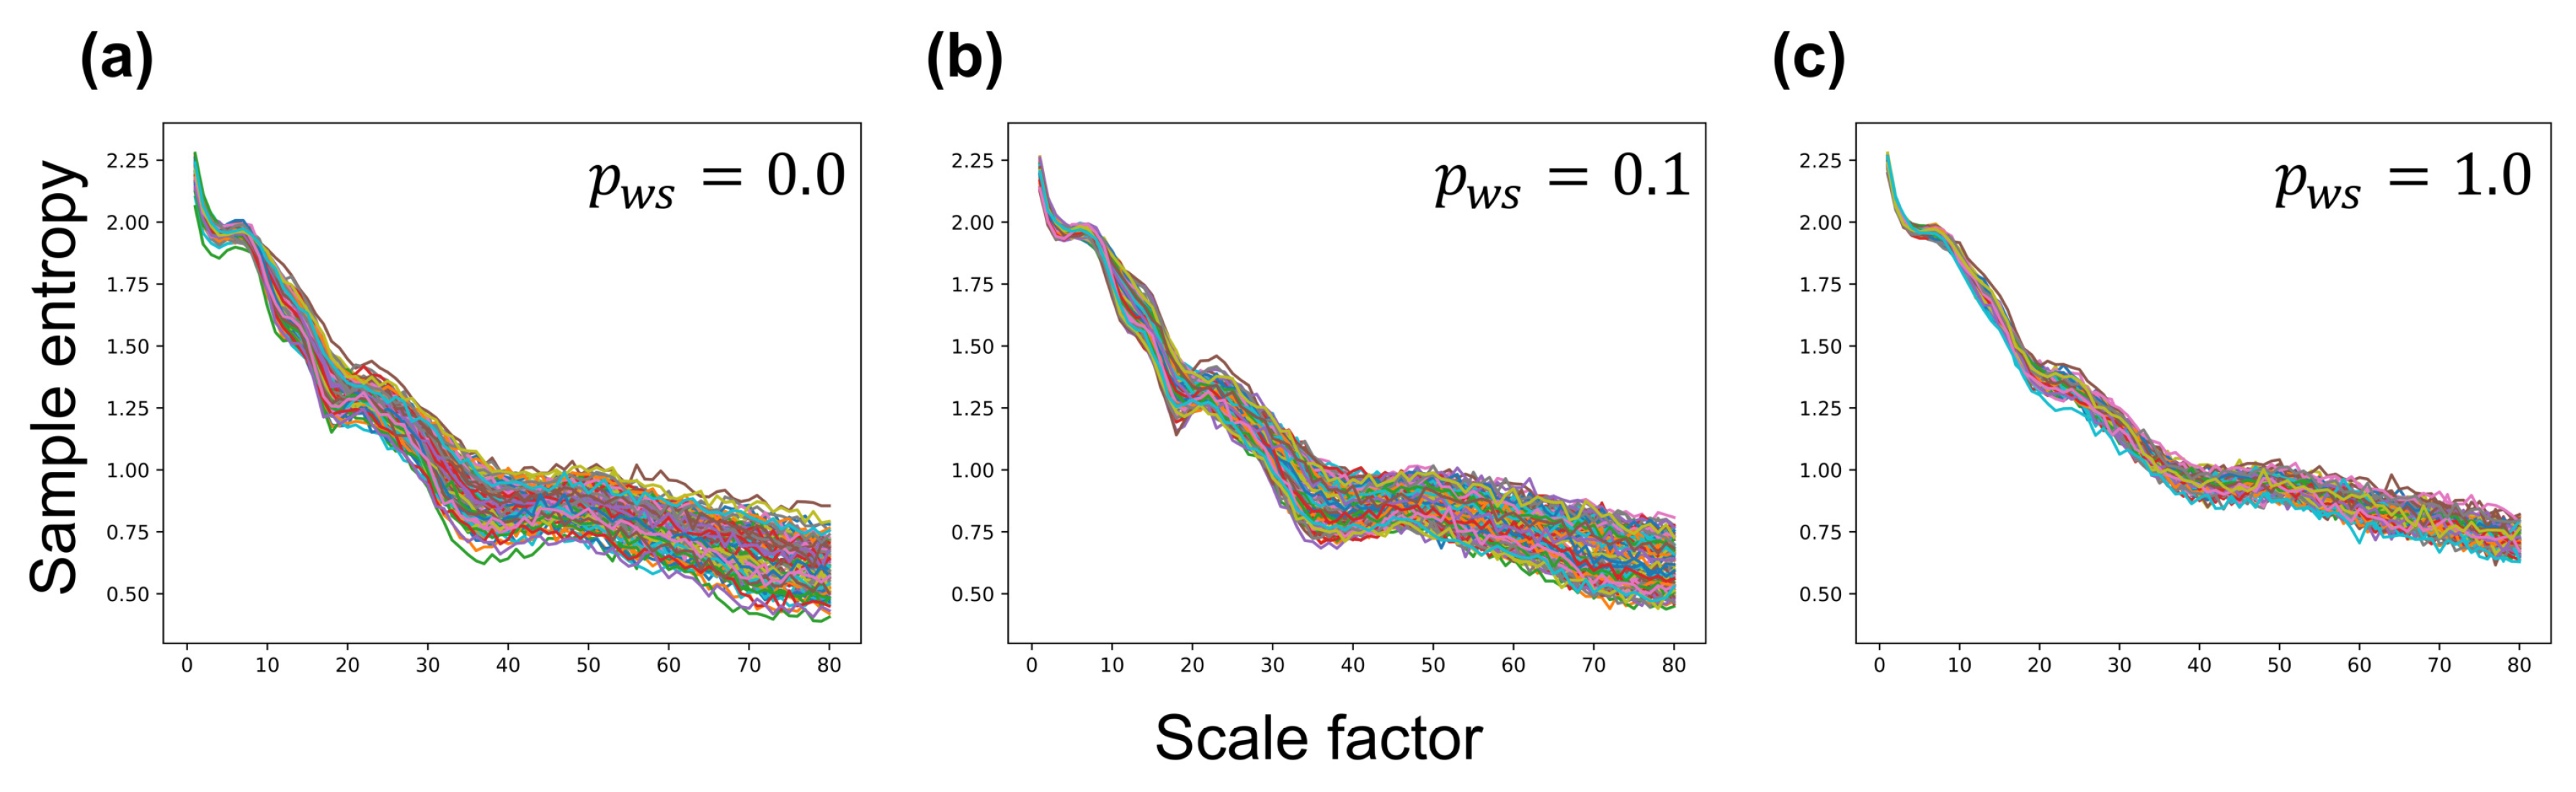
- The analysis of MSE showed that each neuron group had different levels of the complexity of neural activity and the average complexity of all neuron groups decreased if the fundamental network had small (Section 3.1).
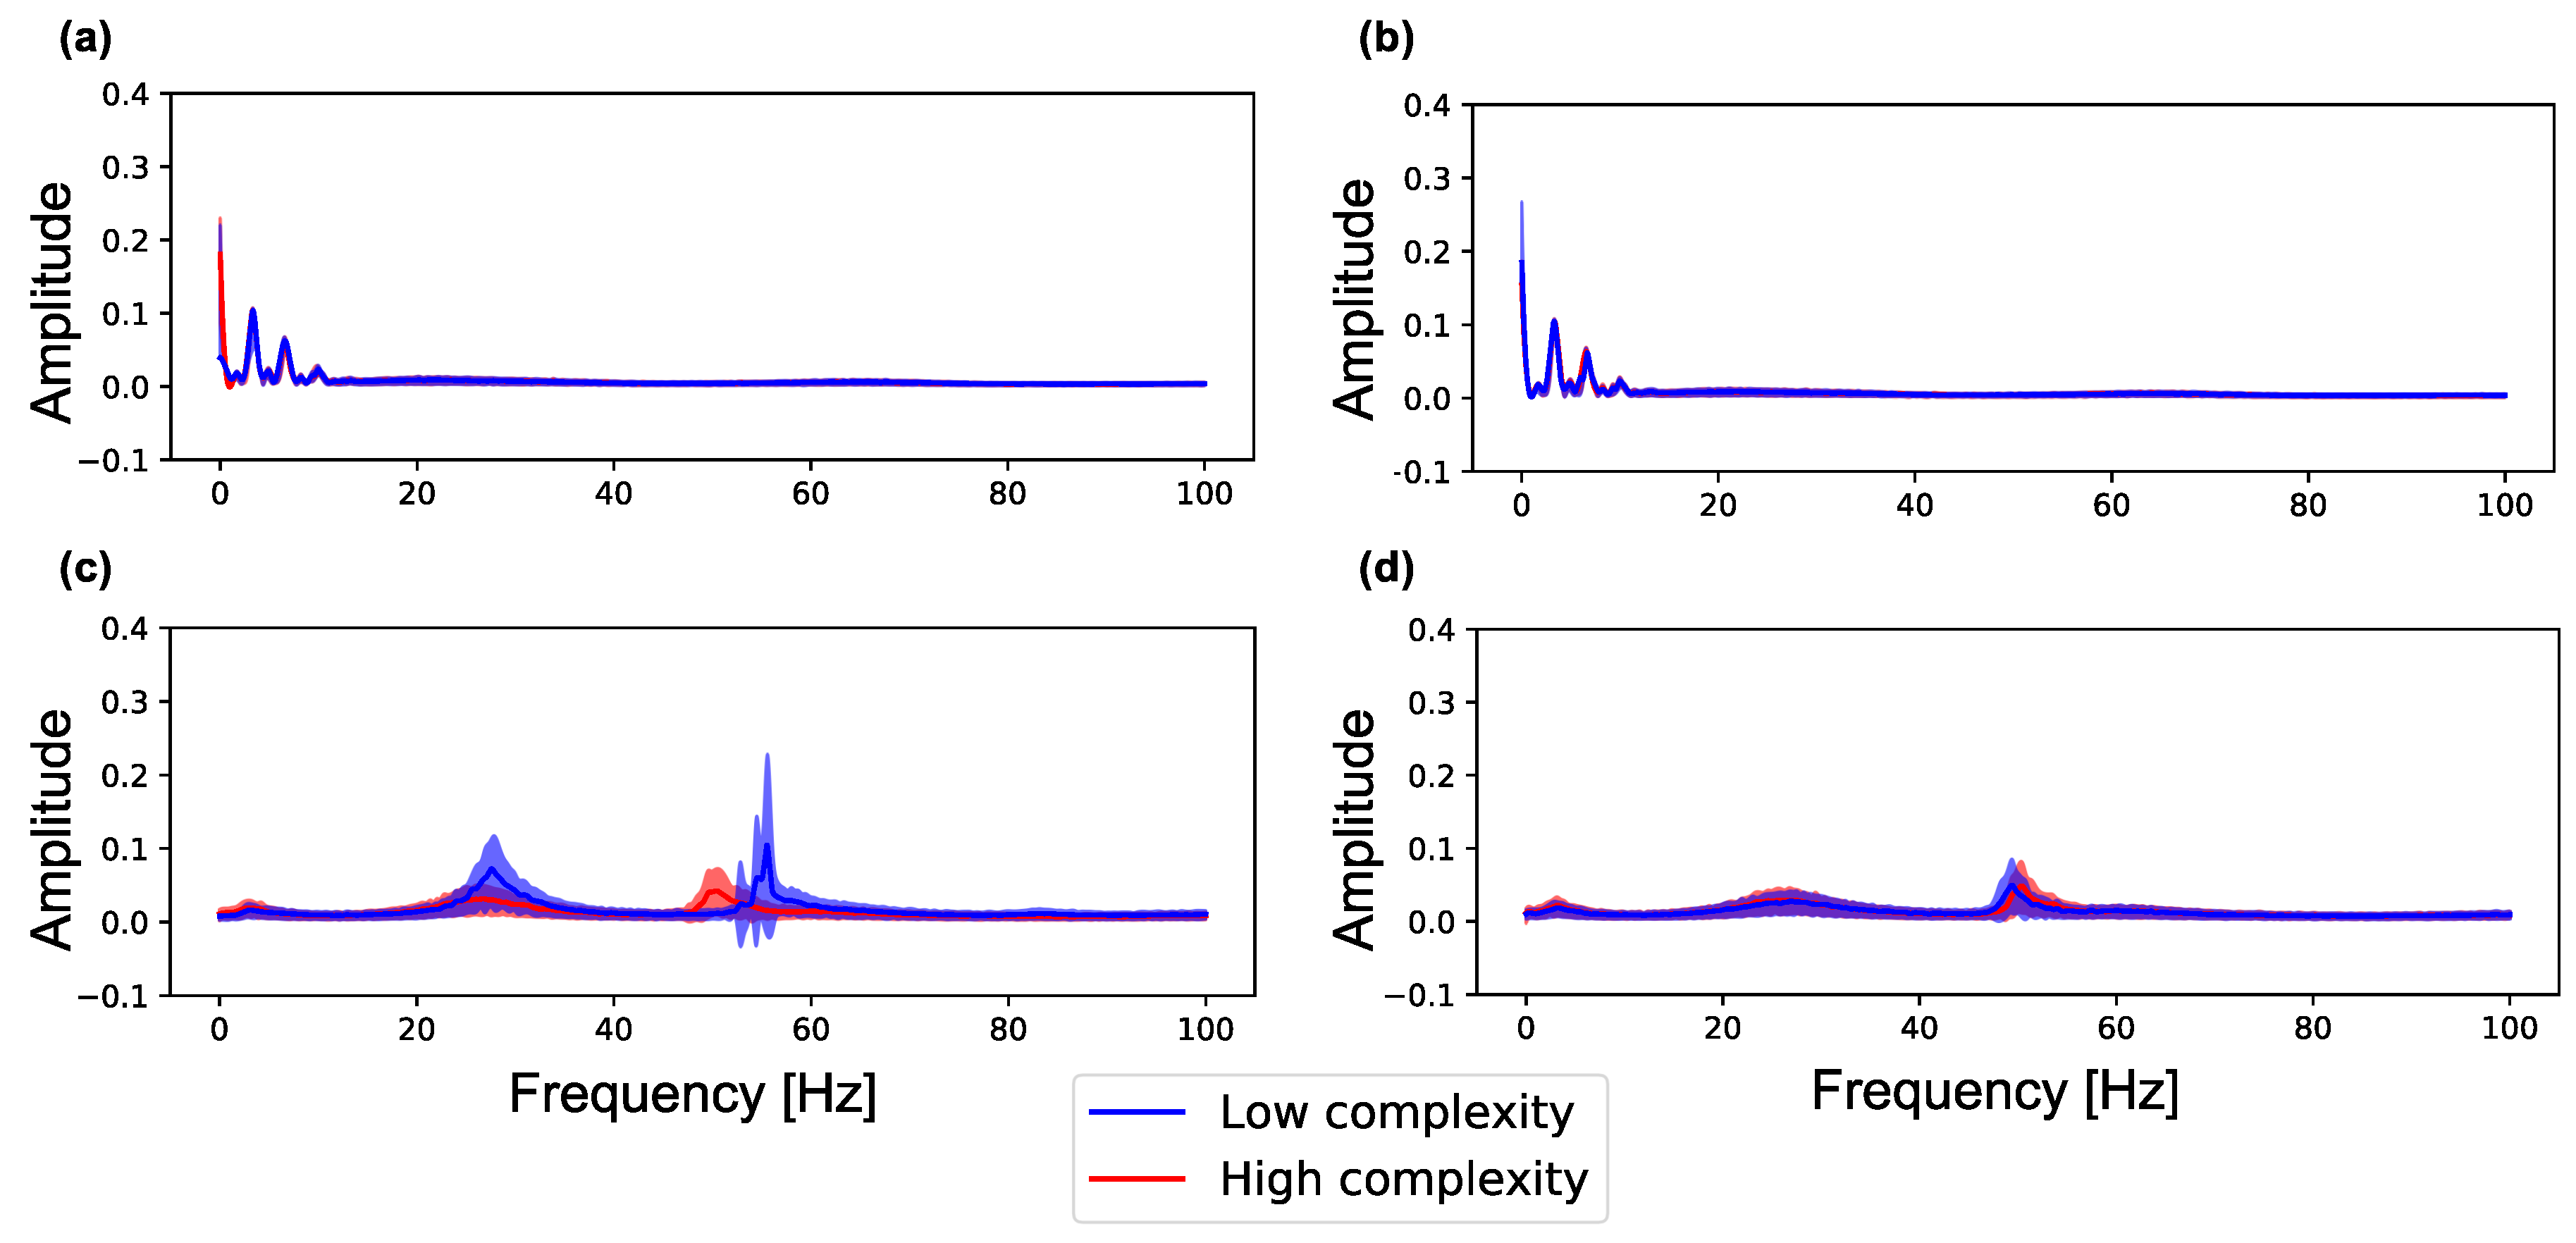
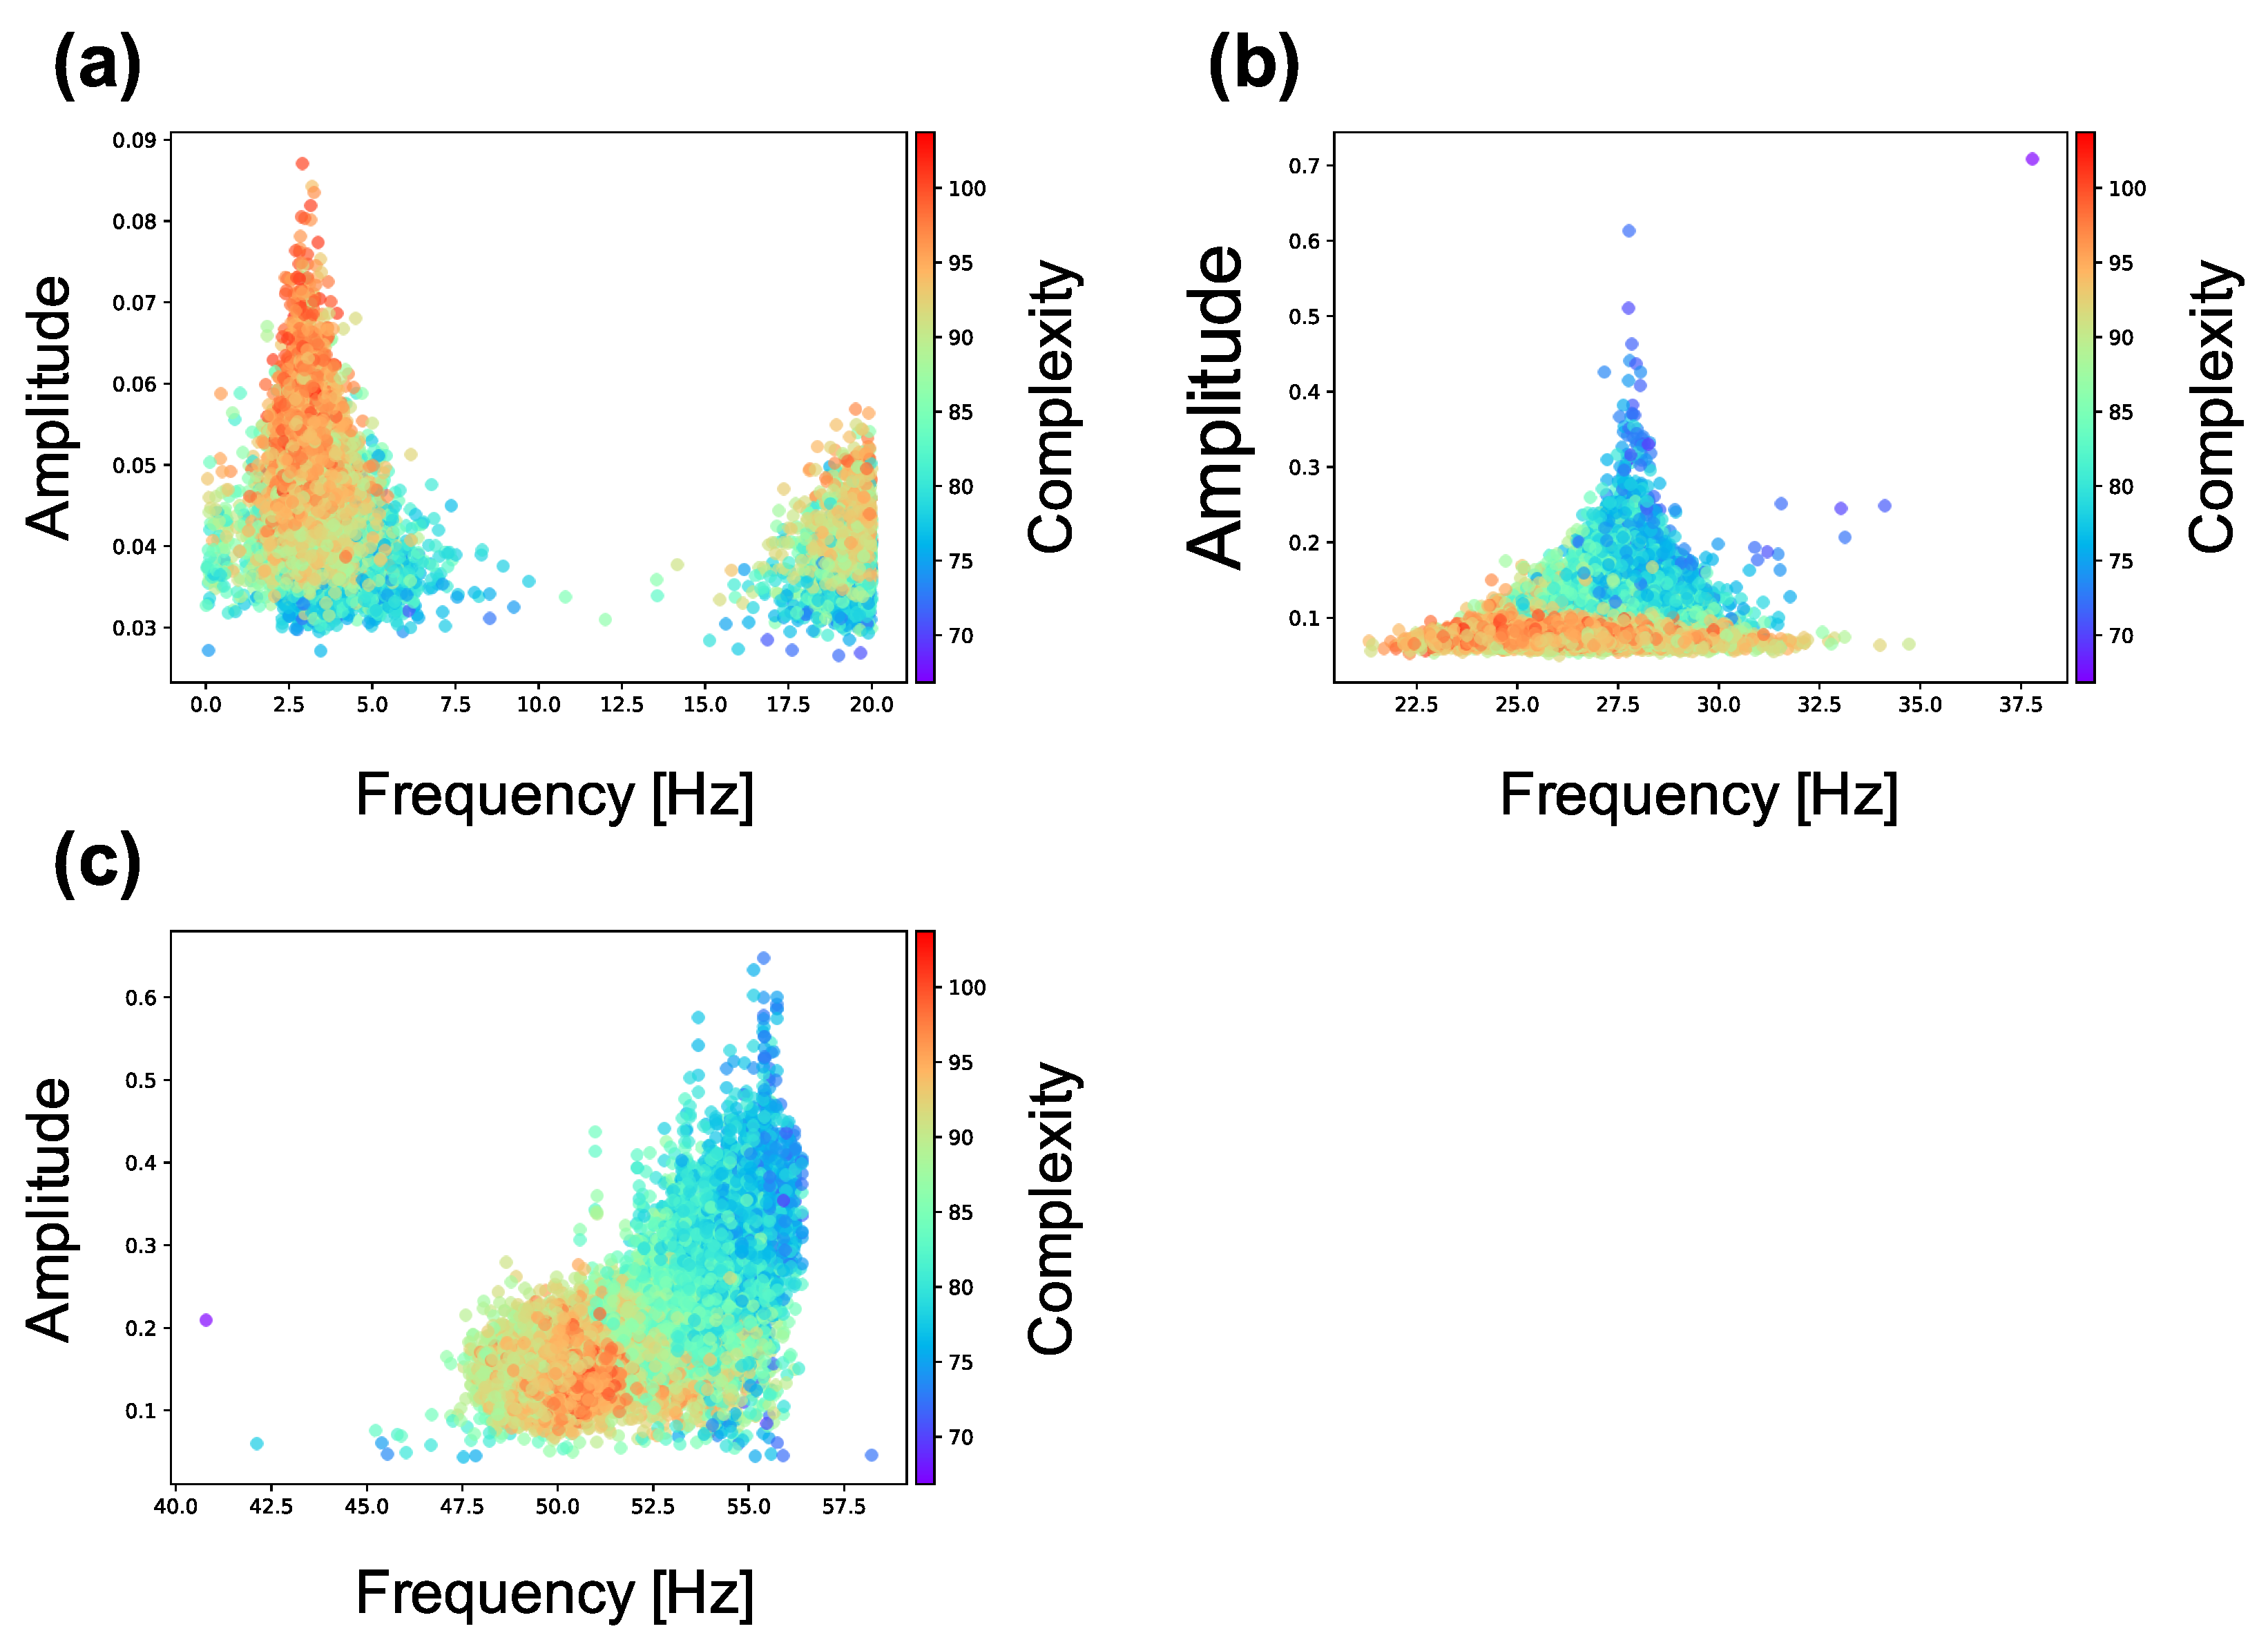
- The analysis of neural activity in neuron groups with different values of MSE showed that a neuron group with low complexity exhibited increased signal amplitude in two frequency bands (20–40 and 40–60 Hz) of neural activity (Section 3.2).
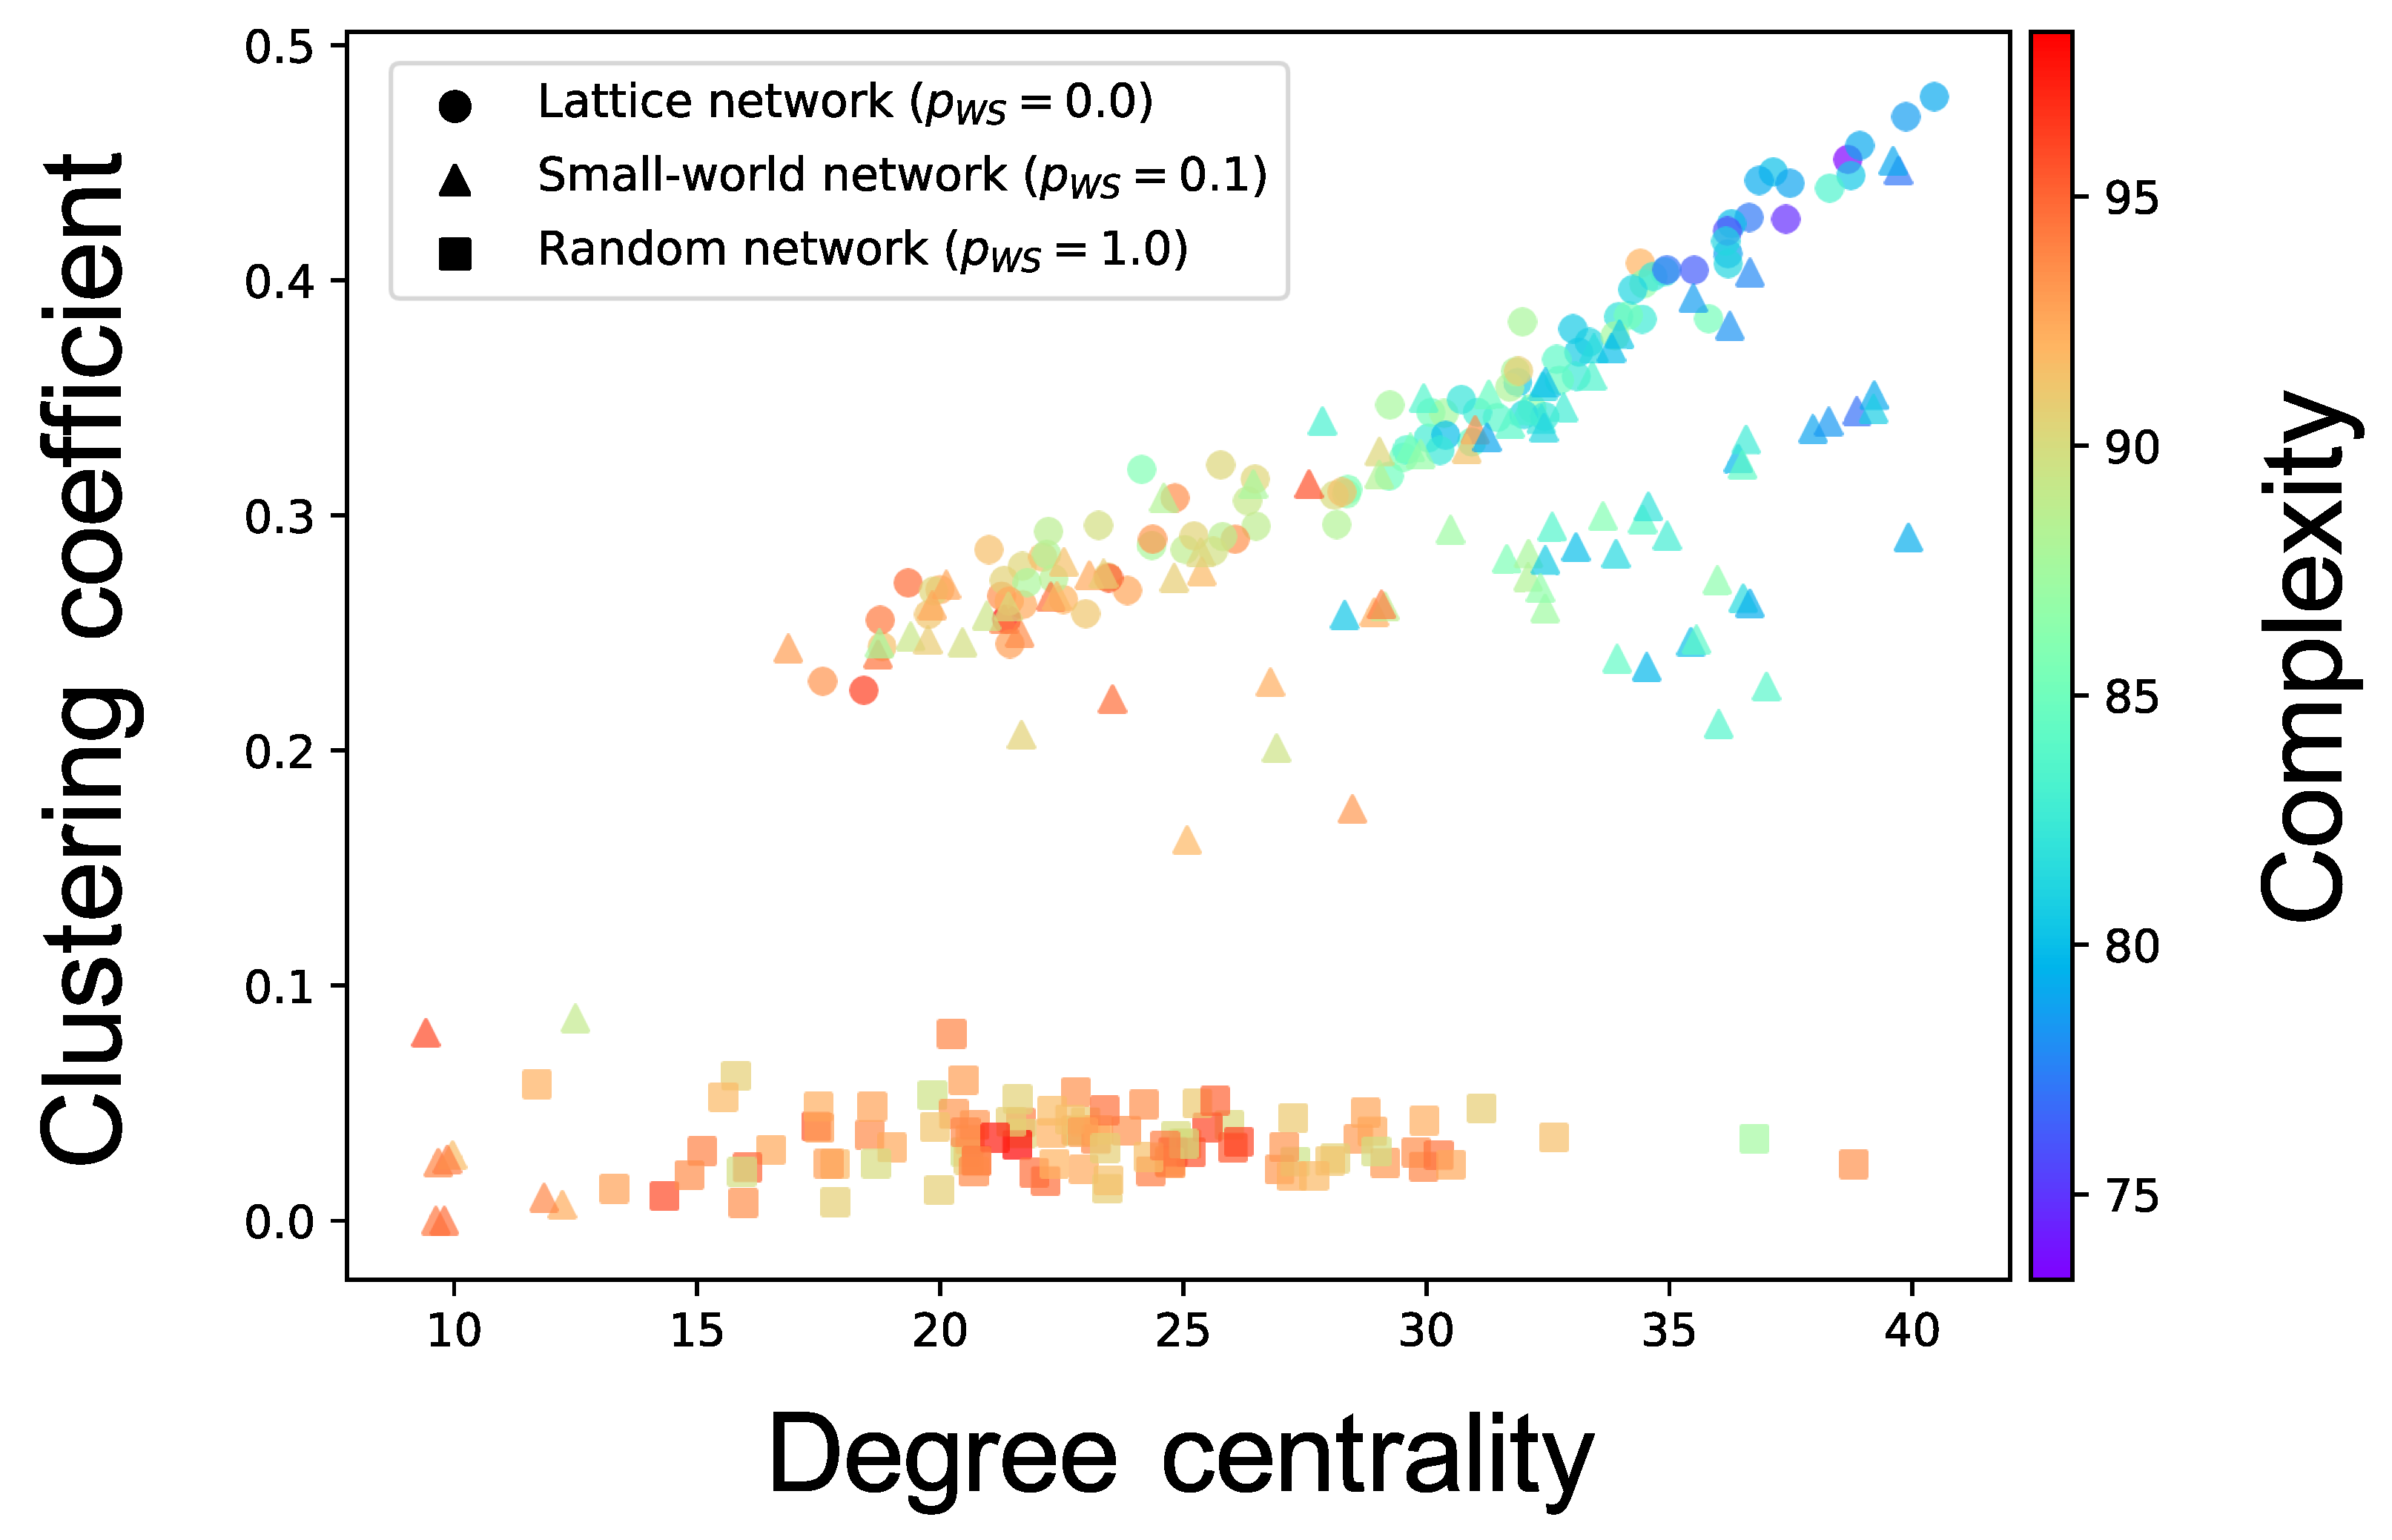
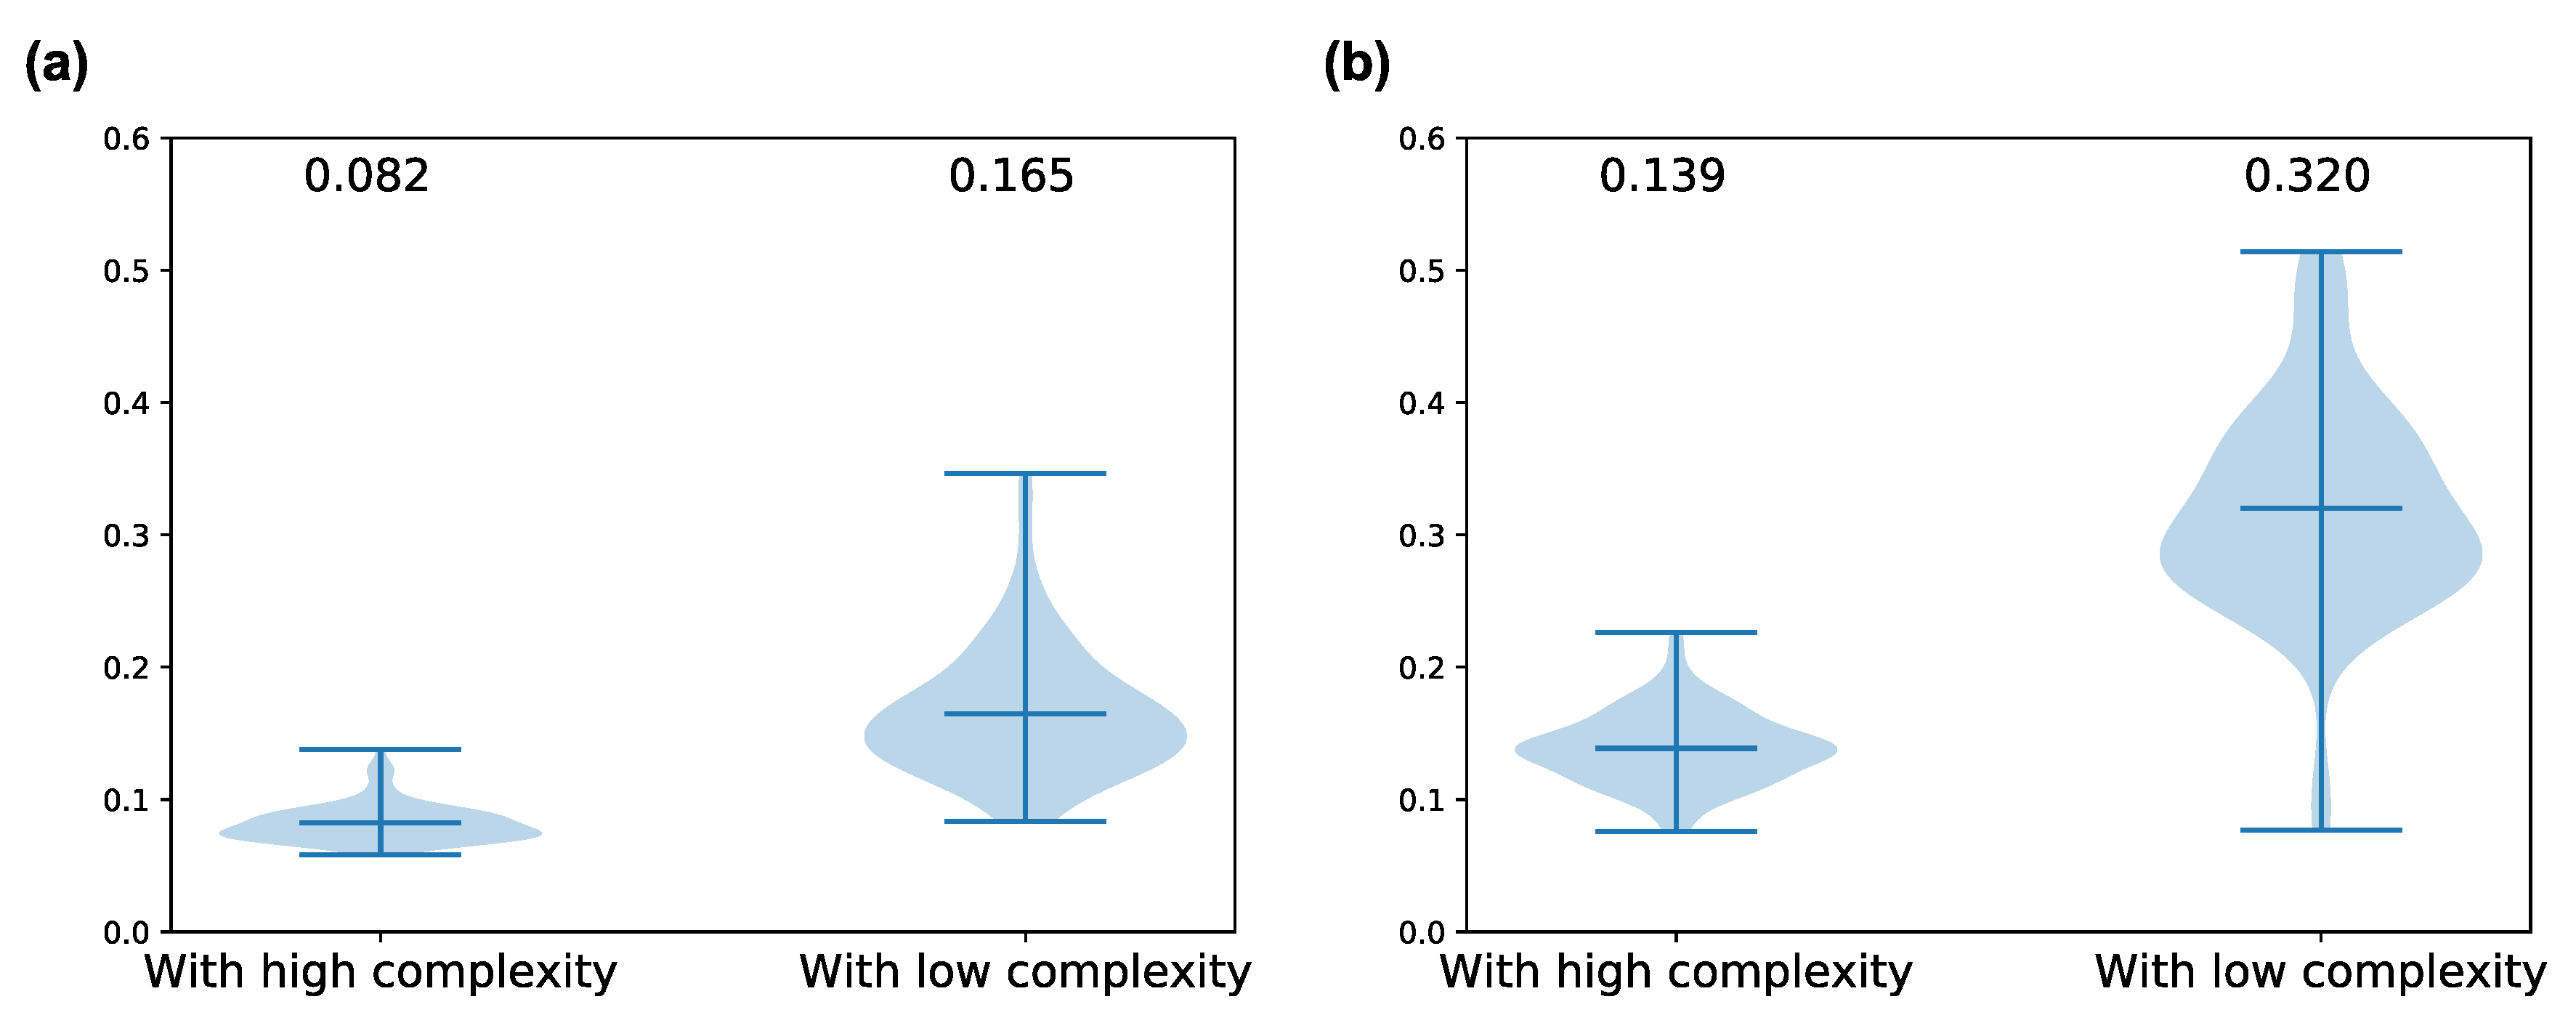
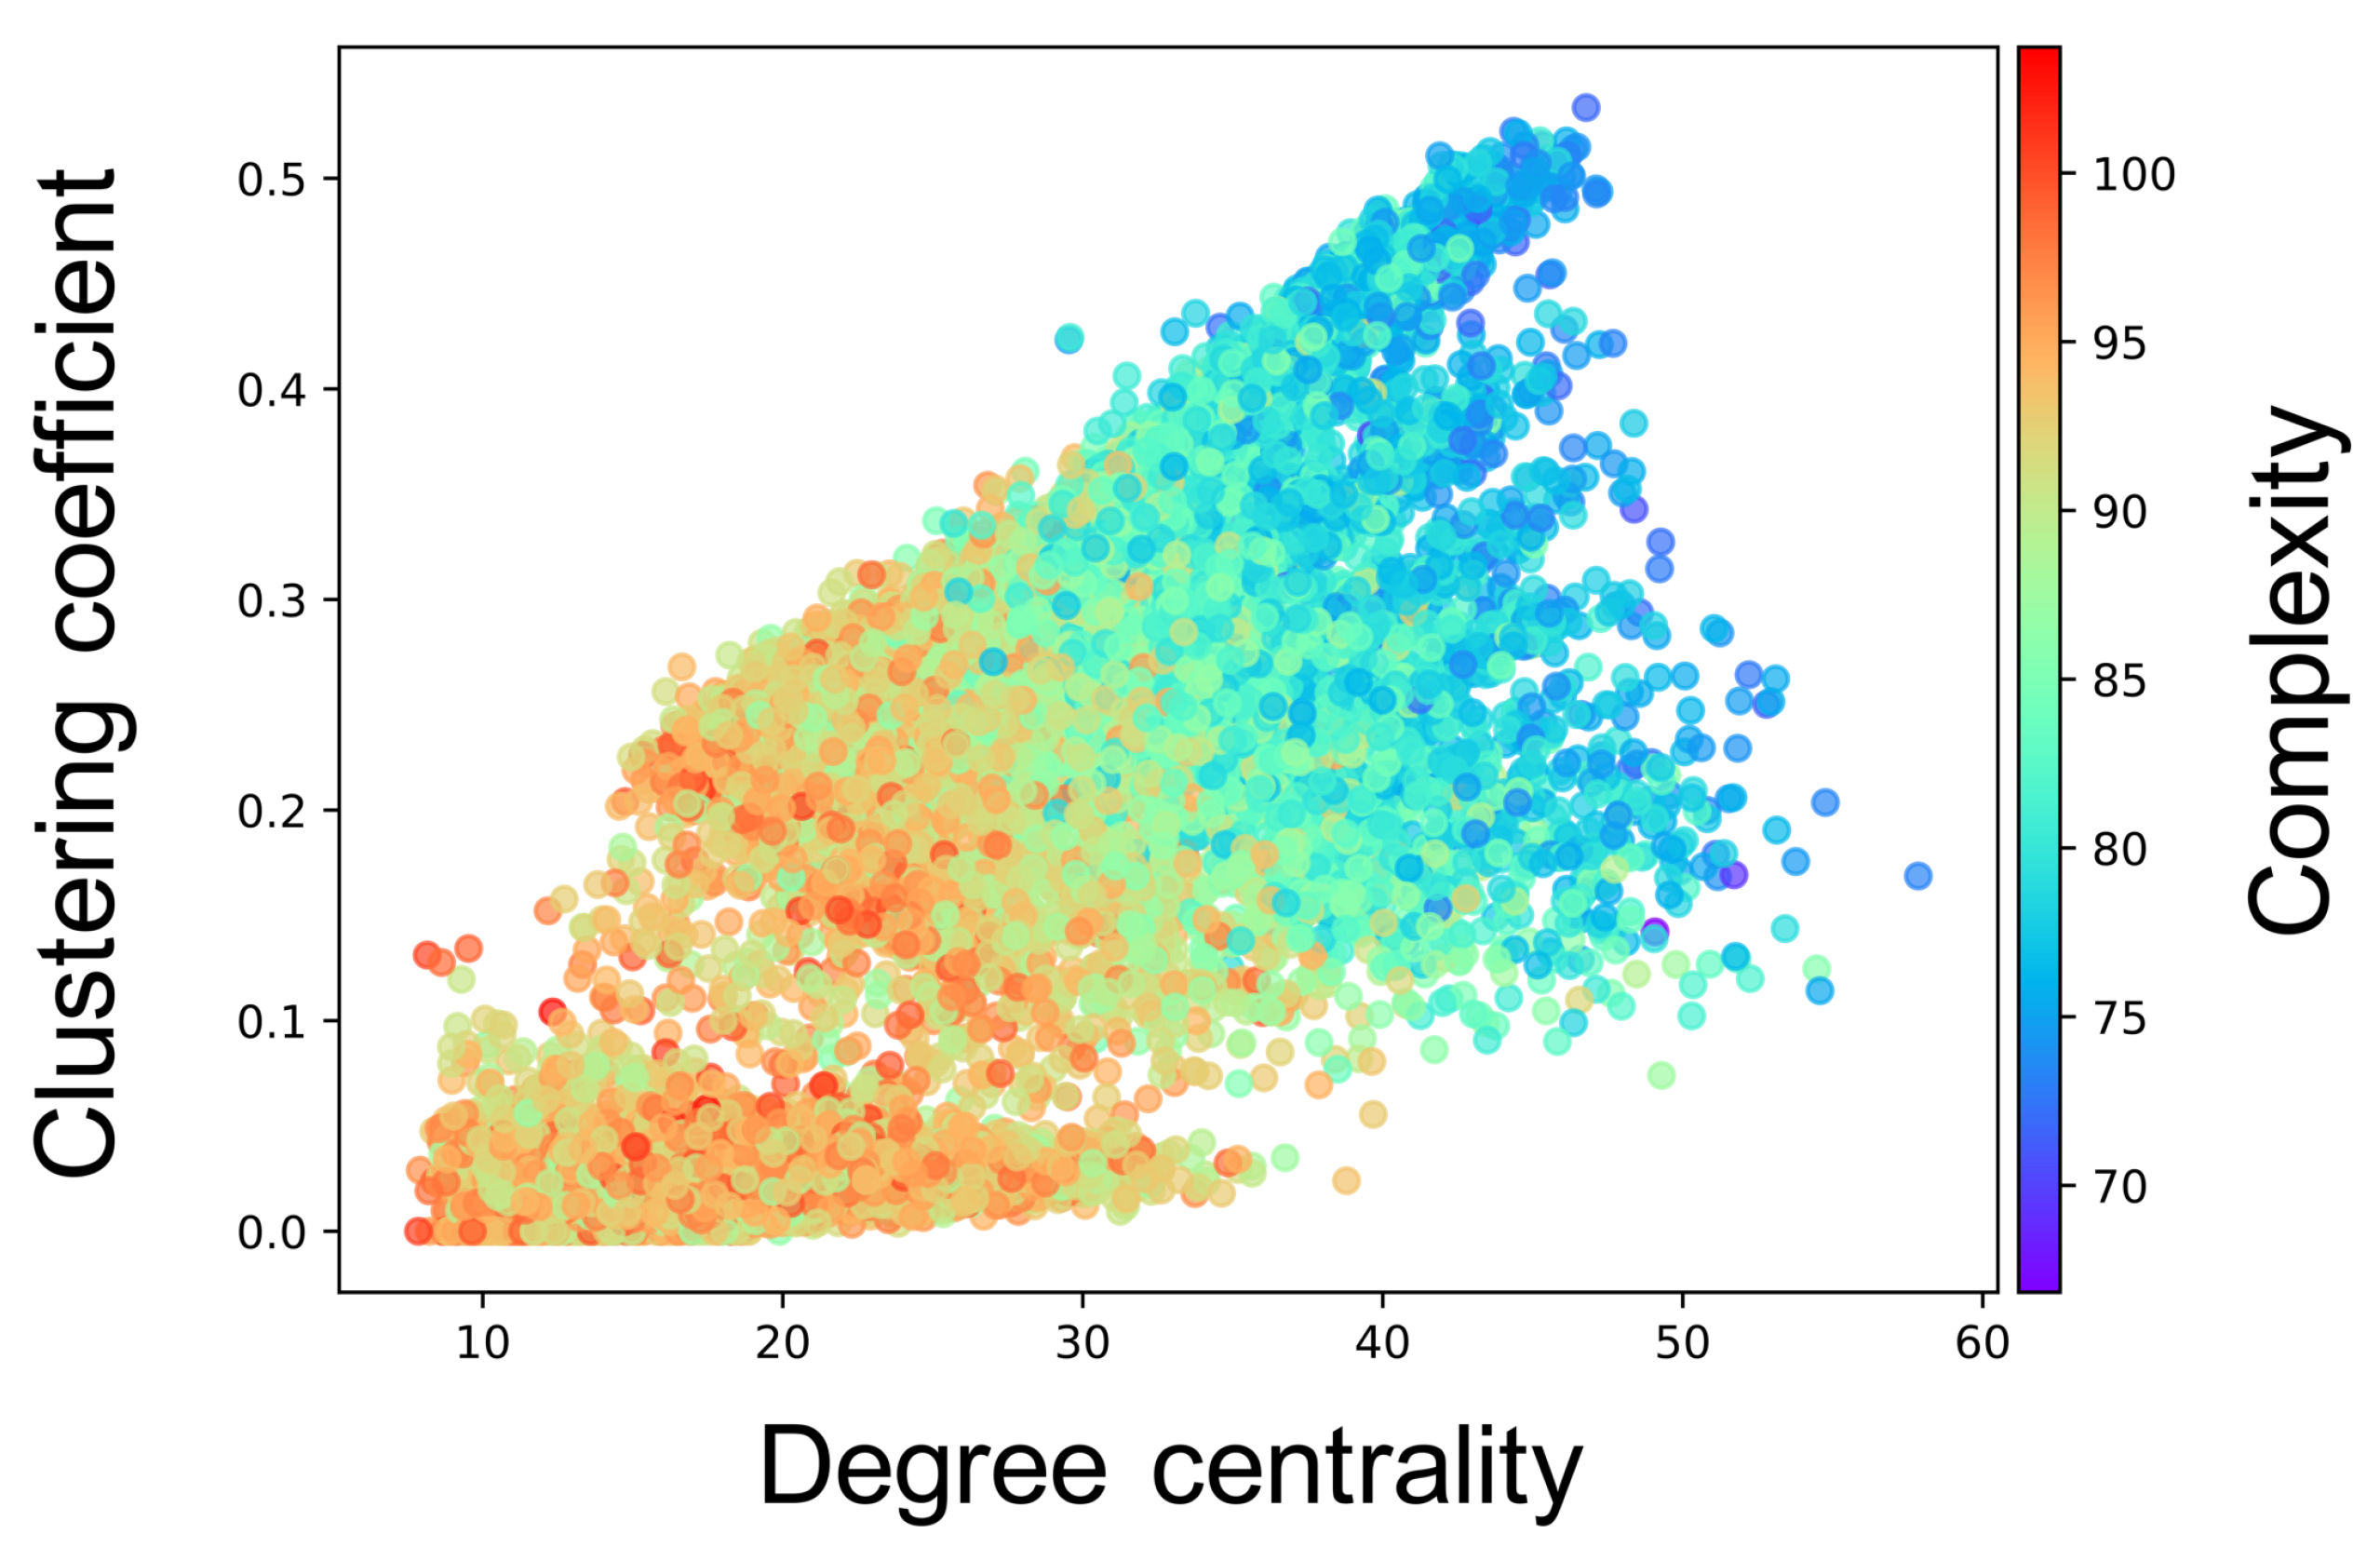
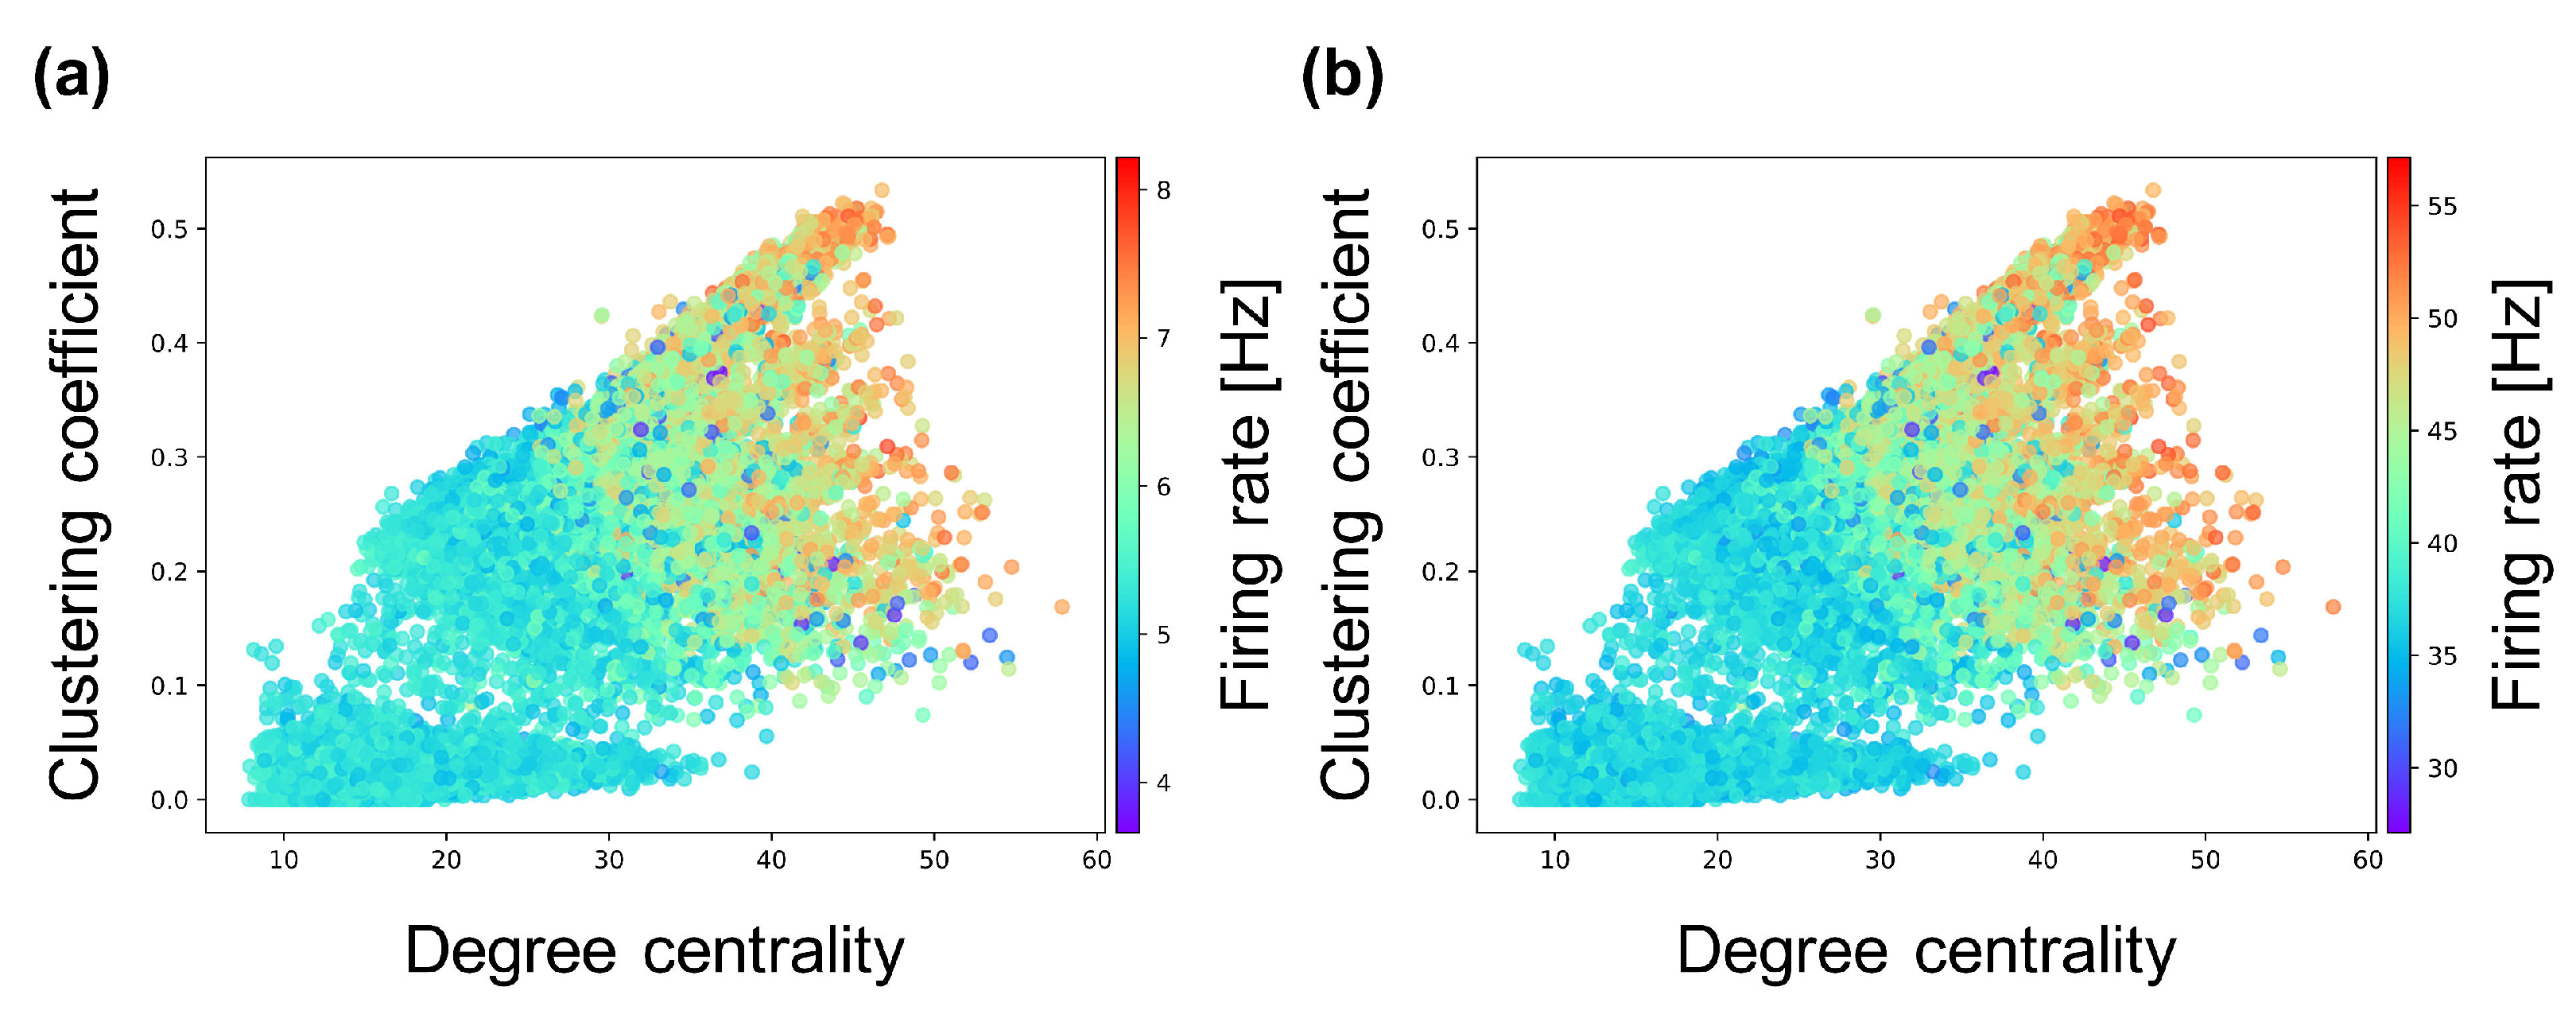
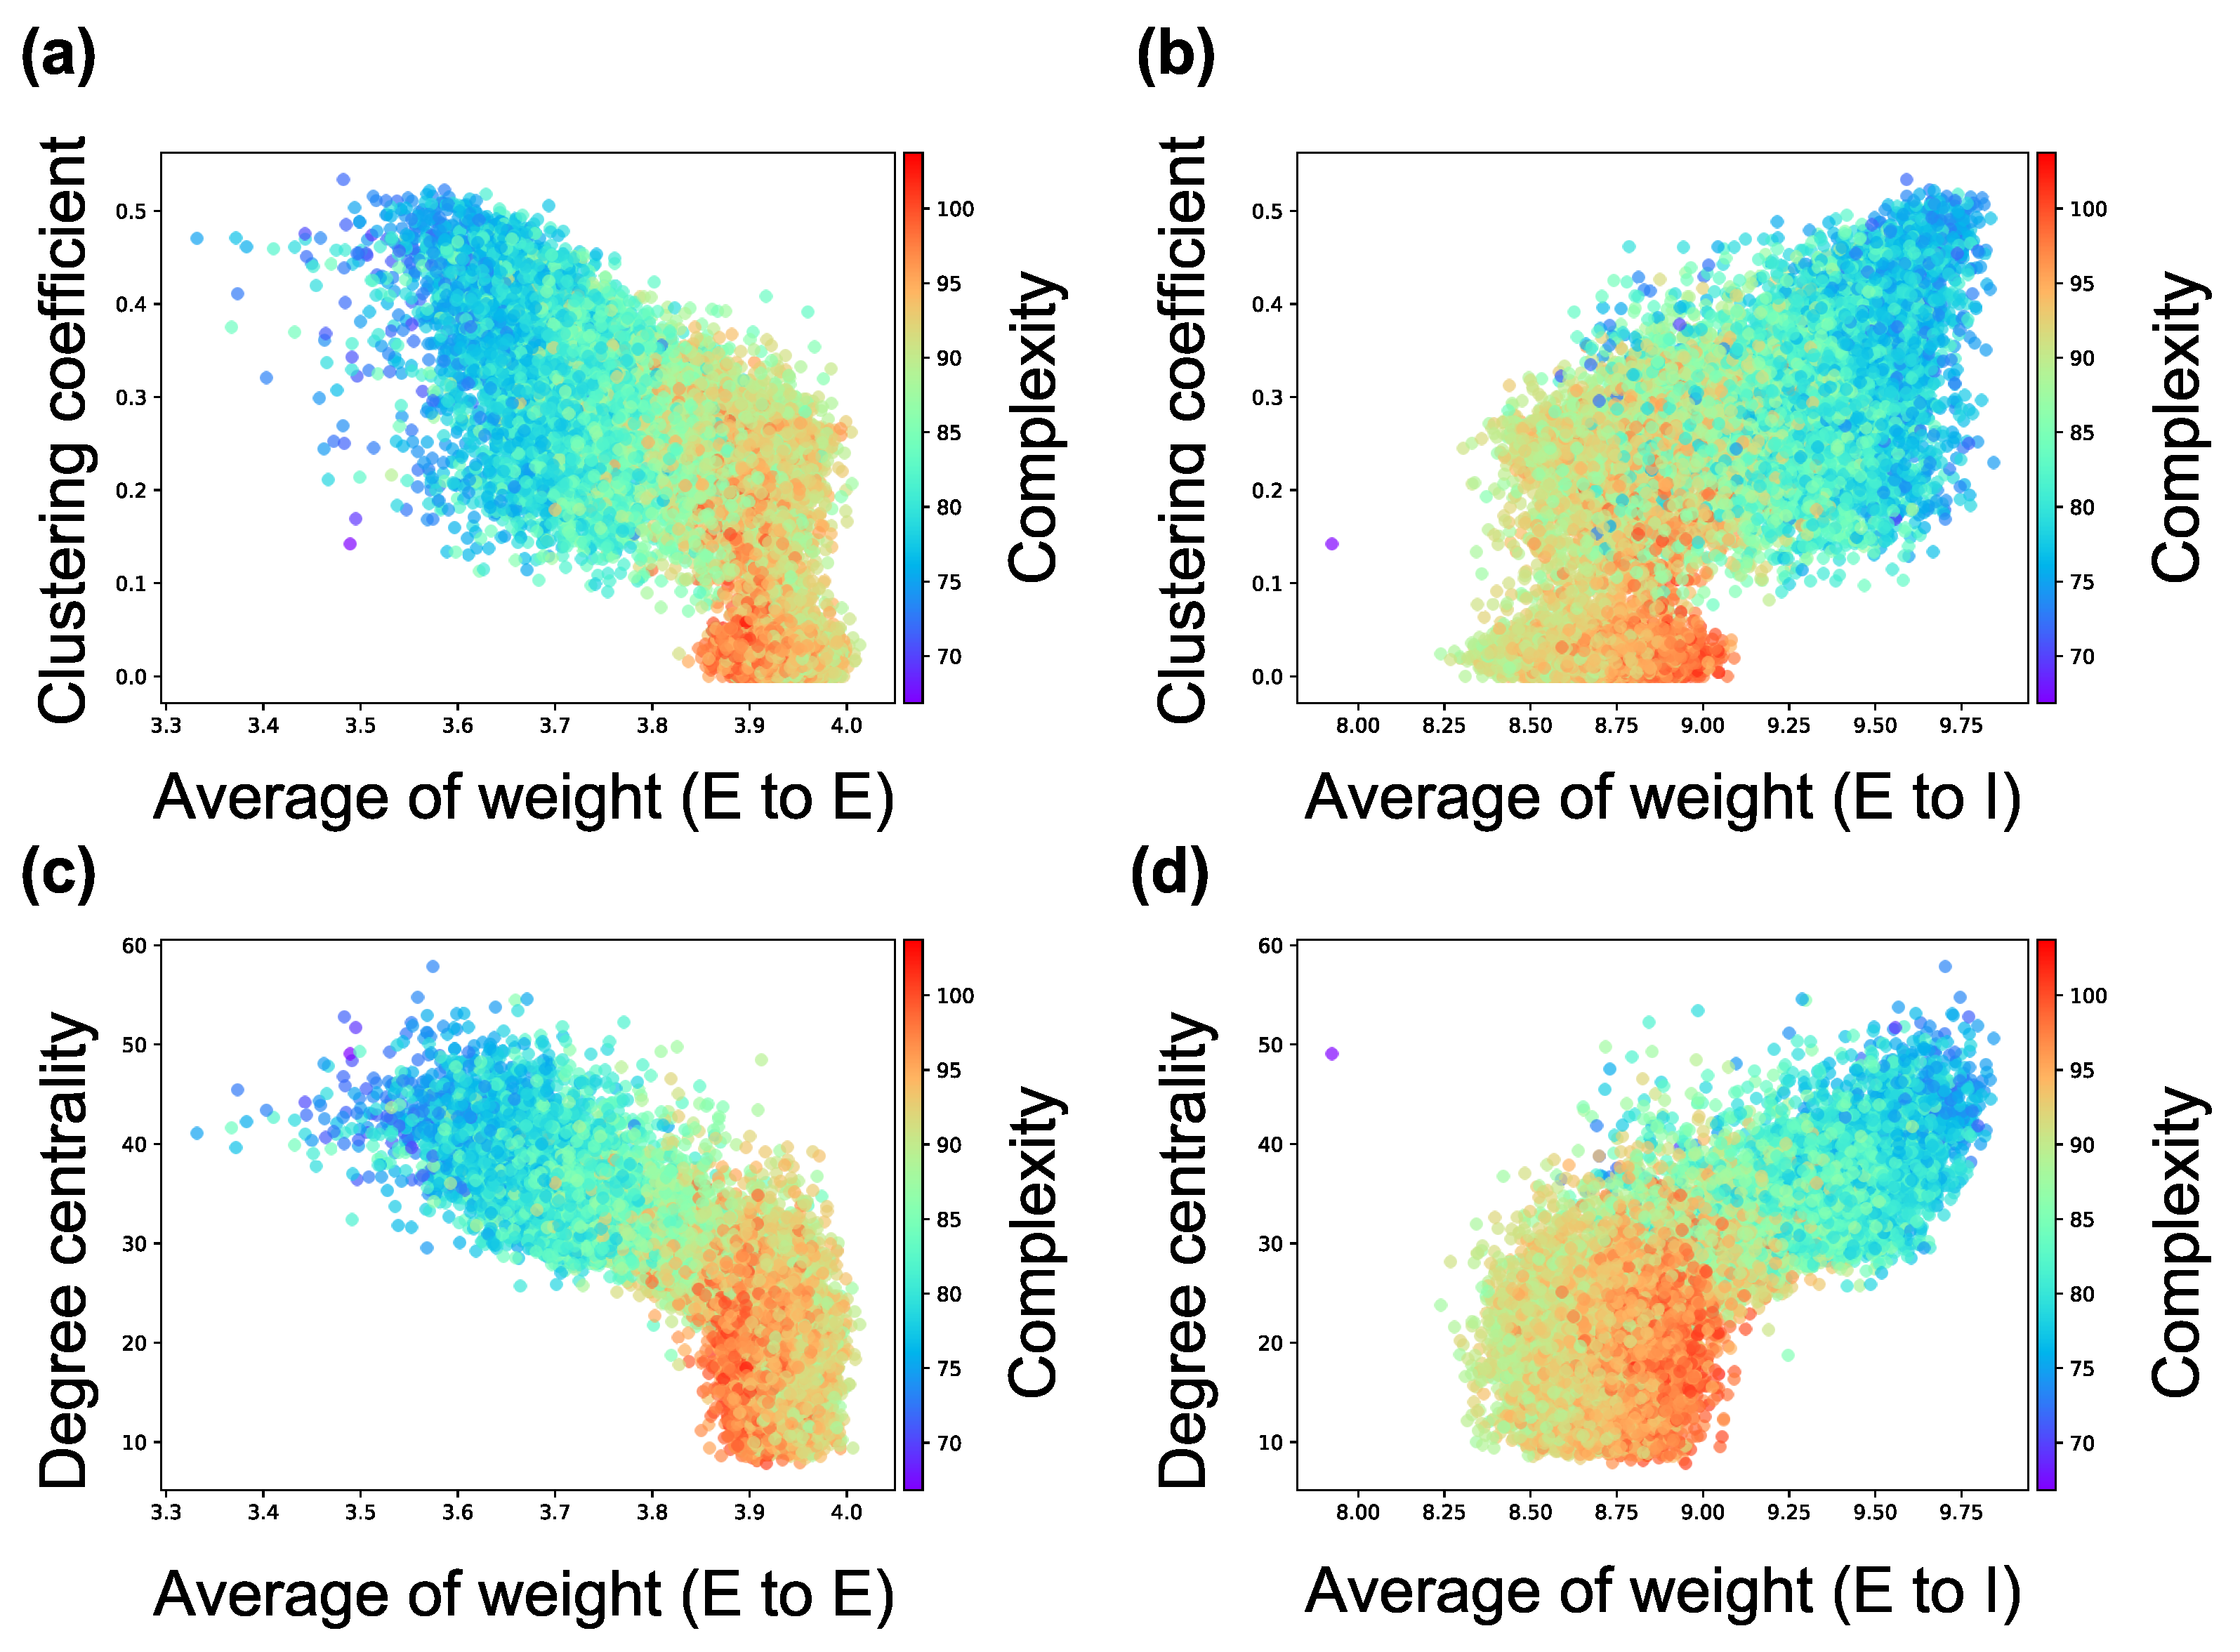
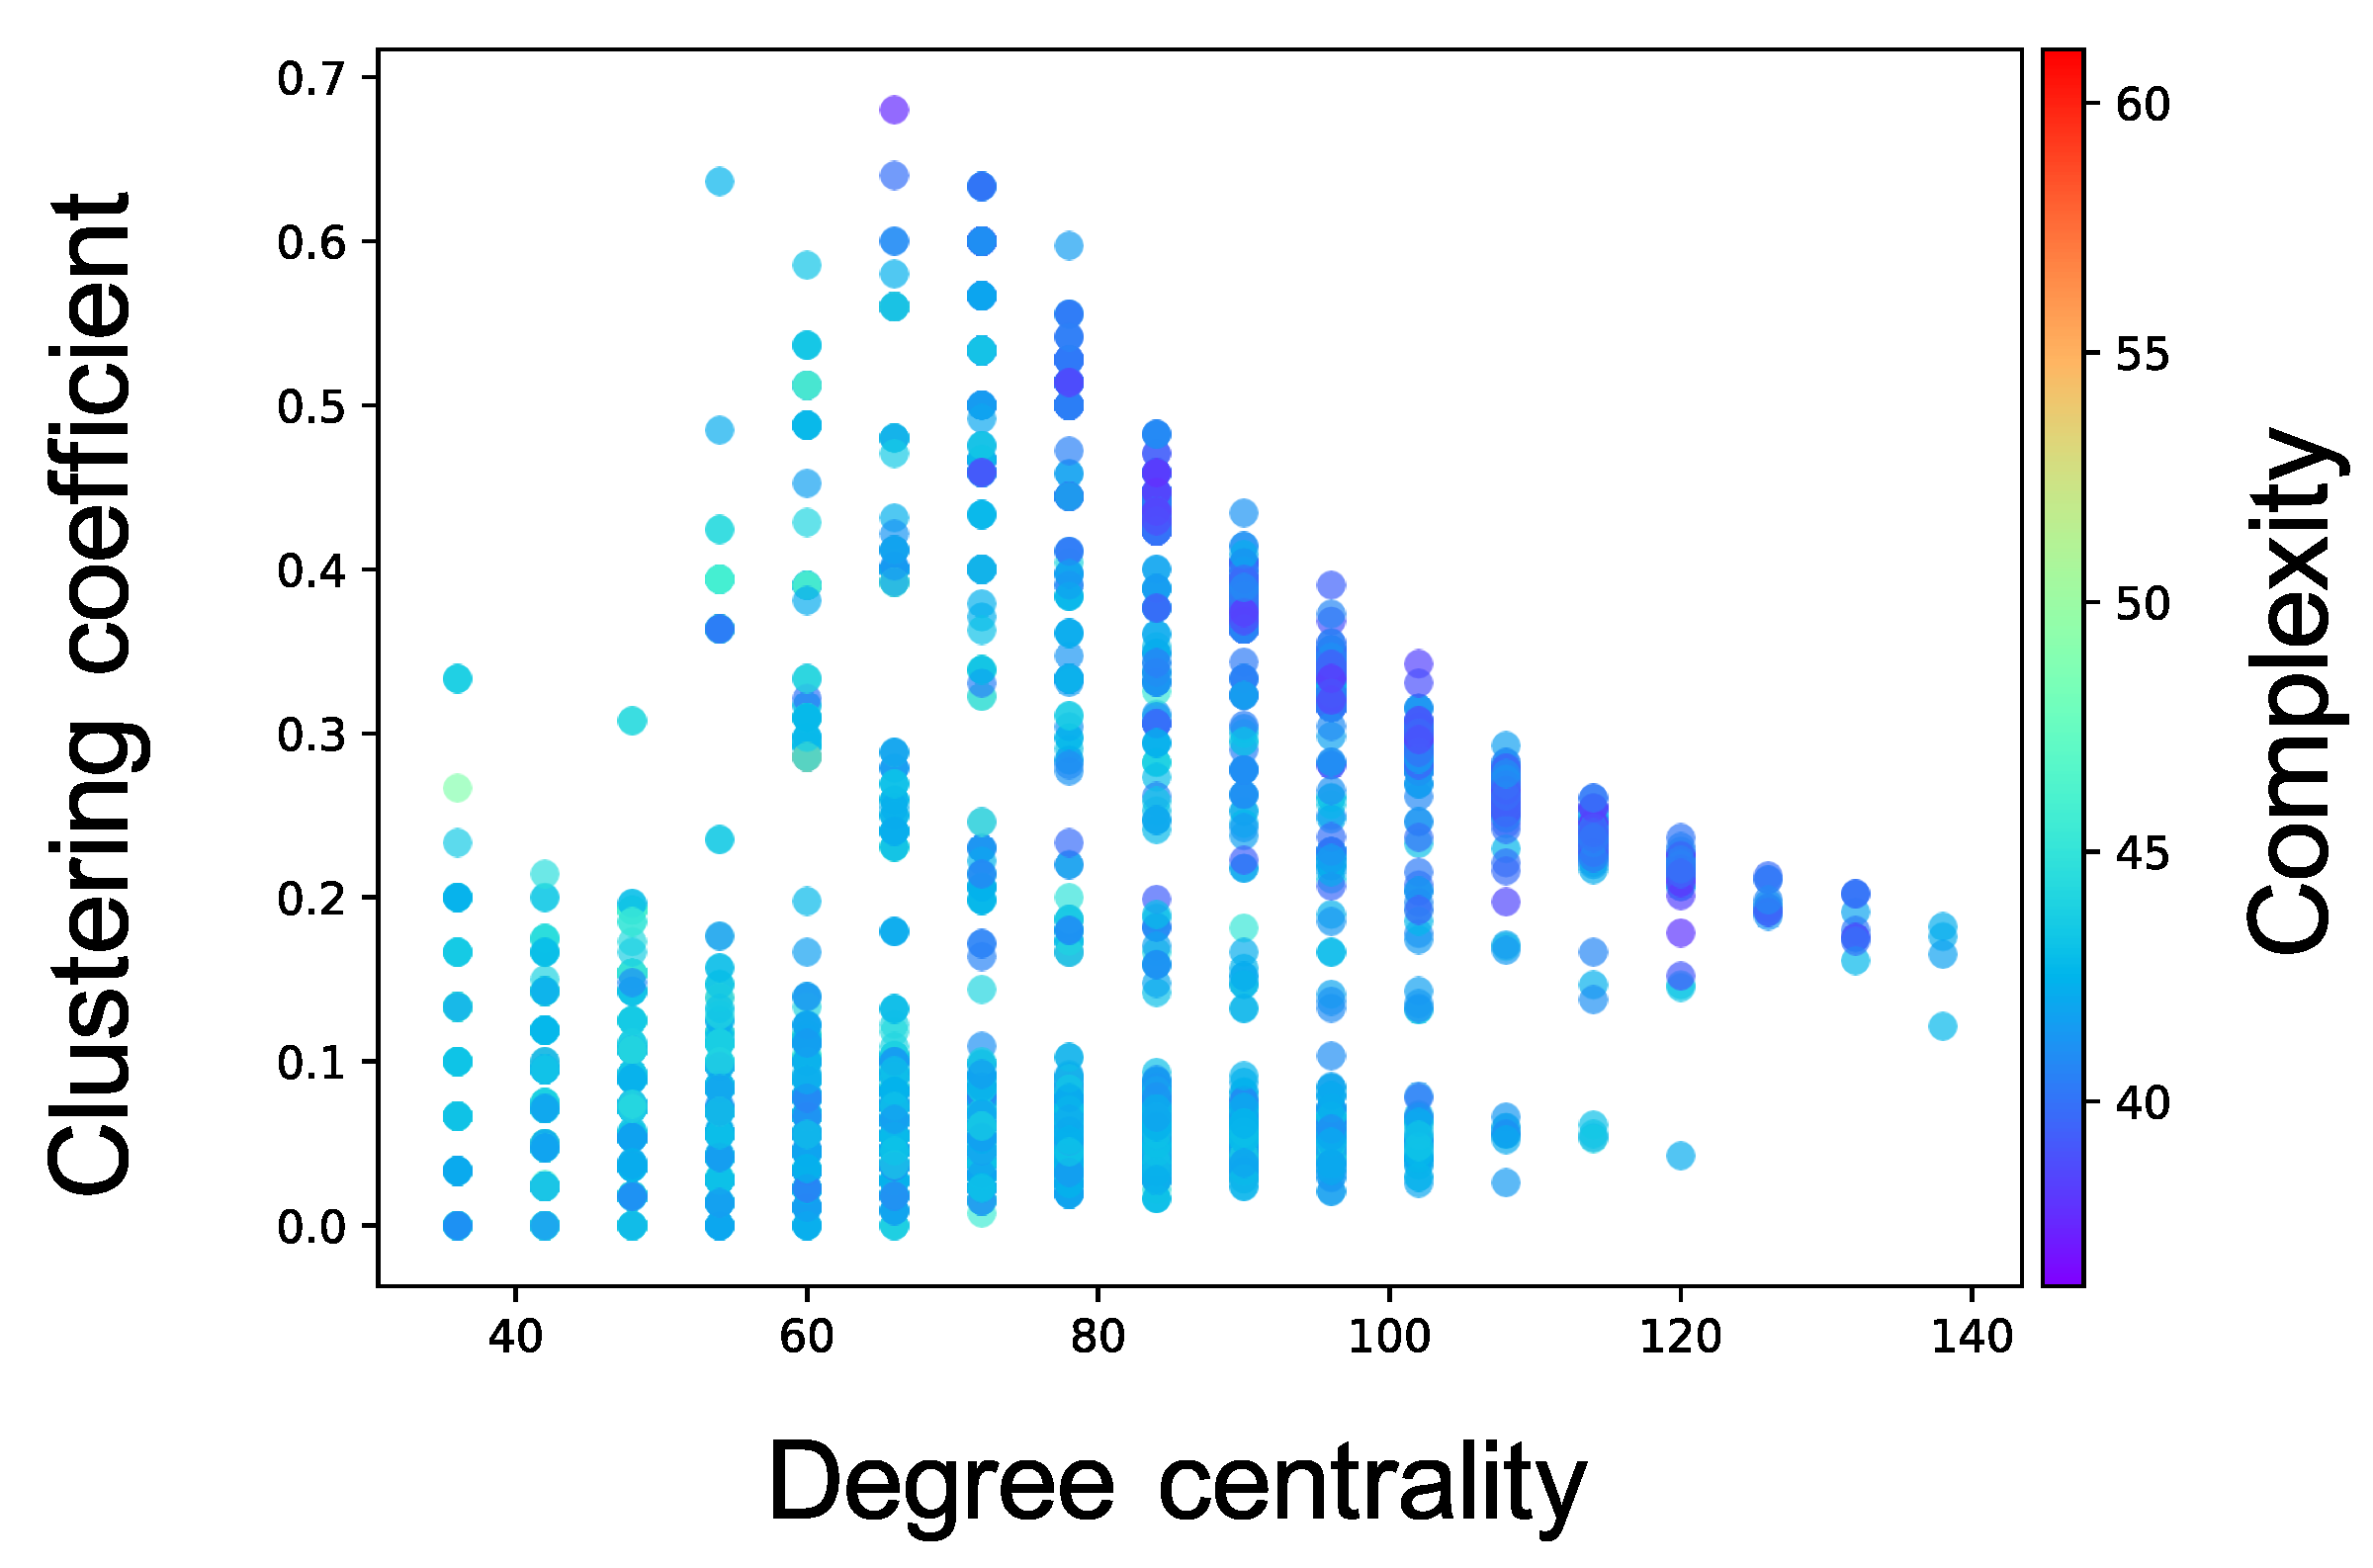
- The complex network analyses for each neuron group showed that the local over-connectivity (the clustering coefficient and degree centrality were high) and complexity of a neuron group had a negative relationship (Section 3.3).
3.1. Relationship between MSE and WS Model
3.2. Neural Activities in Neuron Groups with Different Levels of Complexity
3.3. Relationship between Neural Activity and Structural Properties
4. Discussion
4.1. Hypothetical Mechanism of Low Complexity because of Local Over-Connectivity
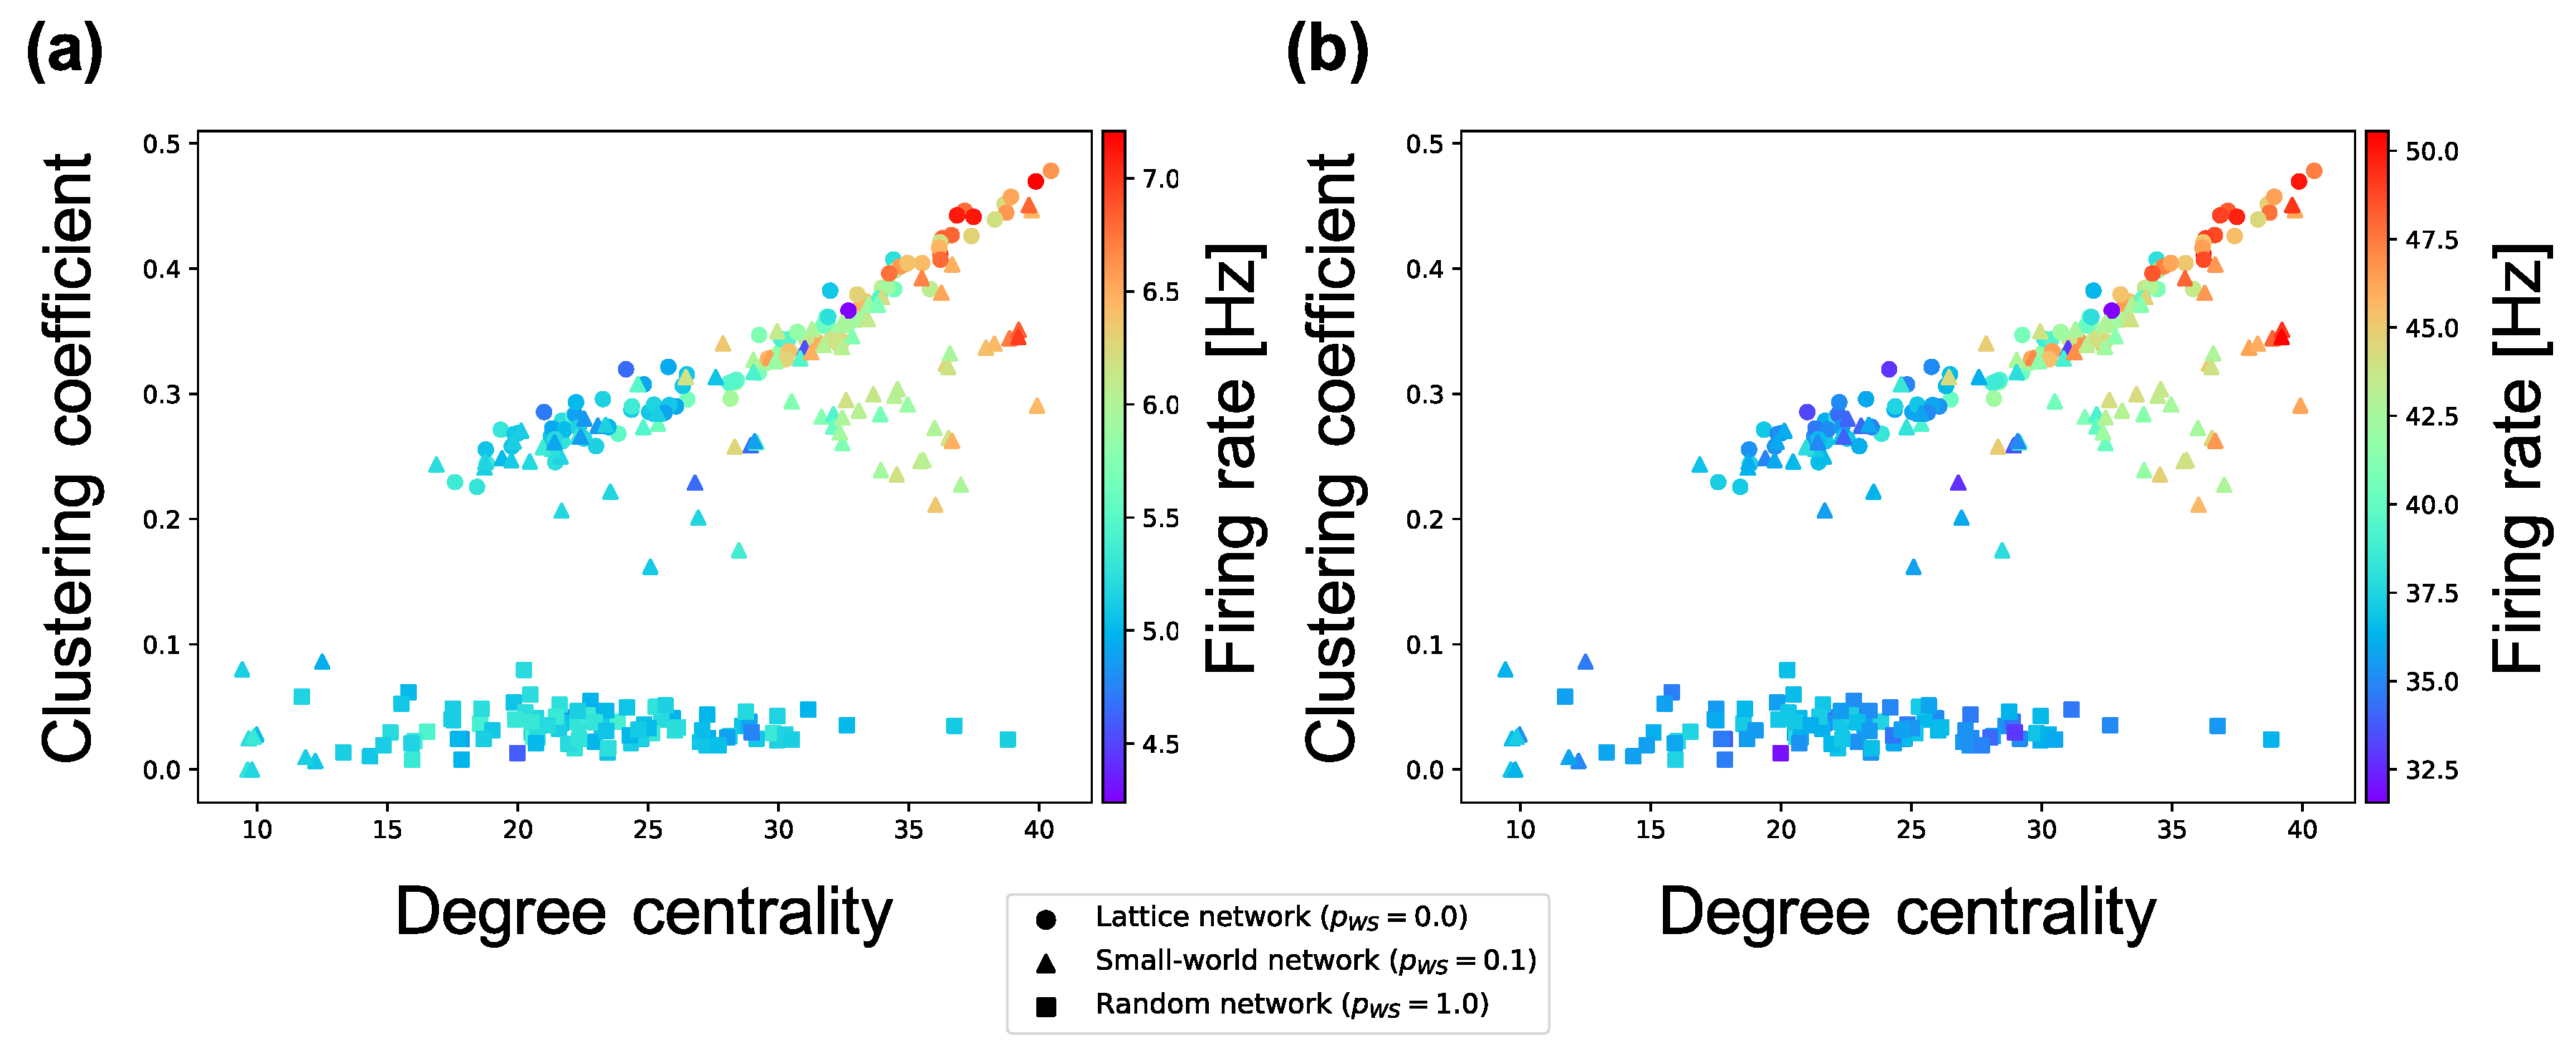
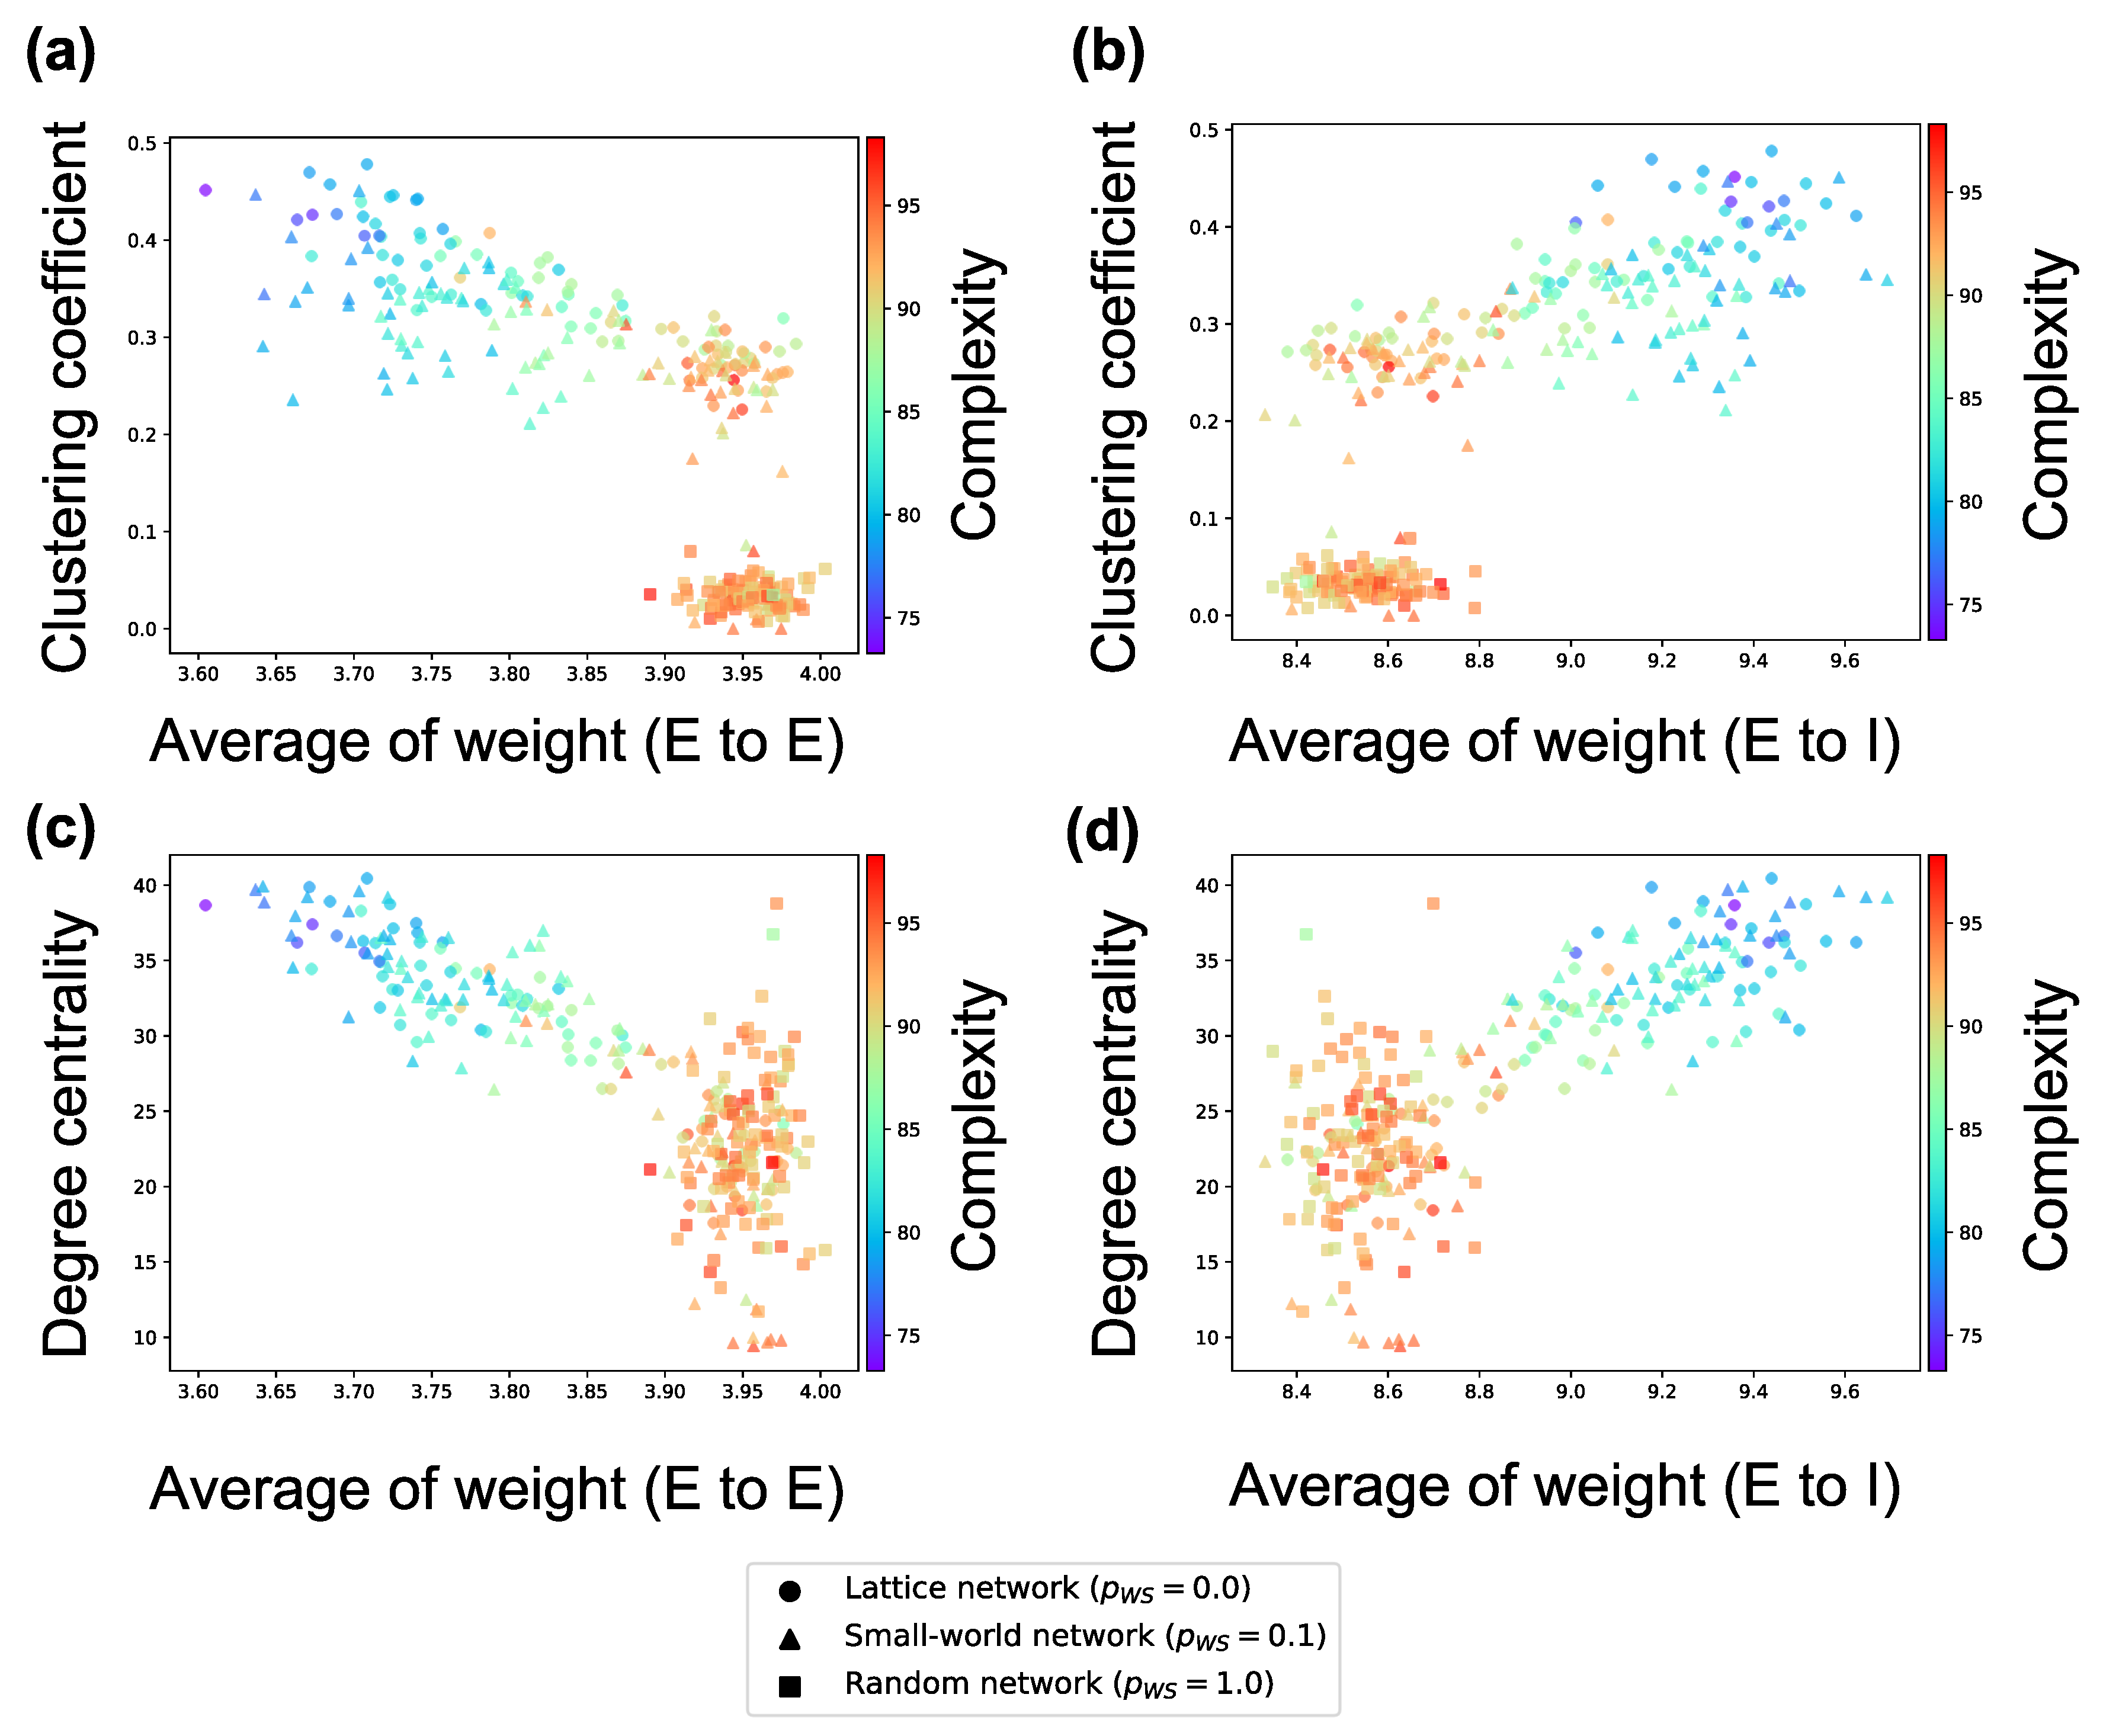
- The firing rates of neurons in a neuron group with local over-connectivity increases because of excessive input from the connected neuron groups (see Figure 7). As a result, to maintain a certain amount of the activities of neurons, strengthened intraconnections from excitatory to inhibitory neurons and weakened intraconnections between excitatory neurons are self-organized by STDP (see Figure 8).
- The increase in the strength of intraconnections to inhibitory neurons induces the oscillation of excitatory neurons, which increases the intensity of the several specific frequency components of neural activity (see Figure 5).
- The signals of specific frequency components become robust. As a result, complexity decreases (Figure 6).
4.2. Relationship with Studies on ASD
4.3. Limitations and Future Work
5. Conclusions
Supplementary Materials
Author Contributions
Funding
Conflicts of Interest
Appendix A


Appendix B. Complexity of Neural Activity without STDP

References
- Young, J.M.; Waleszczyk, W.J.; Wang, C.; Calford, M.B.; Dreher, B.; Obermayer, K. Cortical reorganization consistent with spike timing-but not correlation-dependent plasticity. Nat. Neurosci. 2007, 10, 887–895. [Google Scholar] [CrossRef] [PubMed]
- Song, S.; Abbott, L.F. Cortical development and remapping through spike timing-dependent plasticity. Neuron 2001, 32, 339–350. [Google Scholar] [CrossRef]
- Sporns, O.; Zwi, J.D. The small world of the cerebral cortex. Neuroinformatics 2004, 2, 145–162. [Google Scholar] [CrossRef]
- Latora, V.; Marchiori, M. Efficient behavior of small-world networks. Phys. Rev. Lett. 2001, 87, 198701. [Google Scholar] [CrossRef] [PubMed]
- Masuda, N.; Aihara, K. Global and local synchrony of coupled neurons in small-world networks. Biol. Cybern. 2004, 90, 302–309. [Google Scholar] [CrossRef] [PubMed]
- McGraw, P.N.; Menzinger, M. Clustering and the synchronization of oscillator networks. Phys. Rev. E Stat. Nonliner Soft Matter Phys. 2005, 72, 015101. [Google Scholar] [CrossRef] [PubMed]
- Bassett, D.S.; Bullmore, E. Small-world brain networks. Neuroscientist 2006, 12, 512–523. [Google Scholar] [CrossRef] [PubMed]
- Richman, J.S.; Moorman, J.R. Physiological time-series analysis using approximate entropy and sample entropy. Am. J. Physiol. Heart Circ. Physiol. 2000, 278, H2039–H2049. [Google Scholar] [CrossRef] [PubMed]
- Costa, M.; Goldberger, A.L.; Peng, C.K. Multiscale entropy analysis of complex physiologic time series. Phys. Rev. Lett. 2002, 89, 068102. [Google Scholar] [CrossRef] [PubMed]
- Costa, M.; Goldberger, A.L.; Peng, C.K. Multiscale entropy analysis of biological signals. Phys. Rev. E Stat. Nonliner Soft Matter Phys. 2005, 71, 021906. [Google Scholar] [CrossRef] [PubMed]
- Bosl, W.; Tierney, A.; Tager-Flusberg, H.; Nelson, C. EEG complexity as a biomarker for autism spectrum disorder risk. BMC Med. 2011, 9, 18. [Google Scholar] [CrossRef] [PubMed]
- Solso, S.; Xu, R.; Proudfoot, J.; Hagler, D.J.; Campbell, K.; Venkatraman, V.; Carter Barnes, C.; Ahrens-Barbeau, C.; Pierce, K.; Dale, A.; et al. Diffusion Tensor Imaging Provides Evidence of Possible Axonal Overconnectivity in Frontal Lobes in Autism Spectrum Disorder Toddlers. Biol. Psychiatry 2016, 79, 676–684. [Google Scholar] [CrossRef] [PubMed] [Green Version]
- Courchesne, E.; Pierce, K. Why the frontal cortex in autism might be talking only to itself: Local over-connectivity but long-distance disconnection. Curr. Opin. Neurobiol. 2005, 15, 225–230. [Google Scholar] [CrossRef] [PubMed]
- Belmonte, M.K.; Allen, G.; Beckel-Mitchener, A.; Boulanger, L.M.; Carper, R.A.; Webb, S.J. Autism and abnormal development of brain connectivity. J. Neurosci. 2004, 24, 9228–9231. [Google Scholar] [CrossRef] [PubMed]
- Friston, K.J. Theoretical neurobiology and schizophrenia. Br. Med. Bull. 1996, 52, 644–655. [Google Scholar] [CrossRef] [PubMed] [Green Version]
- Nakagawa, T.T.; Jirsa, V.K.; Spiegler, A.; McIntosh, A.R.; Deco, G. Bottom up modeling of the connectome: Linking structure and function in the resting brain and their changes in aging. Neuroimage 2013, 80, 318–329. [Google Scholar] [CrossRef] [PubMed] [Green Version]
- Sporns, O.; Tononi, G.; Edelman, G.M. Theoretical neuroanatomy: Relating anatomical and functional connectivity in graphs and cortical connection matrices. Cereb. Cortex 2000, 10, 127–141. [Google Scholar] [CrossRef] [PubMed]
- Song, S.; Miller, K.D.; Abbott, L.F. Competitive Hebbian learning through spike-timing-dependent synaptic plasticity. Nat. Neurosci. 2000, 3, 919–926. [Google Scholar] [CrossRef] [PubMed]
- Markram, H.; Lubke, J.; Frotscher, M.; Sakmann, B. Regulation of synaptic efficacy by coincidence of postsynaptic APs and EPSPs. Science 1997, 275, 213–215. [Google Scholar] [CrossRef] [PubMed]
- Izhikevich, E.M. Polychronization: Computation with spikes. Neural Comput. 2006, 18, 245–282. [Google Scholar] [CrossRef] [PubMed]
- Watts, D.J.; Strogatz, S.H. Collective dynamics of ’small-world’ networks. Nature 1998, 393, 440–442. [Google Scholar] [CrossRef] [PubMed]
- Izhikevich, E.M. Simple model of spiking neurons. IEEE Trans. Neural Netw. 2003, 14, 1569–1572. [Google Scholar] [CrossRef] [PubMed] [Green Version]
- Zemanová, L.; Zhou, C.; Kurths, J. Building a Large-Scale Computational Model of a Cortical Neuronal Network. In Lectures in Supercomputational Neurosciences: Dynamics in Complex Brain Networks; Graben, P.B., Zhou, C., Thiel, M., Kurths, J., Eds.; Springer: Berlin/Heidelberg, Germany, 2008; pp. 251–266. [Google Scholar]
- Bush, P.; Sejnowski, T. Inhibition synchronizes sparsely connected cortical neurons within and between columns in realistic network models. J. Comput. Neurosci. 1996, 3, 91–110. [Google Scholar] [CrossRef] [PubMed] [Green Version]
- Fagiolo, G. Clustering in complex directed networks. Phys. Rev. E Stat. Nonliner Soft Matter Phys. 2007, 76, 026107. [Google Scholar] [CrossRef] [PubMed] [Green Version]
- Floyd, R.W. Algorithm 97: Shortest Path. Commun. ACM 1962, 5, 345. [Google Scholar] [CrossRef]
- Barrat, A.; Barthélemy, M.; Pastor-Satorras, R.; Vespignani, A. The architecture of complex weighted networks. Proc. Natl. Acad. Sci. USA 2004, 101, 3747–3752. [Google Scholar] [CrossRef] [PubMed] [Green Version]
- Izhikevich, E.M.; Edelman, G.M. Large-scale model of mammalian thalamocortical systems. Proc. Natl. Acad. Sci. USA 2008, 105, 3593–3598. [Google Scholar] [CrossRef] [PubMed] [Green Version]
- Vogels, T.P.; Sprekeler, H.; Zenke, F.; Clopath, C.; Gerstner, W. Inhibitory plasticity balances excitation and inhibition in sensory pathways and memory networks. Science 2011, 334, 1569–1573. [Google Scholar] [CrossRef] [PubMed]
- Gonzalez-Burgos, G.; Lewis, D.A. GABA neurons and the mechanisms of network oscillations: Implications for understanding cortical dysfunction in schizophrenia. Schizophr. Bull. 2008, 34, 944–961. [Google Scholar] [CrossRef] [PubMed]
- Salinas, E.; Sejnowski, T.J. Correlated neuronal activity and the flow of neural information. Nat. Rev. Neurosci. 2001, 2, 539–550. [Google Scholar] [CrossRef] [PubMed] [Green Version]
- Ghanbari, Y.; Bloy, L.; Christopher Edgar, J.; Blaskey, L.; Verma, R.; Roberts, T.P. Joint analysis of band-specific functional connectivity and signal complexity in autism. J. Autism Dev. Disord. 2015, 45, 444–460. [Google Scholar] [CrossRef] [PubMed]
- Eguiluz, V.M.; Chialvo, D.R.; Cecchi, G.A.; Baliki, M.; Apkarian, A.V. Scale-free brain functional networks. Phys. Rev. Lett. 2005, 94, 018102. [Google Scholar] [CrossRef] [PubMed]
- van den Heuvel, M.P.; Sporns, O. Rich-club organization of the human connectome. J. Neurosci. 2011, 31, 15775–15786. [Google Scholar] [CrossRef] [PubMed]
- Yamanishi, T.; Liu, J.Q.; Nishimura, H.; Nobukawa, S. Low-frequency in the Default Mode Brain Network from Spiking Neuron Model. GSTF J. Comput. 2018, 3. Available online: http://dl6.globalstf.org/index.php/joc/article/view/1067 (accessed on 5 December 2018).
- Cellot, G.; Cherubini, E. GABAergic signaling as therapeutic target for autism spectrum disorders. Front. Pediatr. 2014, 2, 70. [Google Scholar] [CrossRef] [PubMed]
- Nelson, S.B.; Valakh, V. Excitatory/Inhibitory Balance and Circuit Homeostasis in Autism Spectrum Disorders. Neuron 2015, 87, 684–698. [Google Scholar] [CrossRef] [PubMed] [Green Version]
- Gogolla, N.; Leblanc, J.J.; Quast, K.B.; Sudhof, T.C.; Fagiolini, M.; Hensch, T.K. Common circuit defect of excitatory-inhibitory balance in mouse models of autism. J. Neurodev. Disord. 2009, 1, 172–181. [Google Scholar] [CrossRef] [PubMed]
- Kuniyoshi, Y.; Sangawa, S. Early motor development from partially ordered neural-body dynamics: Experiments with a cortico-spinal-musculo-skeletal model. Biol. Cybern. 2006, 95, 589–605. [Google Scholar] [CrossRef] [PubMed]
- Park, J.; Mori, H.; Okuyama, Y.; Asada, M. Chaotic itinerancy within the coupled dynamics between a physical body and neural oscillator networks. PLoS ONE 2017, 12, e0182518. [Google Scholar] [CrossRef] [PubMed]
- Yamada, Y.; Kanazawa, H.; Iwasaki, S.; Tsukahara, Y.; Iwata, O.; Yamada, S.; Kuniyoshi, Y. An Embodied Brain Model of the Human Foetus. Sci. Rep. 2016, 6, 27893. [Google Scholar] [CrossRef] [PubMed] [Green Version]
- Takimoto, T.; Kawai, Y.; Park, J.; Asada, M. Self-organization based on auditory feedback promotes acquisition of babbling. In Proceedings of the 7th Joint IEEE International Conference on Development and Learning and on Epigenetic Robotics, Lisbon, Portugal, 18–21 September 2017; pp. 120–125. [Google Scholar]
- Kawai, Y.; Takimoto, T.; Park, J.; Asada, M. Efficient reward-based learning through body representation in a spiking neural network. In Proceedings of the 8th Joint IEEE International Conference on Development and Learning and on Epigenetic Robotics, Tokyo, Japan, 16–20 September 2018; pp. 198–203. [Google Scholar]
- Catarino, A.; Churches, O.; Baron-Cohen, S.; Andrade, A.; Ring, H. Atypical EEG complexity in autism spectrum conditions: A multiscale entropy analysis. Clin. Neurophysiol. 2011, 122, 2375–2383. [Google Scholar] [CrossRef] [PubMed]
- Orekhova, E.V.; Elsabbagh, M.; Jones, E.J.; Dawson, G.; Charman, T.; Johnson, M.H. EEG hyper-connectivity in high-risk infants is associated with later autism. J. Neurodev. Disord. 2014, 6, 40. [Google Scholar] [CrossRef] [PubMed] [Green Version]
- Peters, J.M.; Taquet, M.; Vega, C.; Jeste, S.S.; Fernandez, I.S.; Tan, J.; Nelson, C.A.; Sahin, M.; Warfield, S.K. Brain functional networks in syndromic and non-syndromic autism: A graph theoretical study of EEG connectivity. BMC Med. 2013, 11, 54. [Google Scholar] [CrossRef] [PubMed]


| Parameters | Values | Descriptions | Notes |
|---|---|---|---|
| [0, 20] | Transfer delay of excitatory synapse in neuron group | (uniform dist., ms) | |
| 1 | Transfer delay of inhibitory synapse in neuron group | (ms) | |
| 6.0 | Initial weight of excitatory synapse | - | |
| −5.0 | Initial weight of inhibitory synapse | - | |
| 10.0 | Maximum value of weight | - | |
| 800 | Number of excitatory neurons in a neuron group | - | |
| 200 | Number of inhibitory neurons in a neuron group | - | |
| N | 1000 | Number of neurons in a neuron group | |
| 100 | Number of intraconnections of a neuron | - | |
| [10, 30] | Transfer delay of excitatory synapse between neuron groups | (uniform dist., ms) | |
| 100 | Number of neuron groups | - | |
| k | 6 | Number of edges for each neuron group | - |
| 3 | Number of interconnections of a excitatory neuron | - | |
| [0.0, 1.0] | Rewiring probability | - | |
| 1 | Time step | (ms) | |
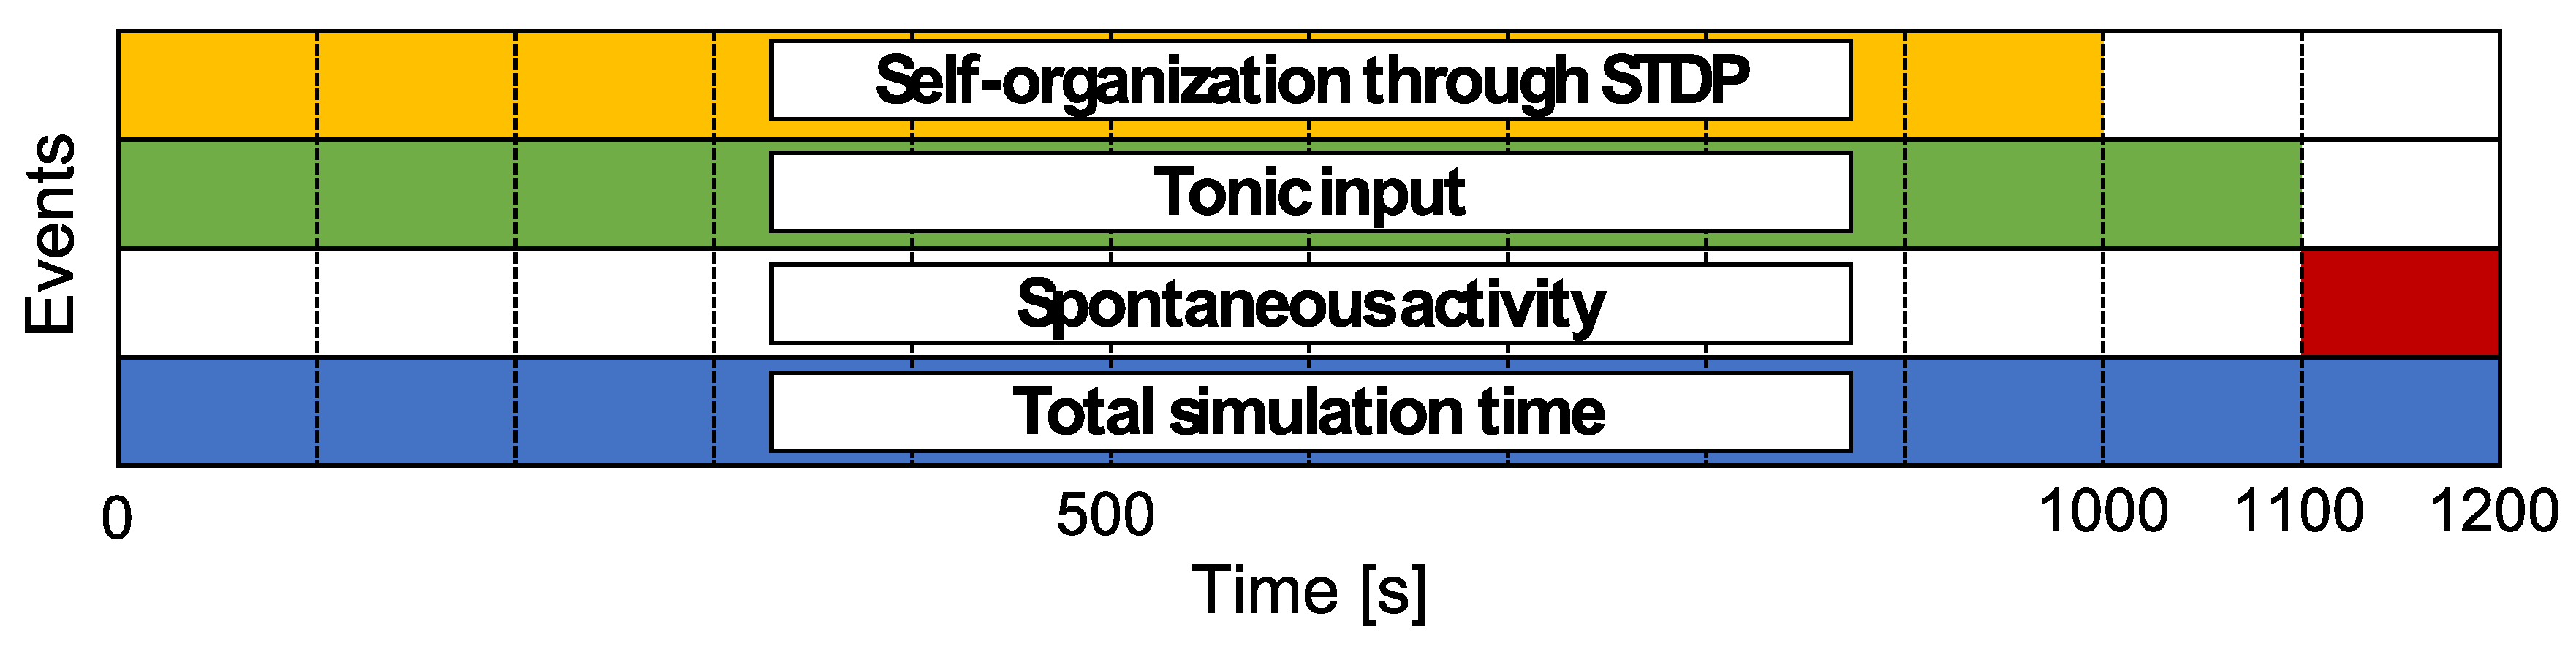
| 1200 | Total simulation time | (s) | |
| 1100 | Time length of tonic input | (s) | |
| 1000 | Time length of self-organization through STDP | (s) | |
| 10 | Number of independent simulations | - |
© 2019 by the authors. Licensee MDPI, Basel, Switzerland. This article is an open access article distributed under the terms and conditions of the Creative Commons Attribution (CC BY) license (http://creativecommons.org/licenses/by/4.0/).
Share and Cite
Park, J.; Ichinose, K.; Kawai, Y.; Suzuki, J.; Asada, M.; Mori, H. Macroscopic Cluster Organizations Change the Complexity of Neural Activity. Entropy 2019, 21, 214. https://doi.org/10.3390/e21020214
Park J, Ichinose K, Kawai Y, Suzuki J, Asada M, Mori H. Macroscopic Cluster Organizations Change the Complexity of Neural Activity. Entropy. 2019; 21(2):214. https://doi.org/10.3390/e21020214
Chicago/Turabian StylePark, Jihoon, Koki Ichinose, Yuji Kawai, Junichi Suzuki, Minoru Asada, and Hiroki Mori. 2019. "Macroscopic Cluster Organizations Change the Complexity of Neural Activity" Entropy 21, no. 2: 214. https://doi.org/10.3390/e21020214