Article

A Decentralized Heuristic Approach towards Resource Allocation in Femtocell Networks

Department of Information and Communication Engineering, Sejong University, 98 Gunja-dong, Gwangjin-gu, Seoul 143747, Korea
*
Author to whom correspondence should be addressed.
Entropy 2013, 15(7), 2524-2547; https://doi.org/10.3390/e15072524
Submission received: 26 April 2013 / Revised: 31 May 2013 / Accepted: 19 June 2013 / Published: 25 June 2013

Abstract

:
Femtocells represent a novel configuration for existing cellular communication, contributing towards the improvement of coverage and throughput. The dense deployment of these femtocells causes significant femto-macro and femto-femto interference, consequently deteriorating the throughput of femtocells. In this study, we compare two heuristic approaches, i.e., particle swarm optimization (PSO) and genetic algorithm (GA), for joint power assignment and resource allocation, within the context of the femtocell environment. The supposition made in this joint optimization is that the discrete power levels are available for the assignment. Furthermore, we have employed two variants of each PSO and GA: inertia weight and constriction factor model for PSO, and twopoint and uniform crossover for GA. The two proposed algorithms are in a decentralized manner, with no involvement of any centralized entity. The comparison is carried out between the two proposed algorithms for the aforementioned joint optimization problem. The contrast includes the performance metrics: including average objective function, min–max throughput of the femtocells, average throughput of the femto users, outage rate and time complexity. The results demonstrate that the decentralized PSO constriction factor outperforms the others in terms of the aforementioned performance metrics.

1. Introduction

The limitations of the current cellular system involve indoor coverage and base station deployment. According to a survey, more than 50 percent of voice and 70 percent of data traffic originate from the indoor environment [1]. Although the existing macro cellular services provide coverage to the indoor users, they cannot meet their high-throughput demand due to penetration losses. The possible approaches for mitigating the indoor penetration losses: include increasing the transmit power or reducing the transmission rate. However, the aforementioned approaches will not solve the two major problems i.e., increase throughput and less power transmission. Therefore, based upon the above-mentioned concerns, exploiting the femtocell is a viable alternative for escalating the coverage as well as the throughout.
A femtocell is serviced by small home base stations or femto base stations (FBS). The words femtocell and FBS are used interchangeably used throughout this study. They can accommodate short-range devices and are totally transparent to macro users (MUs). The important aspect of FBS is that it is cheap and is completely user dependent. Furthermore, the significance of FBSs lies in the fact that they can use existed broadband links, such as DSL, optical fiber or dedicated wireless link, etc. [2]. With the exploitation of this existed backhaul, the communication of FBS with others and with macro base stations (MBS) is possible. Three cases are possible here: first, the back haul link is not available, and in that case all the FBSs operates on a competitor (greedy) basis, having no concern with others; second, the backhaul link is not of quality, and in this case only control signals can be exchanged among FBSs and MBS; third, the back haul is of very good quality, and in this all the FBSs can cooperatively communication with others [3]. In this study we are utilizing the second case.
Generally speaking, there are two classes of interference in the femtocell and macrocell environment, co-tier and cross-tier. The co-tier is the interference between the femtocells, and the cross-tier is the interference between femtocells and macrocells [4]. The obvious solution for mitigating the cross-tier, is to divide the available spectrum in to two portions: one for femtocells and the other for macrocells [5]. However, this is highly inefficient as far as the spectrum efficiency is concerned because the FBSs are plug-and-play devices, and it may cause under utilization of the resources. In the shared channel environment of the femtocell and macrocell, the overall performance can be embarked by allocating channels and powers levels in a cooperative manner, with the concern of minimizing both the interferences. On one hand, the transmission power of the FBS is a function of capacity, but on the other hand, increased power results in interferences on other channels, which results in reduced throughput. The power assignment and resource allocation, of the FBSs and femtousers (FUs) should be carried out in a manner to reduce the interference. A possible solution for mitigating the interference is by the joint power assignment and resource allocation, which is quoted as the open challenge within the context of femtocells [4,6].
The two wireless techniques, power control [7] and resource allocations have been researched individually, especially within the context of femtocells. We propose the joint power assignment and resource allocation with the concern of maximizing the throughput of the femtocells. The uniqueness of our proposed joint algorithm is the decentralized optimization, via information exchange among FBSs. The two well known heuristic algorithms, i.e., particle swarm optimization (PSO) and genetic algorithm (GA), are exploited for the joint optimization problem. Heuristic algorithms are employed in a decentralized manner, which guarantees faster convergence. There is another concept called niching, somewhat equivalent to decentralization in evolutionary algorithms. The concept of niching is used when the problem under consideration is multimodal; it means that there are multiple solutions of the global problem. Initially, it was proposed within the context of GA; however, it can be stretched to any evolutionary algorithm. The major concern of its implication in evolutionary algorithms is to classify various solutions that are impossible in centralized environment [8,9]. A small difference between our proposed decentralized algorithm and niching is that we are not specifically exploiting the multiple solutions acquired by it. However, we are using the concept of niching in the form of decentralization with the concern of sharing solutions with the neighbors. By doing this best solution is updated by the least experienced neighbors. Our main contributions in this study are categorically listed below:
(1)
We formulate the optimization problem as the maximization of the minimum throughput of the FBSs, by utilizing the joint power assignment and resource allocation.
(2)
The two heuristic algorithms are analyzed in a decentralized manner for joint optimization and will mitigate both type inferences that result, i.e., cross-tier and co-tier. Furthermore, the two variants of each PSO and GA are considered for the joint optimization. PSO variants include inertia weight (IW) and constriction factor model (CM), whereas, GA variants include twopoint crossover (TC) and uniform crossover (UC).
(3)
Two different scenarios are depicted, i.e., high traffic and low traffic, to evaluate the performance of the proposed algorithms.
(4)
Finally, the proposed decentralized algorithms are evaluated in terms of performance metrics: including average objective function, min–max throughput of the femtocells, average throughput of the FUs, outage rate and time complexity.
The rest of this paper is structured as follows: related work is presented in Section 2, the system model and problem formulation is carried out in Section 3. A generalized framework for PSO and DPSO is presented in Section 4 and Section 5 includes the applicability of the proposed DPSO for the joint optimization problem. A general framework for the GA and DGA is elaborated in Section 6, and Section 7 shows the mapping of DGA for joint optimization in femtocells. The results and analysis is presented in Section 8, which houses the two scenarios and performance metrics for comparison. Finally, Section 9 concludes the article.

2. Related Work

The related work presented here is divided into three parts including: broader survey on resource allocation and telecommunication networking [10,11,12,13,14], previous studies on resource allocation and power control in femtocells [15,16,17,18,19] and the decentralized approaches within the context of femtocells [20,21].
Resource allocation has been exploited in various domains such as: operational research, industrial engineering, telecommunication networking, etc. The authors in [10] formulated the discrete resource allocation by using number of processors that are connected, coordinated and operating simultaneously. The concern of their study is to propose a parallel hypercube algorithm for the resource allocation problem. They proposed two algorithms, the first one is based on sequential divide-and-conquer (SDRAP), and the second one is its parallel counterpart (PDRAP). The inculcation of parallelism in PDRAM contributes to the better performance than its counterpart. Resource allocation has also been widely investigated in management sciences, where financial and timing constraints are more critical. For example, the authors in [11] analyze the resource allocation problem for the running projects, by taking into account both the minimum and maximum activation levels and fixed costs, where some projects are in maximum activation levels while others are in minimum level. Authors exploited dynamic programming approach for finding the optimum solution. The optimization of the resource allocation problem is attractive for the firms that finance the projects, where the optimum policy has to be established within the financial constraints. Furthermore, resource allocation optimization may be applied in various areas including: management sciences, load distribution, dynamic programming, greedy algorithms, etc. [12]. Within the context of telecommunication domain, resource allocation has profound importance. For example, meeting the QoS requirement of users in optical and adhoc networks is a challenging task. This is due to unpredictable environmental effects such as: interference, traffic congestion, noise sources, etc. For mitigating the aforementioned effects, dynamic resource management is a viable solution. A survey of ant colony optimization within the context of resource allocation is presented in [13]. Also, the optimization of resource allocation within the context of cognitive radios is presented in [14].
In [15], the authors employ GA for resource allocation in femtocells, the main contributions of which are maximized throughput, base station selection and joint power and resource assignment. However, the proposed GA is in the centralized manner under the assumption of coordination among FBSs and MBSs. The authors in [16] exploited the PSO for joint power control and resource allocation. Their proposed algorithm is used for maximizing the throughput of the femtocells. However, their proposition is also based on the centralized optimization. The proposed centralized optimization only mitigates the co-tier interference and assumes the channels among femtocells and macrocells are non-overlapping, which is an impractical assumption. The authors in [17] investigated the heuristic algorithms for coverage optimization in the femtocells network. They proposed a centralized optimization engine, where all the information regarding femtocells is gathered, and then optimization is carried out. The objective functions used in their study are interference minimization and reducing coverage overlaps. In [18] the authors employ the joint power and resource allocation in femtocell networks as the optimization tasks for both the centralized and distributive environment. The Hungarian algorithm is utilized for the centralized case, whereas the graph theory is adopted for the distributive one. The comparison is carried out between both the cases in terms of the outage and power ratio. The authors in [19] proposed a 3-tier hierarchical approach for resource allocation in the femtocells. The proposed concept can be thought of as a somewhat centralized approach. The overall process is divided into three steps. In the first step, the load estimation, where each FBS calculates it internal load in terms of the required number of resource blocks (RBs) and conveys this information to some centralized entity. In the second step, the RBs allocation to femtocells, the graph theory is exploited for allocation. In the third step, RBs allocation to users is carried out internally with the aim of minimizing the interference.
The authors in [20] investigate the self-organizing femtocells. They proposed the joint power allocation and dynamic resource allocation by exploiting the concepts of cognitive radios in femtocells, specifically in the decentralized manner. Actually, the authors combine the proposed game theory based resource allocation with fractional power control. The decentralized interference management is proposed in [21], where game theory is also employed in the non-cooperative environment.
According to the best of our knowledge, heuristic algorithms have not been investigated in a decentralized manner, especially within the context of femtocells. However, performance optimization using swarm intelligence is carried in video communication over a mesh network in the decentralized environment [22]. Beside this, the number of proposed heuristic algorithms focuses only on centralized optimization. Contrariwise, game theory algorithms have been investigated for decentralized cases. However, this lacks efficiency because of the lack coordination among them. In this study, we carried out a decentralized heuristic approach for joint optimization under the assumption of little coordination of FBS with others and with MBS.

3. System Model

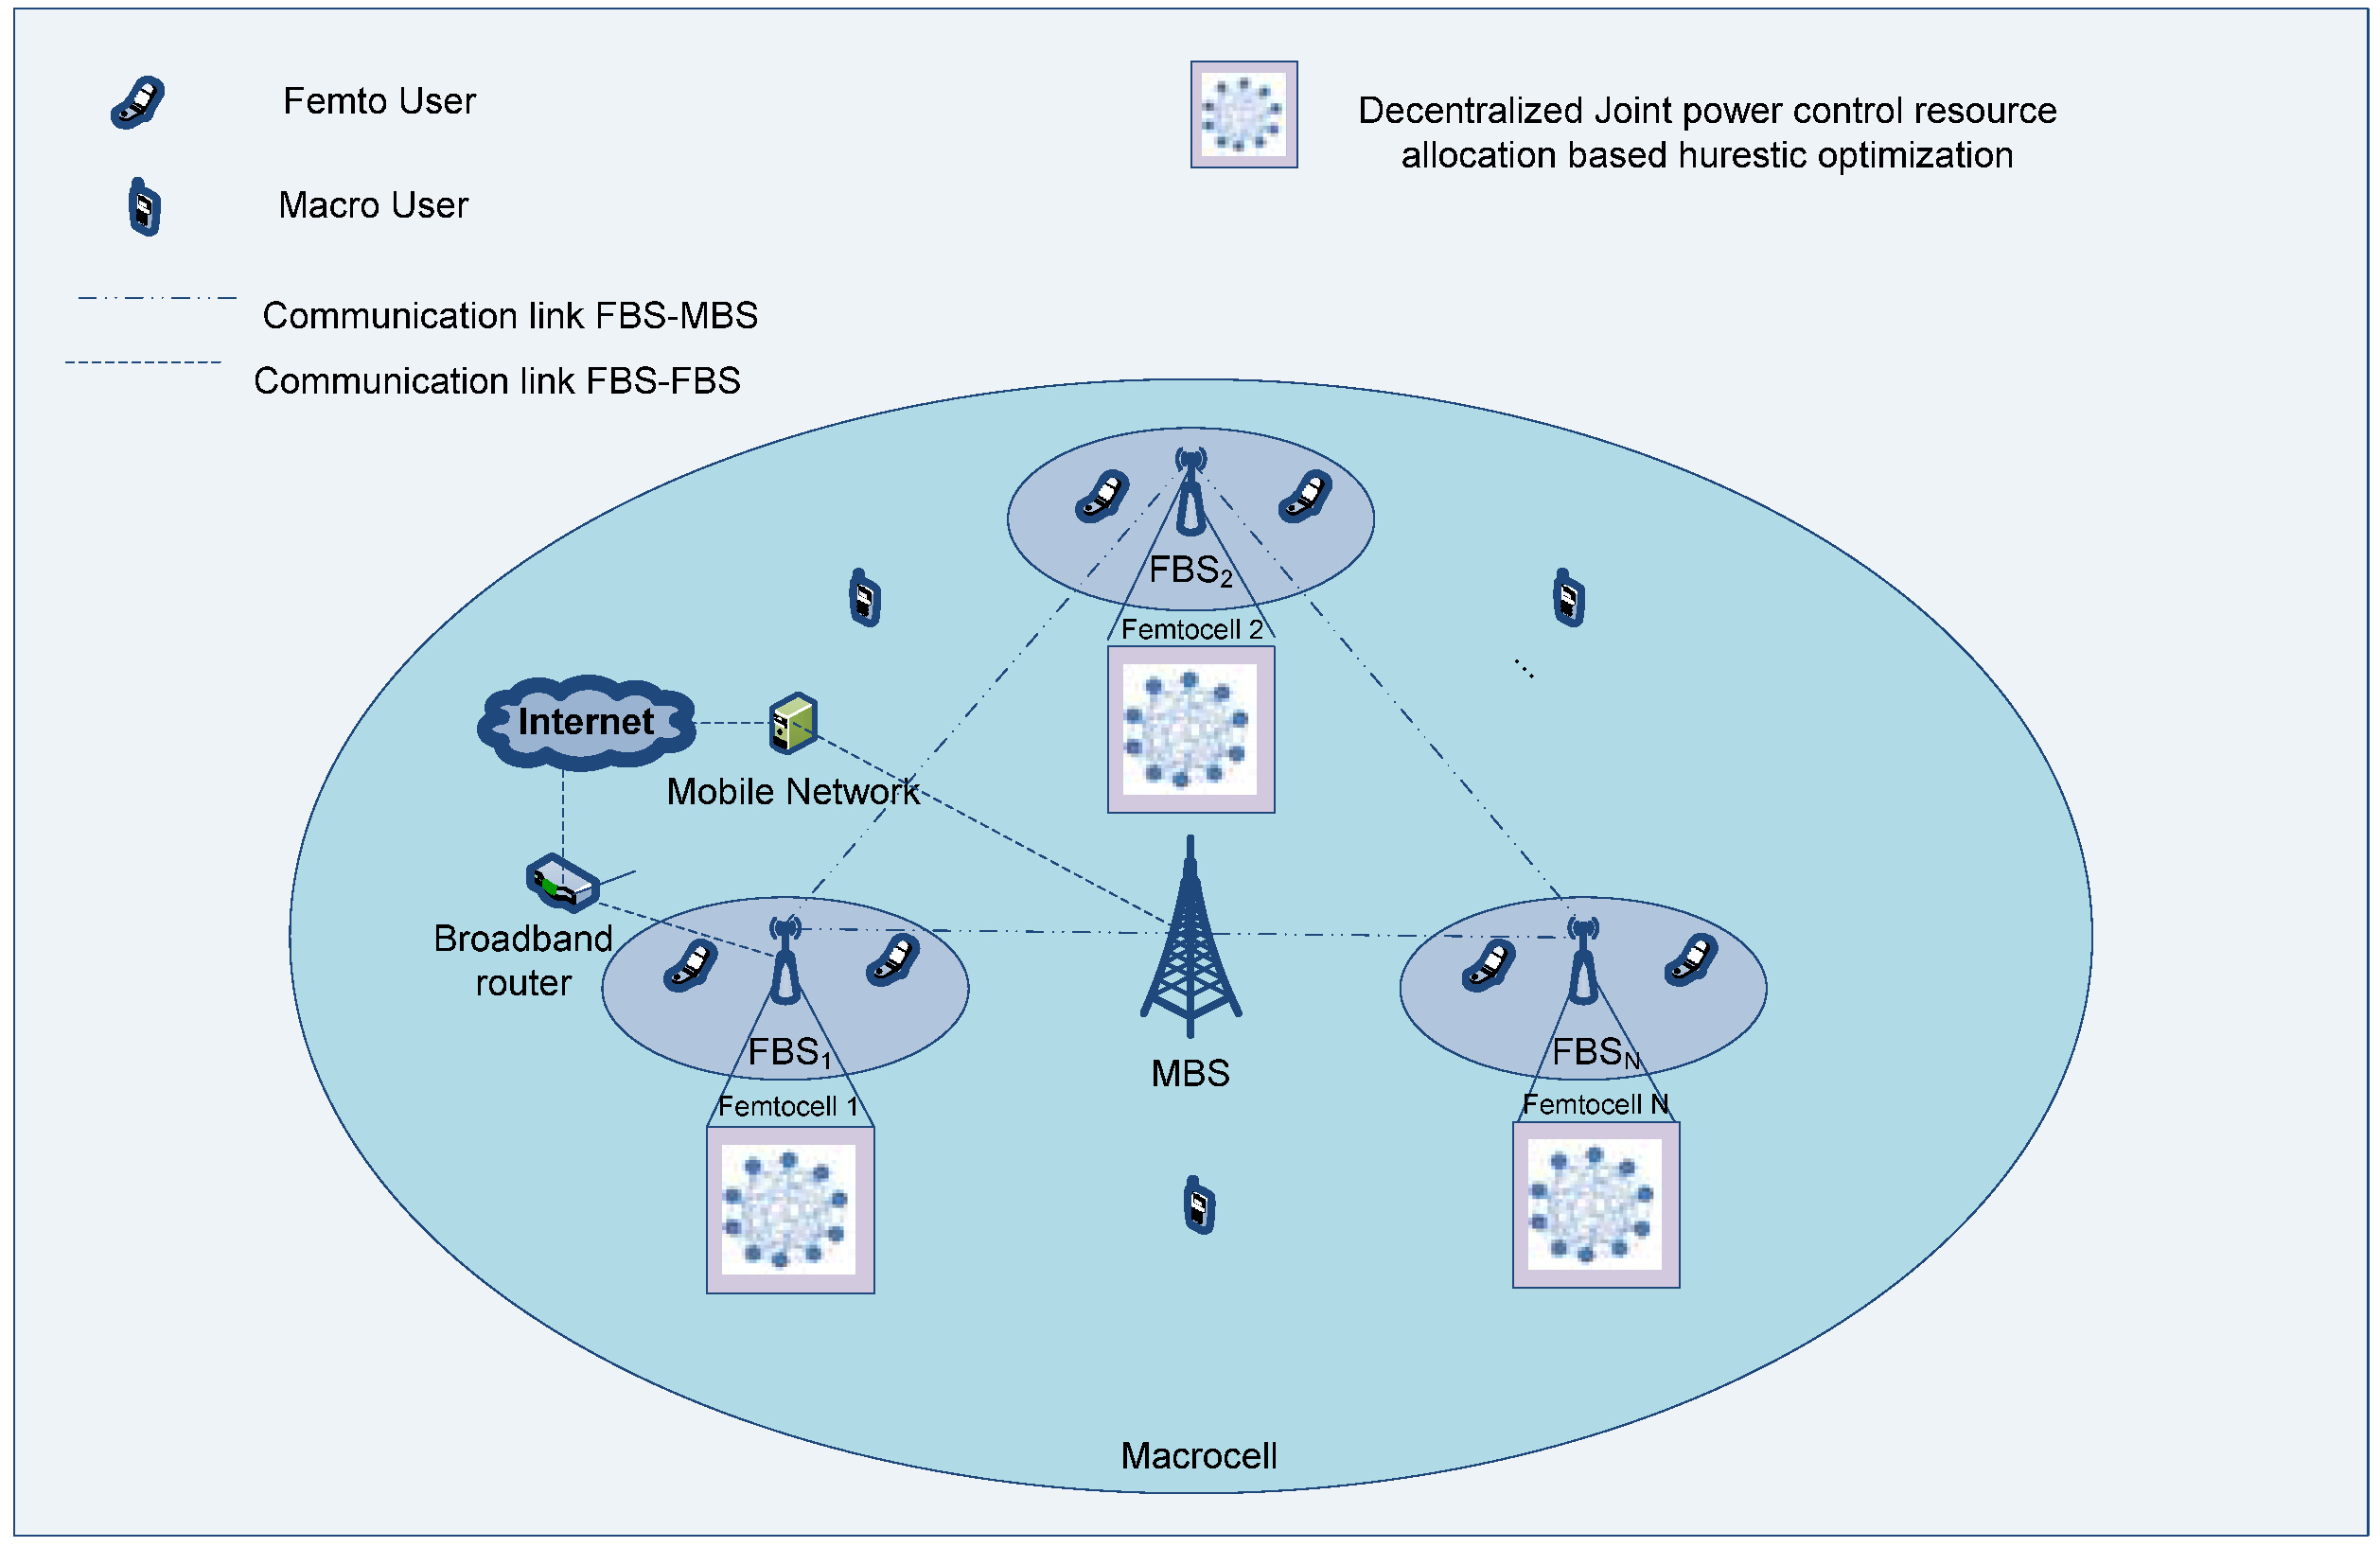
3.1. Proposed Framework

The framework is comprised of the femtocells overlaid in a macrocell as shown in Figure 1. As far as the shared channel environment of femtocells and macrocell is concerned, two type of interferences i.e., cross-tier (femto-macro) and co-tier (femto-femto), deteriorate in the throughput of the femtocells. Therefore, for mitigating the impact of interferences, we assume the coordination among FBSs by a wireless dedicated link that supports low data rates and between FBSs and MBSs via the existing backhaul link. We propose a joint power assignment and resource allocation in a decentralized manner by employing the two heuristic algorithms: PSO and GA. Here, the decentralized approach corresponds to the said joint optimization that executes on each FBS. The concern of exploiting decentralized optimization is twofold: first, there is no need for any centralized entity to perform the optimization task, and secondly, the convergence time is significantly reduced. The avoidance of a centralized entity for performing optimization contributes a significant advantage in terms of scalability. The overall convergence time is reduced because the optimization on each FBS is triggered by the best solution received from the neighboring ones. Moreover, the coordination of FBS with others and with MBS, results in optimally allocating the channels to FUs and power assignment to FBS, which can significantly reduce the impact of interference.
Figure 1. Proposed framework.
Entropy 15 02524 g001

3.2. Network Model and Problem Formulation

We consider a fixed network comprised of k FUs, X = u1, u2, u3,,uk, and l FBSs, Y = FBS1, FBS2, FBS3,, FBSl. In this study, we assume a closed group formation in femtocells in which only a fixed number of FUs are attached to a FBS. The FUs association with FBSs is given by the matrix U of dimension, l x k, as in Equation (1). The resources is comprised of m channels, Z = c1, c2, c3,, cm, each of having same the bandwidth of B Hz. The allocation of the channels to FUs is represented by the matrix M of dimension, k x m, as in Equation (3):
U y , x = { 1 , x th FU is connected to   y th FBS 0 , otherwise
y = 1 l U y , x = 1 ,   x X
M x , z = { 1 , x th FU is allocated   z th channel 0 , otherwise
z = 1 m M x , z = 1 ,   x X
Equation (2) illustrates that a FU is, at most associated to a unique FBS, and only one channel is allocated to it as in Equation (4). The power level assignment to the yth FBS is represented by P = {p1, p2, p3,…,pl}and these discrete levels are to be selected in the range from min-max, as specified in the result’s section. The channel gain, hy,x, is represented by the l x k matrix, H = {hy,x}, and this corresponds to the gain between the xth FU and yth FBS. The thermal noise is represented by 1 x k vector, N = {nx} and this corresponds to the noise nx at the xth FU. The values of the matrix H are computed using the indoor channel model, and the vector N is pre-computed. The signal-to-noise and interference ratio (SINR) that results from the association of xth FU to the yth FBS is given by Equation (5):
S I N R y , x = p y h y , x n x + I y , x
I y , x = I y , x + I y , x
where I y , x is the interference component that corresponds to the cross-tier, and it is acquired by the coordination of FBS with MBS, whereas, the other, I y , x , is the co-tier interference component and is evaluated in Equations (7) and (8):
I y , x = z = 1 m φ = 1 , φ y l p φ h φ , x γ l , z M x , z
γ l , z = { 1 , v = 1 k U l , v M v , z 0 , otherwise
The binary variable γ means the allocation of the z-th channel to FUs by yth FBS and pφ is the power assignment to φ-th FBS. According to the Shannon capacity formula, the throughput of yth FBS is given in Equation (9),
R y = x = 1 k U y , x B log 2 ( 1 + S I N R y , x ) v = 1 k U y , v z = 1 m M v , z M x , z
The denominator in Equation (9) corresponds to the number of FUs associated with the yth FBS. Finally, the optimization problem is formulated as,
Maximize: F = Minimum (Ry), ∀yY

3.3. Notation and Assumptions

The notations presented in Table 1 are used throughout the rest of this paper.
Table 1. Notations and assumptions.
ParametersMeaning
FUFemto user;
FBSFemto base station;
MUMacro user;
MBSMacro base station;
lNumber of femtocells within a macrocell;
kNumber of FUs;
mNumber of available channels;
hy,xChannel gain of the link between xth user and yth FBS;
nxThermal noise on the xth FU;
I y , x Cross-tier interference component while association of xth FU with yth FBS;
I y , x Co-tier interference component while association of xth FU with yth FBS;
I y , x Combined interference;
RyThroughput of the yth FBS;
PParticles per FBS;

4. Particle Swarm Optimization

4.1. Generalized PSO and Its Variants

PSO is a population-based biologically-inspired algorithm, inspired by the bird flocking and fish schooling mechanism. These types of algorithms are specifically useful where the sample space is very large, the parameters of interest are dynamic, and there little information exchanged between the users (particles) [23].
The PSO algorithm starts with populating the swarm of particles as in Figure 2, where each particle represents a potential solution. The swarm is similar to the population, while a particle is equivalent to the individual. Each particle is associated with a position and velocity in search space. In each iteration of the algorithm, the fitness is computed using Equation (13) and both the velocity and position of each particle are updated according to Equation (11) or Equations (12) and (13), respectively. In this study, we use two variants of PSO such as inertia weight and constriction factor model. In PSO-IW, velocity is updated via Equation (11), whereas in PSO-CM, it is updated by Equation (13).
Figure 2. Flow chart description of generalized PSO.
Entropy 15 02524 g002
Moreover, PSO-CM is actually the advanced form that guarantees faster convergence. In both variants, the velocity of each particle is updated according to the finest two known positions, the personal best position (pbest) and the neighborhood best position (nbest), where pbest is the best position the particle has visited and nbest is the best position corresponding to the particle and its neighbor hood have visited since for the first time step. When the whole swarm is considered as the neighbor then the nbest is termed as global best gbest and for small neighbor hood nbest is equivalent to local best lbest. The major difference between the two positions is the convergence, i.e., due to large particle size gbest PSO converges faster than the lbest PSO. Furthermore, lbest PSO has the chance of being trapped due to small sample space. Therefore, in our case, we are using gbest because it yields faster convergence:
V t n e w = V t + a c 1 r 1 ( p b e s t t X t ) + a c 2 r 2 ( n b e s t t X t ) t = 1 , 2 , ... , P
X t n e w = X t + V t n e w
where:
  • ac1 and ac2 are termed as acceleration coefficients whose job is to control the influence in the search process.
  • P is the number of particles in a swarm.
  • r1 and r2 are two random numbers uniformly distributed in the interval from [0,1].
  • Xt, X t n e w , Vt and V t n e w represents the current and updated position and velocity of the tth particle.
The work done by Clerc [24] (1999) indicates that the incorporation of constriction factor may increase the convergence. A simplified method of its implication is given in Equation (13):
V t n e w = ( V t + a c 1 r 1 ( p b e s t t X t ) + a c 2 r 2 ( n b e s t t X t ) ) t = 1 , 2 , ... , P
= 2 | 2 ϕ ϕ 2 4 ϕ |
where: φ = a c 1 + a c 2 ,   φ > 4 and is a function of ac1 and ac2 and is given in Equation (14).

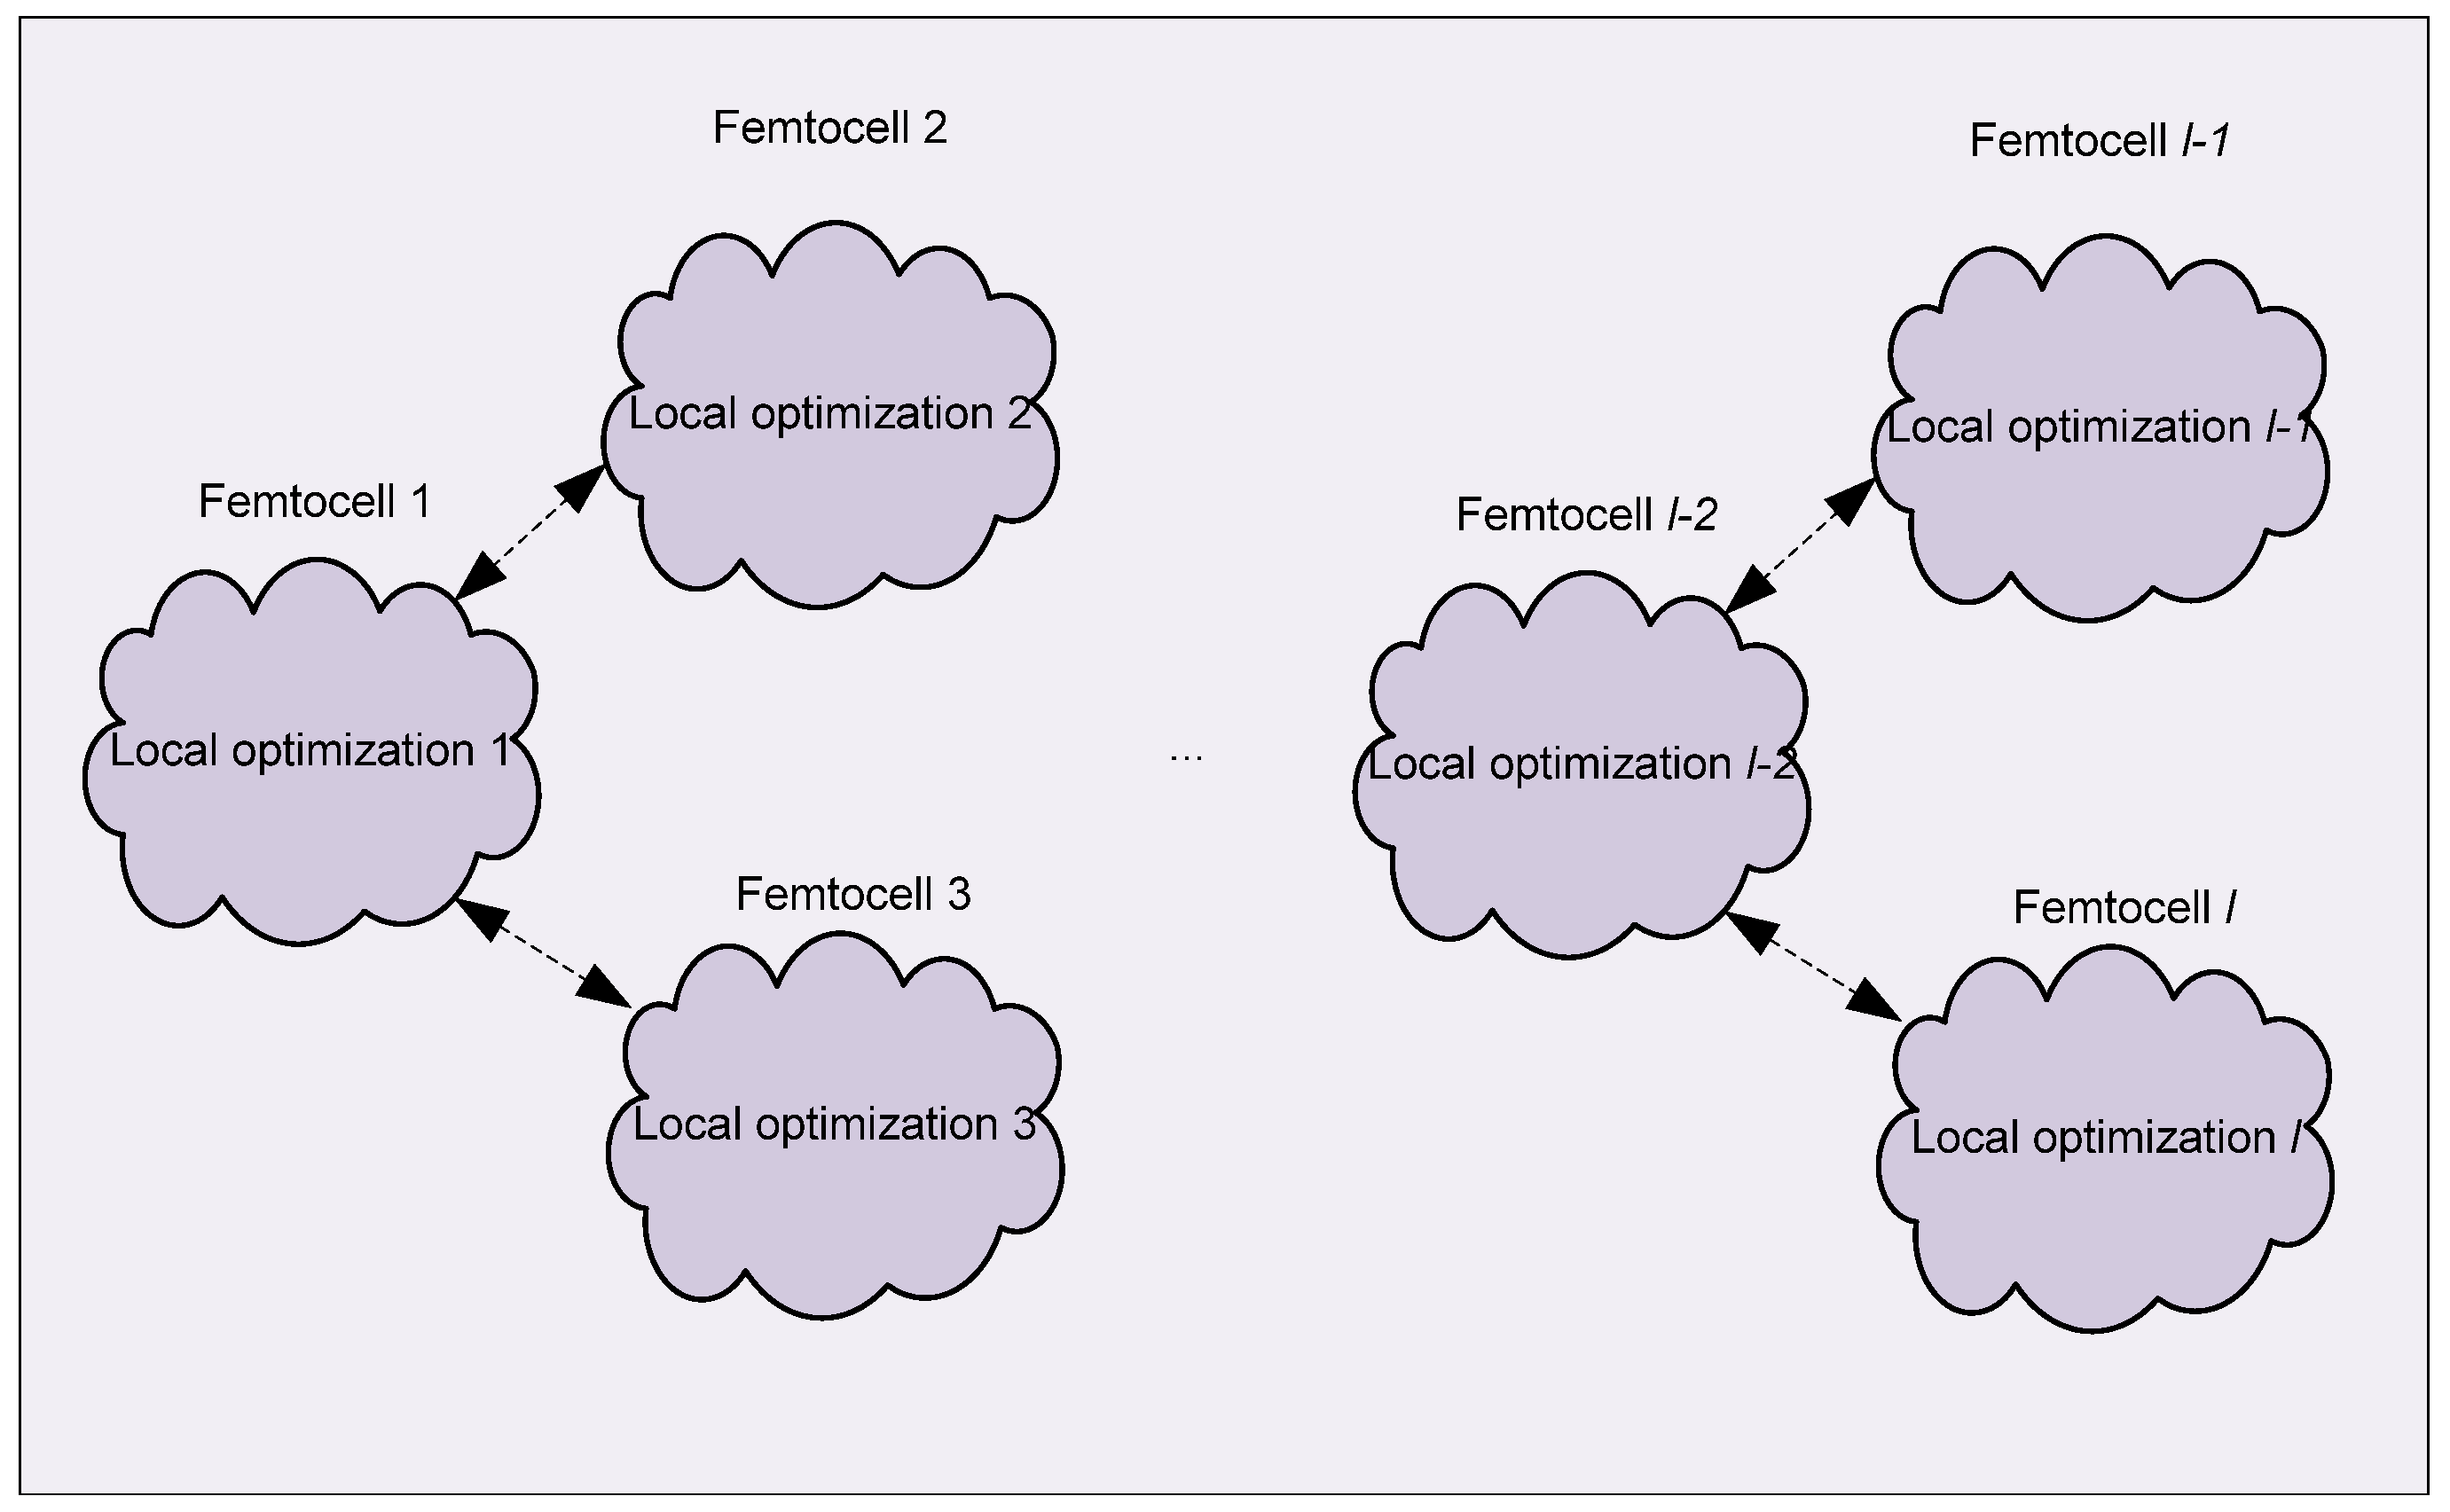
4.2. Decentralized PSO (DPSO)

The main idea behind DPSO is to break the optimization task into a bunch of local optimizations. This will lead to achieving faster convergence. The crux of DPSO can be summarized as follows: Under the same assumption of k FU and l FBSs within the macrocell network, we partition the whole swarm into groups of 15 particles, where each group is allocated to each for local optimization. Moreover, the optimization in terms of objective function computation is individually performed on each FBS as shown in Figure 3.
Figure 3. DPSO.
Figure 3. DPSO.
Entropy 15 02524 g003
However, after each generation of PSO on each FBS, the gbest particle and its position is shared with the neighbours. The received best particle position is only updated in the FBS, if its fitness value is higher than the local best particles. This particle updating will trigger the optimization process in a more controlled manner and will result in achieving faster convergence. To avoid excessive sharing of particle position to the neighbor FBSs, the position is only shared if there is a significant fitness value gap, i.e., around 5%–10% between the current and the previous generation.

5. DPSO for Joint Power Assignment and Resource Allocation in Femtocell

This section includes the details of the proposed decentralized algorithm for joint optimization. The algorithm includes several steps such as: discrete power levels assignment to FBS and channel allocation to FUs (particle encoding), quantifying the particle encoding (fitness evaluation) and changing the particle encoding with the aim of achieving better fitness value (updating position and velocity of the particles). Furthermore, an algorithm is also proposed for the said joint optimization.

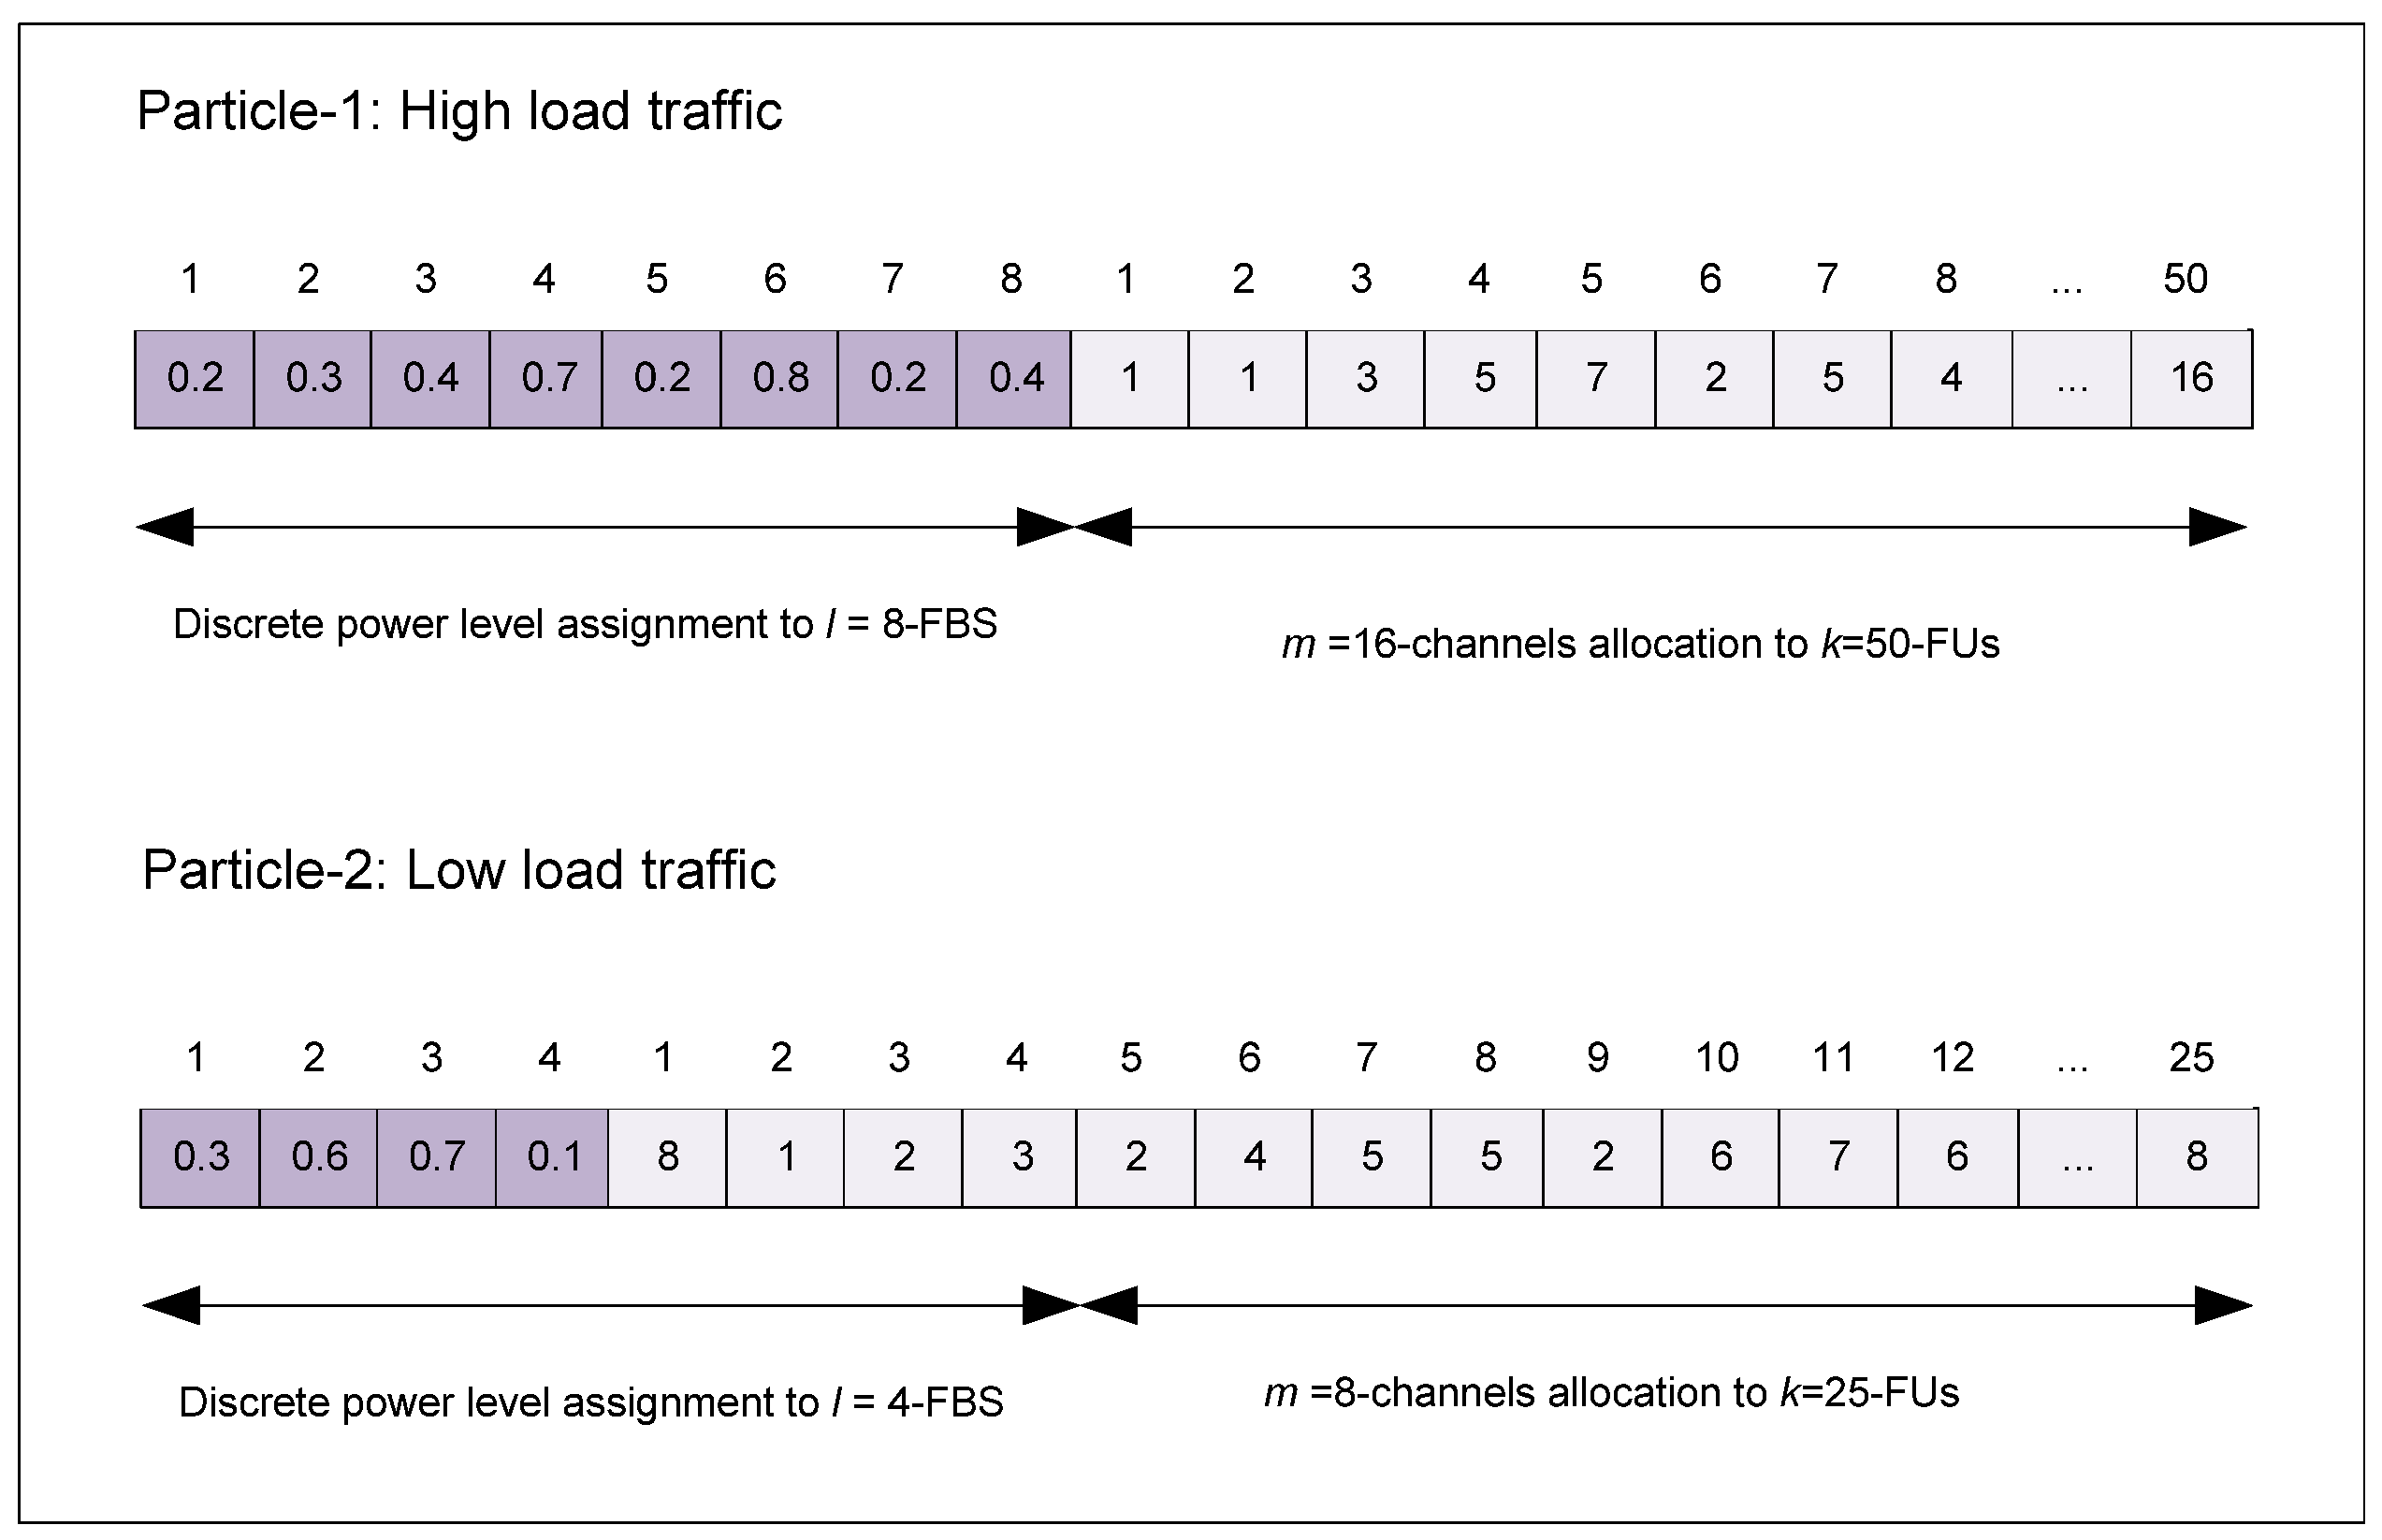
5.1. Particle Encoding

The major concern in PSO is to classify the encoding scheme i.e., binding the particle with the solution. Each particle should represent the one complete solution for the problem under consideration. In our case, the solution means the assignment of discrete power levels to l FBSs and the allocation of m available channels to the k FUs. Each FBS houses same number of particles, P, for local optimization. To further clarify the particleʼs encoding, let us consider two scenarios that we actually used in the resultʼs section for the performance evaluation, i.e., high load traffic (l = 8, k = 50 and m = 16) and low load traffic (l = 4, k = 25 and m = 25). There are 8 evenly distributed discrete power levels: 0.1W, 0.2W, 0.3W,…, 0.8W; are to be assigned to FBSs. Figure 4 illustrates the particles encoding for the above-mentioned scenarios. Particle-1 is of length l + m = 58, whereas, particle-2 is of length l + m = 29. It can be clearly seen that for the each of the aforementioned scenarios, each particle is the complete solution in terms of the power assignment to FBSs and the channel allocation to FUs.
The (l + m)-dimensional tth particle’s position is defined as Xt = {Xt1, Xt2, Xt3,…,Xt(l+m)}. Each tth particle of FBSs houses the discrete power levels for l FBSs and the channel allocation to k FUs. For example, as shown in Figure 4, particle-1, depicts the assignment power levels to 8 FBSs (0.2W, 0.3W, 0.4W, 0.7W, 0.2W, 0.8W, 0.2W, 0.4W) and the 16 channel allocation to 50 users are (1, 1, 3, 5, 7, 2, 5, 4,…, 16).
Figure 4. Particle encoding for DPSO.
Entropy 15 02524 g004

5.2. Fitness Function

In this study, we employ the maximization of the minimum throughput of the FBS as the optimization criterion. However, the throughput of the FBS is significantly deteriorated by the cross-tier and co-tier interference as discussed in Section 3. Therefore, to mitigate the effect of the afore mentioned interference sources, joint power assignment and resource allocation is carried out. The fitness function of the tth particle is equivalent to function F, as expressed in Equation (10) in Section 3. The higher the fitness value of the tth particle, the less will be the impact of interferences and correspondingly the higher will be the throughput of the FBS:
Fitness[t] = F
Algorithm 1: DPSO for Joint power assignment and resource allocation
Input: Association relationship of k FUs with l FBS.
  • pbest, nbest, X and V: (P, l+m)-dimensional.
  • gbestrec: (1, l+m)-dimensional is the best particle received.
  • gbest: (l-1, l+m)-dimensional is the local best received particles from l-1 FBS.
Output: Power assignment and channel allocation, S = {P*, C*} (P* = power assignment and C* = Channel allocation).
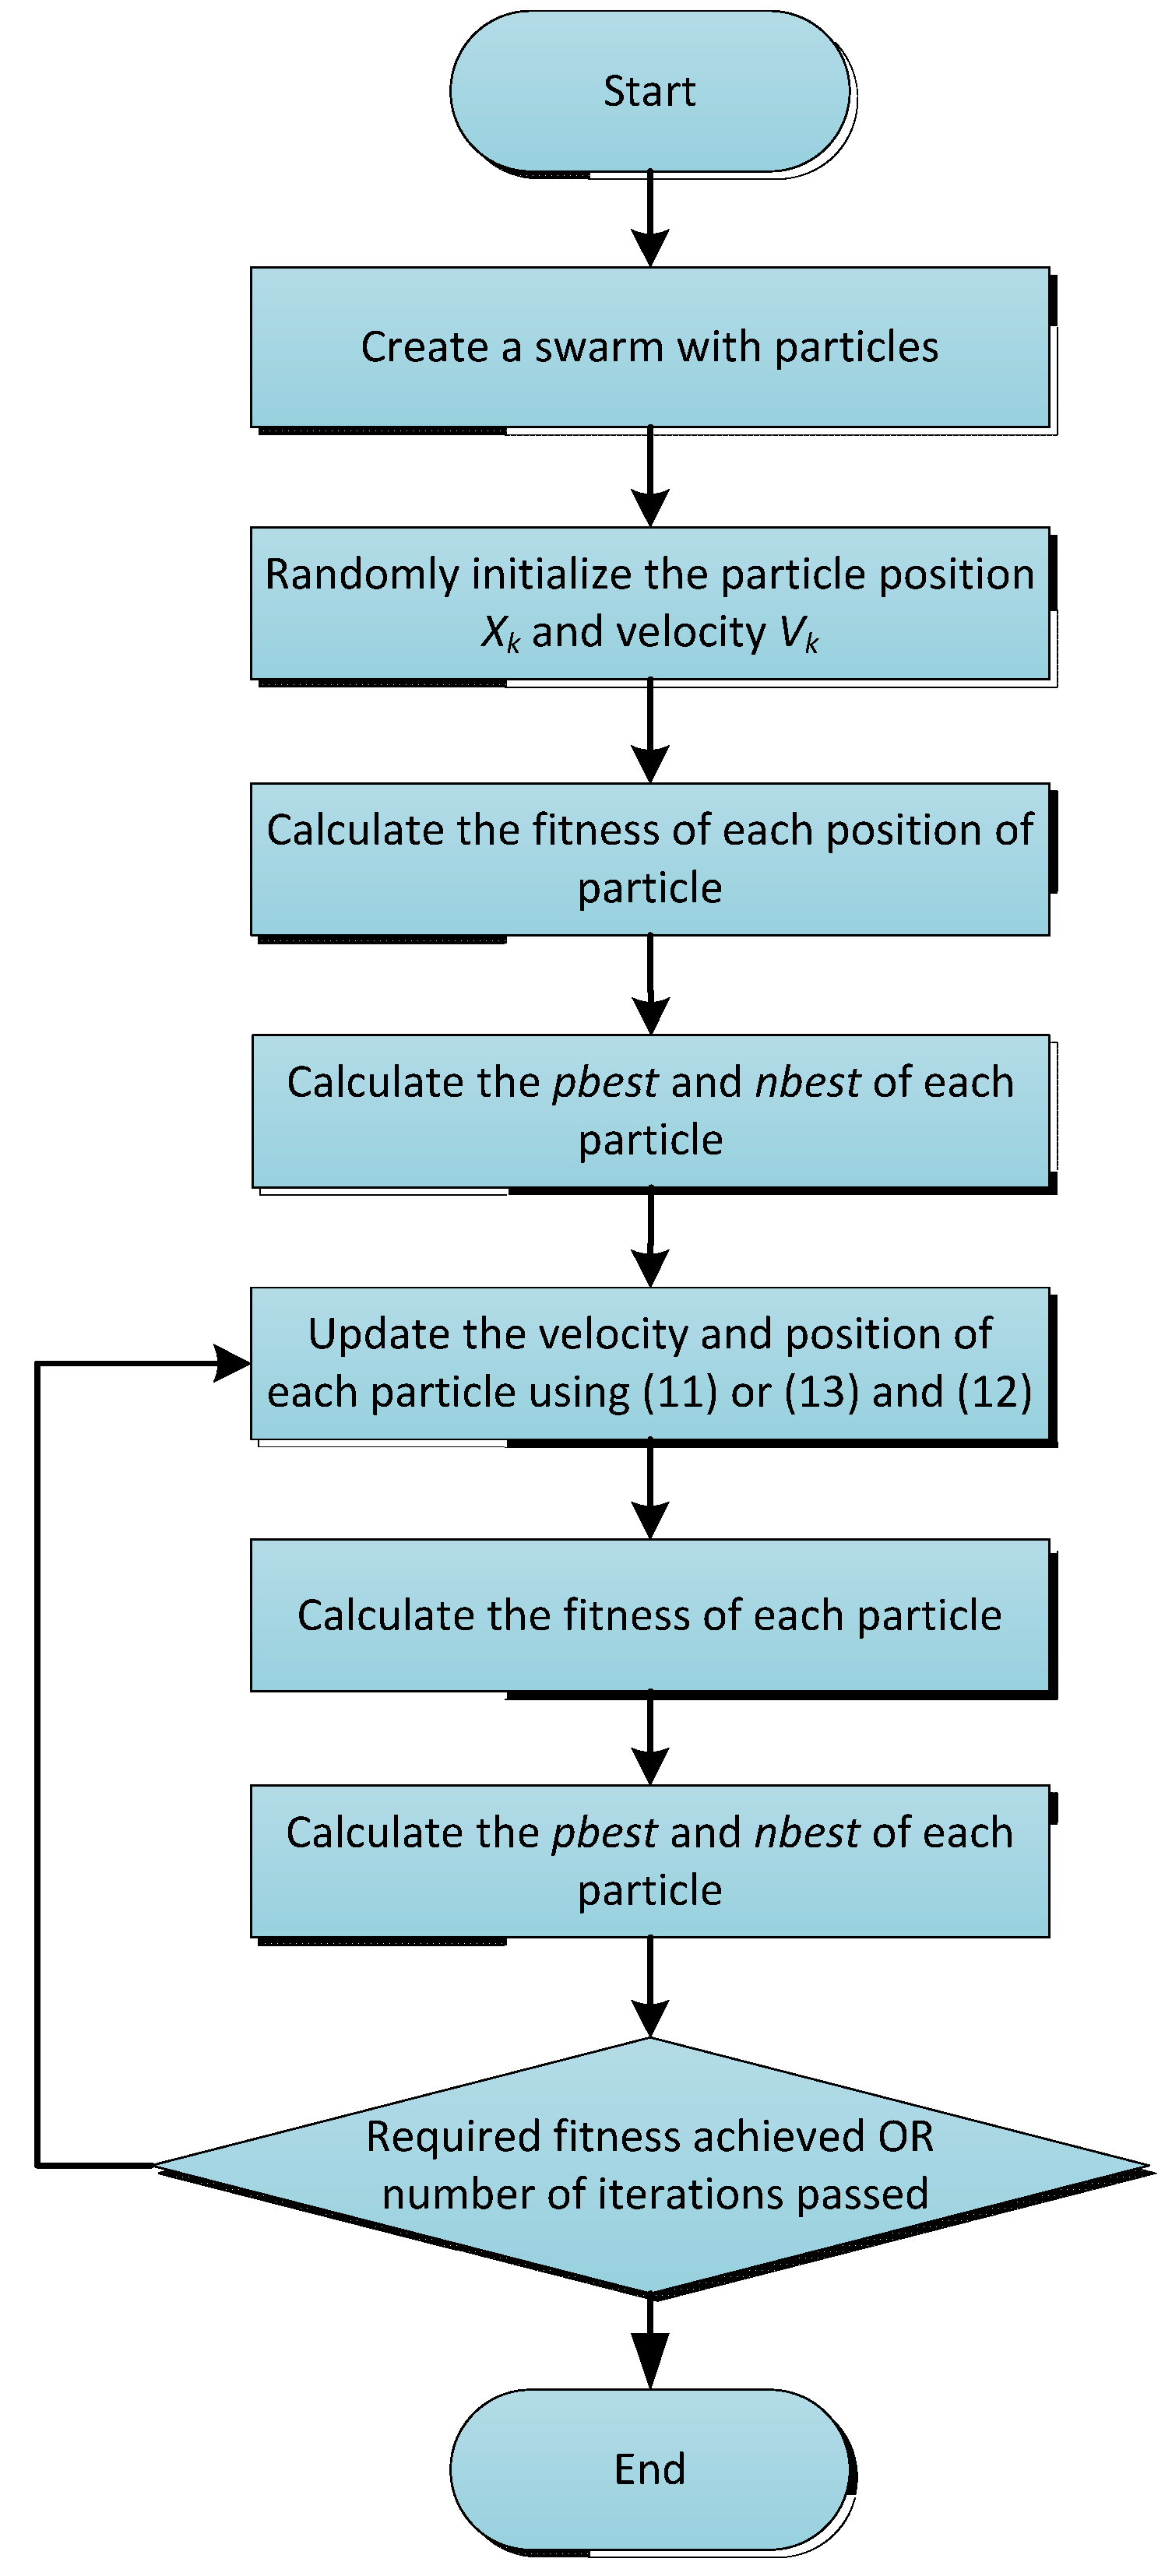
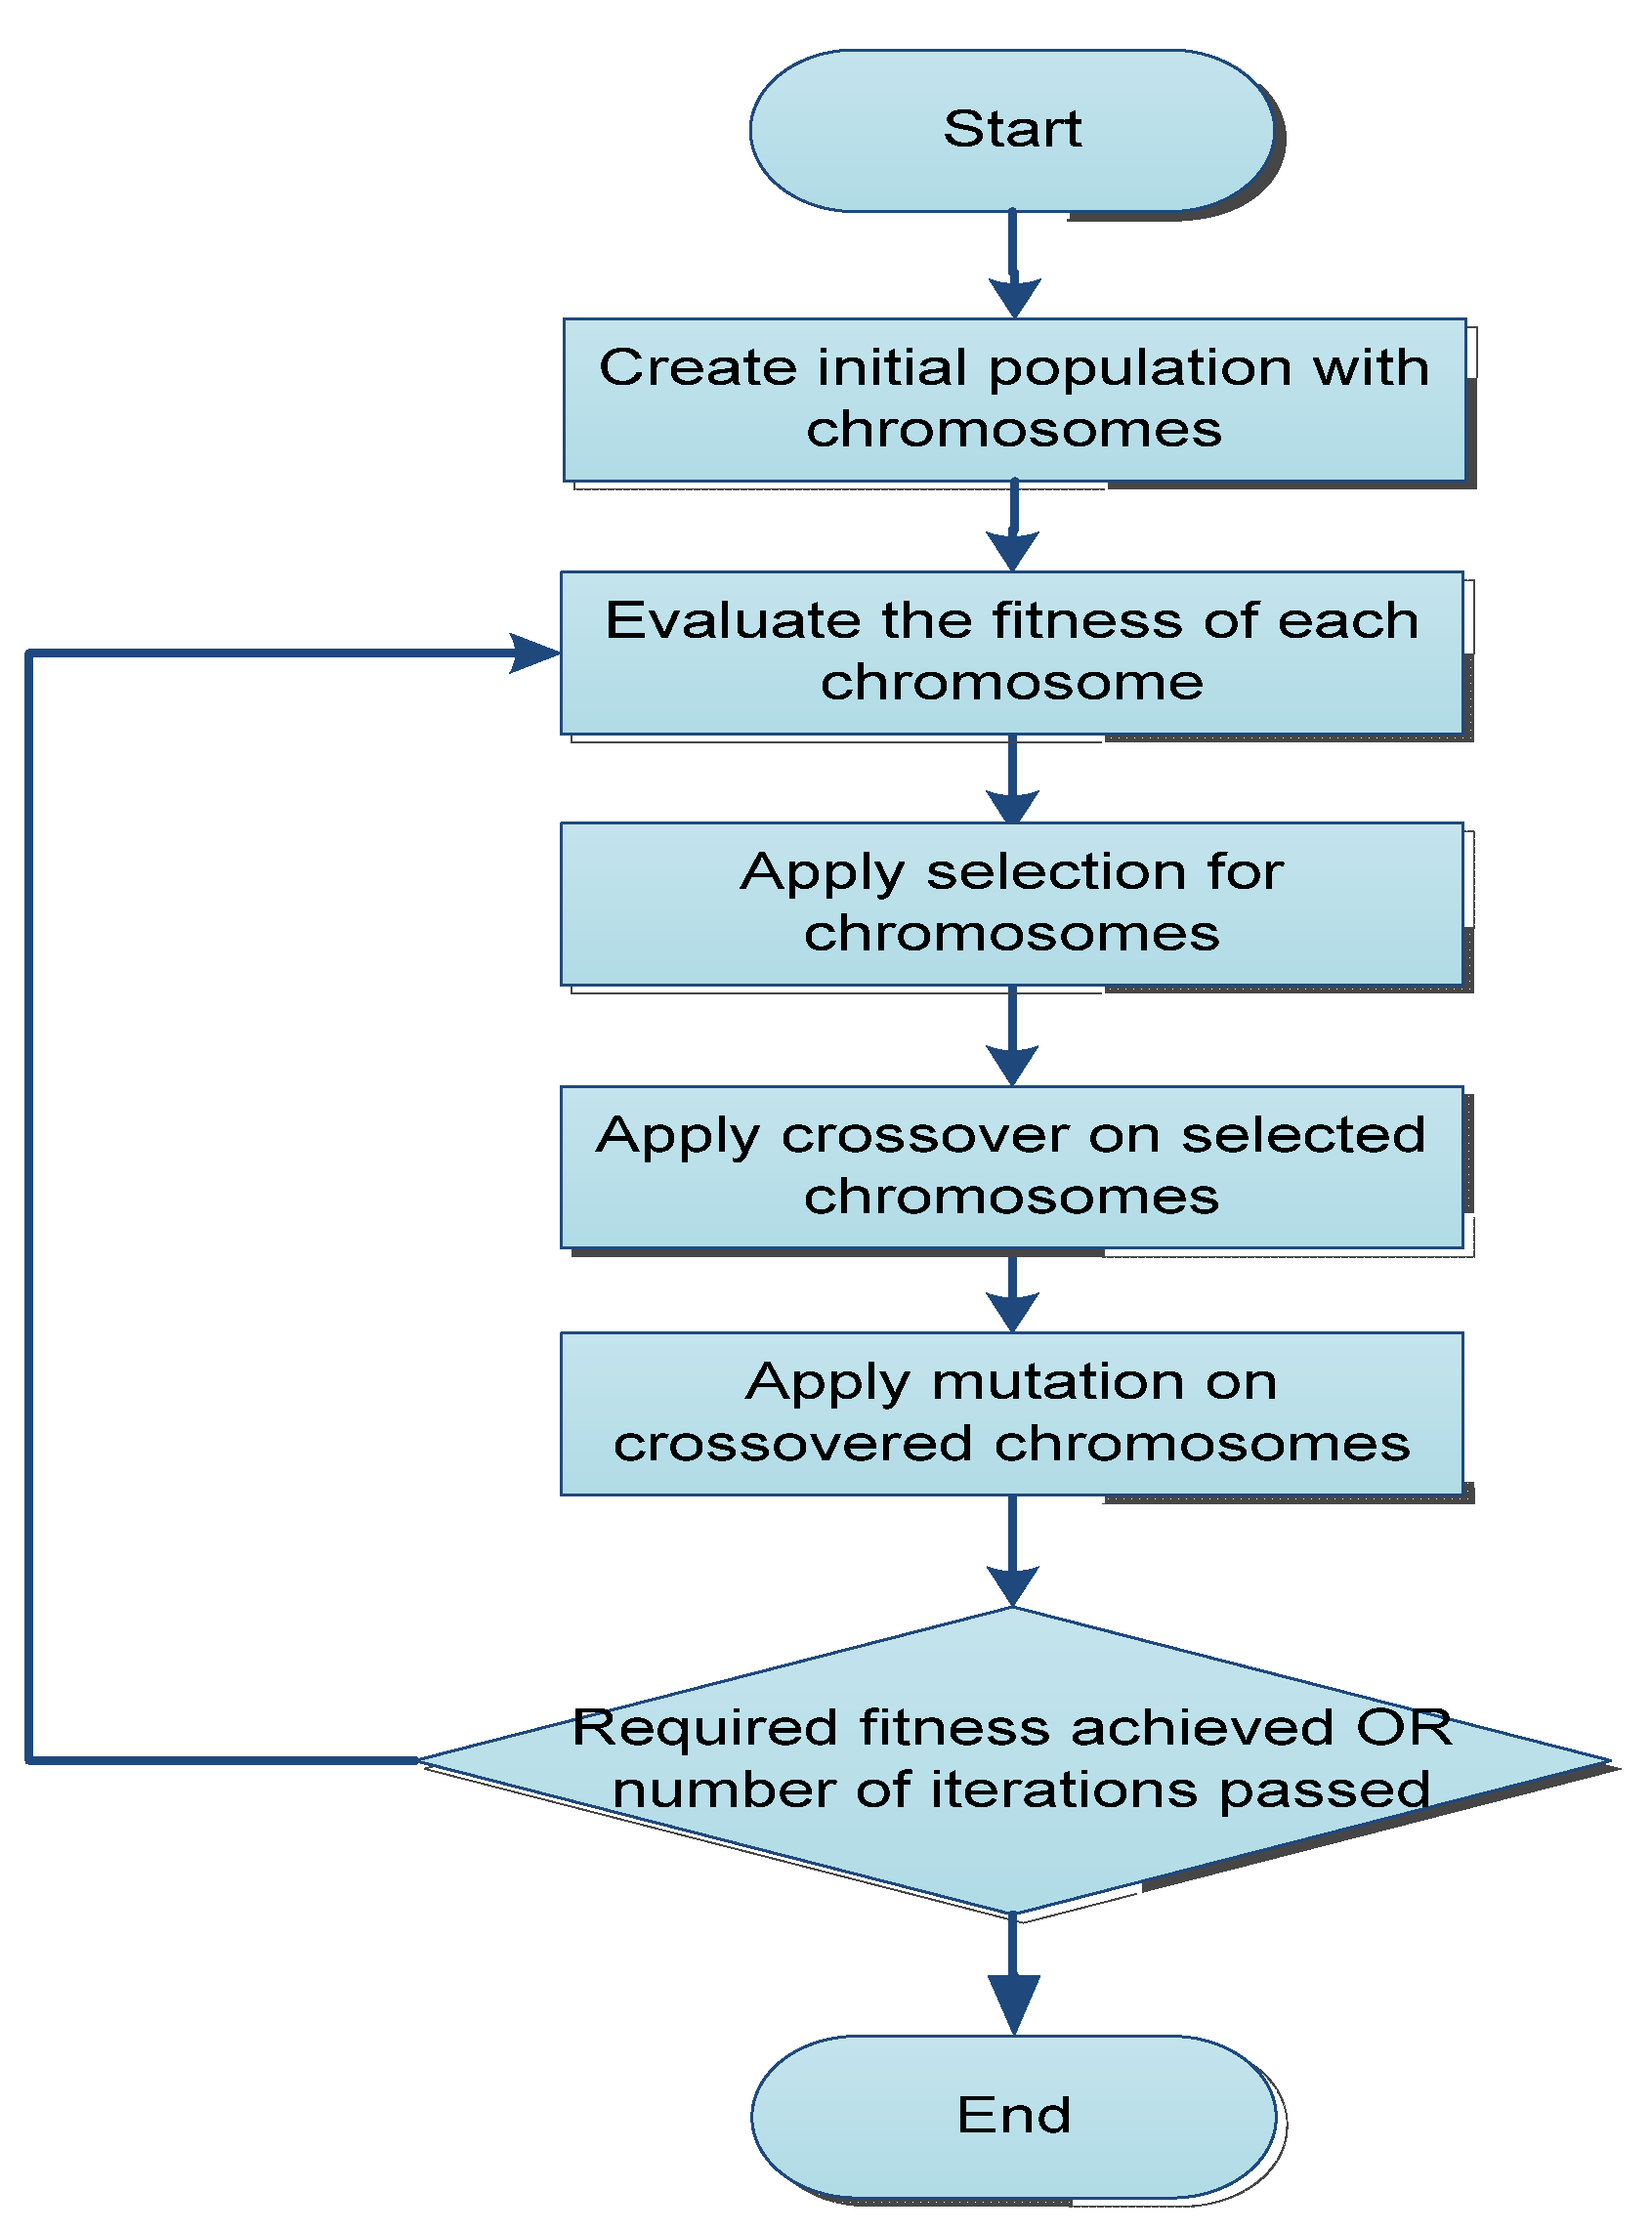
  • while (stopping condition (required fitness is achieved OR the number of iteration passed) )
  • for each FBSs y do
  • for each particle t do
  • if fitness(Xt) > fitness(pbestt)% where fitness() is the fitness function (15)
  • pbestt ← Xt
  • end if
  • if fitness(pbestt) > fitness(nbestt)
  • nbestt ← pbestt
  • end if
  • end for
  • if nbesty < maximum (gbestr) r = 1,2,3,…,l-1
  • X ← gbestrec
  • end if
  • for each particles t
  • Compute new velocity V t n e w using [ (11) for PSO-IW and (13) for PSO-CM ]
  • Compute new position X t n e w using (12)
  • end for
  • end for
  • end while
  • return S ← bestfitness(Xy), y l

5.3. Update of Velocity and Position

For achieving the optimization of the problem, the particles position of PSO-IWis updated with new velocity and position as in Equations (11) and (12). Remember that each particle depicts the power assignment to the FBSs and resource allocation to FUs. The velocity of the tth particle is represented by (l+m)-dimensional vector, i.e., Vt = Vt1, Vt2, Vt3,…,Vt(l+m), Vti R, where each element is represented by the real number and this corresponds to the change of power levels of the FBSs and channel allocation to femto users after being added to the position vector. For example, let us take particle-1 as shown in Figure 4, the velocity vector of the particle (−0.1, 0.3, 0.4, 0.1, −0.2, 0.1, 0.1, 0.1, −0.1, 1.2, −3.2, 4.5, 3.6, 2.5, −4.8, 6.7, 5.5,…, −9.1) is added to the position vector (0.2, 0.3, 0.4, 0.7, 0.2, 0.8, 0.2, 0.4, 1, 1, 3, 5, 7, 2, 5, 4, …, 16) to get the new position vector (0.1, 0.6, 0.8, 0.8, 0, 0.9, 0.3, 0.3, 2.2, −2.2, 8, 4.6, 4.5, 1.8, 11.7, 9.5, …, 7.1. The new position vector is not in accordance with our particle encoding criterion. Therefore, the two steps must be carried out for making it compatible. First, the last m entries of the (l+m)-dimensional particle’s position that corresponds to the channel allocation to FUs, are rounded out to the nearest integer. Secondly, to avoid the out of bond movement of particles in the search space, the values are clamped according to the criterion i.e., [−Vmax, Vmax]. Moreover, Vmax = 0.8 for the first l-elements, and Vmax = 16 for the last k-elements. Therefore, after applying the two mentioned steps the new position vector of the particle is (0.1, 0.6, 0.8, 0.8, 0.1, 0.8, 0.3, 0.3, 2, 1, 8, 5, 5, 2, 12, 10, …, 7).

6. Genetic Algorithm

6.1. Generalized GA and Its Variants

GA, inspired by the Darwinian evolution, has been recognized as a general search strategy and optimization method. It has extensively been applied to many optimization problems including: scheduling, selection, pattern recognition, etc. However, for scheduling it was applied first in 1970, by Holland and Davis.
Generally speaking, GA starts by initializing the population, where population is the collection of chromosomes as shown in Figure 5. Each chromosome depicts the complete solution of the problem and is quantified in terms of the fitness function value. The sociologically inspired operations, crossover, mutation and selection, are applied to the chromosomes with the aim of achieving better solution in terms of high fitness value. The crossover operation refers to the combination of two chromosomes and generating the new ones, while also keeping some characteristics of the old ones. It is just like a child who depicts some characteristic of his parents, with the inclusive of his own also. We are employing two crossover procedures: two point crossover (TC) and uniform crossover (UC). The mutation refers to the generation of a new set of chromosomes from the cross overed ones. The mutation is actually performed to avoiding the local minimum problem, where local minimum means the solution is trapped between some points. Finally, for the next generation to follow up, the newly generated chromosomes, after passing through the crossover and mutation operations, are replaced with the old discarded chromosomes. This procedure results in approaching the optimum solution by interacting with chromosomes. In each generation, the quality of the chromosomes is improved [25].
Figure 5. Generalized GA.
Entropy 15 02524 g005

6.2. Decentralized GA (DGA)

The reason for employing the decentralized GA in femtocell environment is the same as discussed for DPSO in Section 4.2. However, the dissimilarity in terms of populations, operations involved is elaborated below.
Under the same assumpion of l FBSs and k FUs as in Figure 3, we divide the whole joint optimization into l local ones. Furthermore, each FBS is owed with equal number of chromosomes for local optimization. Specifically, we have used 16 unique chromosomes for each FBS. In each generation of the GA on each FBS, crossover and mutation is performed to generate a new set of chromosomes, and best chromosome in terms of the objective function value is shared with other FBSs. The FBS, after receiving the best chromosomes from its neighbors, perform a simple test before updating the received chromosome to its local solution. The received chromosomes are only updated, if the local best chromosome fitness value is significantly less, i.e., about 10%, than the received ones. If this criterion is met then the best chromosome among the received ones is updated. Moreover, to avoid unnecessary sharing of chromosomes and their fitness value, a procedure is carried out that the chromosomes are only being shared, if there is a significant difference between the best chromosome fitness value of the current and previous generation.

7. DGA for Joint Power Assignment and Resource Allocation in Femtocell

This section includes he details of the proposed decentralized algorithm for the joint optimization. The algorithm includes several steps such as: discrete power levels assignment to FBS and channel allocation to FUs (chromosome encoding), quantifying the chromosomes encoding (fitness evaluation), chromosome selection, crossover and mutations. Furthermore, an algorithm is also proposed for the said joint optimization.

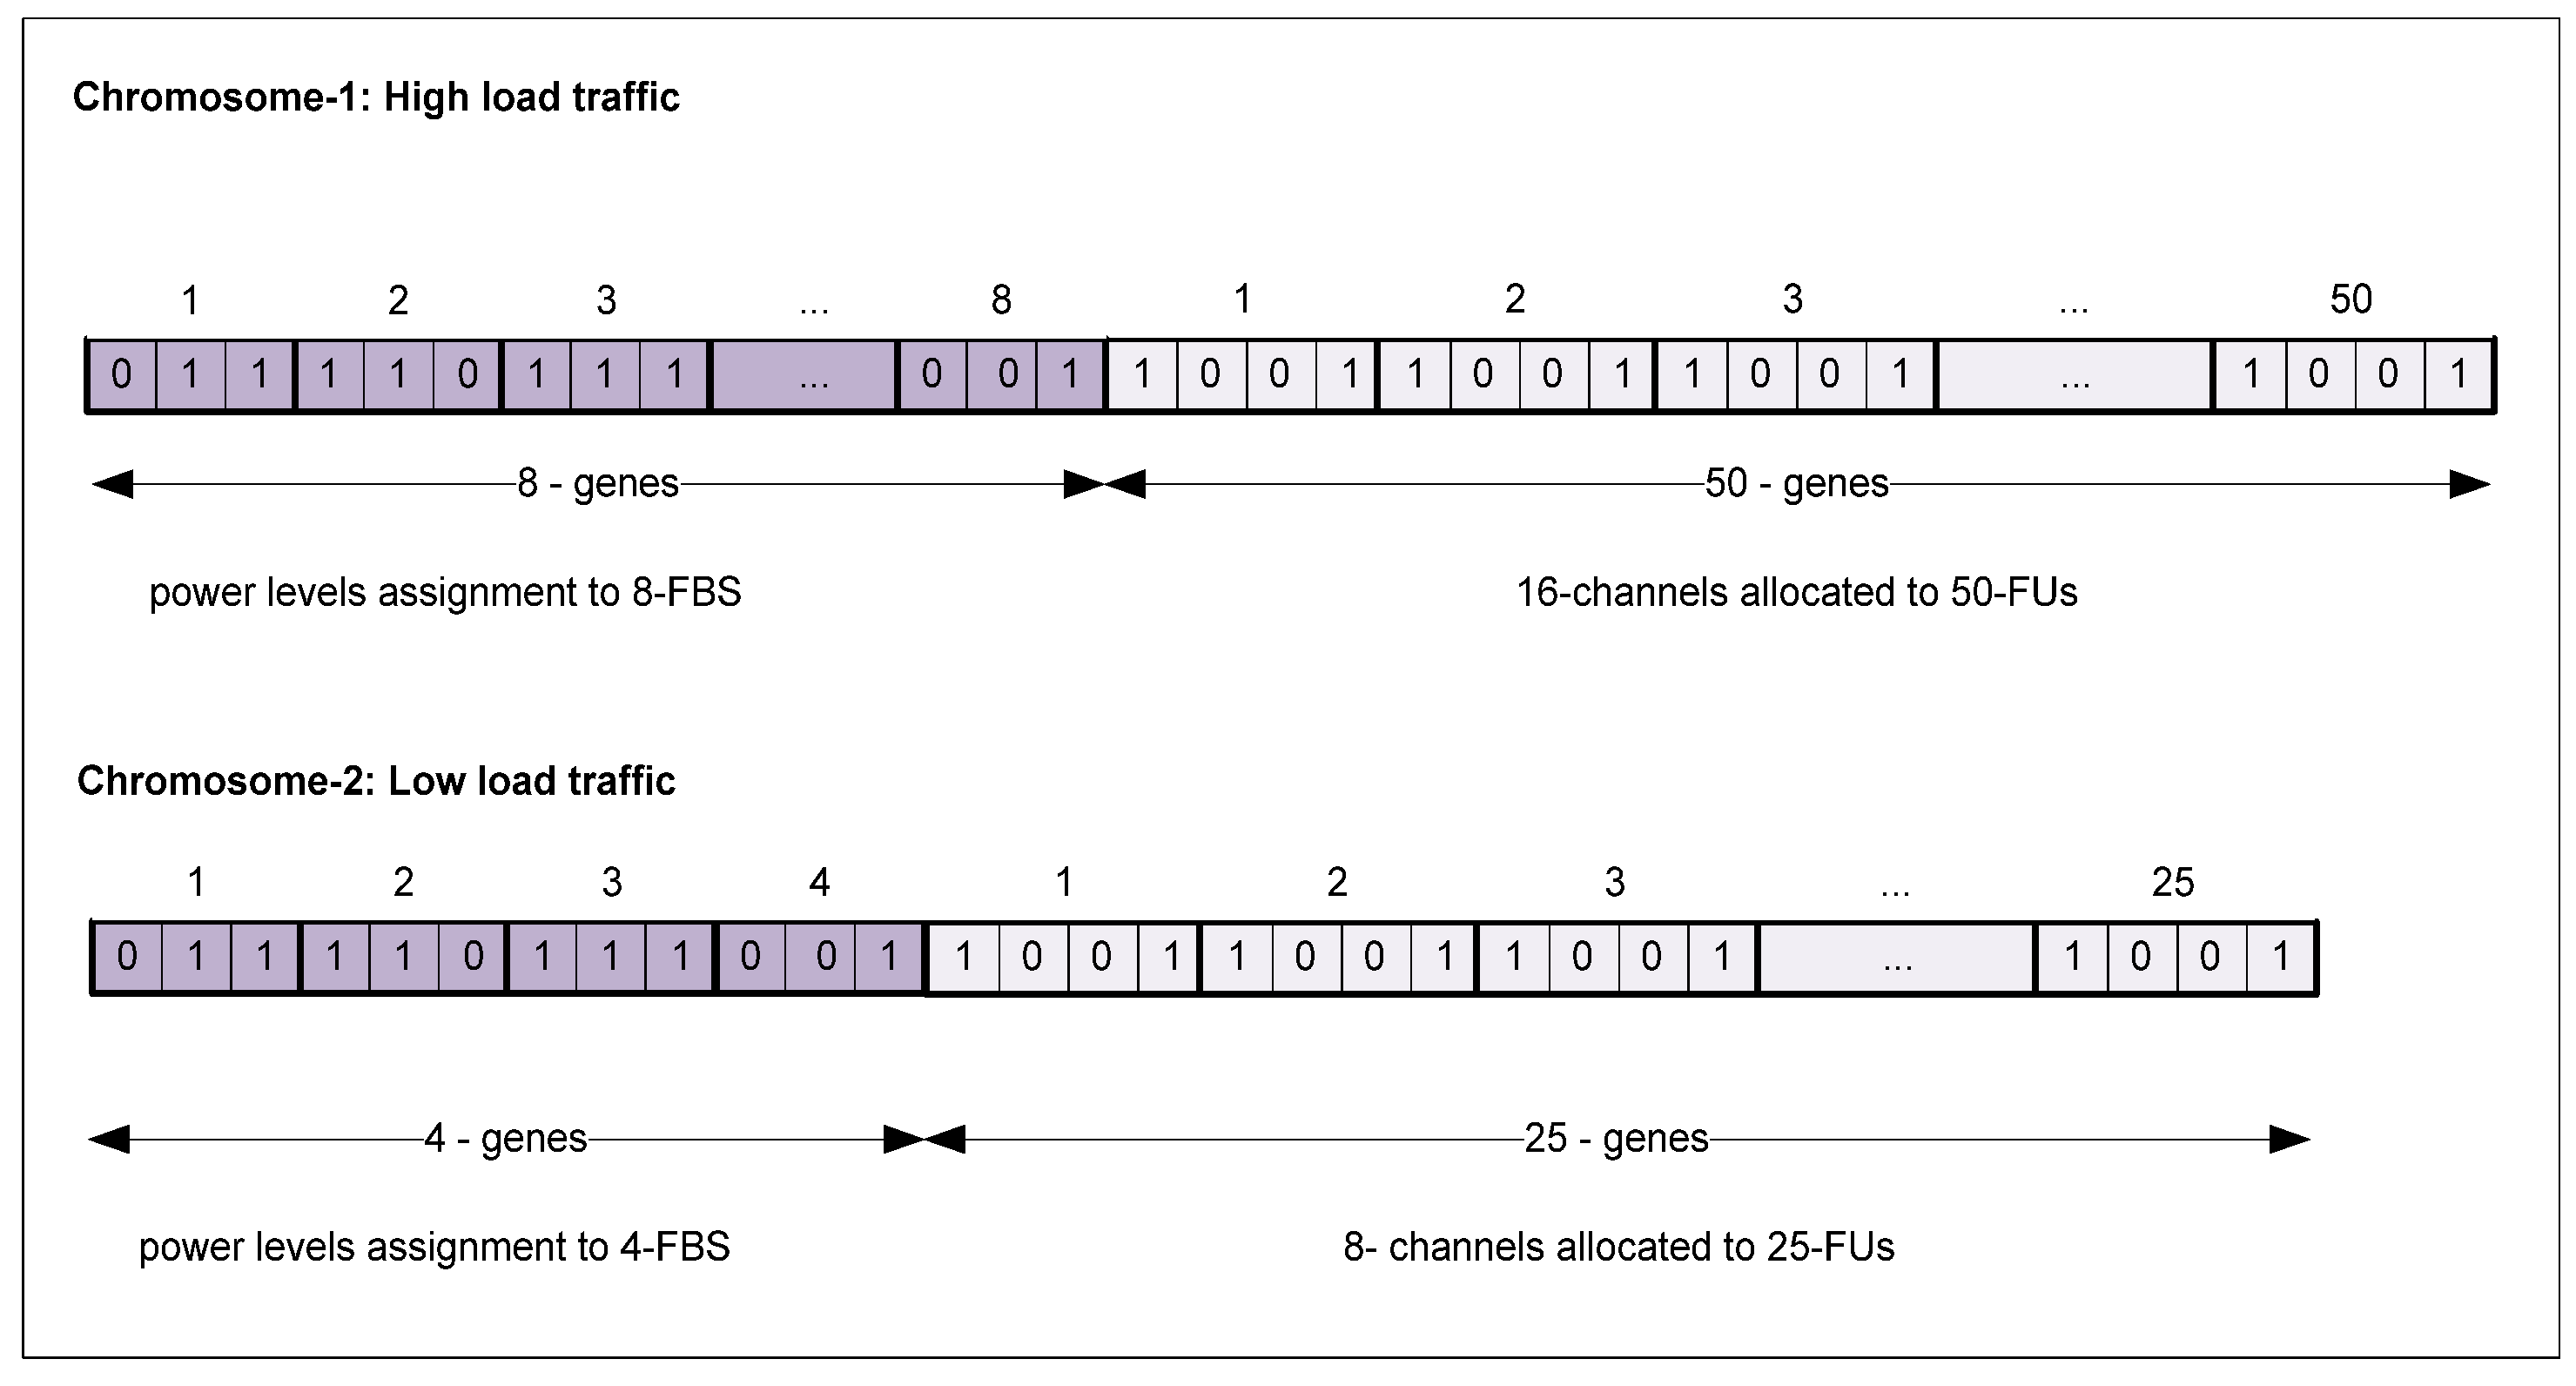
7.1. Chromosome Encoding

Chromosomes are the basic building blocks of the GA. The important concern lies here is that each chromosome should be the complete solution for the problem under consideration. In our case, the problem is the discrete power level assignment to the FBSs and resource allocation to FUs. Therefore, for the assignment of discrete power levels to l-FBSs and the allocation of m-channels to k-FUs, each chromosome is represented by (lnl + knm)-bits, where nl is the number of bits representing a unique power level and nm is the number of bits for a channel allocation to FUs. Furthermore, each chromosome consists of several genes. In our case, there are l genes for discrete power assignment and k genes for channel allocation. Under the same assumption of traffic scenarios as for DPSO, high load and low load, the chromosome illustration for each one is shown in Figure 6. For example, chromosome-1 is the representation of the high traffic load scenario. It can be seen that the first eight, 3-bits, genes/blocks is the discrete power level assignment to 8-FBSs and the last 50, 4-bits, genes/blocks is the channel allocation to the FUs.
Figure 6. Particle Encoding for DPSO.
Entropy 15 02524 g006

7.2. Fitness Computation

The chromosomes that depict the complete solution for the problem are classified quantitatively by the same fitness function that we used in the DPSO for quantifying the particles. Equation (15) is utilized for computing the fitness values of the chromosomes. Remember that fitness function is actually the maximization of the minimum throughput of the FBS.

7.3. Chromosomes Selection

The chromosome’s selection is very important in the GA. In the DGA, each FBS individually carries out the optimization as also discussed in Algorithm 2. In each generation of the GA in FBS, the best chromosomes are selected for the mating, where mating refers to the generation of new chromosomes by crossover and mutation operations. The best chromosomes are classified by the high fitness values in the population. The selection rate used for this study is about 0.5, meaning that half of the chromosomes are selected in each generation for the next follow mating process.

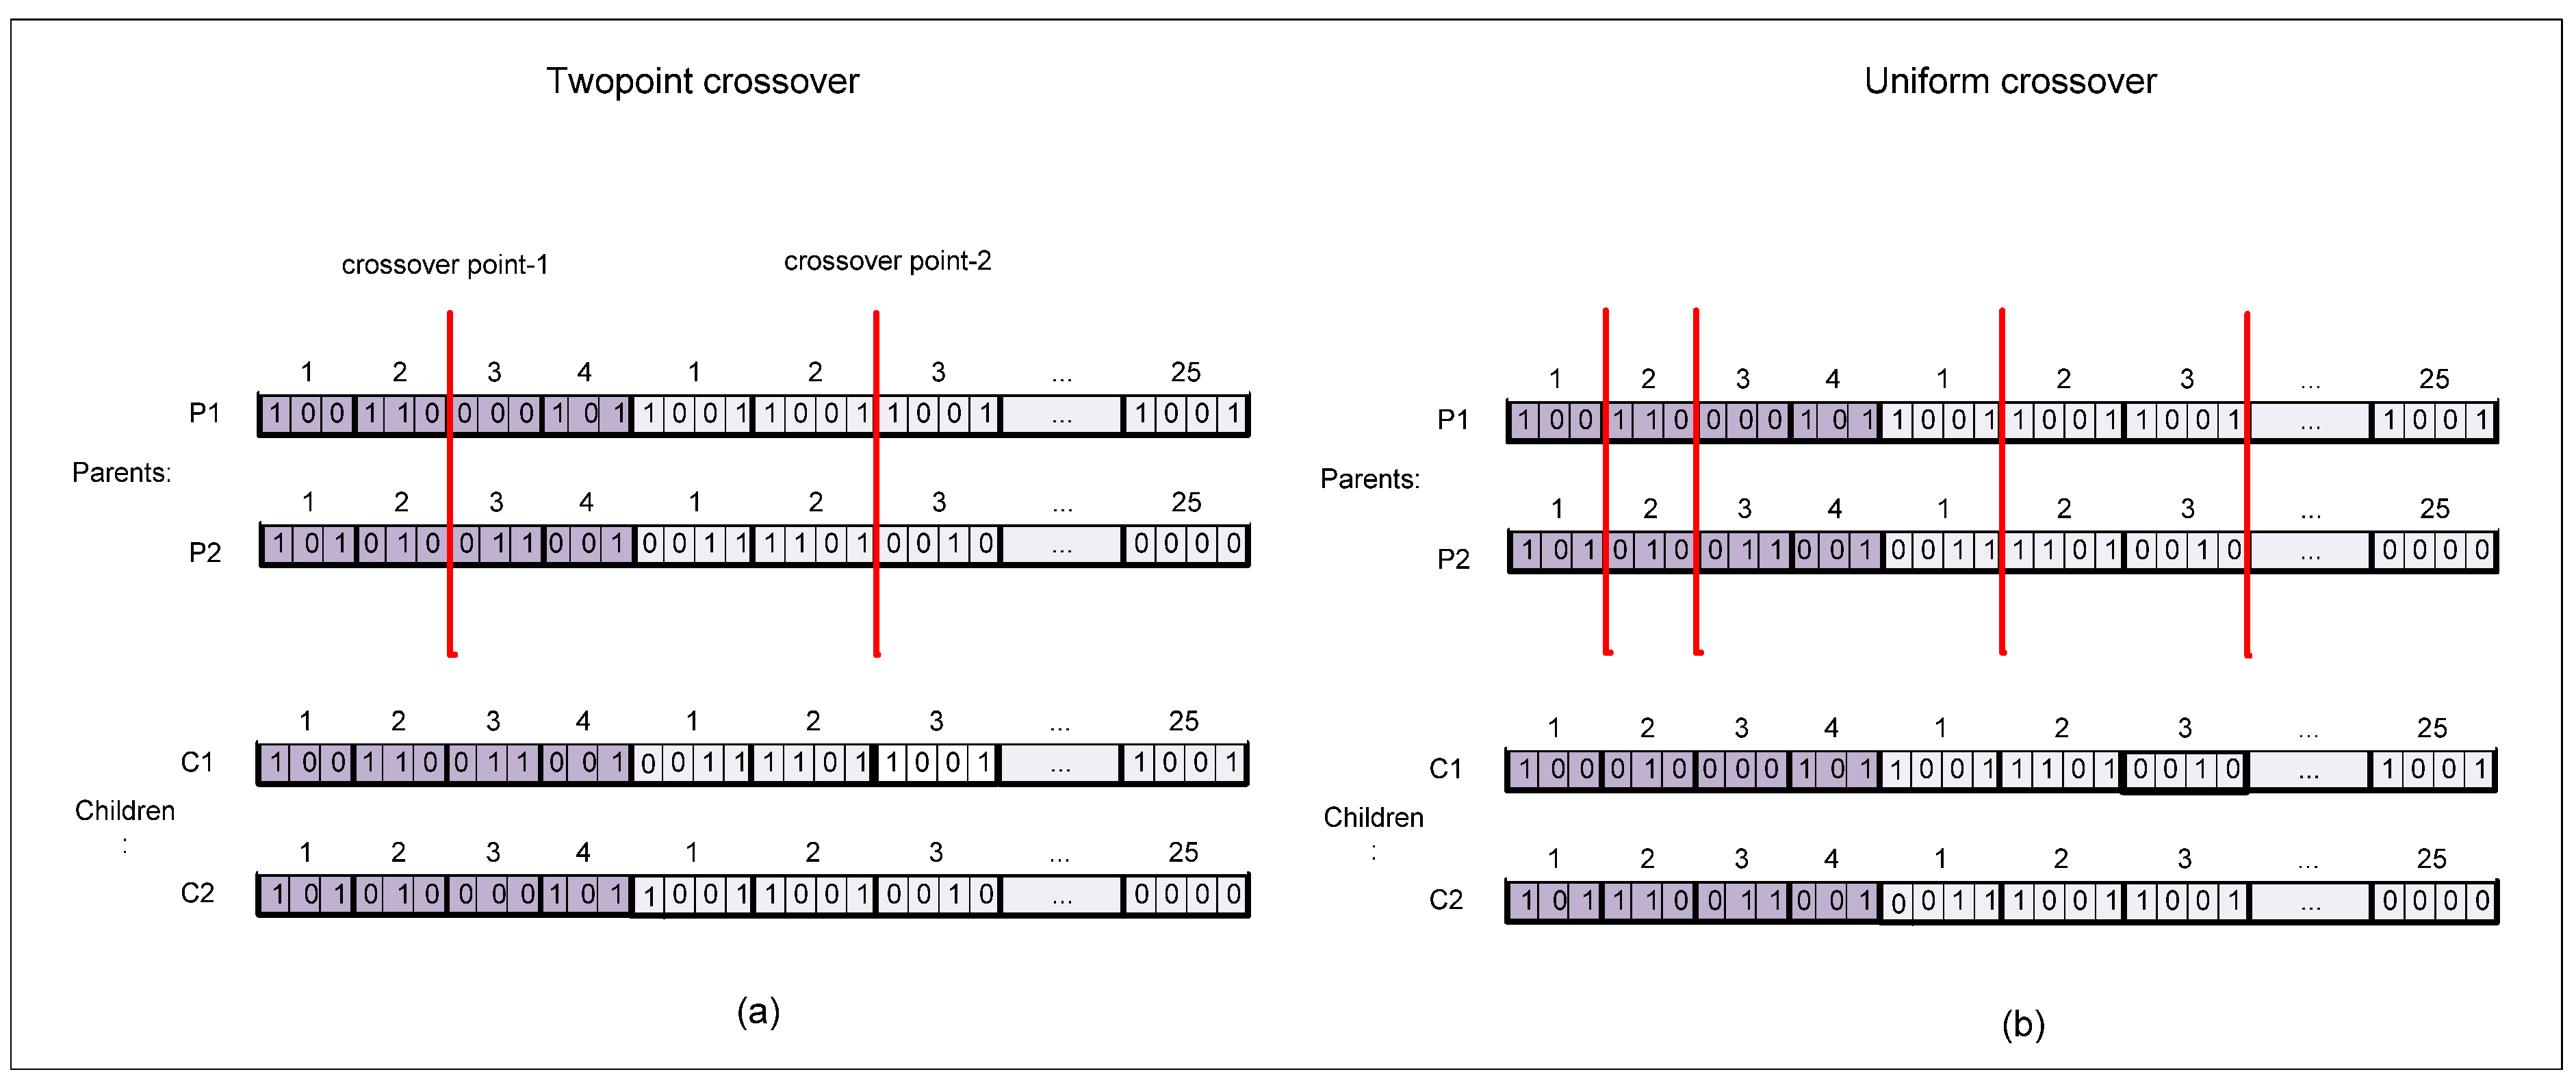
7.4. Crossover Procedure

Moving forward with the selection of chromosomes in each generation, the next step is crossover. As already discussed, we are employing two crossover procedures: TC and UC. Generally speaking, crossover is the operation of GA in which the chromosomes (children) are produced from the best selected chromosomes (parents). The child produced inherits some characteristics of their parents as well as their own also. Within the context of the GA, there are several mechanisms for crossover such as: one-point crossover, two-point cross over, uniform crossover, etc. In this study, we are using TC and UC, wherein the two parents are involved in producing the two children. In TC , the two points are randomly selected for the crossover of the two parents. The generated children (C1 and C2) are actually generated by the swapping the two parents (P1 and P2) as specified by the crossover points in Figure 7a. However, a key point should be satisfied; the crossover points should be selected in a manner such that the genes should be swapped, i.e., the crossover point-1 should be in the multiple of 3-bits whereas crossover point-2 should be in the multiple of 4-bits, as far as the high traffic load chromosomes is concerned. In UC, multiple random points are selected for the crossover of two parents (P1 and P2). The children (C1 and C2) are generated in the same fashion as does in TC but here the swapping is specified with multiple random points as in Figure 7b. Moreover, UC is actually the mixing ratio between two parents that generate children. In this study, we are employing the mixing ratio of 0.5 that corresponds to the contribution of 50% genes of each parent.
Algorithm 2: DGA for Joint power assignment and resource allocation
Input: Association relationship of k FUs with l FBS.
  • X: (P, lnl+mnm)-dimensional.
  • Xs and Xnew: (P/2, lnl+mnm)-dimensional.
  • pbschrec and lbestchr: (1, lnl+mnm)-dimensional is the best chromosomes received and the local best one.
Output: Power assignment and channel allocation, S = {P*, C*} (P* = power assignment and C*= Channel allocation).
  • while(stopping condition (required fitness achieved OR the number of iteration passed) )
  • for each FBSs y do
  • Xs ← select half best chromosomes from X: P/2
  • lbestchrbest chromosome(Xs)
  • if lbestchr < maximum(recchrr) r = 1,2,3,…,l-1
  • Xs ← pbschrec
  • end if
  • for each chromosomes pair t t P/2
  • [Ch1,Ch2]← crossover (Xs1, Xs2)
  • [M1,M2] ← mutation (Ch1, Ch2)
  • Xnew [M1,M2]
  • end for
  • X ← [Xs, Xnew]
  • end for
  • end while
  • return S←bestchromosome(Xy), y l

7.5. Mutation

Mutation is a procedure performed after the crossover operation. Mutation applies to the child chromosomes that are produced after crossover. It refers to the alteration of the bit within the child chromosomes. The concern of employing this is in GA is to avoid the local minimum, which means that the solution should not be trapped somewhere between certain points. Different percentiles of mutation rates are discussed in the literature. In this study, we are using the mutation rate of 0.3, meaning that 30% of the child chromosomes are mutated.
Figure 7. Crossover operation: TC and UC.
Entropy 15 02524 g007

8. Simulation Results

8.1. Parameters Setting

The simulation is carried out in MATLAB to evaluate the two proposed algorithms with their variants: DPSO-IW, DPSO-CM and DGA-TC, DGA-UC. In this subsection, the parameter’s selection is carried out for further analysis. First, the fined tuned parameters for the heuristic algorithms are presented. Second, the simulation parameters are elaborated thereafter. Furthermore, the two scenarios are illustrated for having an insight into the two proposed algorithms in different aspects.
The performance of the two proposed algorithms depends upon the parameters chosen. Different parameter values results in varying performance in terms of the objective function value. Therefore, an exhaustive search is carried out for fine tuning the parameters. Table 2 includes the parameters that will be used for further analysis.
Table 2. DPSO and DGA parameters.
DGAparametersValueDPSO parametersValue
Population size per FBSs16Population size per FBSs16
Crossover rate0.5DPSO-IW acceleration coefficients, ac1 and ac22
Mutation rate0.03DPSO-IW inertia weight (w)0.6
DPSO-CM constriction factor ( )0.7289
DPSO-CM acceleration coefficients, ac1 and ac22.05
Vmin,−N
VmaxN
The simulation parameters are given in Table 3. We apply the same path loss model as described in [26], where the channel gain between the j-th FUs and i-th FBS is given by:
h i , j = 10 3 S + L i 10 . d i , j 3.7
The values for the shadowing (S), penetration loss (Li) and the distance (di,j) are also given in Table 3.
Table 3. Simulation parameters.
ParametersValue
Channel bandwidth180 kHz
Number of channelsScenario-1 (16) and Scenario-2 (8)
Noise power for femtouser4.0049e-15 W
Shadowing factor (S)8dB
Penetration loss in wall (Li)5 dB
Distance between femtouser and FBS (di,j)15m
Table 4. Scenario-1 (l = 8, k = 50 and m = 16) and Scenario-2 (l = 4, k = 25 and m = 8).
Scenario-1Scenario-2
Channel Allocation to FUsPower assignment to FBSsChannel Allocation to FUsPower assignment to FBSs
c1u20, u23, u28, u31, u46p10.2Wc1u1, u8, u10, u19, u20, u23p10.7W
c2u5, u15, u21p20.6Wc2u2, u4, u6, u14, u18, u24, u25p20.3W
c3u43p30.8Wc3u5, u7, u9, u17p30.2W
c4u24, u48p40.1Wc4u3p40.1W
c5u39p50.5Wc5u11, u13
c6u10, u12, u16, u33p60.4Wc6u12, u16, u22
c7u9, u14, u22, u26, u38, u42p70.7Wc7u15, u21
c8u1, u37p80.3Wc8N.A
c9u30
c10u2, u4, u27, u41
c11u7, u11, u34
c12u13, u29
c13u3, u6, u19, u35, u36
c14u8, u17, u18, u44, u49
c15u25, u32, u45
c16u40, u50
The experiment is carried out under two scenarios (scenario-1 and 2). In scenario-1, there are 8–FBSs (l = 8), 50–FUs (k = 50) and 16–channels (m = 16). However, in scenario–2, there are 4–FBSs (l = 4), 25–FUs (k = 25) and 8–channels (m = 8). Furthermore, there are eight power levels (0.1W, 0.2W, 0.3W,…, 0.8W) for each scenario. The power assignment and channel allocation in each scenario results in varying objective function values. Table 3 houses the one possible power assignment and channel allocation for the mentioned two scenarios. Referring to the objective function, the allocation in scenario-1 results in the fitness value of 5.55 × 10⁴ and for scenario-2 it is 4.482 × 10⁴. It will be clear in next subsection that this fitness is too low for meeting the throughput demand.

8.2. Results and Discussion

The two proposed algorithms are analyzed in terms of the performance metrics such as average objective function, min–max throughput of the FBSs, average throughput of the FUs, outage rate of FUs and time complexity. The details of each performance metric are presented here after.

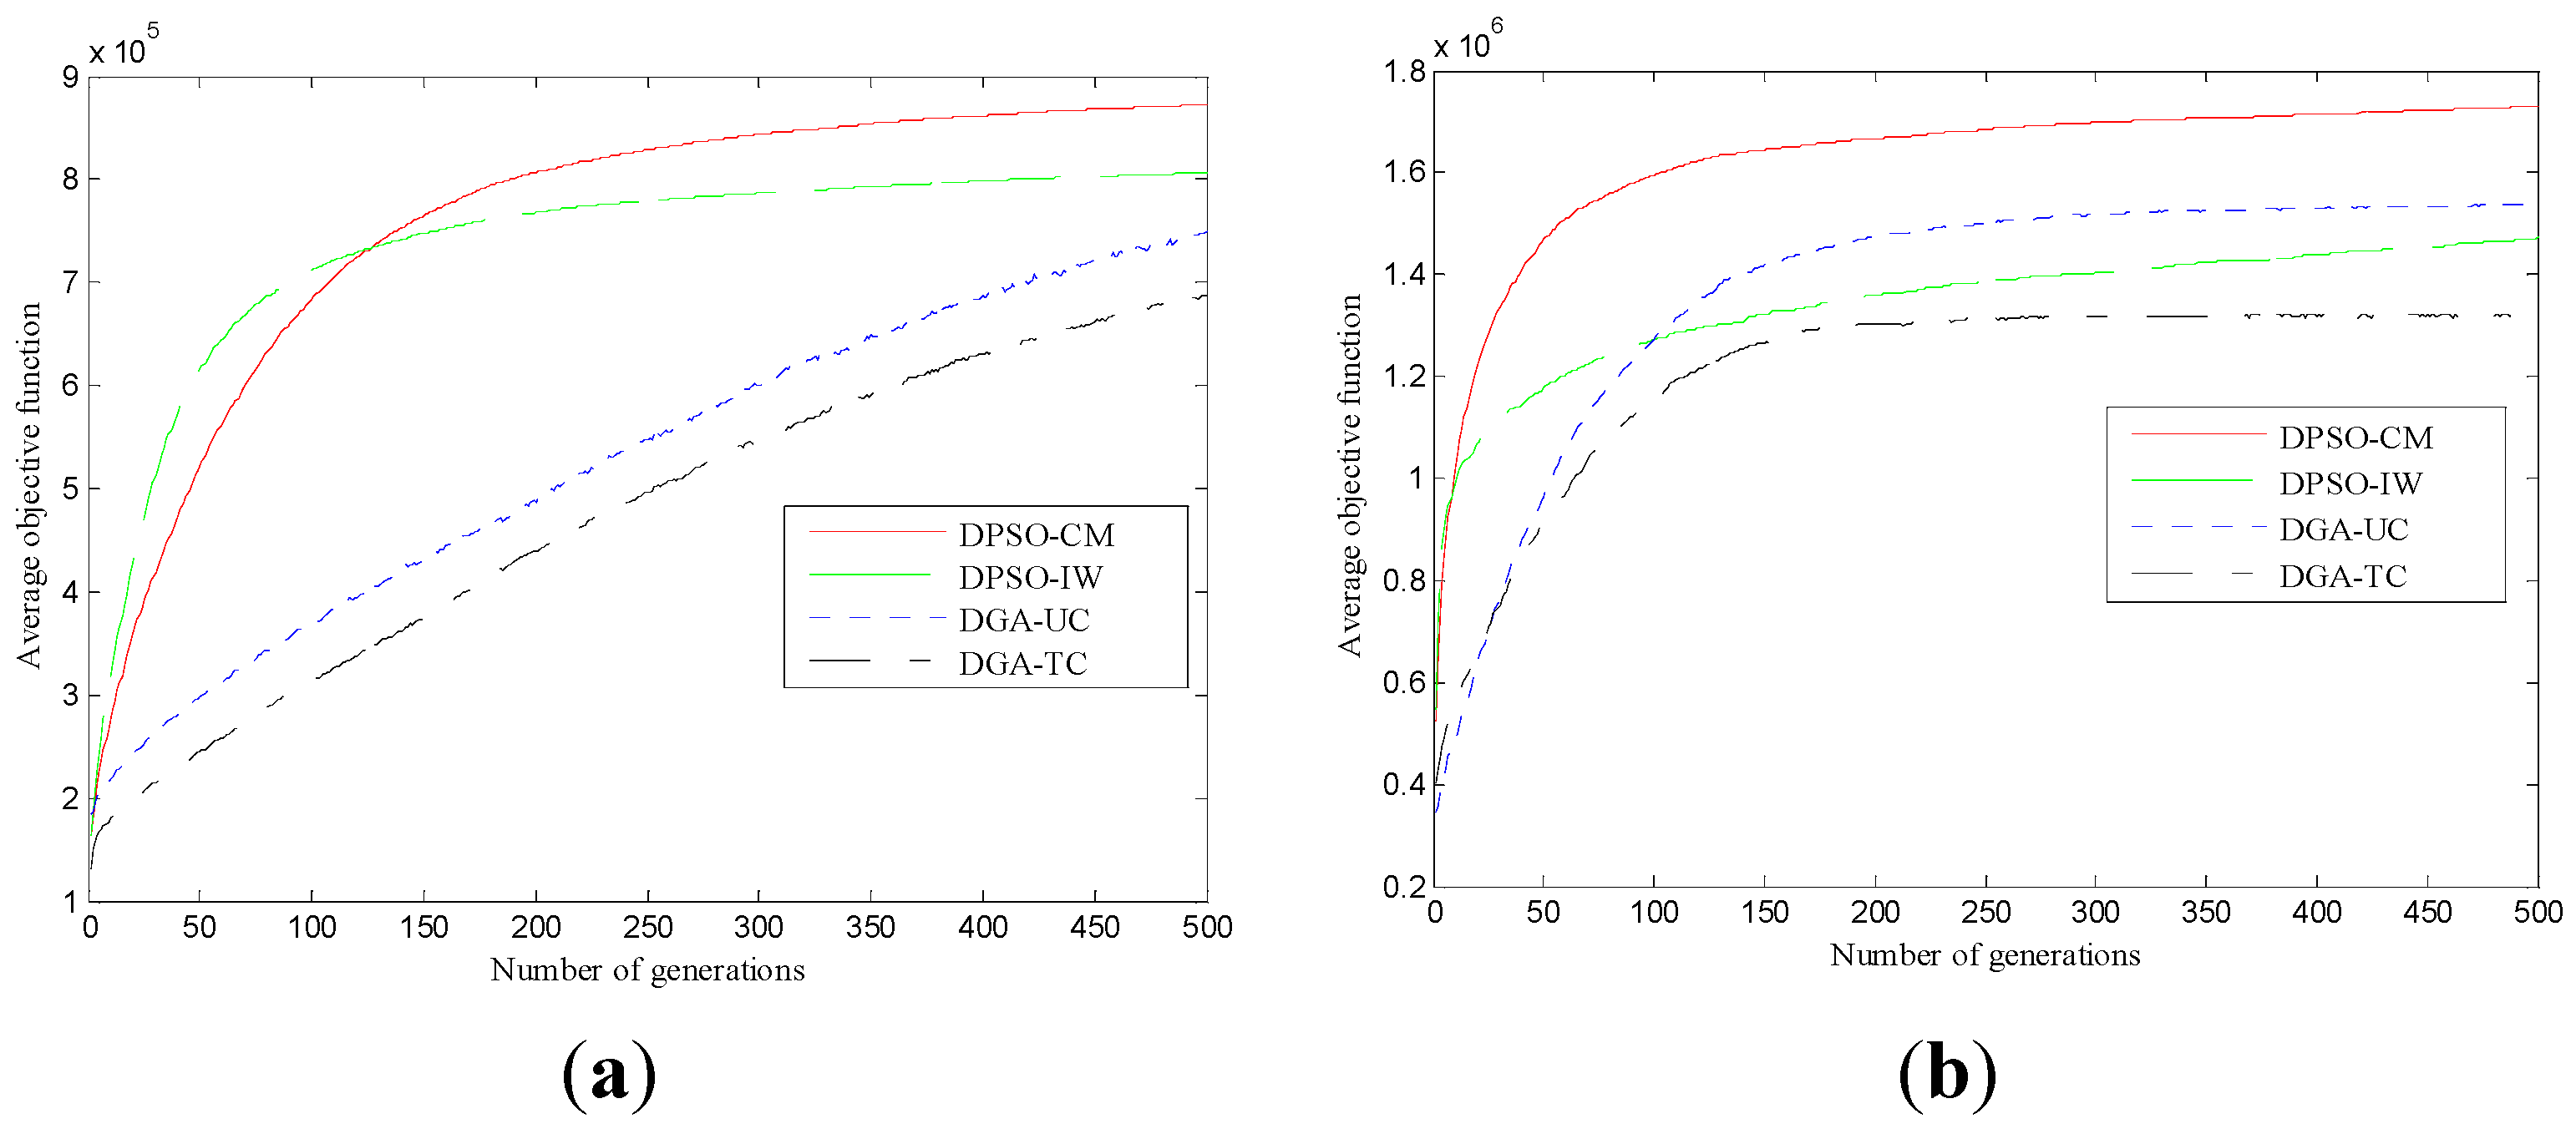
8.2.1. Average Objective Value

Figure 8a,b plots the average objective function value versus the number of generations/iterations for both the scenarios. The objective function curves are actually computed by taking an average of 400 independent turns of each algorithm. It can be seen that DPSO-CM performance is better than its counterpart variant and DGA variants in terms of average objective function value for both the scenarios. The difference is much more pronounced in scenario–1 as in Figure 8a, where the DPSO-CM approaches to the fitness value of 8.53 × 10⁵ and its counterpart variant, DPSO-IW reaches to 7.82 × 10⁵ at around 270 iterations. DGA-UC reaches to the value of 7.47 × 10⁵ and its counterpart variant, DGA-TC approaches at 6.86 × 10⁵ at 500 iterations. The superior performance of DPSO-CM than its counterpart DPSO-IW is actually due to fact that former guarantee faster convergence as compared to the latter and this is validated from the results also. Moreover, DPSO-CM performs better than DGA variants and this is due to the fact that DGA involves more operations which lead to slower approach towards the average objective function value.
Figure 8. Comparison in terms of average objective function: (a) Scenario-1 and (b) Scenario-2.
Entropy 15 02524 g008
The similar performance trend of DPSO-CM is depicted for scenario-2 in Figure 8b. Here, DPSO-CM stabilizes to the fitness value of 1.64 × 10⁶, whereas its counterpart, DPSO-IW approaches to the fitness value 1.32 × 10⁶ within 150 iterations. As far as the DGA variants is concerned, the same performance trend (DGA-UC > DGA-TC) exists here as for the scenario-1. However, DGA-UC perform better than DPSO-IW and this is contradictory with scenario-1. The high fitness function value in scenario-2 is due to the low traffic scenario.
For the rest of analysis excluding the time complexity, we take the best variant of each algorithm for the rest of the analysis i.e., DPSO-CM and DGA-UC. Moreover, we execute each algorithm for 500 iterations. Finally, it can be concluded that on the average, DPSO-CM performs 16.6% better than DGA-UC for scenario-1, whereas this figure is around 13% for the scenario-2.

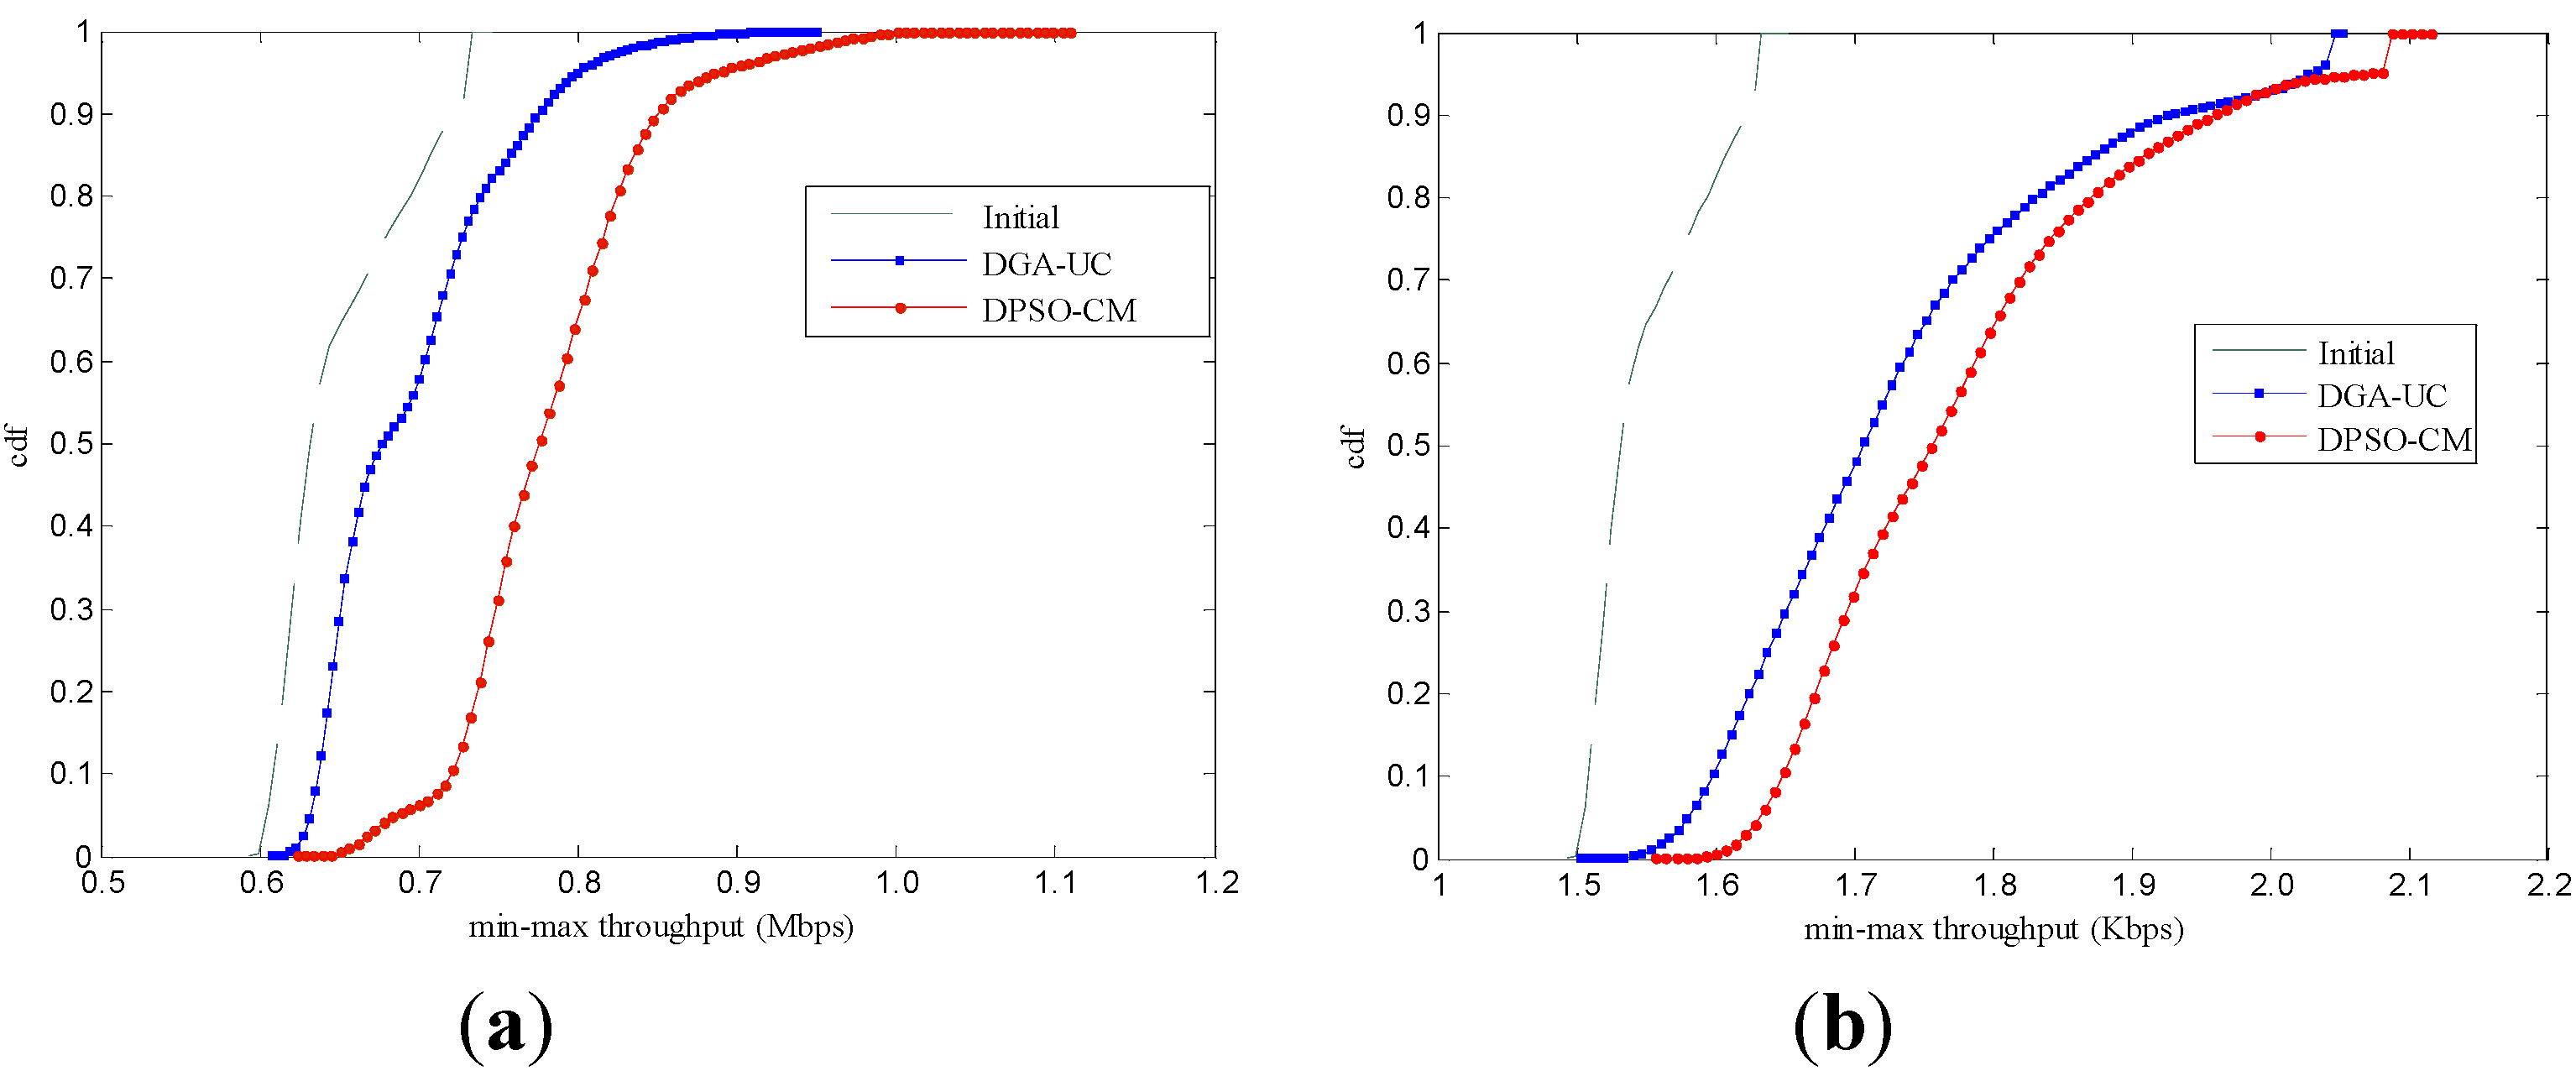
8.2.2. Min-max Throughput of the FBSs

Figure 9a,b plots the cumulative distribution function (cdf) versus min-max throughput of the FBS for the two scenarios. Here, the results are explicitly shown for the 500th iteration count of each algorithm. As the objective function in this study is the maximization of the minimum throughput of the FBSs, we carried out a comparison here in terms of the maximization of the min-max throughput for each scenario. In Figure 9a, the significance of employing heuristic algorithms over the random initial population (random channel allocation to FUs and power assignment to FBS) is illustrated. The initial populations will only result in achieving the min-max throughout up to 0.7 Mbps, however, DPSO-CM results in achieving between 0.81–1.15 Mbps, whereas DGA-UC yields 0.6–0.95 Mbps.
Hence, it can be extracted that DPSO-CM has 24% better performance than DGA-UC for scenario-1. This is obviously due to the fact that the higher objective function value (maximization of the minimum throughput) of the DPSO-CM results in better performance than DGA-UC. As far as scenario–2 is concerned, the same performance trend (DPSO-CM > DGA-UC > Initial) holds, as does for scenario-1. However, the min-max throughput is higher than that of scenario-1. This is due to the fact that higher objective function value, at 500 iteration, results in a bit higher min–max throughput of the FBSs. The DPSO-CM algorithm contributes to achieving the min-max throughput within the range of 1.8–2.15 Mbps, whereas the DGA-UC results in achieving 1.6–2 Mbps. Hence, it can be concluded that DPSO performs 7.5% better than DGA, in scenario–2, in terms of maximization of the min-max throughput of the FBS.
Figure 9. Min-max throughput of the FBSs: (a) Scenario-1 and (b) Scenario-2.
Entropy 15 02524 g009

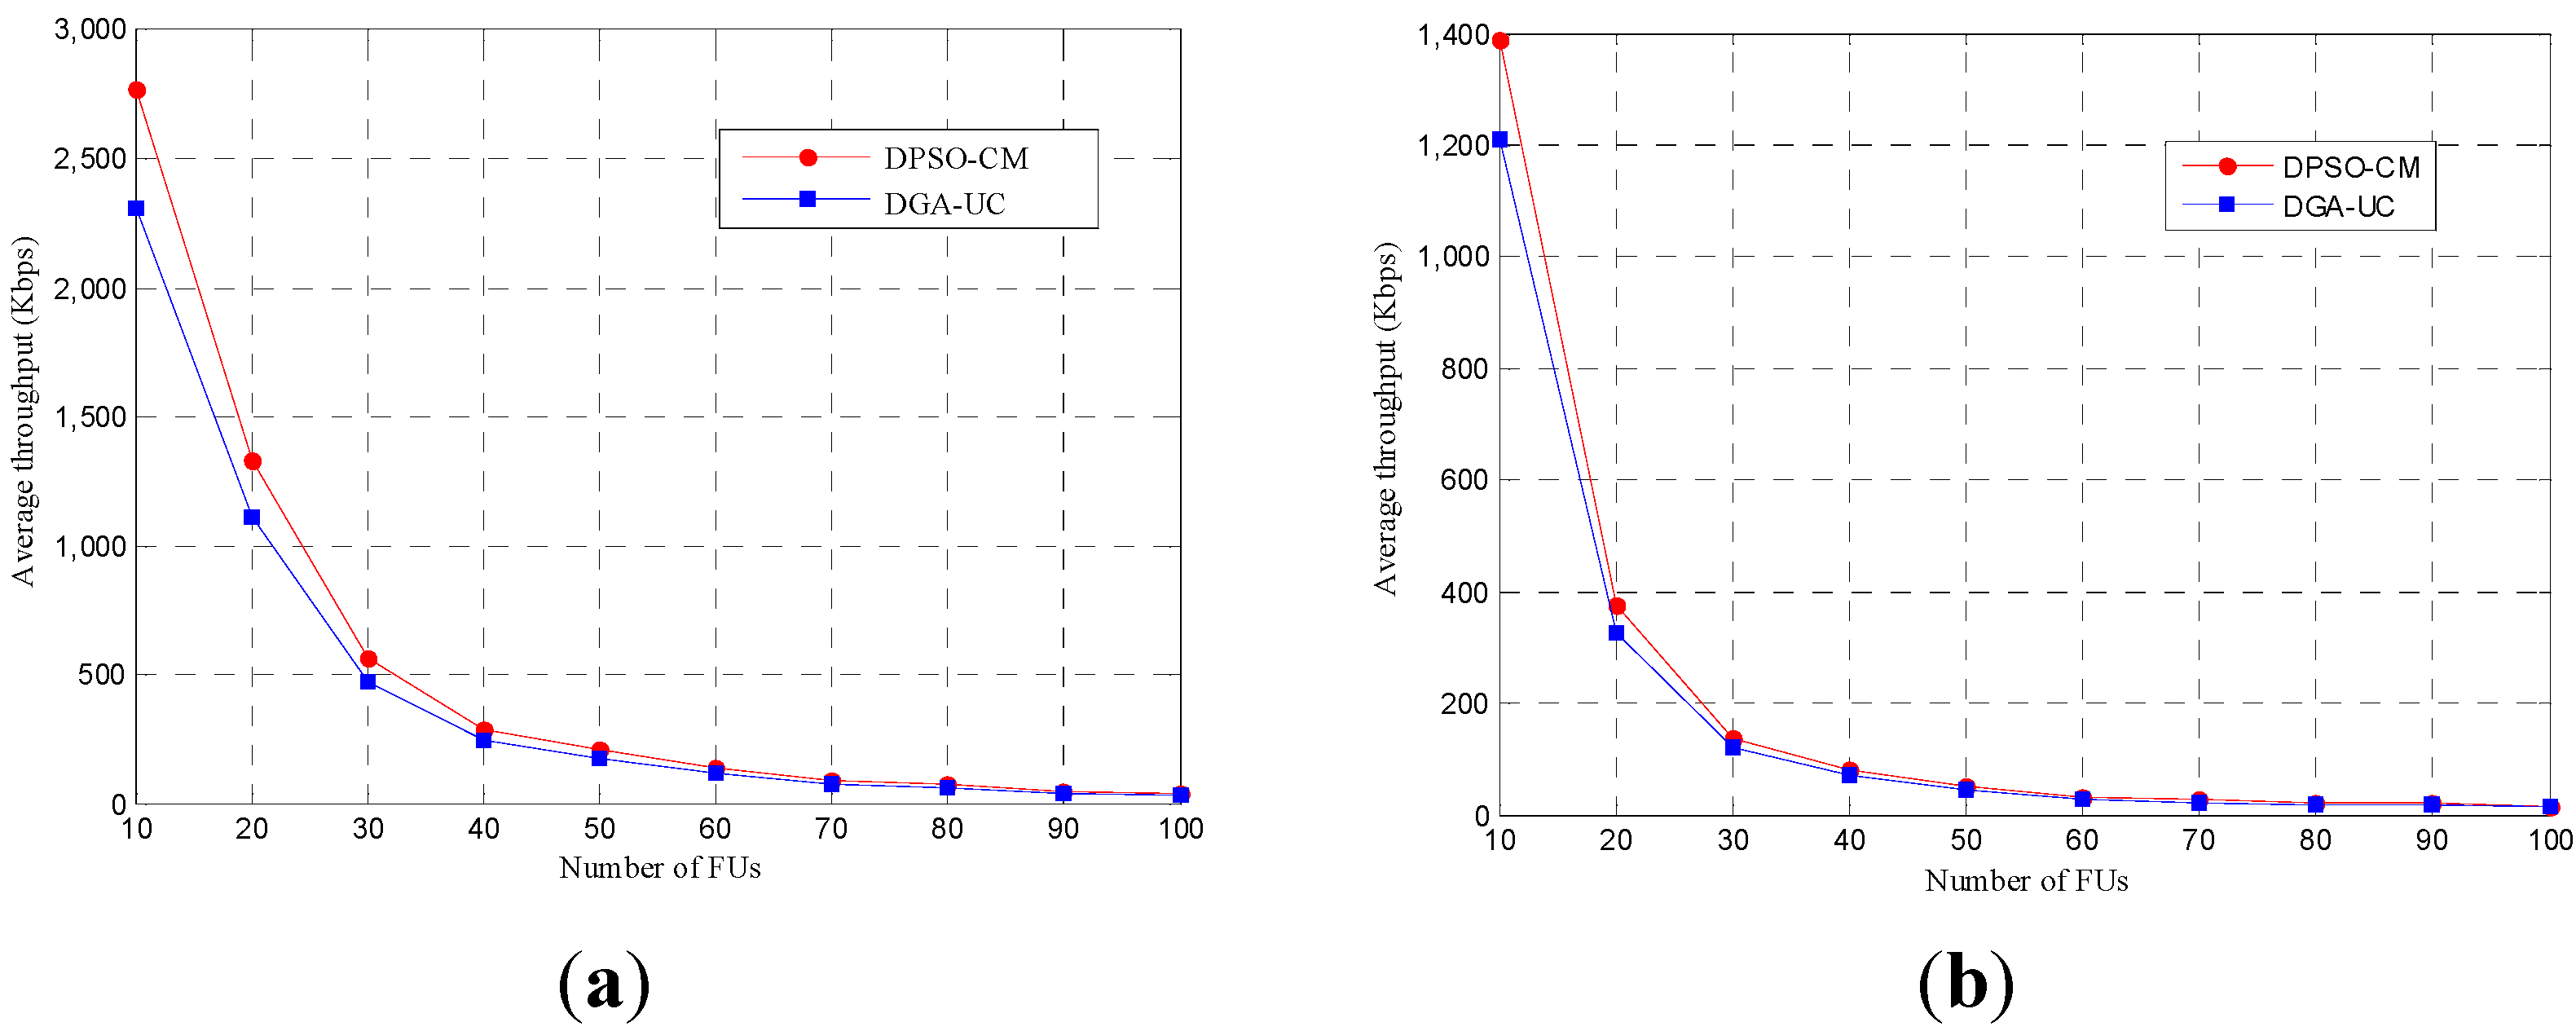
8.2.3. Average FU Throughput
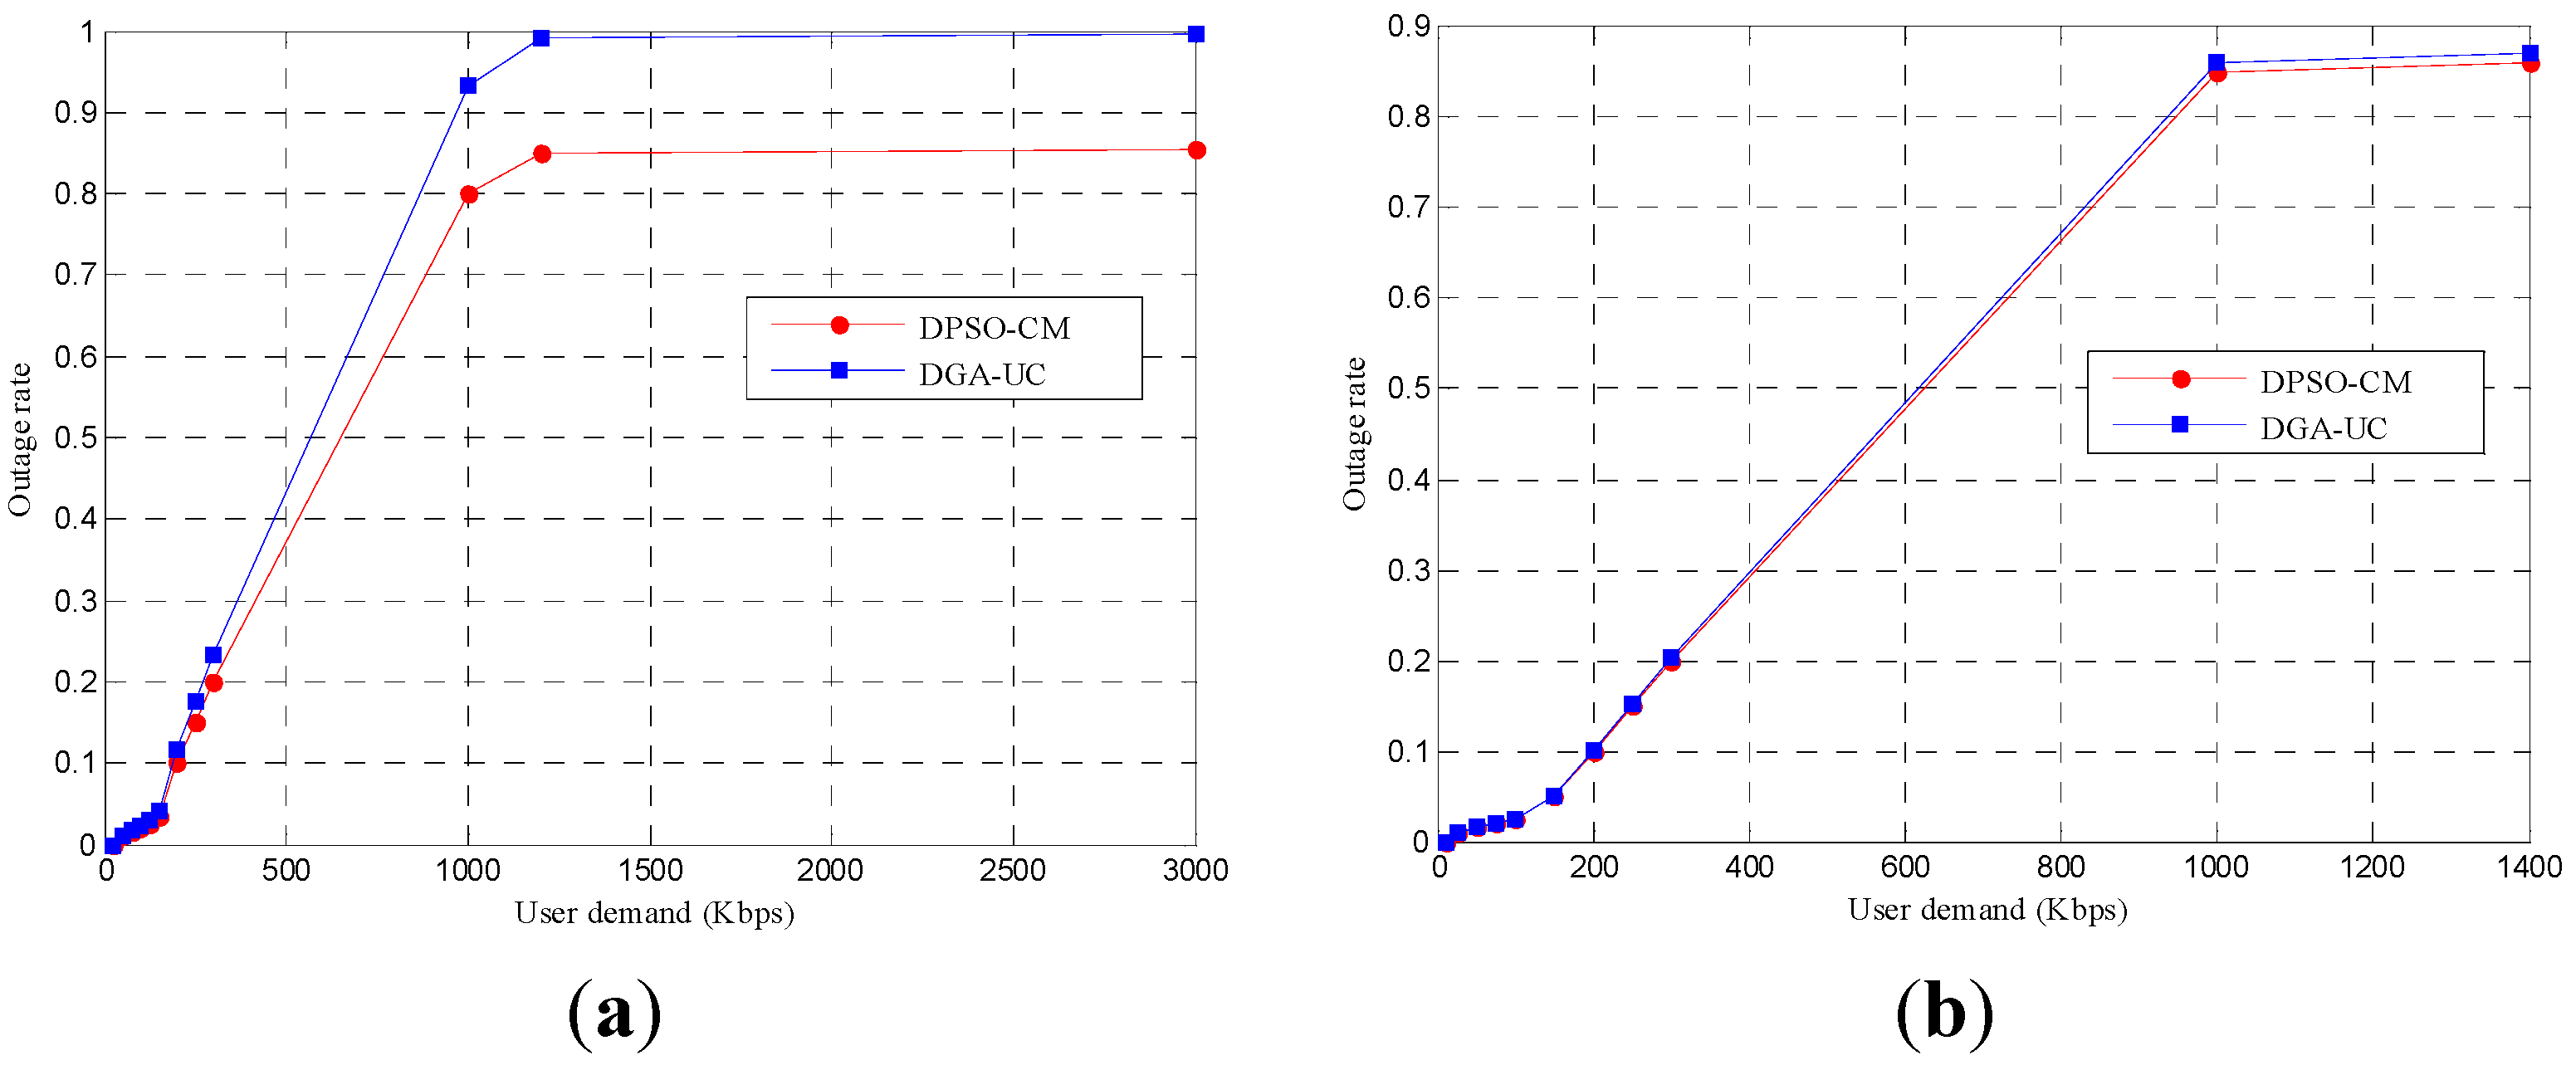
The average throughput versus varying FUs is plotted in Figure 10a,b for the two scenarios. It is illustrated in Figure 10a that for fewer FUs, i.e., below 50, a significant throughput gap of about 2700–250 kbps exists. This is due to the fact that ample channels availability causes the escalation of the FUs throughput. However, after 50 FUs, the throughput gap is not very profound. If we compared the achieved throughput among the two algorithms, then it can be illustrated that DPSO-CM performs superior to DGA-UC. The reason is that the DPSO results in achieving better average throughput on FBSs, which causes an increase in the average throughput of the FUs. As far as scenario–2 is concerned, the same performance trend (DPSO-CM > DGA-UC) is illustrated as in Figure 10b. Moreover, at FU 10 the achieved average throughput by DPSO-CM for scenario–1 is 2,700 kbps, whereas for scenario–2 it is 1,400 kbps. The achieved double throughput is due to the fact that channels for scenario–1 are double than scenario-2, which results in uplifting the throughput up to 100%.
Although the gained min-max throughput is higher for scenario-2 than scenario-1, but here, the achieved throughput of FUs is higher for scenario-1 than scenario-2. This is actually, because fewer channels in scenario-2 results in inferior performance to scenario-1. However, if we take the FU count for both scenario-1 and 2, i.e., (50 and 25), it can be revealed that the average throughput of DPSO-CM at 50 FU for scenario-1 is around 200 kbps and at 25 FU it is around 210 kbps for scenario-2. These results are in accordance with that presented in Subsection 8.2.1, where also the DPSO-CM outperforms in scenario-2 than in scenario-1.
Figure 10. Average FUs throughput: (a) Scenario-1 and (b) Scenario-2.
Entropy 15 02524 g010

8.2.4. Outage Rate

Figure 11 plots the outage rate for the two scenarios. Here, the outage rate is defined as the fraction of FUs that do not receive 80% of their requested throughput. It can be seen from the Figure 11a that for less data rate demands, i.e., up to 400 kbps, the outage rate is about 0.2. However, as the demands increase beyond that the outage rate reaches the limit, where no FU can be accommodated within that demand. This is due to the fact that under scenario-1, the average throughput of the FUs is around 25 kbps. Hence, the huge demand cannot be accommodated under the taken scenarios. It is possible either by increasing the channels or by increasing the bandwidth of the channels. The important point to be extracted from the outage rata plots is that DPSO-CM gives a little less outage as compared to DGA-UC for both the scenarios.
Figure 11. Outage rate: (a) Scenario-1 and (b) Scenario–2.
Entropy 15 02524 g011

8.2.5. Time Complexity

The time complexity of the two proposed algorithms is analyzed under two scenarios in Table 5. Here, the targeted objected function value is explicitly used for carrying out the comparison. The targeted objective function (TOB) value is 8 × 10⁵. For each of the scenarios, DPSO variants approach this value faster than DGA variants. In scenario-1, DPSO-CM consumes 100 iterations in 395 (sec), whereas its counter variant, DPSO-IW consumes 133 iterations in 526.9534 (sec) for reaching the targeted value. In addition, DGA-UC takes about 850 iterations in 622 (sec), while its counterpart variant DGA-TC consumes 928 iterations in 679.6 (sec). The similar behavior of DPSO and DGA variants holds for scenario-2 also. However, the iteration count for scenario-2 is comparatively lesser than the other one. This is due to the high objective function values for scenario-2 as in Figure 8b, that leads faster towards the targeted TOB value. Hence, it can be concluded the DPSO-CM performs better than DGA-UC, because for each of scenarios, it converges faster and takes fewer iterations to reach to an objective function value.
Table 5. Time complexity of DPSO and DGA.
DPSO-CMDPSO-IWDGA-UCDGA-TCTOB
Iterat.#TimeIterat. #TimeItera. #TimeIterat. #Time8 × 105
Scenario-1100395133526.9850622928679.6
Scenario-2100.4120.6354.1575.2

9. Conclusions

In this study, we carried out a comparison among two heuristic algorithms, PSO and GA, for joint power assignment and resource allocation in femtocells. Furthermore, the two variants of each algorithm are considered here, IW and CM for PSO, and TC and UC for GA. Joint optimization is carried out in a decentralized manner with no involvement of any centralized entity. The said optimization is carried out on each FBS, with the concern of achieving the optimum solution faster by sharing the best solution with neighboring FBSs. In this study, two scenarios, high traffic and low traffic, are used for carrying out the comparison. The proposed hurestic algorithms: DPSO and DGA, are analyzed in terms of performance measures: average objective function, min-max throughput of FBS, average throughput of FBS, outage rate, and time complexity. The results illustrates that DPSO-CM performs better than the DGA-UC in terms of all the performance measures for the said two scenarios.
In this paper, we assumed the discrete power levels for the assignment to FBSs. The work presented here can be extended in many ways: adaptive power assignment to FBSs, adaptive power assignment to FUs, etc. This will also result in uplifting the throughput. Furthermore, the optimization crieterion that we have taken here is the joint power assignment and resource allocation; other factors may be included for gaining deeper insight into the study.

Acknowledgement

This research was supported by the MSIP (Ministry of Science, ICT and Future Planning), Korea, under the Convergence-ITRC (Convergence Information Technology Research Center) support program (NIPA-2013-H0401-13-1003) supervised by the NIPA (National IT Industry Promotion Agency) and the Basic Science Research Program through the National Research Foundation of Korea (NRF) funded by the Ministry of Education, Science and Technology (2012009449).

References

  1. Mansfield, G. Femtocells in the US Market-Business Drivers and Consumer Propositions. In Proceedings of the Femto Cells Europe Conference, ATT, London, UK, June 2008.
  2. Chandrasekhar, V.; Andrews, J.G.; Gatherer, A. Femtocell networks: a survey. IEEE Commun. Mag. 2008, 46, 59–67. [Google Scholar] [CrossRef]
  3. Femtocell-based network enhancement by interference management and coordination of information for seamless connectivity. Available online: http://www.ict-freedom.eu/ (accessed on 26 April 2013).
  4. Saquib, N.; Hossain, E.; Le, L.B.; Kim, D.I. Interference Management in OFDMA Femtocell Networks: Issues and Approaches. IEEE Wirel. Commun. 2012, 19, 86–95. [Google Scholar] [CrossRef]
  5. Nakamura, T.; Nagata, S.; Benjebbour, A.; Kishiyama, Y.; Hai, T.; Shen, X.; Ning, Y.; Nan, L. Trends in Small Cell Enhancements in LTE Advanced. IEEE Commun. Mag. 2013, 51, 98–105. [Google Scholar] [CrossRef]
  6. Mhiri, F.; Sethom, K.; Bouallegue, R. A survey on interference management technique in femtocell sel-organizing network. J. Netw. Comput. Appl. 2013, 36, 58–65. [Google Scholar] [CrossRef]
  7. Chandrasekhar, V.; Andrews, J.G.; Muharemovict, T.; Shen, Z.K.; Gatherer, A. Power Control in Two-Tier Femtocell Networks. IEEE Trans.Wirel. Commun. 2009, 8, 4316–4328. [Google Scholar] [CrossRef]
  8. Sarena, B.; Krahenbuhl, L. Fitness sharing and niching methods revisited. IEEE Trans. Evol. Computat. 1998, 2, 97–106. [Google Scholar] [CrossRef] [Green Version]
  9. Schoeman, I. Niching in Particle Swarm Optimization. Ph.D. thesis, University of Pretoria, Pretoria, South Africa, 2009. [Google Scholar]
  10. Shao, B.B.M.; Rao, H.R. A parallel hypercube algorithm for discrete resource allocation problems. IEEE Trans. Syst. Man Cybern. A 2006, 36, 233–242. [Google Scholar] [CrossRef]
  11. Basso, A.; Peccati, L.A. Optimal resource allocation with minimum activation levels and fixed costs. Eur. J. Oper. Res. 2001, 131, 536–549. [Google Scholar]
  12. Ibaraki, T.; Katoh, N. Resource Allocation Problems: Algorithms Approaches; MIT Press: Boston, MA, USA, 1988. [Google Scholar]
  13. Benyahia, I. A survey of ant colony optimization algorithms for telecommunication networks. Int. J. App. Metah. Comp. 2012, 3, 18–32. [Google Scholar] [CrossRef]
  14. Aslam, S.; Lee, K. CSPA: Channel selection and parameter adaption scheme based on genetic algorithm for cognitive radio ad hoc networks. EURASIP J. Wirel. Commun. Netw. 2012. [Google Scholar] [CrossRef]
  15. Marshoud, H.; Otrok, H.; Barada, H.; Estrada, R.; Jarray, A.; Dziong, Z. Resource Allocation in macrocell-femtocell network using genetic algorithm. In Proceedings of the IEEE Wireless Communication and Mobile Computing, WiMob, Barcelona, Spain, 8–10 October 2012; pp. 474–479.
  16. Li, Z.; Guo, S.; Li, W.Z.; Lu, S.L.; Chen, D.X.; Leung, V.C.M. A Particle swarm optimization algorithm for resource allocation in femtocell networks. In Proceedings of the IEEE Wireless Communication and Networking Conference, WCNC, Paris, France, 1–4 April 2012; pp. 1212–1217.
  17. Mohjazi, L.; Al-Qutayri, M.; Barada, H.; Poon, K.F. Performance evaluation of heuristic techniques for coverage optimization in femtocells. In Proceedings of IEEE Electronics, Circuits and Systems, ICECS, Beirut, Lebanon, 11–14 December 2011; pp. 587–590.
  18. Gen, C.; Dacheng, Y.; Xuan, Y.; Zhang, X. A downlink joint power control and resource allocation scheme for co-channel macrocell-femtocell networks. In Proceedings of IEEE Wireless Communication and Networking Conference, WCNC, Quintana-Roo, Mexico, 28–31 March 2011; pp. 281–286.
  19. Sadr, S.; Adve, R. Hierarchical resource allocation in femtocell network using graph algorithm. In Proceedings of IEEE Conference on Communications, ICC, Ottawa, Canada, 10–15 June 2012; pp. 4416–4420.
  20. Da Costa, G.W.O.; Cattoni, A.F.; Roig, V.A.; Mogensen, P.E. Interference mitigation in cognitive femtocells. In Proceedings of IEEE GLOBECOM Workshop, Miami, FL, USA, 6–10 December 2010; pp. 721–725.
  21. Barbarossa, S.; Sardellitti, S.; Carfagna, A.; Vecchiarelli, P. Decentralized interference management in femtocells: a game theoretic approach. In Proceedings of IEEE CROWNCOM, Cannes, France, 9–11 June 2010; pp. 1–5.
  22. Wang, B. Distributed resource allocation and performance optimization for video communication over mesh networks based on swarm intelligence. Ph.D. thesis, University of Missouri, Columbia, MO, USA, 2007. [Google Scholar]
  23. Izakian, H.; Abraham, A.; Snášel, V. Metaheuristic Based Scheduling Meta-Tasks in Distributed Heterogeneous Computing Systems. Sensors 2009, 9, 5339–5350. [Google Scholar] [CrossRef] [PubMed] [Green Version]
  24. Clerc, M. The Swarm and the Queen: Towards a Deterministic and Adaptive Particle Swarm Optimization. In Proceedings of the Congress on Evolutionary Computation, Washington, DC, USA, 6–9 July 1999; pp. 1951–1957.
  25. Balin, S. Non-identical parallel machine scheduling using genetic algorithm. Expert Syst. Appl. 2011, 38, 6814–6821. [Google Scholar] [CrossRef]
  26. Yun, J.-H.; Shin, K.G. A self-organizing femtocell management architecture for co-channel deployment. In Proceedings of IEEE International Conference on Mobile Computing and Networking, MobiCom, Chicago, Illinois, USA, 20–24 September 2010; pp. 61–72.

