Article

Understanding Factors Influencing Click-Through Decision in Mobile OTA Search Engine Systems

1
School of Management, Guangzhou University, Guangzhou 510006, China
2
School of Business, Foshan University, Foshan 528000, China
*
Author to whom correspondence should be addressed.
J. Theor. Appl. Electron. Commer. Res. 2023, 18(1), 634-655; https://doi.org/10.3390/jtaer18010032
Submission received: 28 January 2023 / Revised: 1 March 2023 / Accepted: 9 March 2023 / Published: 13 March 2023

Abstract

:
Mobile commerce has changed the decision environment for users who intend to reserve a preferred hotel. This study aims to investigate the factors that affect the dynamic click-through decision (CTD) in mobile online travel agency (OTA) search engines. We propose a dynamic Bayesian inference framework to model individual-level users’ CTDs and examine the effects of item position, price, search cost, and the use of refinement tools. The study uses real-world search log datasets from a global OTA for both mobile and desktop searches. Our results show that (1) the primacy effect is weaker and the effect of item-ranking positions is non-linear in a mobile OTA search compared to a desktop OTA search. Mobile users pay the most attention to the top-ranking results and are less likely to click through the middle or bottom results. (2) Hotel prices have a positive effect on mobile CTDs in the whole mobile searching journey. Additionally, mobile users also tend to seek out hotels with lower price rankings on the current search engine result page. (3) The search cost, measured by the cumulative time duration, has a positive impact on mobile CTDs. The use of refinement tools enhances the effect of search cost. This study extends previous research on position and price effects in an online consumer search from PC-based internet to mobile devices. It also provides managerial implications for mobile OTA search engine marketing and investment for bidding ranking positions.

1. Introduction

Search engines and social media platforms have been significant channels for recommending and selling products or services for tourism planning. The business model reshaped the way that travelers search for and filter tourism information over the last few decades [1,2,3,4]. Increasing the click-through rate on travel search platforms is essential for OTAs to earn agency commissions from hotel advertisers such as hotel booking sites and hotel chains. However, mobile commerce has drastically changed the way individuals plan and book their preferred hotels and handle other travel-related matters in the tourism industry [5,6,7]. A recent global report indicates that a majority of consumers, 70%, conduct research on mobile services [8]. It is particularly evident in the case of tourists making last-minute and quick booking decisions, as mobile hotel search engines dominate and account for 89% of web traffic [9]. This poses a challenge for OTAs in understanding the intentions of individual users during mobile hotel reservation search sessions and employing personalized search engine marketing and optimization tactics to recommend accurate items in real time to meet their demands.
Owing to the information overload problem, users often struggle to find relevant content even with the help of search engines [10]. The position of items ranking on search engine result pages (SERPs) seems to alleviate such issues in the context of both information search engines [11,12,13,14] and travel product search platforms on personal computers (PC) [3,15,16,17,18]. The empirical evidence shows that the effect of item-ranking positions on SERPs negatively affects users’ decisions. Prior studies have shown that the process of making a hotel reservation is considered a high-involvement product decision [15,17]. However, these findings from studies on information search engines on PCs cannot be easily generalized to the field of mobile commerce and Information Systems (IS) due to the smaller screen size of mobile devices. The limited interface of mobile devices has been found to complicate users’ navigation tasks and decrease the effectiveness of learning [19,20]. Additionally, the layout of SERPs on mobile devices may be hindered by information chunking [21,22], potentially leading to different mobile-end position effects.
Previous research has shown that there is a negative association between price and CTDs on PC-based internet [15,23]. Users who are more responsive to screen position are also more price-sensitive [12]. The high web traffic of last-minute and quick booking in mobile search suggests that the closer to the check-in date, the more urgent the search for items in mobile services [9]. Due to time constraints in mobile hotel booking, mobile users may use hotel price as a positive quality signal when making high-involvement product purchase decisions. Mobile CTDs may be affected by fluctuation of item prices listed on the SERPs during a session. Bronnenberg et al. found that users tend to make purchases based on the characteristics of products they searched for early on [24]. It is plausible to speculate that an individual mobile user’s CTDs depends on the price perception comparison among items on the current SERP locally or the price fluctuation globally during a session.
Early search costs can have a significant impact on the decisions made by users in product search engines [1,24,25,26]. This suggests a sequence of interdependent decisions, in which earlier outcomes can affect subsequent decisions [5,27]. Quantifying the specific search cost for a user can involve measuring the cumulative time duration toward an item up to the current moment within a consumer search session [25,28]. Our argument is that the previous search cost invested by a user in obtaining information about a specific hotel, which forms the current individual-level hotel perception, can influence their later CTDs toward that hotel. In order to effectively select a hotel, it is indispensable to understand the relevance of hotel attributes to the needs of the user. Search engines often provide refinement tools such as filtering and sorting, which are personalized functions [15,23]. The use of these tools can help involve users more actively in the search process and reveal their specific demands [16,29]. Once users employ these refinement tools, the ranking of hotels on SERPs can be re-ordered based on criteria such as price and distance to a point of interest. However, due to the multiple and conflicting criteria used, users may be presented with options that are the cheapest but furthest away or vice versa [10,29]. The use of refinement tools might complicate the process of mobile CTDs.
This study aims to assist OTAs such as Expedia, Trivago, and Booking.com in understanding the intent of mobile hotel bookings, namely the mobile CTDs, in order to improve mobile search engine marketing performance. A dynamic Bayesian inference model is proposed to model the decision-making process at the user–item interaction level, using real-world global OTA search log datasets for both mobile and desktop searches. Owing to its superiority in characterizing the uncertainty in parameter estimation [26,30,31], this study can investigate the decision-making process at the microscopic individual-level for considering user heterogeneity. To shed light on the factors that affect the mobile CTDs and the specific differences in those effects between mobile OTA search and desktop OTA search, this study aims to address these issues:
RQ1: 
To what extent do item-ranking positions on SERP influence mobile CTDs in comparison to desktop CTDs, and what is the magnitude and distinction of this influence?
RQ2: 
What is the heterogeneous effect of price on CTDs during online consumer search? Specifically, how do absolute price, price perception, and price fluctuation impact mobile CTDs?
RQ3 
: What are the effects of search cost (as measured by item-specific cumulative time duration), and does the utilization of refinement tools augment or decrease mobile users’ search costs on their CTDs?
This study makes significant contributions to the existing literature on mobile commerce and mobile IS. Firstly, our research compares the differences of item-ranking position effect in the CTD mechanism for high-involvement product decisions between mobile and desktop searches. Second, our findings on the heterogeneous effect of price add to the existing literature on price preferences for high-involvement products in a mobile consumer search. Third, in terms of methodology, we proposed a dynamic Bayesian inference to investigate the factors affecting mobile CTDs. This departs from previous research by identifying user–item interaction-level characteristics and incorporating uncertainty in consumer search. Last, our study offers insights on various tactics for mobile search engine marketing and strategic investment in bidding ranking positions, which have practical implications for managers.
The remainder of this study is organized as follows: In Section 2, we discuss the related literature on the current state of studies. In Section 3, we provide a data description and present preliminary findings. In Section 4, we introduce our proposed dynamic Bayesian inference model and Monte Carlo Markov chain algorithm. We then interpret the estimation and robustness results from our proposed model in Section 5. Section 6 discusses the specific differences between mobile and desktop OTA search. In Section 7, we provide a discussion about the theoretical and managerial implications of this study. Finally, Section 8 outlines the conclusions and future research directions.

2. Literature Review

2.1. Item-Ranking Position Effect

Research on search engine marketing (SEM) has garnered attention across various fields, as it provides filtering and ranking recommendations to combat information overload [10,32,33]. In the field of IS, researchers have studied consumer search behavior in order to design more effective search engines [21,24,34]. Prior research has shown that a primacy effect exists in information search engines such as Google and Bing. An eye-tracking experiment revealed that when users click on a hyperlink from Google’s search results, their clicks are strongly biased toward higher-ranking hyperlinks [11]. For example, researchers have proposed a two-stage Bayesian model to examine the effects of the properties of paid search ads on ad performance, and they found that lower-ranking positions on SERP lead to lower click-through rates [12]. Similarly, items ranked earlier on SERP tend to attract more clicks and result in improved SME profits in desktop search [13]. In recent years, researchers in the tourism and hospitality field have also begun to investigate the primacy effect on the performance of small and medium-sized enterprises (SMEs). Pan developed a click-through rate model for public websites and examined the click-through rates of destination marketing organizations at different ranking positions [3]. He found that the power-law distribution of click-through rates varies depending on the rank on a web search: the top results receive high click-through rates, but the rates decrease significantly as the ranks go down. Law and Huang conducted an empirical study which found that about 50% of users viewed three screens of items at most on SERPs [14].
Several studies have paid attention to the impact of online screen positions on travel product search engines. Ghose et al. used a hierarchical Bayesian model and data from a real-world travel search engine to examine the effect of ranking on consumer search and SEM revenue [15]. They found that top-ranking hotels received more clicks, but default hotel rankings resulted in more profits than those customized to users’ attributes. Evidence from PCs also shows that the ranking position of a hotel on SERP greatly influences users’ booking intentions [18], leading to differences in the market share of online hotel firms [16].
Mobile commerce has changed the consumer decision-making environment [5,21,35]. Mobile device traffic is dominated by last-minute and quick booking tasks [9], indicating the more urgent time constraints of mobile travel search engines [3,5,6]. The small screen of a mobile OTA search may change the effects of item-ranking positions, as the narrow screen restricts users to local perception [21,22]. Those previous findings may not necessarily apply to high-involvement purchase decisions in a mobile OTA search. There is potential to research the effect of item-ranking positions in mobile travel search engines.

2.2. Price Effect in Consumer Search

Out of the screen position effect, the effect of price on consumer search has been discussed [12,15,23]. Baye et al. found that a lower price leads to more clicks received by an online retailer [23]. Similarly, Ghose et al. also displayed that price is negatively associated with consumer click-through rate on the PC-based internet [15]. Hotel booking is a specific type of high-involvement product purchase decision-making [17]. Price search activity is driven by a user’s perceived search efficiency and motivation [36]. As the date of check-in approaches, mobile users have limited time to make a decision about their hotel choice. In this context, it is possible that a higher hotel price is perceived as an indication of higher quality for high-involvement products such as hotel bookings. This study aims to investigate the impact of hotel prices on mobile OTA searches.
Previous research by Rutz and Trusov has shown that users who are sensitive to the ranking positions of products on a screen are also more sensitive to price [12]. Studies on digital cameras as another type of high-involvement product have found that users tend to purchase cameras that closely match the characteristics of the cameras they initially searched for [24]. In mobile searches, users may base their decisions on the price rankings of products displayed on the current SERPs or by comparing them to the average price of items they have recently interacted with during their online session. We assert that the price of click-through items is associated with the user’s perception of price. This study aims to examine the heterogeneous effects of price in mobile travel search engines by considering both the absolute and relative impact of price on mobile consumer behavior.

2.3. Refinement Tools and Search Cost in Consumer Search

In context of a product search engine, search cost is associated with acquiring information about a product [1,24,28]. Achieving a trade-off SEM between users’ search cost and efficiency is a challenging task, particularly when dealing with the limitations of small screens and time constraints on mobile devices [3,9,21]. The vast amount of information available online can overwhelm users’ ability to process it due to the limitations of human attention [10]. Refinement tools are designed to help mitigate this problem by narrowing down the amount of information presented to users. However, previous research on e-commerce search engines, where the number of products is much larger than in tourism, has found that the re-ranking effect of refinement tools is not always beneficial to consumers’ search [29]. In other words, the use of refinement tools can increase users’ involvement in the search process, but this increased involvement may not always lead to better results [16,29]. Additionally, time constraints can increase the cost of searching for information both online and offline [16,37]. It raises the question of whether using refinement tools in mobile search environments maximizes the match between users’ demands and the most relevant products.
Behavioral engagement influences the user’s dynamic perceived intent, which can affect their subsequent decisions [24,38,39]. Before a user decides to click through and make a purchase decision, the cumulative search duration, which includes processing information about specific items (such as ratings, images, deals, etc.), affects their perception toward distinct items [25,28]. Both current users’ psychological and behavioral engagement have a positive influence on subsequent decisions, such as digital item sales [40]. There are sequences of interdependent tourism decisions, where later decisions depend on the outcomes of earlier ones [5,27]. Mobile CTDs can be defined as dynamic decision making in an ongoing or en route paradigm due to their sequential characteristics during a session [12,21]. This study examines the effect of search cost (i.e., item-specific cumulative time duration) on mobile CTDs in a dynamic process.

3. Description of Session-Log Datasets and Variables

The session-log datasets used in our study were sourced from a major German OTA. The data consist of the mobile and desktop OTA search activities of 108,902 users who visited the focal OTA during the period of 1–7 November 2018. The dataset includes 53,824 mobile users who engaged in 53,845 sessions, as well as 55,078 PC users who engaged in 59,702 sessions. The OTA provides a global platform for travelers to search for and compare hotels and tourism information via their websites and mobile apps in over 190 countries. Figure 1 illustrates the interface of a typical mobile OTA travel search engine. In this study, the mobile platform displays a list of up to 25 items per SERP in the experimental time window, which is in accordance with the standard business setting.
The click-through decision (CTD) is an intuitive measure of hotel booking intentions that is produced when a user visits, browses, searches for information on an OTA, and clicks on a link that redirects them to the hotel advertiser’s booking webpage. In this study, CTD is referred to as the dependent variable. This study had access to hotel-related and user-related data, such as property type, hotel class, overall guest rating, and search platform in the user’s region during the experimental time window. The final mobile dataset contains 602,683 observations for 87,745 hotels, and the final desktop dataset contains 672,880 observations for 95,703 hotels. We observed users’ sequential actions in the unit of the session. Because this study aims to scrutinize the SEM performance by focusing on the intent of booking a hotel, we model the dynamic user-item-level CTDs as a within-session sequential search and decision-making process.
Table 1 provides a definition and statistical summary of variables in the mobile dataset for examining the roles of item-ranking position, price, search cost and refinement tools in mobile CTDs. We introduce the item-ranking position, Pos, which ranges from 1 (top item) to 25 (bottom item) on an SERP. Given the small screen size of mobile devices and the scarcity of attention among users [10,19,20], they tend to focus more on the top results. In light of this, a binary variable, Top, is measured to indicate if an item is in the top-1 position.
To deconstruct the price effect, three measures are provided: (1) The absolute price, Price, indicates the price per room per night. (2) The price ranking of an item, PriceRank, is its ranking of the item’s price in relation to the prices of other items on an SERP, with a lower ranking indicating a lower price among 25 items on the current SERP. (3) The price perception of an item, PriceRel, compares the item’s price to those that a user has viewed during their current session. Namely, it is a difference between the price and the average of past realizations (reference the user has in mind). This is a rather standardized price perception with respect to historical exposure to prices. Because users tend to make purchases based on the characteristics of products they searched for early on [24], we argue that the price of click-through items is associated with the user’s perception of price. It is worth noting that PriceRank depicts price rankings on an SERP, while PriceRel is a metric that measures the changes in perceived prices of products that a user has recently viewed or interacted with during their current session.
The variable Ref is used to denote whether the item stems from default sorting or refinement-tool sorting (including filter selection or customized sorting). The search cost is measured by the cumulative time a mobile user spends searching for a specific item during a session, according to recent research [28,39]. The cumulative time duration reflects the user’s current perception of the item.
It is worth noting that the main variables are measured at the user–item–time varying level. In other words, the main variables measure the sequential search activities S i h t of a user i interacting with a hotel h at a specific time t .
In our analyses, we included various control variables. At the hotel level, we controlled for the property type Property (hotel or house/apartment), Class (five-star rating classes and one without star rating), and overall guest rating Rating (null, satisfactory, good, very good, excellent). Additionally, we controlled for user-level characteristics by accounting for the region where the users accessed the OTA search platform Platform. We used dummy variables for regions where users were located. The detailed information about each region is listed in Table A1 in the appendix.

4. Methodology

To address our research questions, we propose a dynamic Bayesian inference model. Please note that the proposed dynamic Bayesian inference model is distinct from a Bayesian network model. The Bayesian inference model is designed to respond to diverse user preferences in real-world marketing scenarios [15,26]. This is different from the aggregate point estimate approach, such as a linear regression model. The dynamic Bayesian inference model regards heterogeneity as a statistical nuisance parameter problem [12,30,31].
In this study, our proposed dynamic Bayesian inference model mainly for modeling an individual user’s sequential click-through decision (binary outcome) within a session. Note that the main seven variables are measured at the user–item–time-varying level as shown in Table 1. In other words, the main variables measure sequential search activities S i h t in which user i interacts with hotel h at time t . On the one hand, some variables are not strictly related to each other in different time steps, such as Posiht, Topiht, Priceiht, and PriceRankiht. However, the values of these variables are time-varying as an individual user interacts with hotel h . In addition, PriceReliht, Refiht, and CumTimeiht are strictly related to their values at t 1 , respectively. Overall, our proposed model can capture users’ temporal patterns in session, which can provide valuable insights for real-world marketing practices.

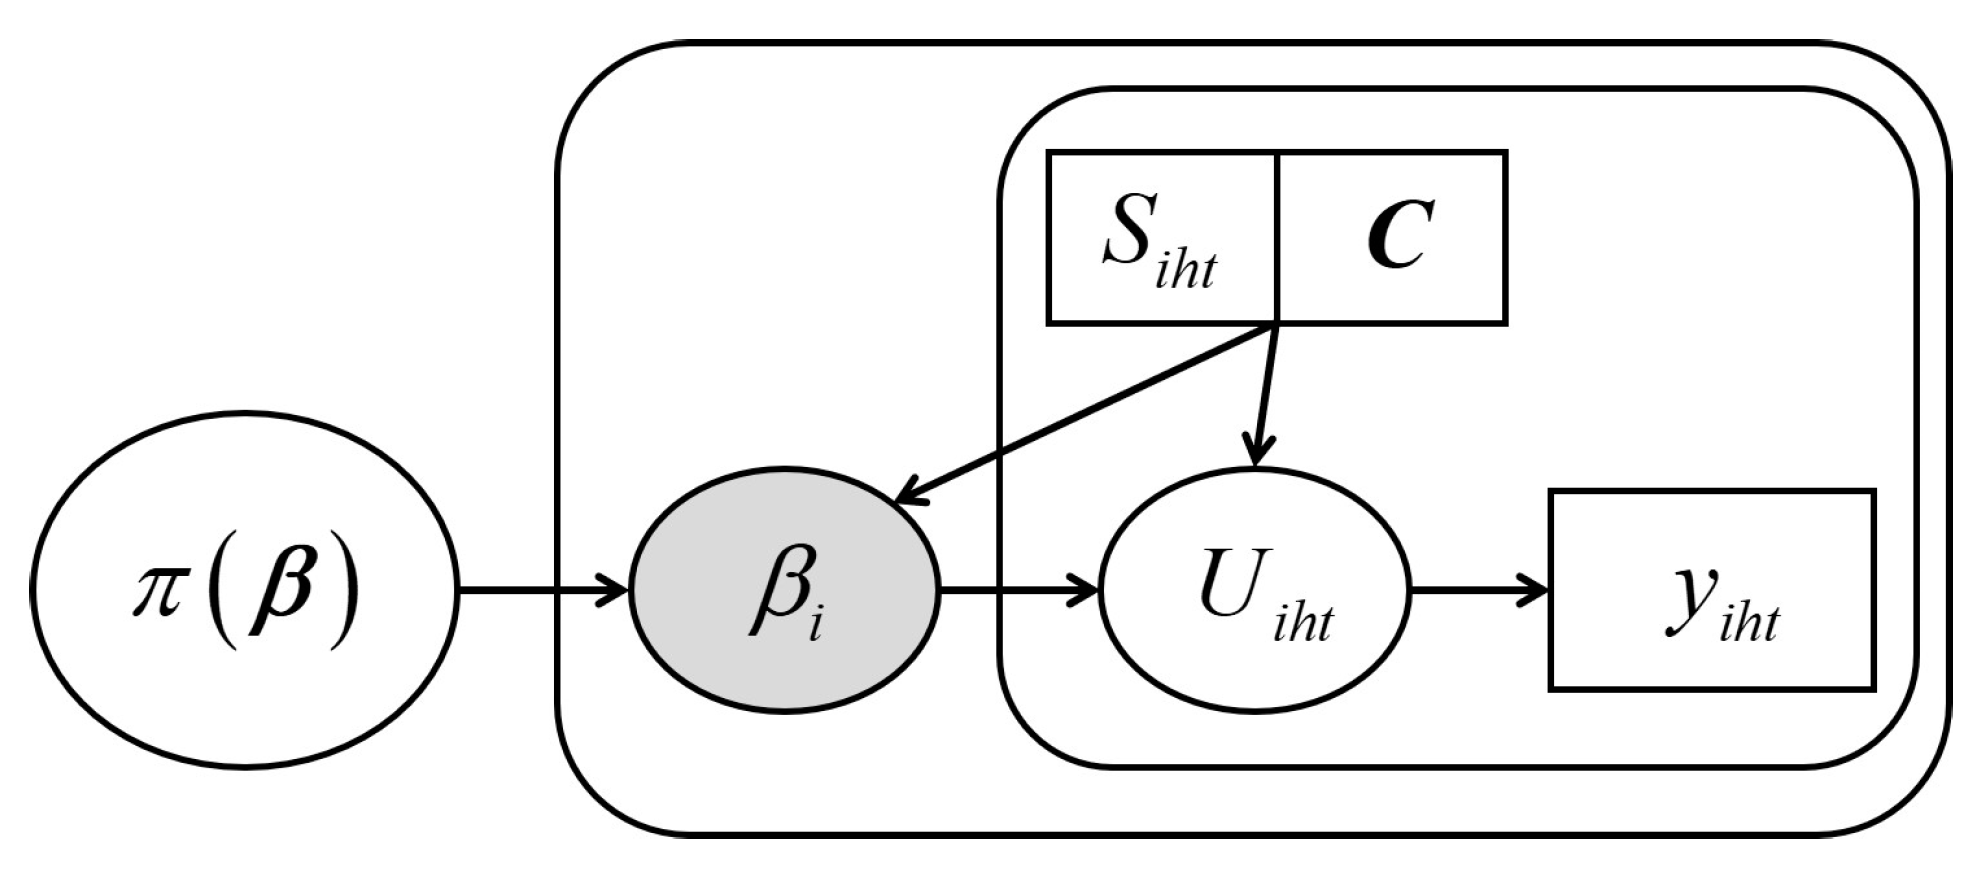
4.1. Individual User Level Click-Through Decision Model Using a Dynamic Bayesian Model

The explicit individual user’s click-through decision (binary outcome) is modeled using a stochastic-utility framework. We model the latent utility U i h t for user i click-through hotel h at time t based upon observable consumer search S i h t within an online session in Table 1, which is given by
U i h t = β i 0 + P o s i h t β i 1 + T o p i h t β i 2 + P r i c e i h t β i 3 + P r i c e R e l i h t β i 4 + P r i c e R a n k i h t β i 5 + R e f i h t β i 6 + C u m T i m e i h t β i 7 + ε i h t
where β = [ β i 0 , β i 1 , , β i 7 ] 1 is an 8 × 1 vector of parameters of our proposed model to be estimated; and the error term ε i h t is I.I.D a standard normal distribution. Furthermore, to account for a potential non-linear effect in mobile OTA search, we include an extra quadratic term of item-ranking position Pos2 in our model. As a user changes orders or filters by some criteria, the subsequent search cost might be strengthened or weakened; we include the interaction between the use of refinement tools Ref and the cumulative time duration CumTime. Lastly, we also control hotel level property type Property, hotel class Class, and overall guest rating Rating as well as user level regional platform Platform. Thus, the latent utility receives a full model as follows
U i h t = β i 0 + P o s i h t β i 1 + T o p i h t β i 2 + P o s i h t 2 β i 3 + P r i c e i h t β i 4 + P r i c e R e l i h t β i 5 + P r i c e R a n k i h t β i 6 + R e f i h t β i 7 + C u m T i m e i h t β i 8 + R e f i h t C u m T i m e i h t β i 9 + P r o p e r t y h α 1 + C l a s s h α 2 + R a t i n g h α 3 + P l a t f o r m i α 4 + ε i h t
We denote C = P r o p e r t y h α 1 + C l a s s h α 2 + R a t i n g h α 3 + P l a t f o r m i α 4 . Let S i h t denote an intercept and nine time-varying variables on the right side of the Equation (2) hereafter. β = [ β i 0 , β i 1 , , β i 9 ] 1 is current a 10 × 1 vector of parameters and the latent utility U i h t = N ( S i h t T β + C , 1 ) . Thus, given hotel h at time t , the CTD y i h t of user i in a session is
y i h t = { 1 if               U i h t > 0 0 if               U i h t 0
In this setting in which the error term ε i h t is independent and identically distributed in a standard normal distribution, we can define the binary click-through decisions y i h t as independent Bernoulli random variables with their probabilities:
Pr ( y i h t = 1 ) = Pr ( U i h t > 0 ) = Φ ( S i h t T β + C )
where in Φ ( ) is the cumulative distribution function of a standard normal distribution. Pr ( y i h t = 1 ) is the probability of clicking through hotel h , while Pr ( y i h t = 0 ) denotes the probability of non-click-through actions.
Given the observed data, this model is exploited to demonstrate whether an individual user clicks through a hotel or not; then, the latent utility U i h t has the interpretation as the difference between these two choices. The data augmentation [30] of Bayesian inference enables us to use a normal prior π ( β ) about β in the latent structure of Equation (4). Hence, the joint posterior distribution of the unobservable β and the latent utility U i h t for completing our proposed Bayesian CTD model according to the Bayes theorem is given by
Pr ( β , U i h t | S i h t , C , y i h t ) = k π ( β ) i h t { I ( U i h t > 0 ) I ( y i h t = 1 ) + I ( U i h t 0 ) I ( y i h t = 0 ) } × ϕ ( U i h t ; S i h t T β + C , 1 )
where in k is a generic proportionality constant, ϕ( ;μ,σ2) is the probability density function N ( μ , σ 2 ) , and I ( X A ) is the indicator variable that equals 1 when the random variable X is included in the set A . The Monte Carlo Markov chain (MCMC) method using the Gibbs sampling algorithm [30] is utilized to obtain the marginal posterior density β by integrating out U i h t from Equation (5). The marginal posterior density is represented by
Pr ( β | S i h t , C , y i h t ) Posterior [ i h t Φ ( S i h t T β i + C ) y i h t ( 1 Φ ( S i h t T β i + C ) ) 1 y i h t ] Joint   likelihood × π ( β ) Prior

4.2. Posterior Estimation Using a Gibbs Sampling Algorithm

The Bayesian inference model allows us to investigate the decision making in a microscopic individual-level process with user heterogeneity [12,15,26,30,31]. This is different from aggregated point estimates by conventional discrete choice models. β and y i h t are independent conditional on the latent utility U i h t . Therefore, a Gibbs sampling algorithm can compute the posterior distribution of β and U i h t :
U i h t | β , S i h t , C , y i h t
β | S i h t , C , U i h t
For ease of exposition, our Bayesian model can be represented by a directed acyclic graph in Figure 2. In this representation, the rectangular nodes denote the observed variables, including user search activities S i h t , control variable part C , and the CTD y i h t . In contrast, the round nodes denote stochastic quantities or parameter distributions of deterministic relationships. The gray round is the parameters β of deterministic relationships to be estimated. Each arrow represents a stochastic dependence or deterministic dependence. In Figure 2, a bigger rectangle indexes the nodes within it from an individual user i , and the repetition is from 1 to the number of users. The smaller one represents that the user i acted with a hotel h on time t in an online session. Out of the two rectangles, the round node is the normal prior π ( β ) about β . We applied the MCMC method using the Gibbs sampling algorithm to estimate posterior densities of the proposed Bayesian click-through model. Refer to [30,41] for detailed methods and procedures.

5. Experiments and Results

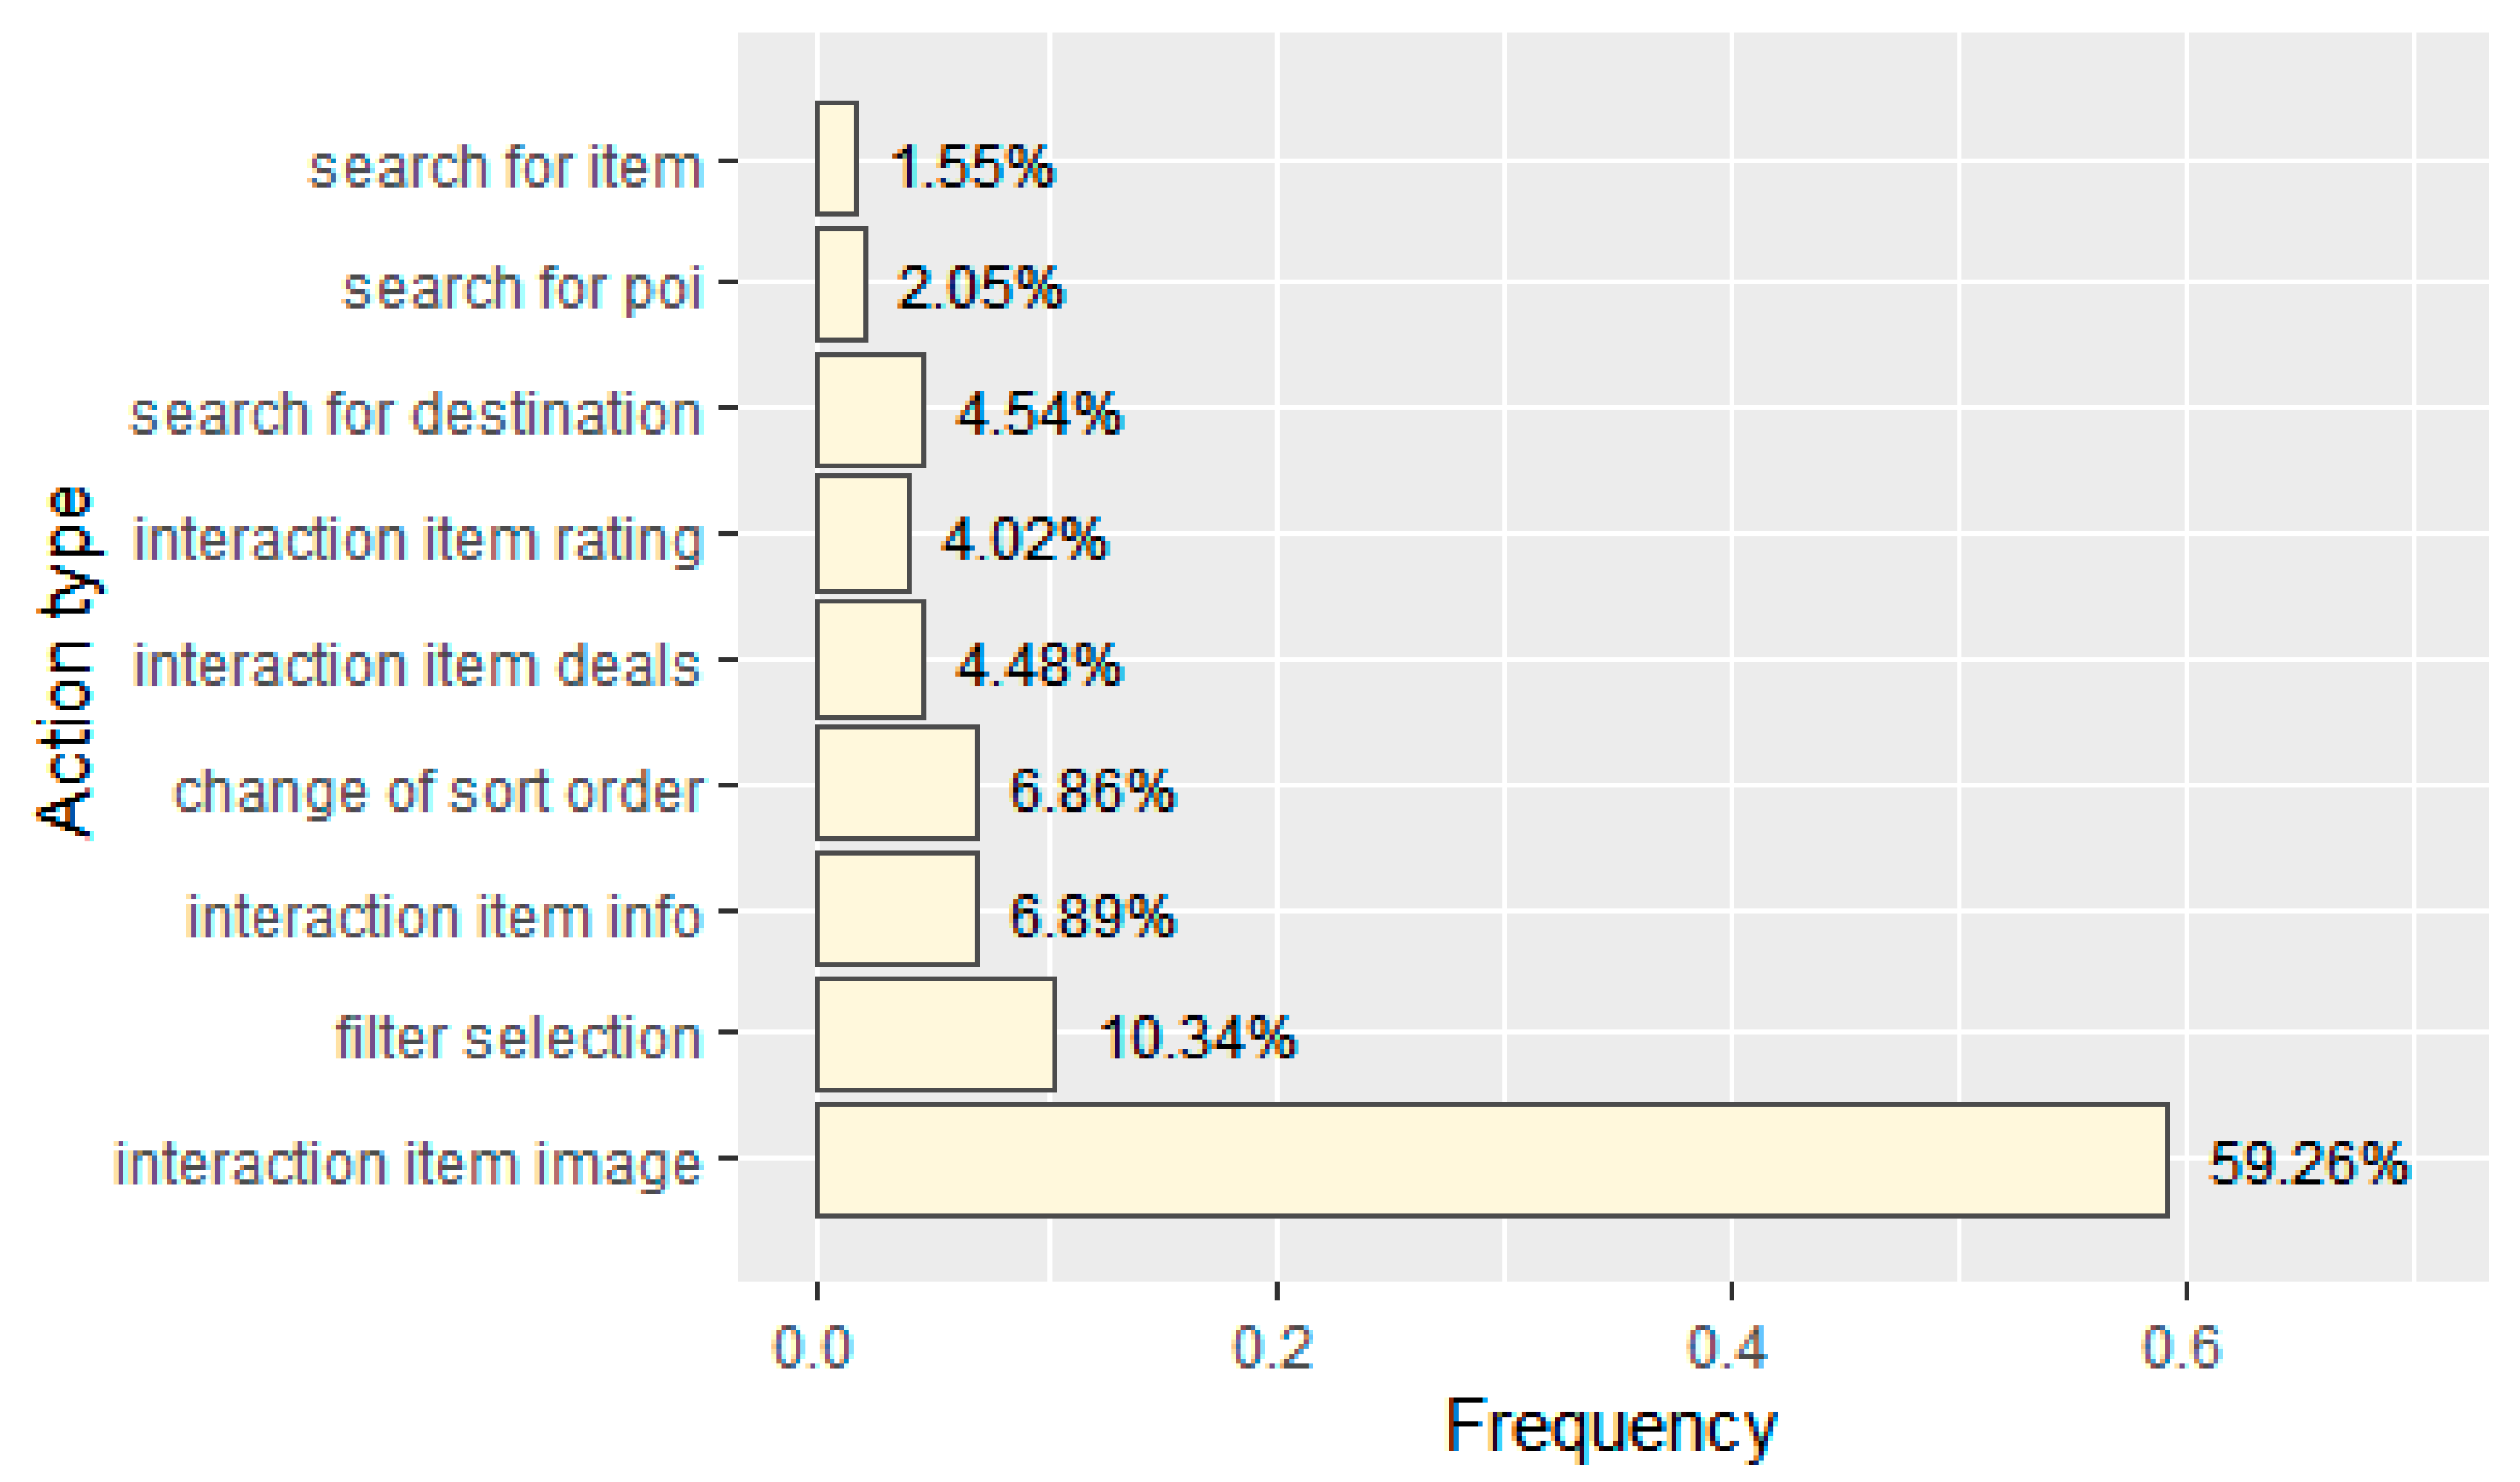
5.1. Properties of Mobile OTA Search

To understand the mobile consumer behavior, we analyze the mobile dataset and provide the properties of the mobile OTA search.
Figure 3 presents the relationship between the ranking positions of hotels and the cumulative dwell time users spent interacting with them in. We observe that the relationship between item-ranking position and engaging time duration is not linear. This suggests that the effect of the online screen positions exists in the mobile environment, where users tend to spend more time on higher-ranking items on a small screen. Additionally, mobile users tend to spend more time interacting with the top and bottom search results rather than those in the middle. This preliminary discovery implies that there may be a U-shaped effect on mobile hotel click-through decisions.
A user starts a search in a mobile travel search app, and her search queries are always associated with destination firstly, and they eventually click item(s) through to book a hotel or end this session with the no-click-through decision. Figure 4 shows that users from different regions have varying hotel price preferences during the mobile booking process. Factors such as the popularity of the platform or region, income difference in different regions, and the demand for travel in that area can all affect the average price of a click-through hotel. The study will examine the price effect on mobile CTDs by assuming that the price preference varies across regions. In other words, this study controls the region where the users accessed the OTA search platform Platform. The detailed information about the average price of click-through hotels in different regions is also presented in Table A1 in Appendix A.
In addition to click-through behavior, mobile OTA search activity includes individual users’ searches, filters, refinements, and interactions with item ratings, deals, and images. Figure 5 shows the distribution of user action types, with the majority of users interacting with item images (59.26%), which is followed by the use of refinement tools such as filter selection (10.34%) and changing the sort order (6.86%).
Furthermore, we observe the properties of mobile users’ search cost in Figure 6. Intuitively, most mobile users tend to visit a hotel within 500 s (about 8.33 min), as shown in Figure 6a. The search cost CumTime, the cumulative time duration toward an item within a session, has a positively skewed distribution. Most values of search cost are clustered around the left tail of the distribution, while the right tail is longer. This suggests that mobile users may expect frequent, small search costs to make CTDs. Figure 6b provides a more detailed analysis for a range of CumTime between 0 and 120 s. The variation of frequent, small search costs is not smooth and steady. This highlights the need for not only point estimates for the effect of search cost on CTD but also a characterization of the uncertainty in these estimates. Our proposed Bayesian model is able to consider the diversity of search costs by estimating posterior distributions for the effect of search cost.

5.2. Robustness and Results of Mobile OTA Search

To estimate our proposed model, we ran the MCMC chain for 8000 iterations using the mobile dataset with 602,683 observations of 53,824 users and 53,845 sessions. We used the first 6000 iterations for burn-in to ensure convergence and retained the last 2000 iterations to calculate the mean and standard deviation of the posterior distribution of estimates for analysis.
As robustness checks, we designed a set of alternative models for a mobile OTA search. The model fit is measured by the mean absolute deviation (MAE, lower is better) of estimated click-through probability and actual click-through decision. We compared four different models: Model 1, which used a simple linear form of item position; Model 2, which included a quadratic term to investigate the non-linear effect of item position; Model 3, which incorporated an interaction term; and Model 4, which included control variables for a full structure. The estimation results are presented in Table 2. It should be noted that the coefficients represent the means of the posterior distribution of estimates, and the values in parentheses indicate the posterior standard deviations. Our proposed model estimates a large number of individual-level parameters, which takes into account the diversity of preferences that exist in the estimation. It views heterogeneity as a nuisance parameter problem [12,15,26,30,31] as opposed to the aggregate point estimate approach. We discuss the full posterior distribution of estimates in Section 6.
As seen in Table 2, we found that the inclusion of a quadratic term of item position, interactions between the use of refinement tools and engaging search cost, and control variables improved the model fit performance gradually in terms of MAE, from Model 1 to Model 4. Model 4 showed the best performance, with the lowest MAE value among the alternative models. Additionally, we observed that the estimated valence of the effects on CTD was robust.
Rows 2–4 of Table 2 indicate that the effects of item-ranking position on mobile CTDs are statistically significant and robust. Model 4 shows that items in higher-ranking positions on the SERPs (Pos) receive more click-throughs than those in lower positions, as zero is not contained in its 95% posterior Bayesian credible intervals ( β 1 = 0.0153 with posterior standard deviations of 0.0012 ). It also suggests a primacy effect where the top-1 item on the SERPs (Top) has a positive impact on mobile CTDs ( β 2 = 0.0531 ). Meanwhile, the quadratic term of item-ranking position (Pos2) influences positively and significantly on mobile CTDs, with a mean of 0.0008 . A non-monotonic effect of item position reveals an advantage of top and bottom results.
Next, we turn our attention to the heterogeneous effects of price in mobile OTA search. Contrary to the existing empirical findings on a desktop OTA search [15,23], the absolute price (Price(L)) has a strong effect on the latent utility of mobile users to click-through a hotel ( β 4 = 0.0344 ). We note the price ranking of an item among 25 items on SERP (PriceRank) positively influences the willingness of mobile CTDs ( β 5 = 0.0091 ). Additionally, PriceRel has a small positive sign, showing the higher the positive price fluctuation of the item (relative to the average price of items previously interacted), the higher the mobile CTDs. However, this recency effect is quite small ( β 6 = 0.0002 ).
Interesting, after controlling Property, Class, Rating, and Platform, Model 4 shows that the effect of using refinement tools (Ref) on the mobile CTDs turns out to be not significant. When it comes to search cost, the more time mobile users spend on a focal item (CumTime), the higher their likelihood of click out ( β 8 = 0.0421 ). We also found that the interaction effect between the use of refinement tools and the item-level engaging search cost is positive and statistically significant ( β 9 = 0.0329 ).

6. Comparison between Mobile OTA Search and Desktop OTA Search

To identify the specific differences between mobile OTA search and desktop OTA search, we also resorted to our proposed Bayesian inference model and MCMC chain for estimating the effects in desktop OTA search using 672,880 observations of 55,078 PC users and 59,702 sessions. We applied the same configuration of Model 4 in Table 2 and ran the MCMC chain for 8000 iterations, with the first 6000 used for burn-in, while the last 2000 were used for estimation. Next, we then compared the posterior distributions of estimates β in both mobile OTA search and desktop OTA search, using their respective 2000 iterations. It is worth noting that the coefficients of Model 4 in Table 2 were calculated from the distributions in mobile OTA search, as shown in Figure 7, Figure 8 and Figure 9 (in yellow).

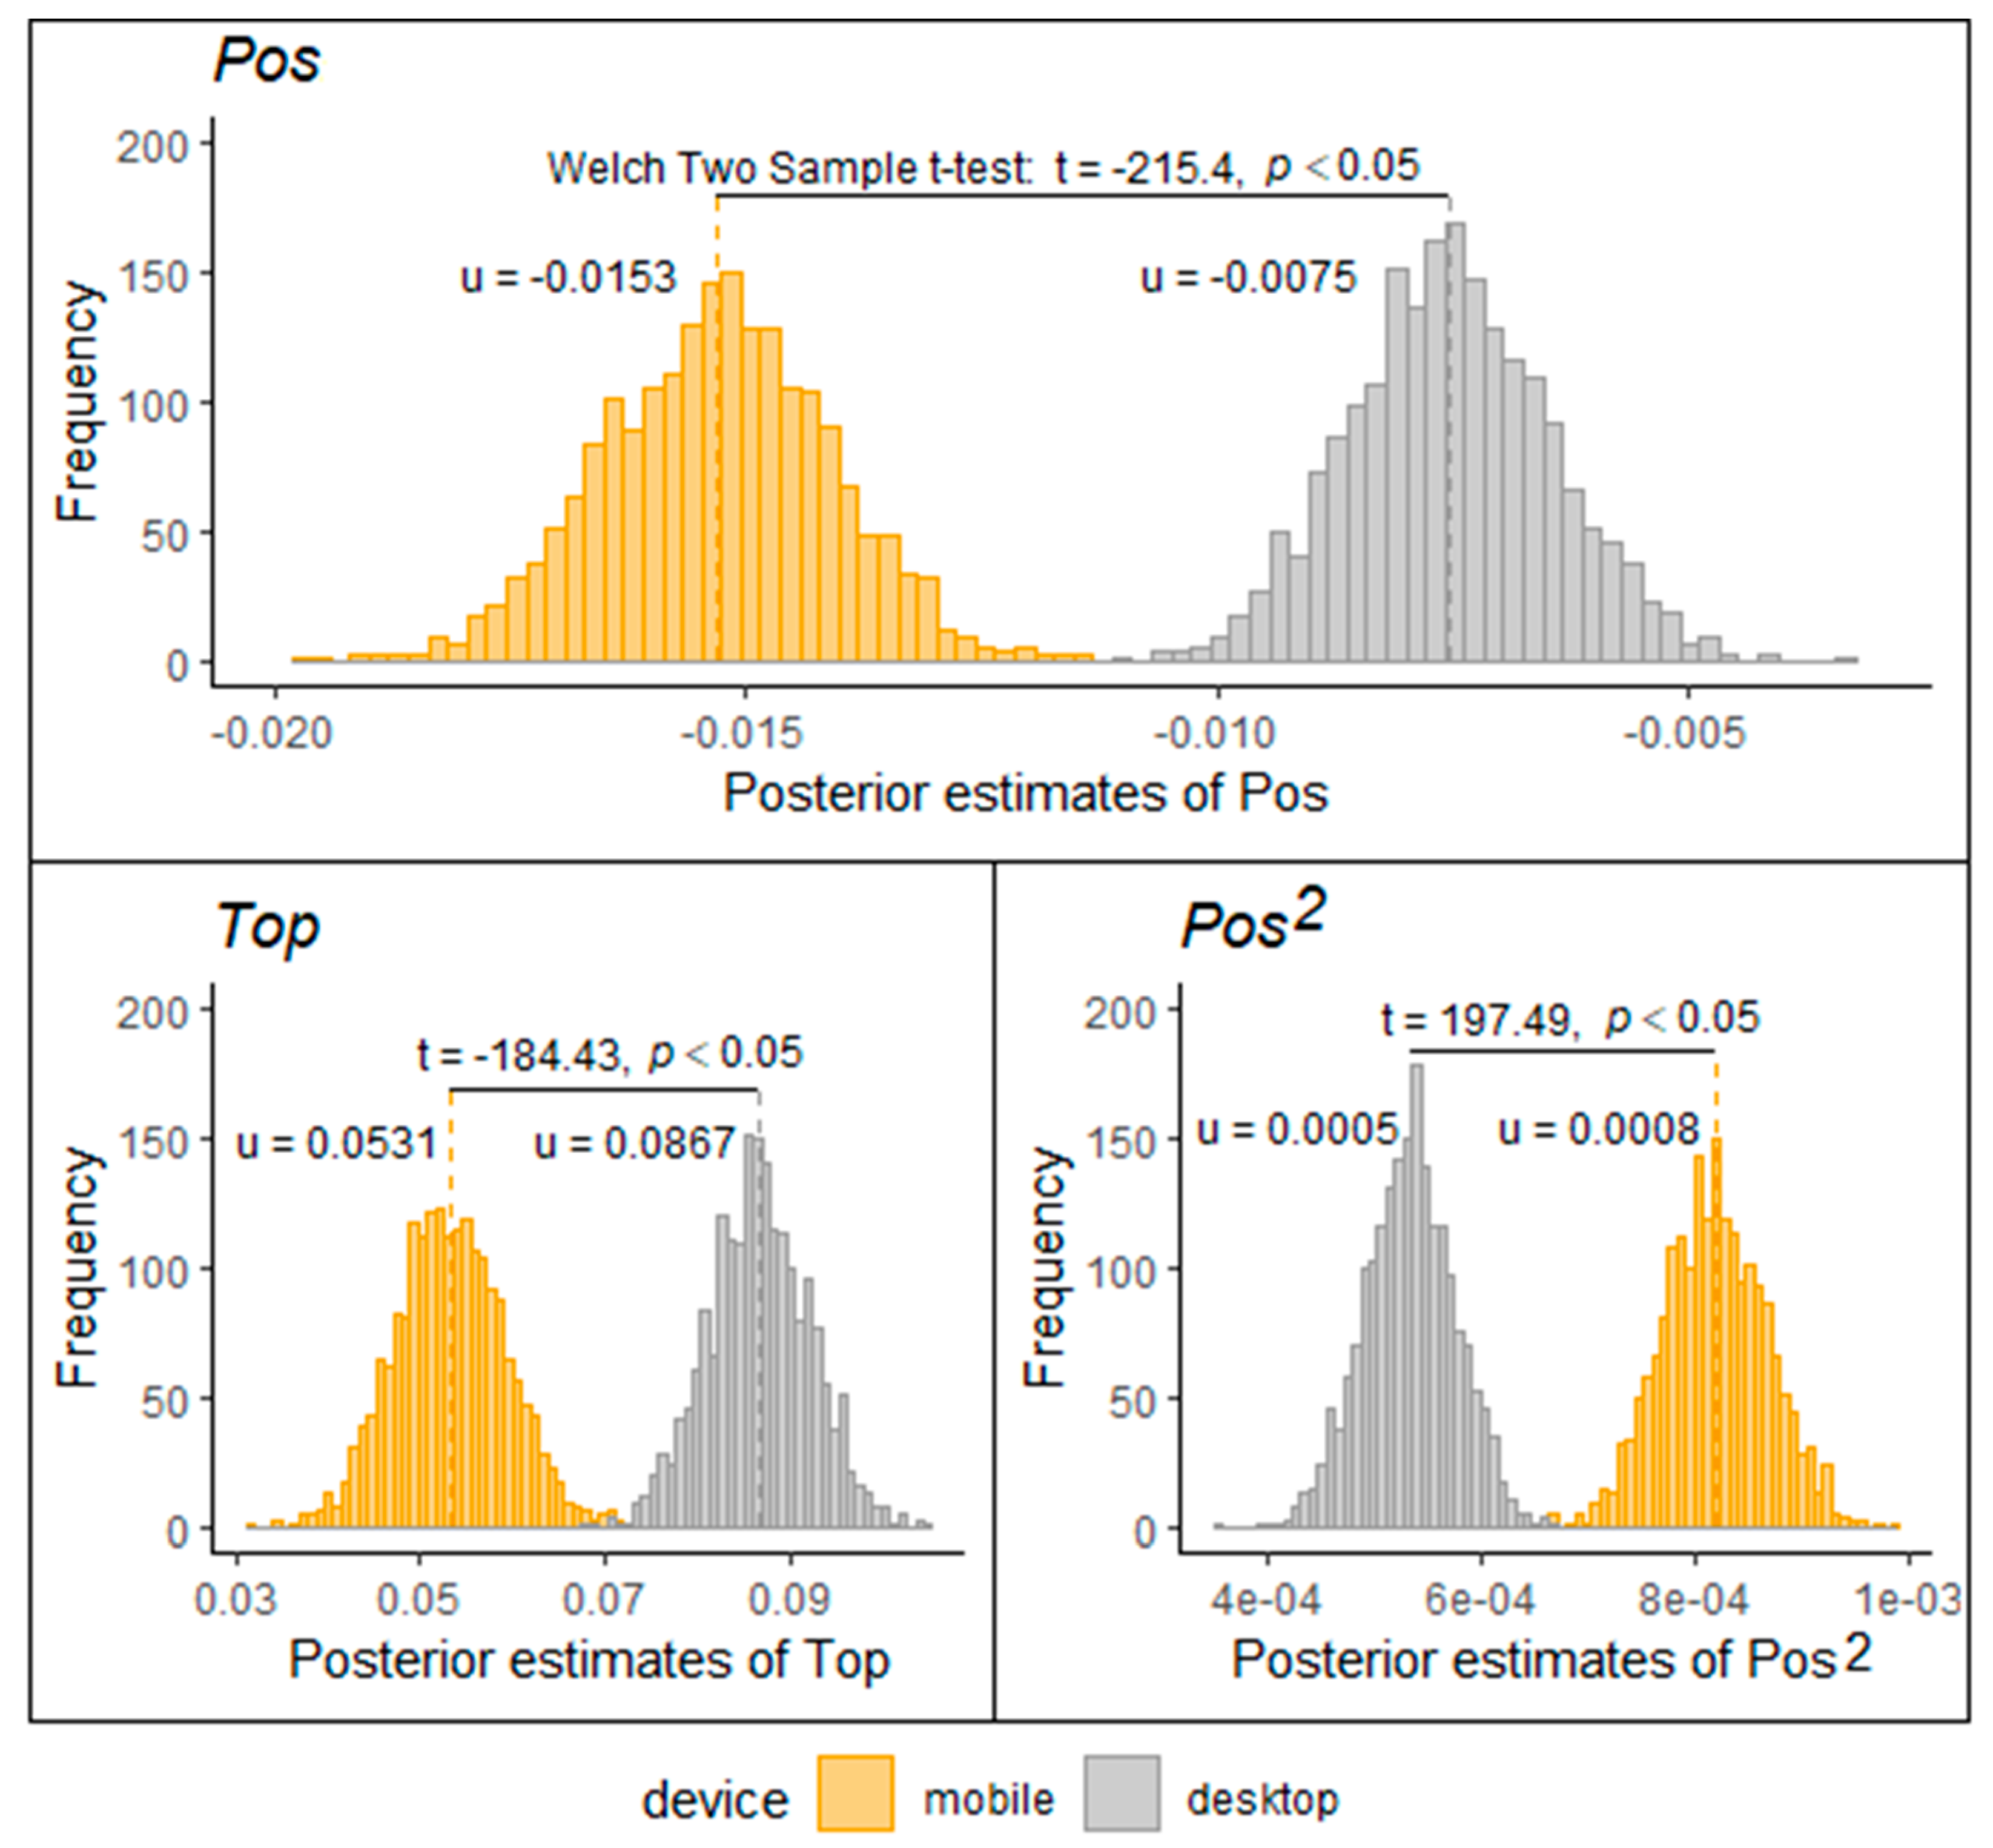
6.1. Item-Ranking Position Effect

To gain a deeper insight into the effects of item-ranking position in mobile and desktop OTA search. devices, we visualized their posterior distributions in Figure 7. Furthermore, to assess if there were any significant differences in these effects, we conducted a Welch two-sample t-test in order to determine if the three effects differ significantly at a significance level of 0.05.
Akin to the findings in previous studies in travel information search engines [3,14] or PC-based internet [15,16,18], the upper panel of Figure 7 illustrates that the position of an item (Pos) has a negative and statistically significant effect on users of both mobile and desktop devices, as 0 falls outside the 95% posterior Bayesian credible interval, similar to point estimates with statistical significance at p < 0.05. However, their posterior means are different (β1m = umobile = −0.0153, β1d = udesktop = −0.0075, t = −215.4, p < 0.05, similarly hereinafter). This suggests that there is a stronger negative effect of Pos in mobile OTA search. In other words, mobile users are more likely to click-through a hotel that appears earlier on an SERP than PC users (|umobile| > |udesktop|).
The lower left and right panels reveal the primacy effect and non-linear effect of item-ranking positions. The primacy effect is significantly weaker in mobile OTA search than in desktop OTA search (i.e., 0.0531 < 0.0867, t = −184.43, p < 0.05). Nonetheless, the non-linear effect of item-ranking position is statistically enhanced in a mobile OTA search (i.e., 0.0008 < 0.0005, t = 197.49, p < 0.05). The global view of SERP lists might be obstructed by information chunking owing to the small interface of mobile phones [21,22]. Even mobile users could search and scroll the whole item list of SERP as a sampling process to obtain a global psychological picture. These findings suggest that mobile users pay much more attention to the top-ranking items (appeared earlier) and the bottom items (appeared more recently) but neglect those items in the middle of SERP as compared to PC users. The primacy effect is dominant in both ends. Specifically, in a mobile OTA search, the magnitude of the primacy effect (Top, | β 2 m | = 0.0531 ) is much greater than that of Pos ( | β 1 m | = 0.0153 ) and Pos2 ( | β 1 m | = 0.0008 ). However, the top-1 items on the mobile SERP are less likely to achieve a high return on investment than that on the PC-end SERP. It approximates a U-shape effect, since mobile users might be restrained to recall information in a primacy–recency paradigm to decrease the risk of uncertainty.

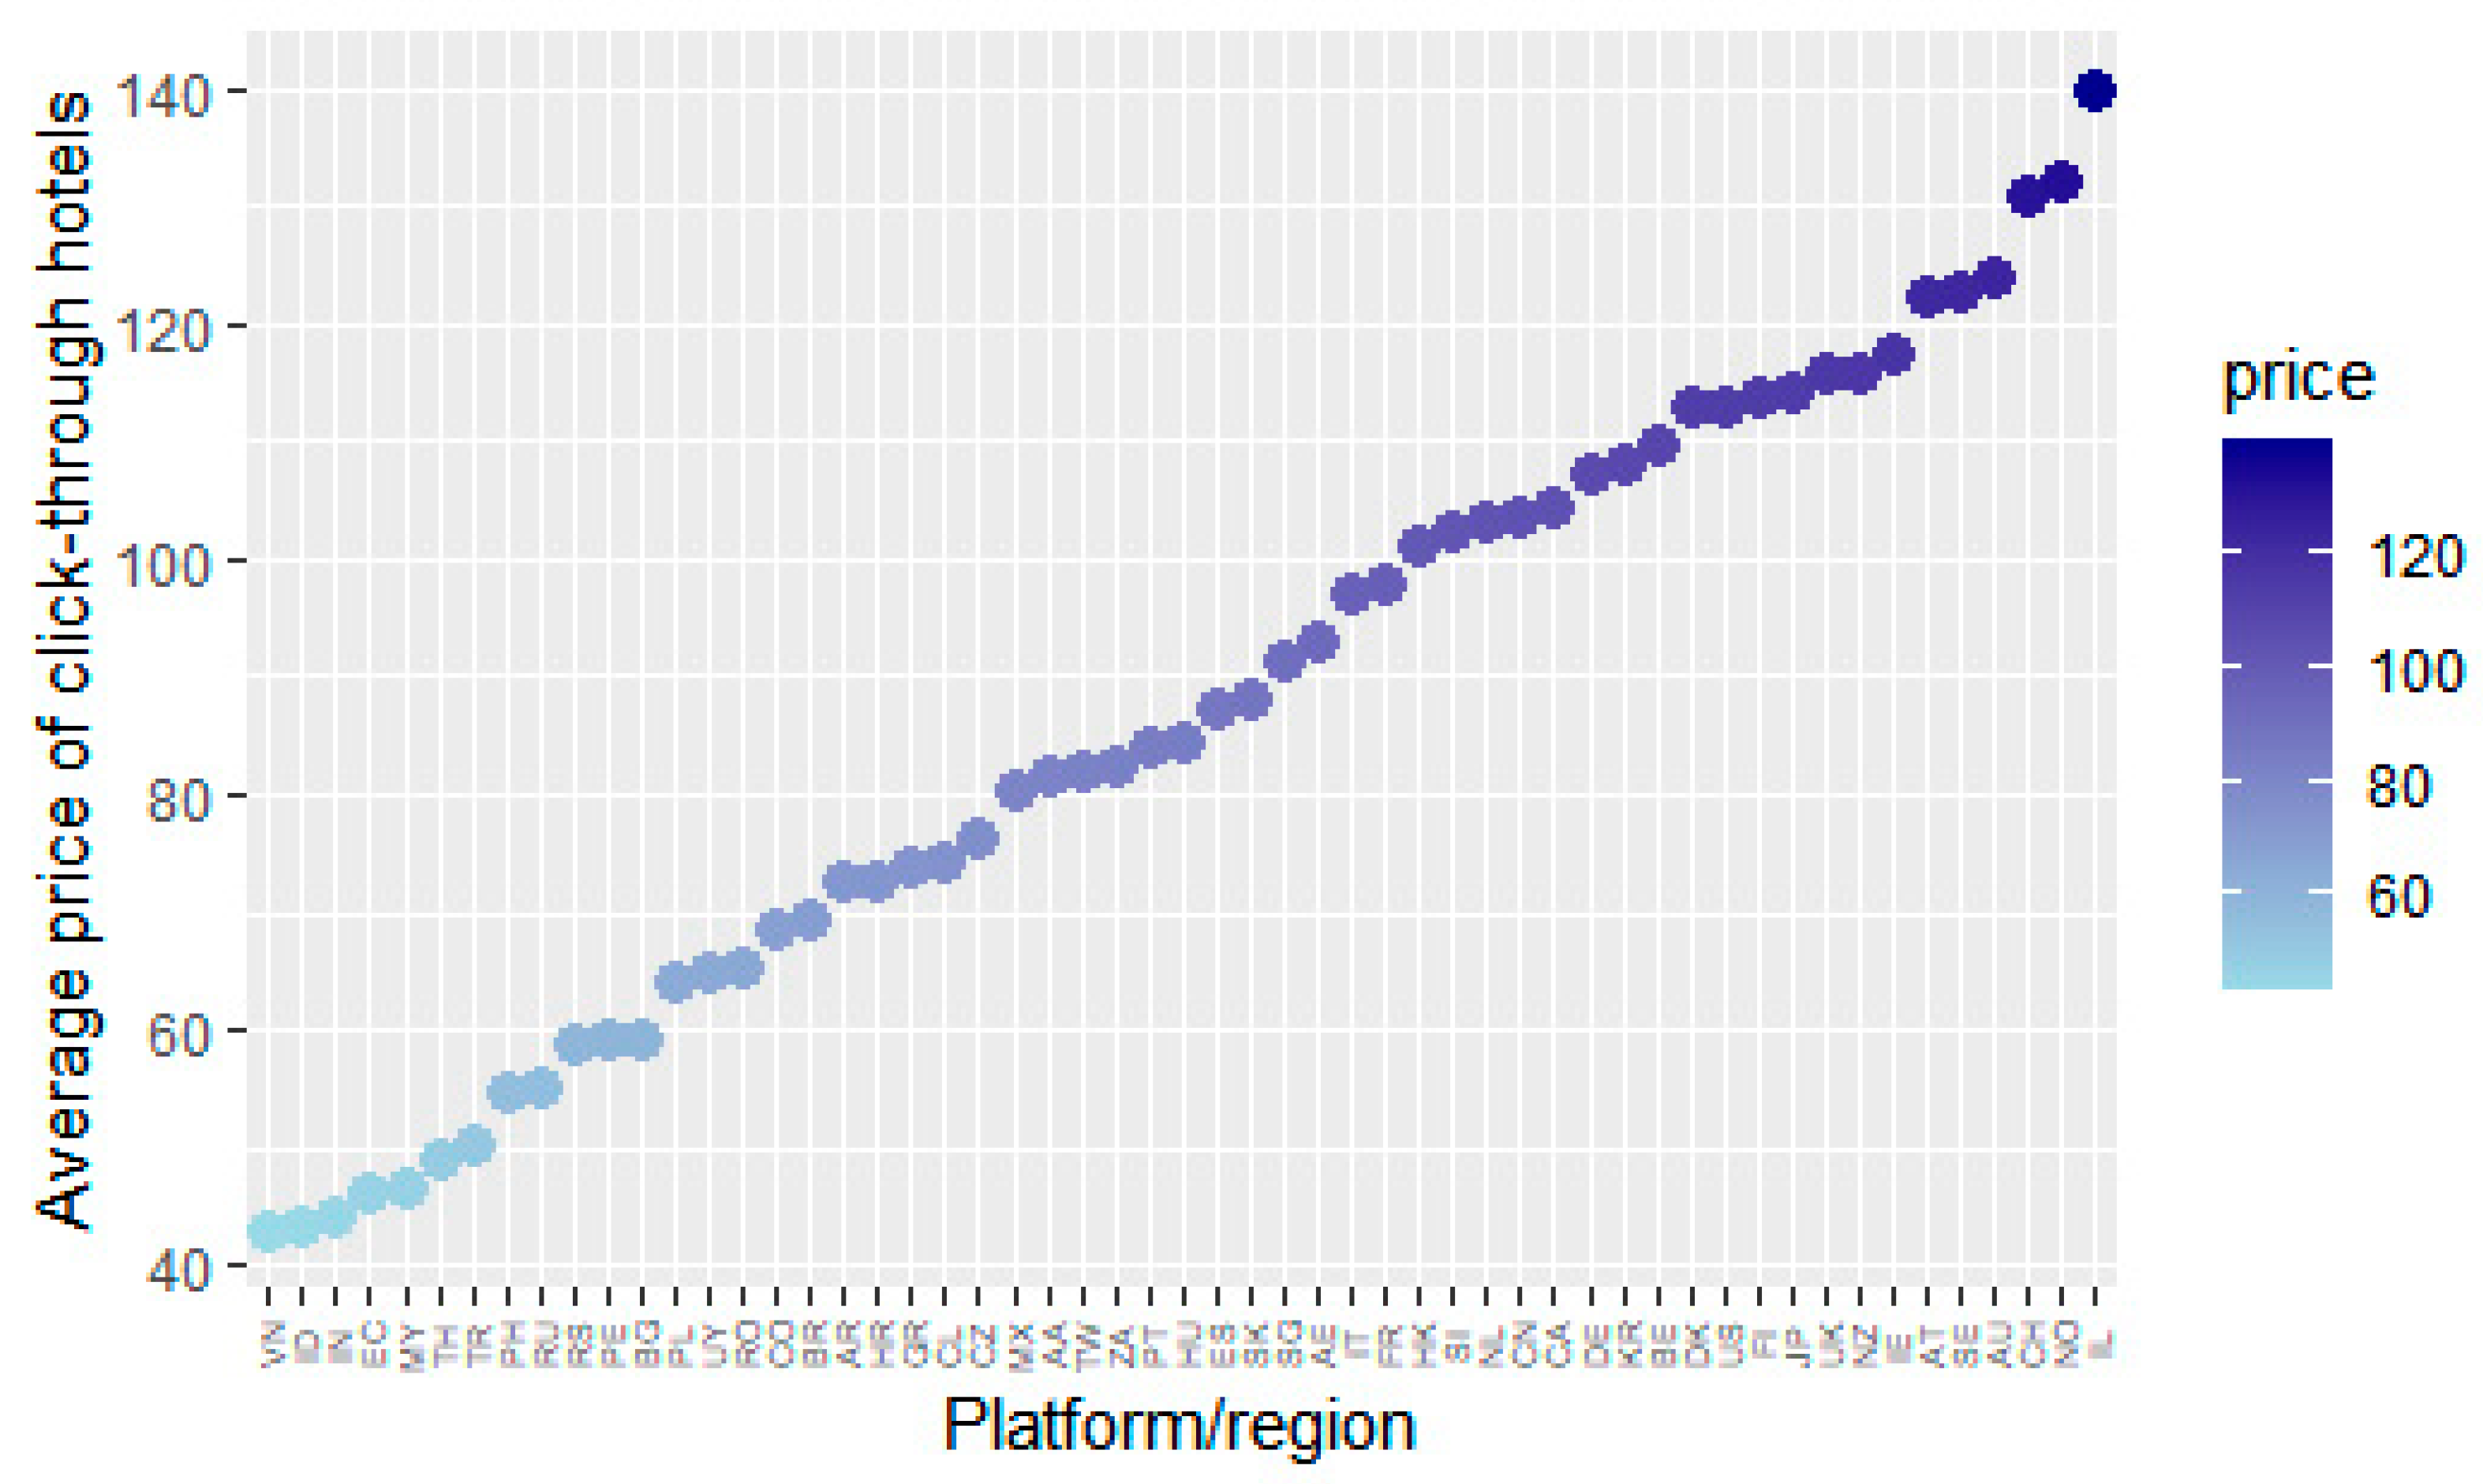
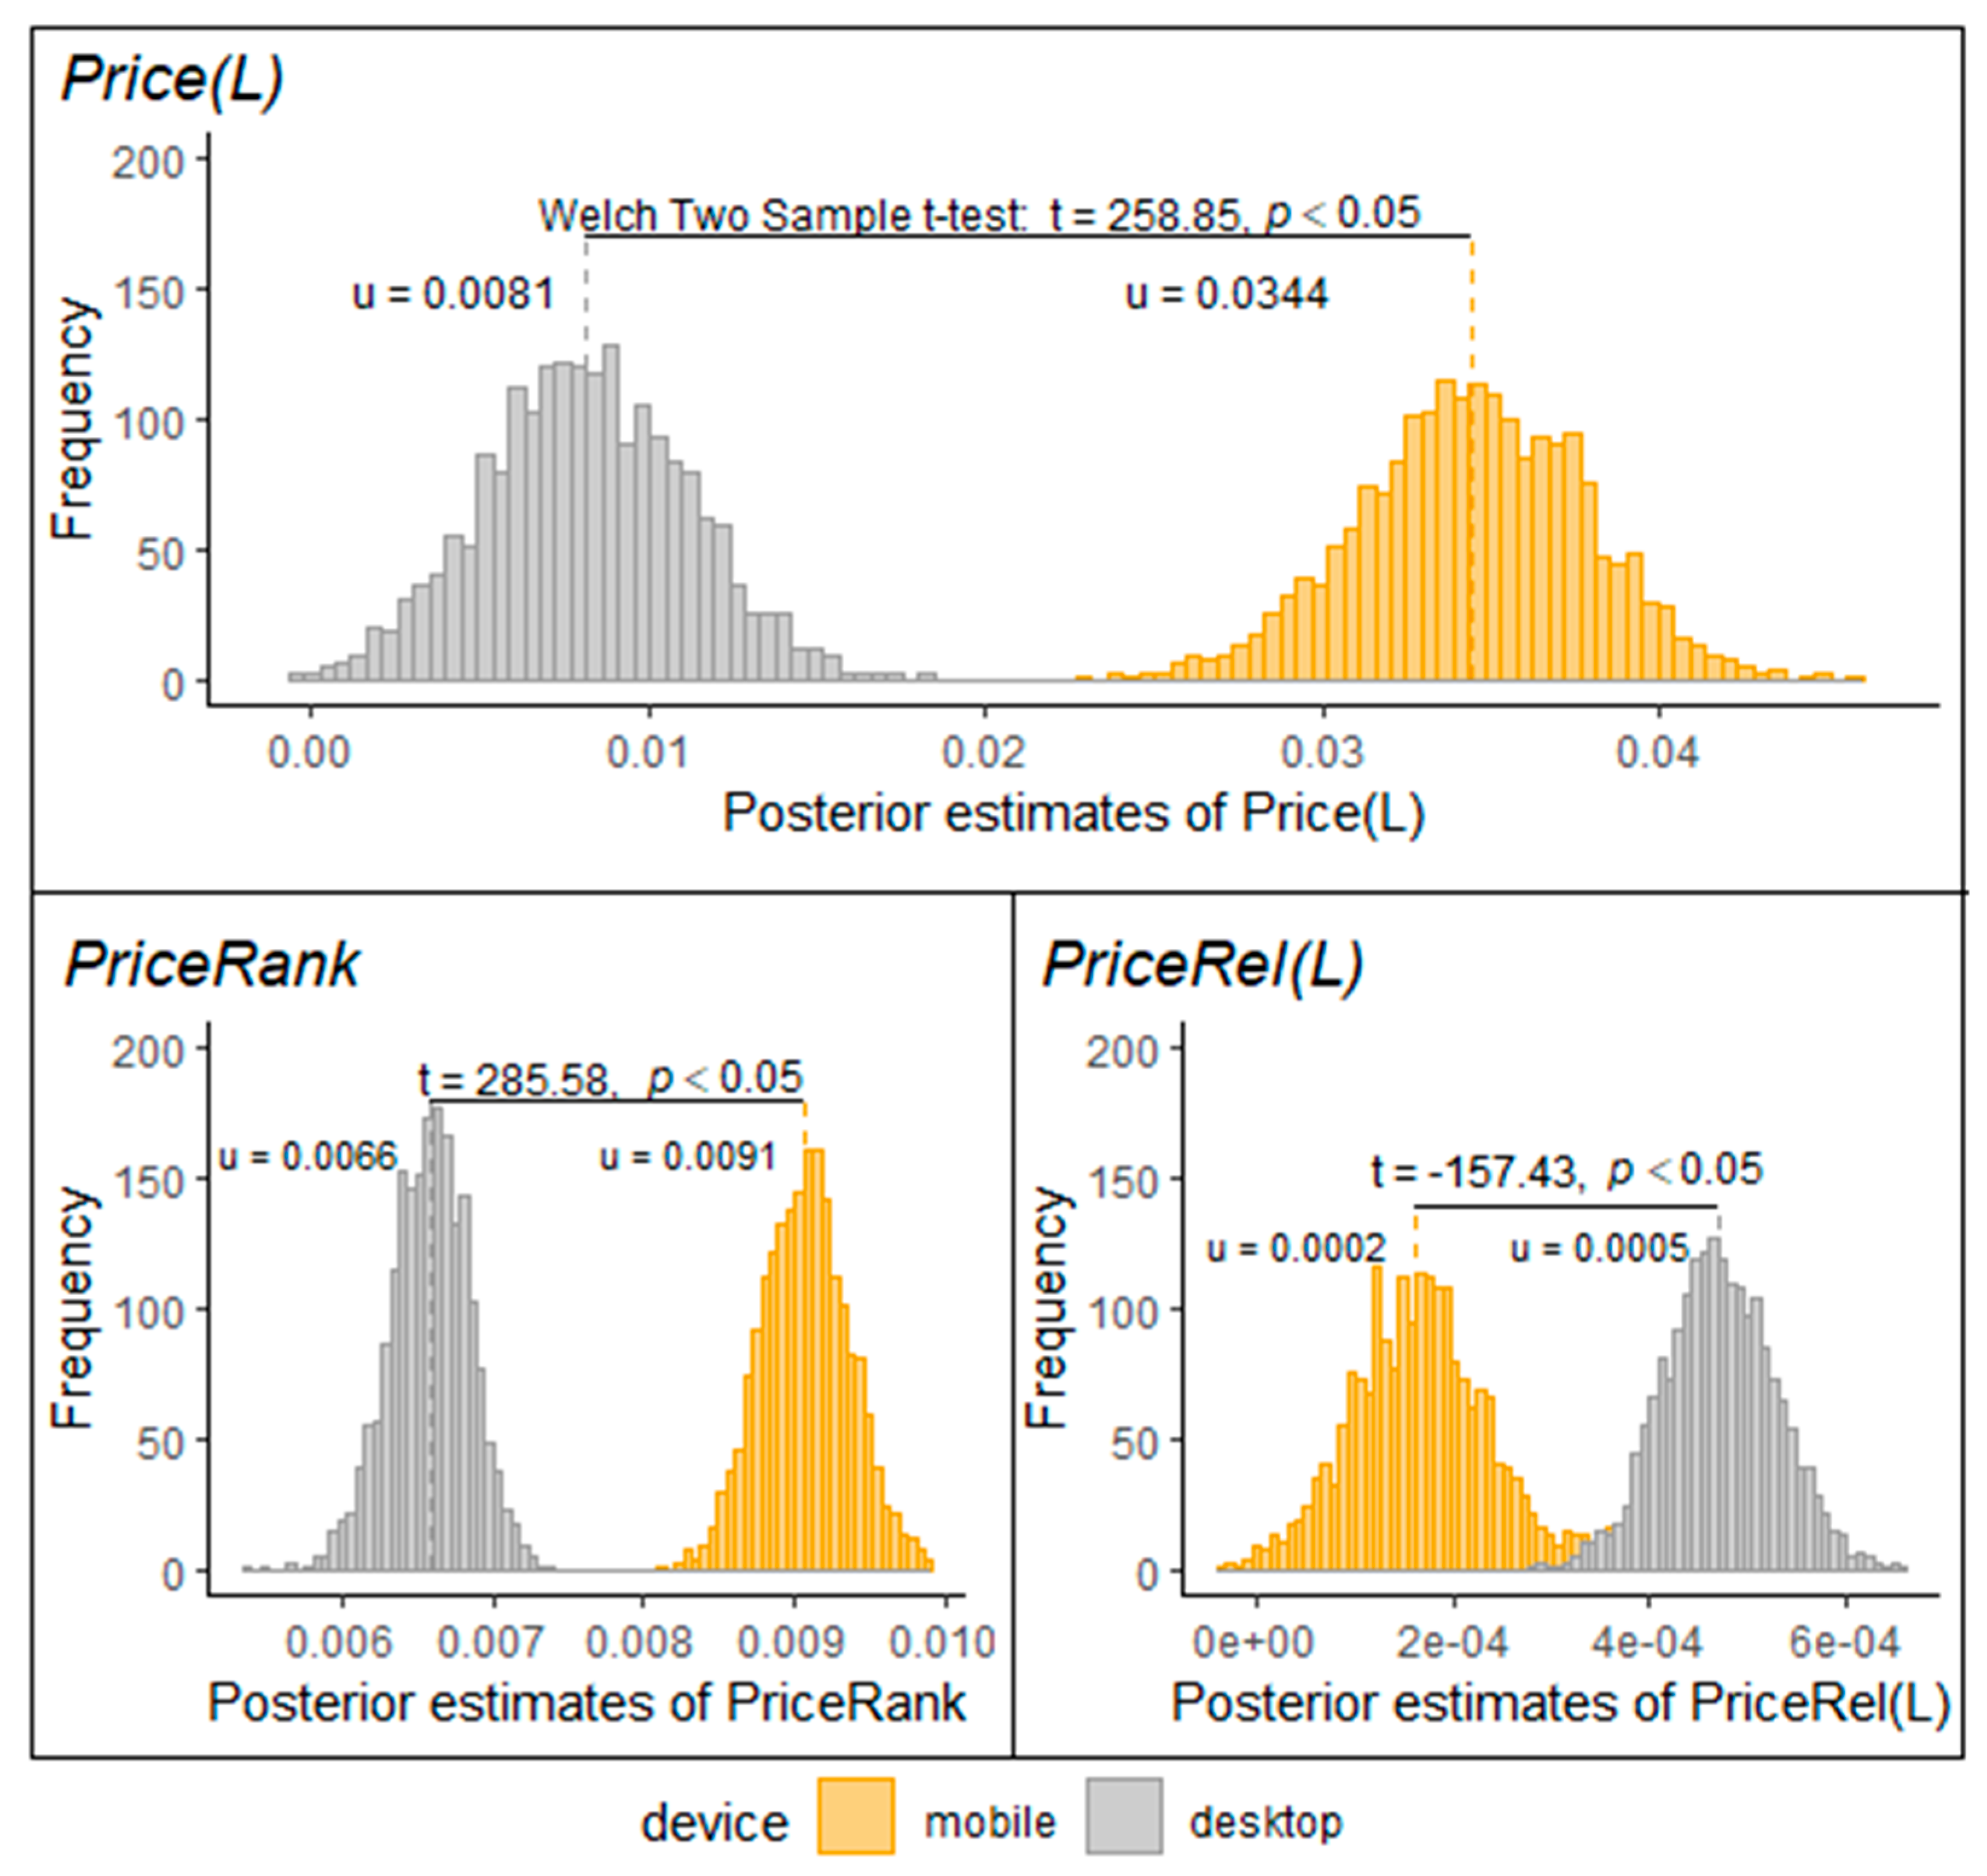
6.2. Heterogeneous Effects of Price

We analyzed the price effect by inspecting the detailed price-related posterior distribution as shown in Figure 8. The upper panel shows that Price has a positive sign in both a mobile OTA search and desktop OTA search, since zeros lie outside the 95% posterior Bayesian credible intervals. The PC-based finding is different from previous findings [15,23], which shows that price is negatively associated with consumer click behaviors in PC-based internet. Nevertheless, the impact on desktop CTDs is slight (i.e., 0.0081). On the contrary, the positive effect of the absolute price is statistically consistent and relatively greater for mobile users (i.e., 0.0344, t = 258.85, p < 0.05), after controlling the hotel property type Property, hotel class Class, overall guest rating Rating, and the regional platform located Platform. Owing to time constraints when users intend to book a hotel using mobile apps, users have to visit more to acquire more knowledge [3]. A higher price of an item tends to signal higher quality [42], which helps mobile users alleviate information asymmetry and quickly obtain knowledge. Hence, one possible explanation is that the higher the price of a hotel, the higher the quality signal mobile users are more likely to receive to click-through that hotel.
The effect of price perception is also statistically significant for users on both ends. The lower left panel of Figure 8 shows that mobile users are more likely to process chunking information to make CTDs rely on the ranking of hotel prices locally in the current SERP (PriceRank), as compared to PC users (0.0091 > 0.0066, t = 285.58, p < 0.05). Even though mobile users might prefer to click-through those hotels with higher absolute prices in whole mobile search sessions, they are also price-sensitive to locally seek the hotels with lower price rankings (i.e., lower prices among 25 items on SERP). When it comes to the perceived price fluctuation as shown in the lower right panel of Figure 8, PriceRel has a positive and significant effect in a mobile OTA search (0.0002) and desktop OTA search (0.0005). In other words, users choose to click-through a hotel whose price is higher than the average price of those hotels that recently interacted in the current session. This finding is in line with a previous study [24], which shows that consumers’ choices of buying digital cameras, another type of high-involvement product, can be predicted by consumers’ early searches. We further find that the effect of price fluctuations is smaller for mobile users than for PC users. It could be that the limited size of the mobile interface affects users’ perception of the prices of items they recently interacted with. Our results also indicate that the estimates for absolute price, price perception, and price fluctuation are 0.0344, 0.0091, and 0.002, respectively, suggesting a significant price heterogeneity affecting mobile CTDs. In comparison, the effect of absolute price (0.0081) and price perception (0.0066) is relatively smaller in desktop OTA searches. This highlights the difference between mobile OTA searches and desktop OTA searches, indicating the potential for more precise mobile search engine marketing.

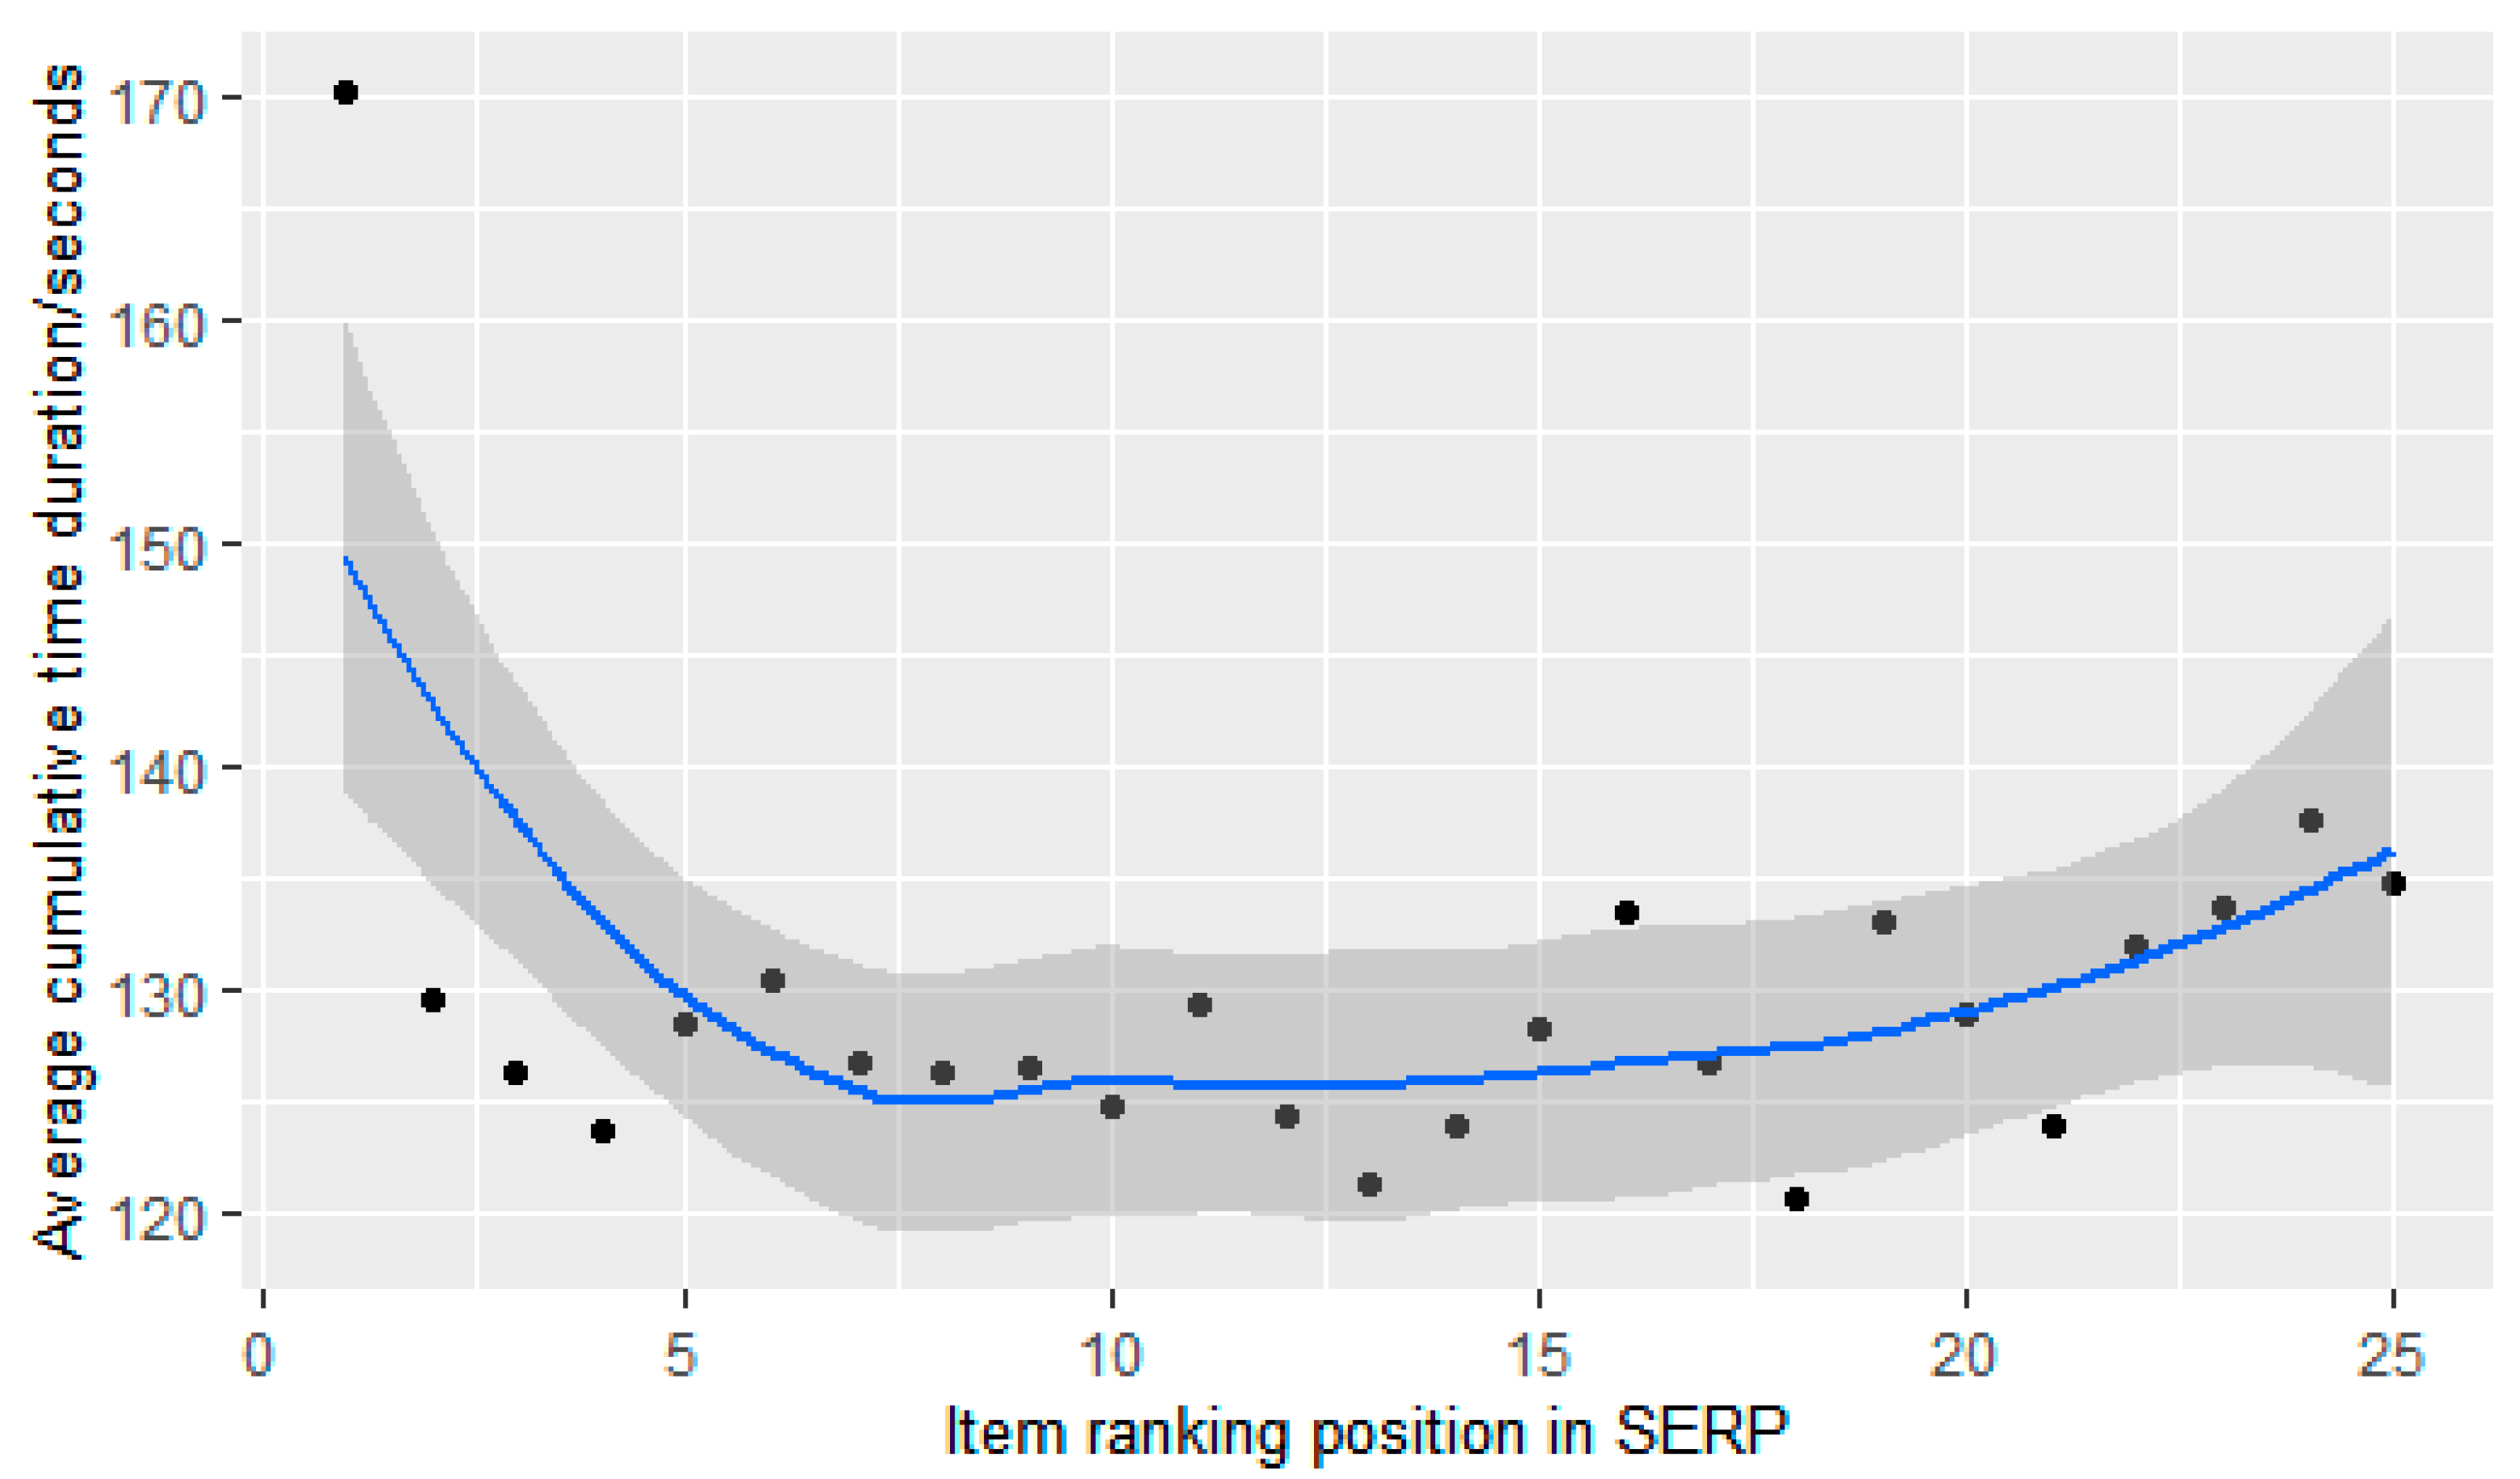
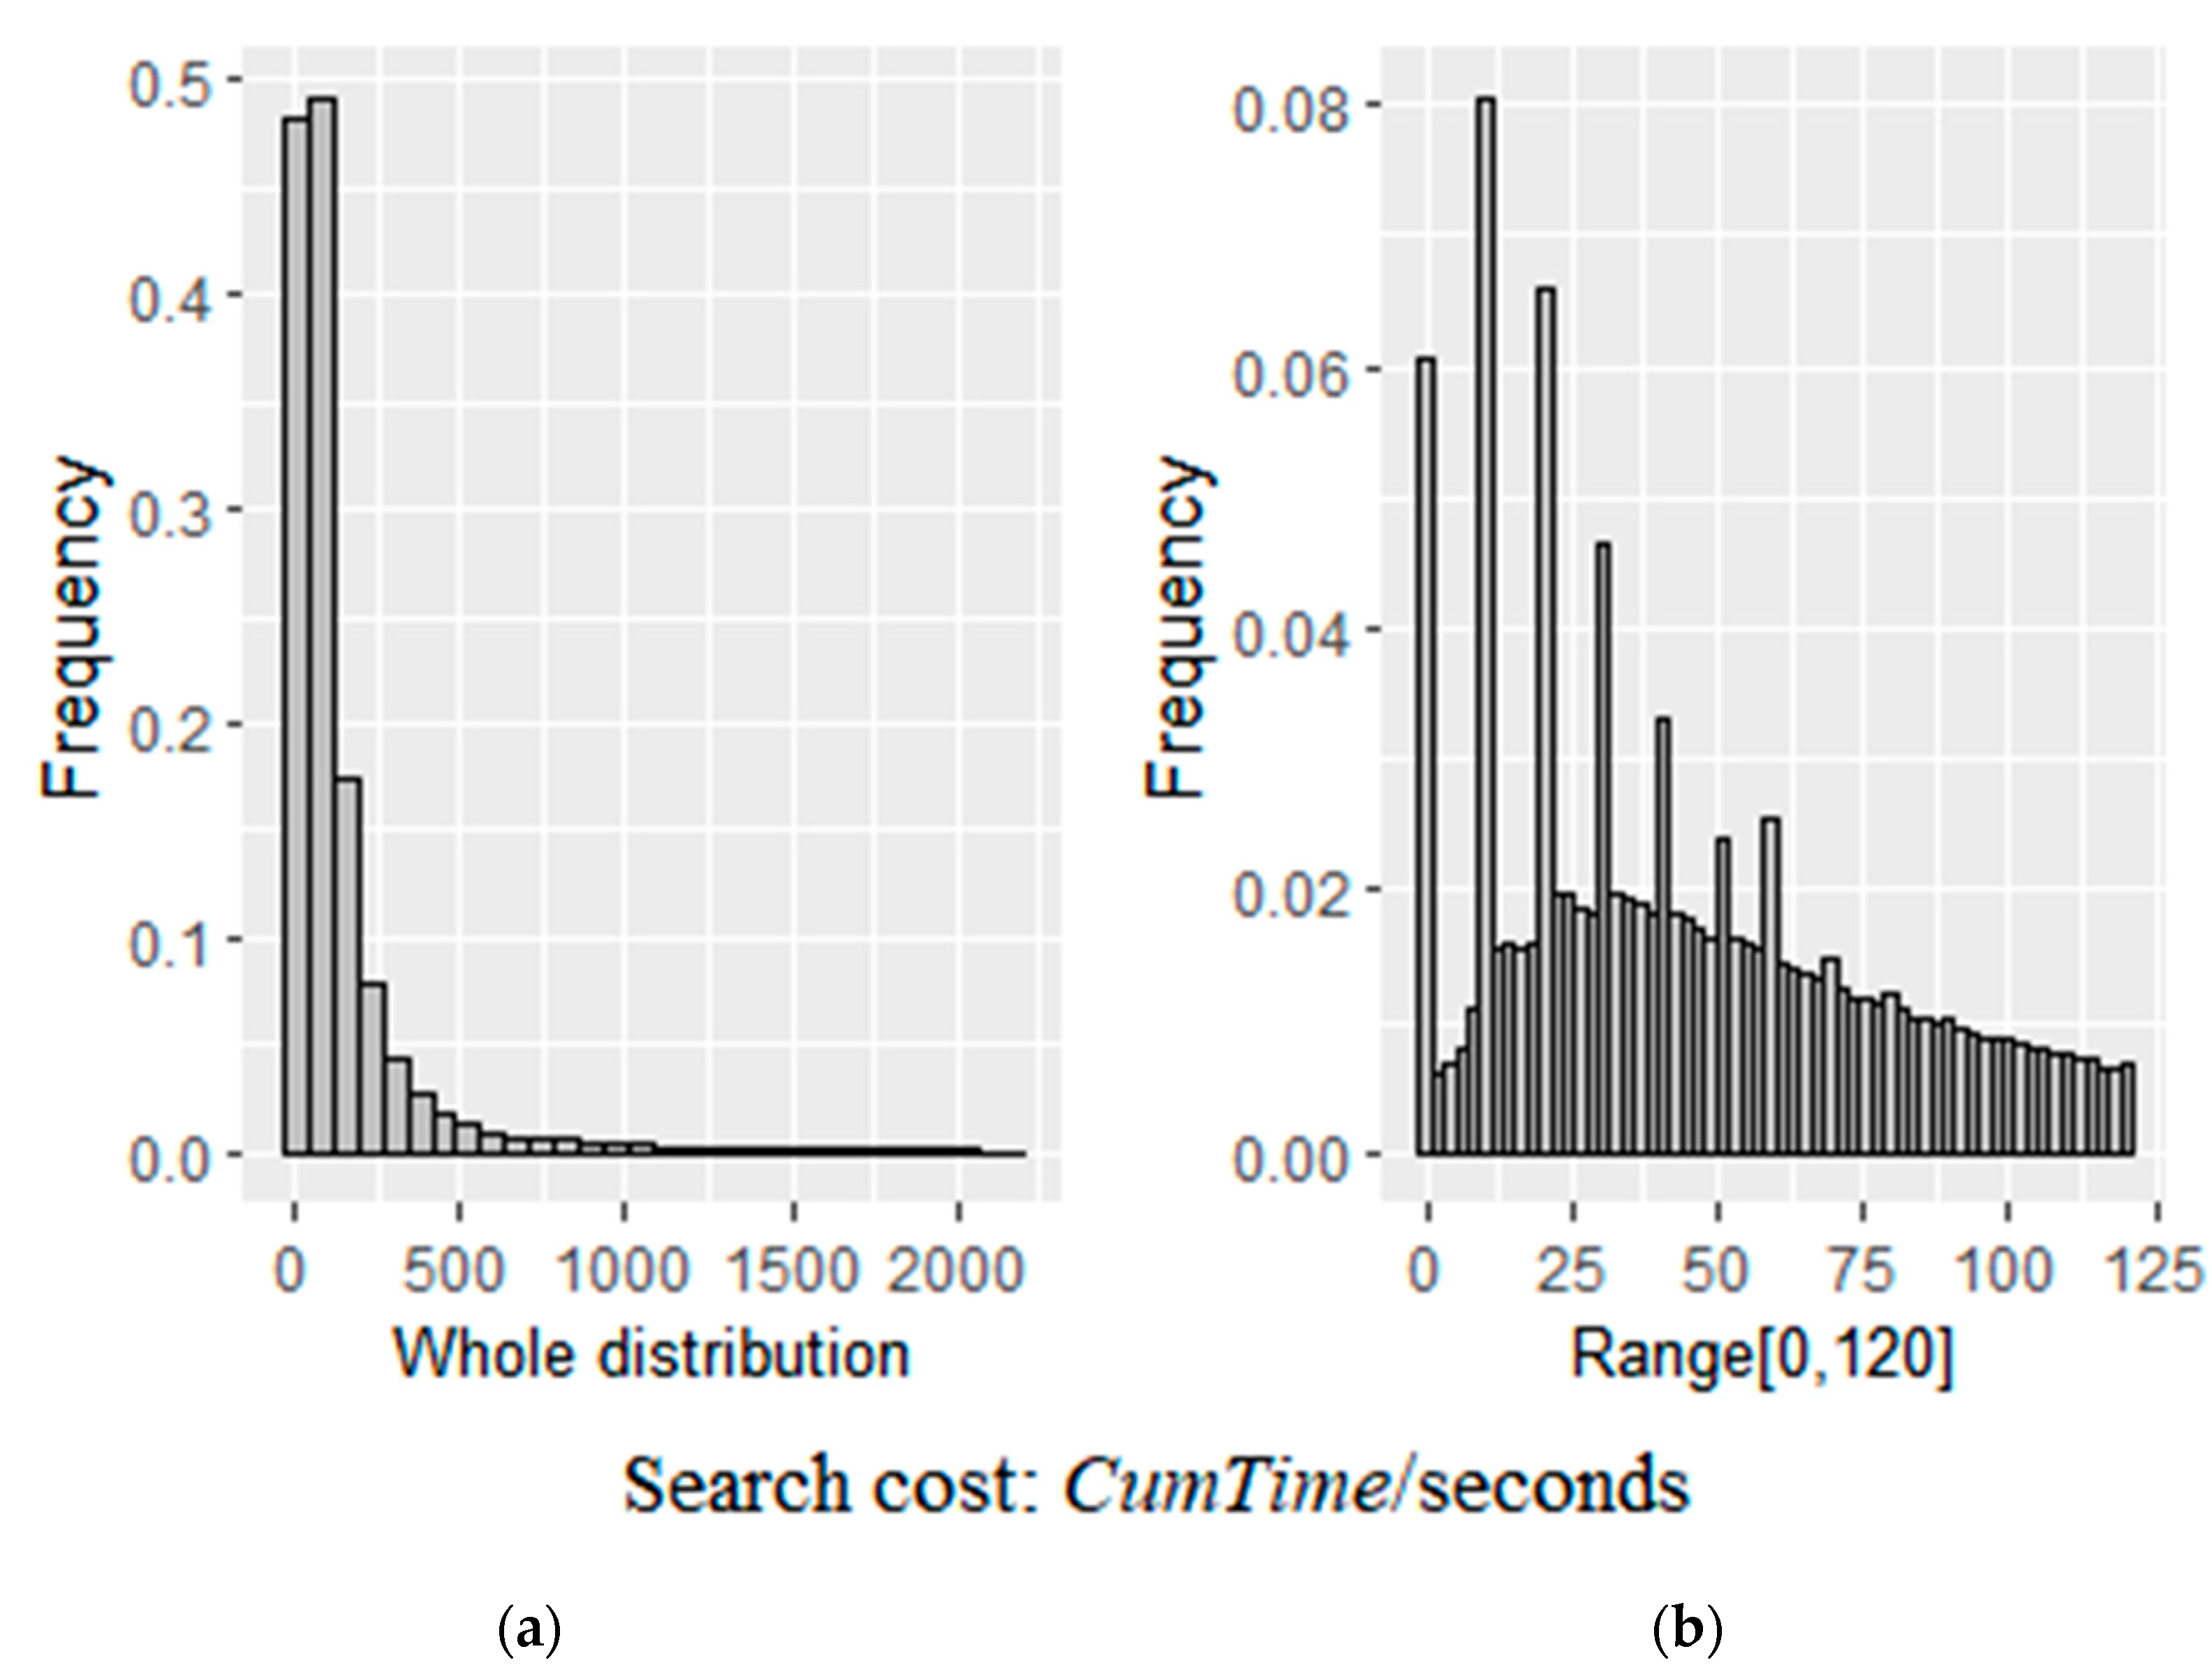
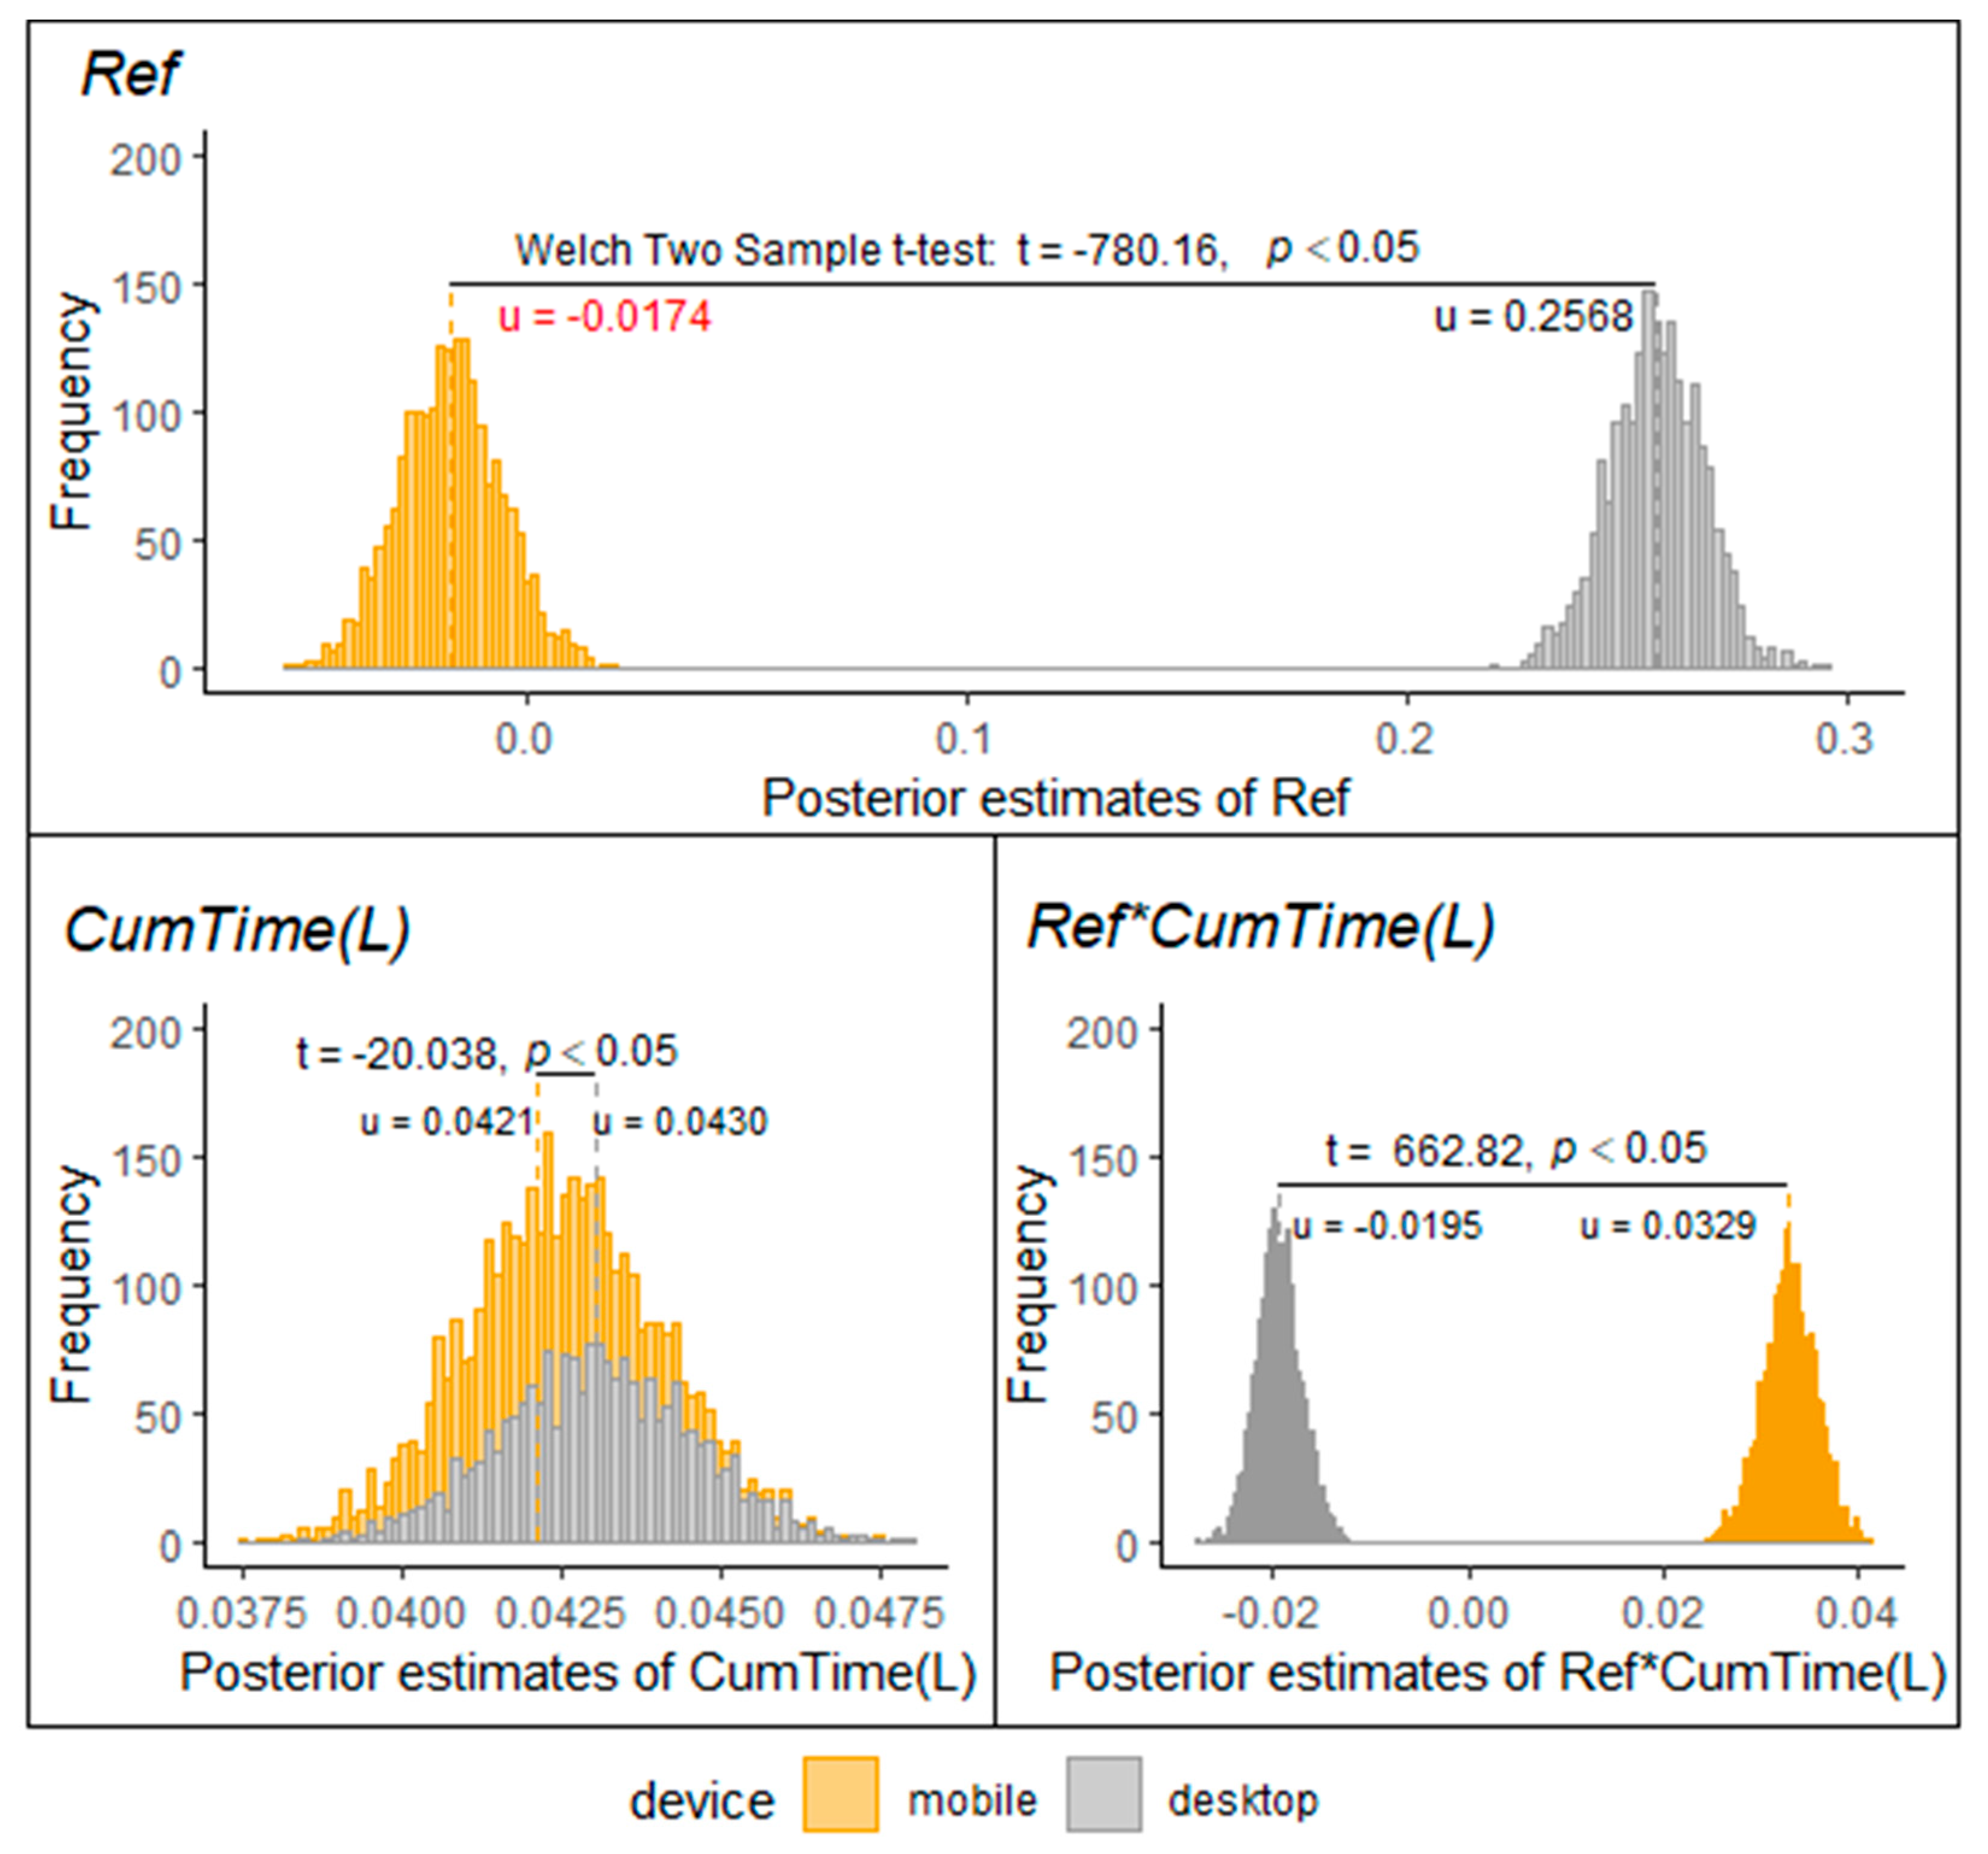
6.3. The Effects of Refinement Tool and Search Cost

Online users utilize refinement tools to specify their needs by rearranging items in the subsequent personalized search engine results page. Although the refinement tools aim to achieve a trade-off between users’ search cost and efficiency, our finding is consistent with the recent work [16,29] that the use of refinement tools Ref has no statistical influence on mobile CTDs after controlling Property, Class, Rating, and Platform (i.e., −0.0174, insignificant since 0 lies inside the 95% posterior Bayesian credible interval). On the other hand, Ref has a positive and significant sign in desktop OTA search (0.22568), showing that PC users who used refinement tools are more likely to click-through the items in the subsequent personalized SERP.
We also found that the effect of search cost, measured by the cumulative time duration at the item level (CumTime), is significantly associated with mobile CTDs (0.0421). Specifically, the more time users spend on a particular item, the higher their willingness to click out and book that hotel on a mobile device. These results suggest that the effect of item-specific search costs can aid mobile users in learning and shaping their perceptions to make more informed decisions. In the context of last-minute hotel booking via mobile search [9], users who are willing to invest more time and effort in an item may have a stronger intent to click through that hotel. Additionally, we found that this engagement effect is slightly stronger for PC users than mobile users (0.0430).
The lower right panel of Figure 9 illustrates that the interaction effect between the use of refinement tools (Ref) and cumulative time duration (CumTime) is significantly positive in a mobile OTA search (0.0329,) while the valence of that is opposite for a desktop OTA search (−0.0195). With the help of personalized SERPs, mobile users interact more with a focal item by examining its detailed information, reducing the problem of information overload. In particular, when using refinement tools, mobile users are more likely to click through items with longer access time durations. However, for PC users, a higher cumulative time duration of engagement with an item leads to a decrease in willingness to click through that item, which is conditional on personalized SERPs.

7. Discussion

7.1. Theoretical Implications and Contributions

Mobile commerce has drastically changed the way individuals plan and book their preferred hotels and handle other travel-related matters in the tourism industry [5,6,7]. The purpose of this study is to explore the factors that influence users’ click-through decision (CTD) when using mobile online travel agency (OTA) search engines. To achieve this objective, we present a dynamic Bayesian inference framework to model the CTDs of individual users while also examining the impact of item position, price, search cost, and the use of refinement tools. Our research employs real-world search log datasets gathered from a global OTA, encompassing both mobile and desktop searches. The experimental results reveal that compared with a desktop OTA search, a weakened primacy effect and a strengthened non-linear effect of item-ranking position are information quality signals to mobile users’ click-through decisions. This research contributes to the field of mobile commerce and Information Systems by providing a data-driven inference approach to the item-ranking position effect of high-involvement products (hotel booking) on mobile click-through decisions and closing the research gap concerning the ranking position effect between mobile OTA search and desktop OTA search [15,16,17,18].
By untangling the sources of price effects underlying the different dimensions, we inform that the price of a hotel is an effective positive signal in mobile travel search engines, which is different from the price effect in the PC-Internet search [15,23]. By assessing how the price perception and price fluctuation affect mobile CTDs, the significant empirical findings indicate that mobile users tend to be price-sensitive to locally seek hotels with lower price rankings (i.e., lower prices among 25 items on SERP). They are also more likely to click-through a hotel whose price is higher than the average price of those hotels that recently interacted in the current session. This finding is in line with a previous study [24], which shows that consumers’ choices of buying digital cameras, another type of high-involvement product, can be predicted by consumers’ early searches. There is the possibility that the mobile consumers’ previous searches can predict the price of a hotel that mobile consumers are willing to pay. Theoretically, these findings contribute to the understanding of price effect in consumer search by highlighting the price heterogeneity.
This study contributes to the literature on the use of refinement tools and search cost in consumer search [16,29]. Our findings show that refinement tools may not always be beneficial for mobile OTA search. In addition, we measure search cost by the amount of time a mobile user spends searching for a specific item within a session, following recent research in the field [28,39]. That is, the search cost is constructed in the form of human–computer interaction following an ongoing/sequential decision-making paradigm [5,27]. Our study supports the hypothesis that item-specific search costs can help mobile users learn and shape their perceptions toward items to make their CTDs. Our theory on the role of refinement and search cost may help provide more detailed explanations for the impact of human–computer interaction on the performance of mobile travel search engine marketing.

7.2. Practical Implications

This study provides several important insights for hotel advertisers and OTAs to tactically obtain revenue from mobile travel search engine marketing and optimization.
For hotel advertisers, our findings reveal how they can balance investment in bidding rank in mobile search engines with a return on investment through three investment strategies. Our research shows that there is a primacy effect, where the top-1 ranking position is dominant in both mobile-end and PC-based OTA search engines. Additionally, the primacy effect is weaker in a mobile OTA search as compared to a desktop OTA search. This suggests that hotel advertisers should increase their investment in the top-1 ranking position. They can also implement differentiated investment strategies, where the amount they are willing to pay per click-through on their ads in the mobile-end top-1 ranking position may not necessarily be higher than that on a desktop. Additionally, the strengthened non-linear effect in a mobile OTA search suggests that the bottom results of the search engine results page (SERP) can attract more attention than the middle for mobile users, suggesting hotel advertisers to invest their ads in some bottom-ranking positions on SERP for mobile search engine marketing.
From a practical perspective of mobile search engine optimization, our study suggests that OTAs can take advantage of mobile users’ price sensitivity by making adjustments to their ranking mechanisms. Our research indicates that mobile users are more likely to seek out hotels with lower price rankings among the 25 items on the SERP. This is a specific characteristic of price, so it is easy to take advantage of the positive effect of price rankings. For example, when a mobile user restarts the search process because the previous SERP does not meet their needs, OTAs should provide some lower-priced items in the earlier results compared to the rest of the current SERP. Additionally, our study found that mobile users are more likely to click-through on a hotel whose price is higher than the average price of those hotels that they recently interacted with in the current session. This suggests that mobile users’ previous search may predict the price they are willing to pay for a hotel. OTAs can take advantage of this by providing personalized recommendations for hotels at specific prices based on the early search of mobile users, thus optimizing the mobile search engine.
Last, the study suggests that online travel agencies (OTAs) can use search cost and user engagement data to improve their recommendation strategies on mobile search engines. By analyzing the amount of time spent on individual search results, the proposed Bayesian inference model can be used to identify hotels that are preferred by individual mobile users. In other words, OTAs can personalized recommend those items with relatively higher search costs on subsequent SERPs for individual users. The study also found that the use of refinement tools can positively impact the effectiveness of this strategy, as mobile users are more likely to click on those items they have spent more time searching for. Overall, these human–computer interaction-based recommendations are expected to improve the mobile user’s experience and satisfaction.

8. Conclusions

In this study, we proposed a dynamic Bayesian inference model to understand individual mobile users’ click-through decisions (CTDs) by considering uncertainty. We examined the roles of item-ranking position, price preference, refinement tools, and engaging search cost using individual-user-centric and item-specific web log data in a real-world online travel agency (OTA). We conducted experiments and tested robustness, and we further discerned the specific difference of effects in a mobile OTA search and a desktop OTA search. The results yield several key findings. Firstly, in a mobile OTA search, the primacy effect is weaker and the impact of item-ranking positions is non-linear in comparison to a desktop OTA search. Mobile users exhibit a stronger preference for top-ranking results and are less likely to click on middle or bottom results. Secondly, hotel prices have a positive effect on mobile CTDs throughout the mobile consumer search. Furthermore, mobile users tend to click-through hotels with lower price rankings on the current search engine result page. Lastly, search cost has a positive impact on mobile CTDs, with the use of refinement tools enhancing the effect of search cost. This study expands upon prior studies which focused on the position and price effects in online consumer searches using PC-based internet, and it applies these findings to mobile commerce and mobile Information Systems (IS). Additionally, this study provides practical implications for mobile OTA search engine marketing and bidding ranking position investment.
There are several limitations to this study that can serve as inspiration for future research. Firstly, we looked at the effect of refinement tools but did not specify which specific functions the user performed. Second, we recognize that the current paper has limitations in its emphasis on user intention, specifically click-through decisions, instead of actual and intuitive booking conversions. This highlights the need for researchers to investigate further the effects of item position, price rankings, and refinement tools on the actual mobile users’ conversion or hotel sales. Consequently, our next focus is to conduct a user study and behavioral experiment using a simulated mobile OTA search engine. In addition, the competition between an OTA and other hotel booking channels should be taken into consideration, since online users may use OTAs as a comparison tool for different hotels. Last, we cannot track if a consumer leaves a session and returns later to continue their search and make a decision in the next session due to the lack of data. This issue has also been encountered in previous works [15,43]. However, the data within a session can still reflect the interests and needs of consumers to some extent [28,39]. Therefore, in our study, we treat these searches as two separate results. Future research could focus on identifying repeated searchers and estimating the likelihood of CTDs more accurately.

Author Contributions

Conceptualization, H.G. and M.Z.; methodology, H.G.; software, H.G.; validation, H.G. and M.Z.; formal analysis, H.G.; writing—original draft, H.G.; writing—review and editing, H.G. and M.Z.; funding acquisition, H.G. and M.Z.; All authors have read and agreed to the published version of the manuscript.

Funding

This research was funded by Young Innovative Talents Research Project of Department of Education of Guangdong Province (2022WQNCX054) and Young Innovative Talents Research Project of Department of Education of Guangdong Province (2022WQNCX062).

Institutional Review Board Statement

Not applicable.

Informed Consent Statement

Not applicable.

Data Availability Statement

All data analyzed during this study are included in this article. The raw data are available from the corresponding author upon reasonable request.

Conflicts of Interest

The authors declare no conflict of interest.

Appendix A

The hotel price preference of mobile users from different country/region platforms is listed in Table A1.
Table A1. The 55 regions where mobile users accessed the OTA platform and their hotel price preference.
NoPlatformCountry/RegionBusiness RegionAverage Price of
Click-Through Hotels
1VNVietnamAsia–Pacific42.95062
2IDIndonesiaAsia–Pacific43.53182
3INIndiaAsia–Pacific44.22440
4ECEcuadorLatin America46.29386
5MYMalaysiaAsia–Pacific46.71386
6THThailandAsia–Pacific49.06277
7TRTurkeyEurope, the Middle East and Africa50.28357
8PHPhilippinesAsia–Pacific54.87692
9RURussian FederationEurope, the Middle East and Africa55.21053
10RSSerbiaEurope, the Middle East and Africa58.95872
11PEPeruLatin America59.33535
12BGBulgariaEurope, the Middle East and Africa59.45550
13PLPolandEurope, the Middle East and Africa64.24440
14UYUruguayLatin America64.86505
15RORomaniaEurope, the Middle East and Africa65.33056
16COColombiaLatin America68.56688
17BRBrazilLatin America69.51245
18ARArgentinaLatin America72.54673
19HRCroatiaEurope, the Middle East and Africa72.79259
20GRGreeceEurope, the Middle East and Africa73.81250
21CLChileLatin America74.49524
22CZCzechiaEurope, the Middle East and Africa76.48084
23MXMexicoLatin America80.56070
24AAArubaLatin America81.55505
25TWTaiwanAsia–Pacific81.91995
26ZASouth AfricaEurope, the Middle East and Africa82.35231
27PTPortugalEurope, the Middle East and Africa83.98903
28HUHungaryEurope, the Middle East and Africa84.53585
29ESSpainEurope, the Middle East and Africa87.16726
30SKSlovakiaEurope, the Middle East and Africa88.23723
31SGSingaporeAsia–Pacific91.22791
32AEUnited Arab EmiratesEurope, the Middle East and Africa93.04986
33ITItalyEurope, the Middle East and Africa97.12066
34FRFranceEurope, the Middle East and Africa98.10925
35HKHong KongAsia–Pacific101.0511
36SISloveniaEurope, the Middle East and Africa102.4384
37NLNetherlandsEurope, the Middle East and Africa103.2852
38CNChinaAsia–Pacific103.7143
39CACanadaNorth America104.3289
40DEGermanyEurope, the Middle East and Africa107.2170
41KRKoreaAsia–Pacific108.1697
42BEBelgiumEurope, the Middle East and Africa109.5798
43DKDenmarkEurope, the Middle East and Africa112.9501
44USUnited States of AmericaNorth America112.9790
45FIFinlandEurope, the Middle East and Africa113.6804
46JPJapanAsia–Pacific114.2183
47UKUnited KingdomEurope, the Middle East and Africa115.7131
48NZNew ZealandAsia–Pacific115.8696
49IEIrelandEurope, the Middle East and Africa117.6781
50ATAustriaEurope, the Middle East and Africa122.4000
51SESwedenEurope, the Middle East and Africa122.9304
52AUAustraliaAsia–Pacific123.8404
53CHSwitzerlandEurope, the Middle East and Africa130.8132
54NONorwayEurope, the Middle East and Africa132.2779
55ILIsraelEurope, the Middle East and Africa139.9843

References

  1. Ghose, A.; Ipeirotis, P.G.; Li, B. Designing ranking systems for hotels on travel search engines by mining user-generated and crowdsourced content. Mark. Sci. 2012, 31, 493–520. [Google Scholar] [CrossRef] [Green Version]
  2. Pop, R.-A.; Săplăcan, Z.; Dabija, D.-C.; Alt, M.-A. The impact of social media influencers on travel decisions: The role of trust in consumer decision journey. Curr. Issues Tour. 2022, 25, 823–843. [Google Scholar] [CrossRef]
  3. Pan, B. The power of search engine ranking for tourist destinations. Tour. Manag. 2015, 47, 79–87. [Google Scholar] [CrossRef]
  4. Xiang, Z.; Wöber, K.; Fesenmaier, D.R. Representation of the online tourism domain in search engines. J. Travel Res. 2008, 47, 137–150. [Google Scholar] [CrossRef]
  5. Lamsfus, C.; Wang, D.; Alzua-Sorzabal, A.; Xiang, Z. Going mobile: Defining context for on-the-go travelers. J. Travel Res. 2015, 54, 691–701. [Google Scholar] [CrossRef]
  6. Liang, S.; Schuckert, M.; Law, R.; Masiero, L. The relevance of mobile tourism and information technology: An analysis of recent trends and future research directions. J. Travel Tour. Mark. 2017, 34, 732–748. [Google Scholar] [CrossRef]
  7. Rondović, B.; Djuričković, T.; Kašćelan, L. Drivers of E-Business Diffusion in Tourism: A Decision Tree Approach. J. Theor. Appl. Electron. Commer. Res. 2019, 14, 30–50. [Google Scholar] [CrossRef] [Green Version]
  8. StratosJets. Over 60 Online Travel Booking Statistics. 2022. Available online: https://www.stratosjets.com/blog/online-travel-statistics/ (accessed on 16 August 2022).
  9. Criteo. Summer Travel Report. 2018. Available online: https://www.criteo.com/wp-content/uploads/2018/06/Criteo-Summer-Travel-2018.pdf (accessed on 6 June 2019).
  10. Jacoby, J. Perspectives on information overload. J. Consum. Res. 1984, 10, 432–435. [Google Scholar] [CrossRef]
  11. Pan, B.; Hembrooke, H.; Joachims, T.; Lorigo, L.; Gay, G.; Granka, L. In Google we trust: Users’ decisions on rank, position, and relevance. J. Comput.-Mediat. Commun. 2007, 12, 801–823. [Google Scholar] [CrossRef]
  12. Rutz, O.J.; Trusov, M. Zooming In on Paid Search Ads—A Consumer-Level Model Calibrated on Aggregated Data. Mark. Sci. 2011, 30, 789–800. [Google Scholar] [CrossRef] [Green Version]
  13. Agarwal, A.; Hosanagar, K.; Smith, M.D. Location, location, location: An analysis of profitability of position in online advertising markets. J. Mark. Res. 2011, 48, 1057–1073. [Google Scholar] [CrossRef] [Green Version]
  14. Law, R.; Huang, T. How do travelers find their travel and hotel websites? Asia Pac. J. Tour. Res. 2006, 11, 239–246. [Google Scholar] [CrossRef]
  15. Ghose, A.; Ipeirotis, P.G.; Li, B. Examining the impact of ranking on consumer behavior and search engine revenue. Manag. Sci. 2014, 60, 1632–1654. [Google Scholar] [CrossRef] [Green Version]
  16. Chen, Y.; Yao, S. Sequential search with refinement: Model and application with click-stream data. Manag. Sci. 2017, 63, 4345–4365. [Google Scholar] [CrossRef] [Green Version]
  17. Ert, E.; Fleischer, A. Mere position effect in booking hotels online. J. Travel Res. 2016, 55, 311–321. [Google Scholar] [CrossRef]
  18. Van der Rest, J.-P.I.; Cordella, P.; Loosschilder, G.; Schwartz, Z. Connecting search marketing to hotel revenue management: Conjoint analysis as a methodology to evaluate the optimal online travel agency commission fee. Serv. Sci. 2016, 8, 169–183. [Google Scholar] [CrossRef]
  19. Maniar, N.; Bennett, E.; Hand, S.; Allan, G. The effect of mobile screen size on video-based learning. J. Softw. 2008, 3, 51–61. [Google Scholar] [CrossRef] [Green Version]
  20. Chae, M.; Kim, J. Do size and structure matter to mobile users? An empirical study of the effects of screen size, information structure, and task complexity on user activities with standard web phones. Behav. Inf. Technol. 2004, 23, 165–181. [Google Scholar] [CrossRef]
  21. Ghose, A.; Goldfarb, A.; Han, S.P. How is the mobile Internet different? Search costs and local activities. Inf. Syst. Res. 2013, 24, 613–631. [Google Scholar] [CrossRef] [Green Version]
  22. Sim, J.J.; Loh, S.H.; Wong, K.L.; Choong, C.K. Do we need trust transfer mechanisms? An M-commerce adoption perspective. J. Theor. Appl. Electron. Commer. Res. 2021, 16, 2241–2262. [Google Scholar] [CrossRef]
  23. Baye, M.R.; Gatti, J.R.J.; Kattuman, P.; Morgan, J. Clicks, discontinuities, and firm demand online. J. Econ. Manag. Strategy 2009, 18, 935–975. [Google Scholar] [CrossRef] [Green Version]
  24. Bronnenberg, B.J.; Kim, J.B.; Mela, C.F. Zooming In on Choice: How Do Consumers Search for Cameras Online? Mark. Sci. 2016, 35, 693–712. [Google Scholar] [CrossRef] [Green Version]
  25. Gao, H.; Ou, C.; Liu, H. Modeling shopping cart decisions with heterogeneous product involvement and reviews. In Proceedings of the 23rd Pacific Asia Conference on Information Systems, Xi’an, China, 8–12 July 2019. [Google Scholar]
  26. Zhan, M.; Gao, H.; Liu, H.; Peng, Y.; Lu, D.; Zhu, H. Identifying market structure to monitor product competition using a consumer-behavior-based intelligence model. Asia Pac. J. Mark. Logist. 2020, 33, 99–123. [Google Scholar] [CrossRef]
  27. Hwang, Y.-H. A theory of unplanned travel decisions: Implications for modeling on-the-go travelers. Inf. Technol. Tour. 2010, 12, 283–296. [Google Scholar] [CrossRef]
  28. Ursu, R.M.; Wang, Q.; Chintagunta, P.K. Search duration. Mark. Sci. 2020, 39, 849–871. [Google Scholar] [CrossRef]
  29. Liu, H.; Zhan, M.; Gao, H.; Zhu, H.; He, R. Research on assistant decision-makings of E-commerce platform with refinement tools. J. Control Decis. 2020, 8, 303–313. [Google Scholar] [CrossRef]
  30. Albert, J.H.; Chib, S. Bayesian analysis of binary and polychotomous response data. J. Am. Stat. Assoc. 1993, 88, 669–679. [Google Scholar] [CrossRef]
  31. Allenby, G.M.; Rossi, P.E. Marketing models of consumer heterogeneity. J. Econom. 1998, 89, 57–78. [Google Scholar] [CrossRef]
  32. Chau, M.; Chen, H. A machine learning approach to web page filtering using content and structure analysis. Decis. Support Syst. 2008, 44, 482–494. [Google Scholar] [CrossRef]
  33. Vila, T.D.; González, E.A.; Vila, N.A.; Brea, J.A.F. Indicators of Website Features in the User Experience of E-Tourism Search and Metasearch Engines. J. Theor. Appl. Electron. Commer. Res. 2021, 16, 18–36. [Google Scholar] [CrossRef]
  34. Evans, M.P. Analysing Google rankings through search engine optimization data. Internet Res. 2007, 17, 21–37. [Google Scholar] [CrossRef] [Green Version]
  35. Pop, R.-A.; Hlédik, E.; Dabija, D.-C. Predicting consumers’ purchase intention through fast fashion mobile apps: The mediating role of attitude and the moderating role of COVID-19. Technol. Forecast. Soc. Chang. 2023, 186, 122111. [Google Scholar] [CrossRef]
  36. Jiang, P. A model of price search behavior in electronic marketplace. Internet Res. 2002, 12, 181–190. [Google Scholar] [CrossRef]
  37. Seiler, S.; Pinna, F. Estimating search benefits from path-tracking data: Measurement and determinants. Mark. Sci. 2017, 36, 565–589. [Google Scholar] [CrossRef] [Green Version]
  38. Bronnenberg, B.J.; Dubé, J.-P.H.; Gentzkow, M. The evolution of brand preferences: Evidence from consumer migration. Am. Econ. Rev. 2012, 102, 2472–2508. [Google Scholar] [CrossRef]
  39. Gao, H.; Liu, H.; Lin, W.; Chen, C. Graph-theoretic approach to detecting real-time intents within purchase conversion funnel using clickstream data. Kybernetes, 2022; ahead-of-print. [Google Scholar] [CrossRef]
  40. Bonilla-Quijada, M.; Tugores-Ques, J.; Olmo Arriaga, J.L. Promotion of urban tourism: Insights into user engagement on social media. Inf. Technol. Tour. 2021, 23, 611–632. [Google Scholar] [CrossRef]
  41. Rossi, P.E.; Allenby, G.M. Bayesian statistics and marketing. Mark. Sci. 2003, 22, 304–328. [Google Scholar] [CrossRef] [Green Version]
  42. Stiving, M. Price-endings when prices signal quality. Manag. Sci. 2000, 46, 1617–1629. [Google Scholar] [CrossRef]
  43. Ghose, A.; Ipeirotis, P.G.; Li, B. Modeling consumer footprints on search engines: An interplay with social media. Manag. Sci. 2019, 65, 1363–1385. [Google Scholar] [CrossRef] [Green Version]
Figure 1. An illustration of the interface of a common OTA search engine.
Jtaer 18 00032 g001
Figure 2. The graphic model for our proposed Bayesian inference framework. Notes: π(β) for the normal prior; Siht for the user search activities; C for the control variable part, βi for the posterior distribution of the parameters of user search activities Siht on latent utility Uiht; yiht denotes click-through decision.
Jtaer 18 00032 g002
Figure 3. The aggregated relationship between ranking positions and average cumulative time duration.
Jtaer 18 00032 g003
Figure 4. The relationship between Platform/region and their average price of click-through hotels.
Jtaer 18 00032 g004
Figure 5. The distribution of mobile user action type.
Jtaer 18 00032 g005
Figure 6. The properties of mobile users’ search cost: CumTime/seconds: (a) Whole distribution of CumTime/seconds; (b) Range [0, 120] of CumTime/seconds.
Jtaer 18 00032 g006
Figure 7. Posterior distribution of estimates for item−ranking position: (upper) coefficient estimates for Pos; (lower left) coefficient estimates for Top; (lower right) coefficient estimates for Pos2.
Jtaer 18 00032 g007
Figure 8. Posterior distribution of estimates for price effect: (upper) coefficient estimates for Price(L); (lower left) coefficient estimates for PriceRank; (lower right) coefficient estimates for PriceRel(L).
Jtaer 18 00032 g008
Figure 9. Posterior distribution of estimates for refinement tools and search cost: (upper) coefficient estimates for refinement tool Ref; (lower left) coefficient estimates for search cost CumTime(L); (lower right) coefficient estimates for the interaction Ref × CumTime(L).
Jtaer 18 00032 g009
Table 1. Definition and statistical description of variables.
ConstructVariableItem-Level DefinitionMeanSDMinMax
Sequential search activities Siht that user i interacts hotel h at time t
Ranking
Position
PosihtRanking position of item h on a SERP at t7.736.75125
TopihtIf item h is top-1 position on a SERP at t0.200.4001
Price
preference
PriceihtPrice of per room of per night87.8669.8811482
PriceRelihtPrice perception: the price of item h at t minus, the average price of items interacted up to time t−0.3228.36−379405.08
PriceRankihtPrice ranking of item h on a SERP at t14.807.25125
Refinement toolRefihtWhether item h stems from refinement-tool sorting or default sorting at t=1 for refinement-tool sorting (50.6% observations),
=0 for default sorting (49.4%)
Search costCumTimeiht
/seconds
Cumulative time duration towards item h up to t within a session135.60237.3502175
Static hotel-level and user-level variables
Control
variables
PropertyProperty type of items=1 for hotel (74,675, 85.1%),
=0 for house/apartment (13,070, 14.9%)
ClassDummies for hotel class of items: five-star rating classes and one without star rating denoted by nullNull (26,577, 30.3%),
1 Star (1077, 1.2%),
2 Star (14,444, 16.5%),
3 Star (25,973, 29.6%),
4 Star (15,803, 18.0%),
5 Star (3871, 4.4%)
RatingDummies for overall guest ratingNull (14,318, 16.3%),
Satisfactory (31,411, 35.8%),
Good (21,980, 25.0%),
Very good (11,723, 13.4%),
Excellent (8313, 9.5%)
PlatformDummies for regions where users accessed the OTA platform (55 regions) 1
1 The detailed information about each region is listed in Table A1.
Table 2. Results of mobile OTA search (602,683 observations of 53,824 users and 53,845 sessions).
Estimate for Click-Through Decision
VariableModel 1Model 2Model 3Model 4
Intercept−1.2536 ***
(0.0141)
−1.1784 ***
(0.0147)
−1.1478 ***
(0.0153)
−0.7957 ***
(0.0603)
Ranking position
Pos−0.0049 ***
(0.0001)
−0.0152 ***
(0.0011)
−0.0152 ***
(0.0012)
−0.0153 ***
(0.0012)
Top0.1092 ***
(0.0050)
0.0501 ***
(0.0060)
0.0488 ***
(0.0059)
0.0531 ***
(0.006)
Pos2NA0.0008 ***
(0.0001)
0.0008 ***
(0.0001)
0.0008 ***
(0.0001)
Price
Price(L)0.0508 ***
(0.0026)
0.0512 ***
(0.0026)
0.0510 ***
(0.0026)
0.0344 ***
(0.0034)
PriceRank0.0129 ***
(0.0003)
0.0129 ***
(0.0003)
0.0130 ***
(0.0003)
0.0091 ***
(0.0003)
PriceRel(L)0.0002 ***
(0.0001)
0.0003 ***
(0.0001)
0.0003 ***
(0.0001)
0.0002 ***
(0.0001)
Refinement tool
Ref0.1972 ***
(0.0035)
0.1963 ***
(0.0034)
0.0926 ***
(0.0116)
−0.0174
(0.0116)
Search cost
CumTime(L)0.0460 ***
(0.0012)
0.0462 ***
(0.0012)
0.0389 ***
(0.0014)
0.0421 ***
(0.0014)
Interaction
Ref × CumTime(L)NoNo0.0252 ***
(0.0026)
0.0329 ***
(0.0026)
Control variables
PropertyNoNoNoYes
ClassNoNoNoYes
RatingNoNoNoYes
PlatformNoNoNoYes
Model fit0.41520.41490.41480.4031
(1) Coefficient estimates are posterior means, and those in brackets are posterior standard deviations; (2) *** Coefficient estimates are significant since 0 lies outside the 95% posterior Bayesian credible interval, similar to point estimates with statistical significance at p < 0.05; (3) (L) Variables in the natural logarithm; (4) Model fit is measured by the mean absolute deviation of estimated click-through probability and actual click-through decision.
Disclaimer/Publisher’s Note: The statements, opinions and data contained in all publications are solely those of the individual author(s) and contributor(s) and not of MDPI and/or the editor(s). MDPI and/or the editor(s) disclaim responsibility for any injury to people or property resulting from any ideas, methods, instructions or products referred to in the content.

