
T-Smart: Trust Model for Blockchain Based Smart Marketplace


Abstract
:1. Introduction
- The model computes separate trust score per resource for a participant to ensure fair and genuine trust management.
- Trust of a participant is calculated based on past experiences, feedback provided by other participants and the level of commitment a participant has shown to carrying out the transactions.
- Ethereum Blockchain is used to ensure the security, validation, and trust for all the participants within the smart marketplace.
2. Related Work
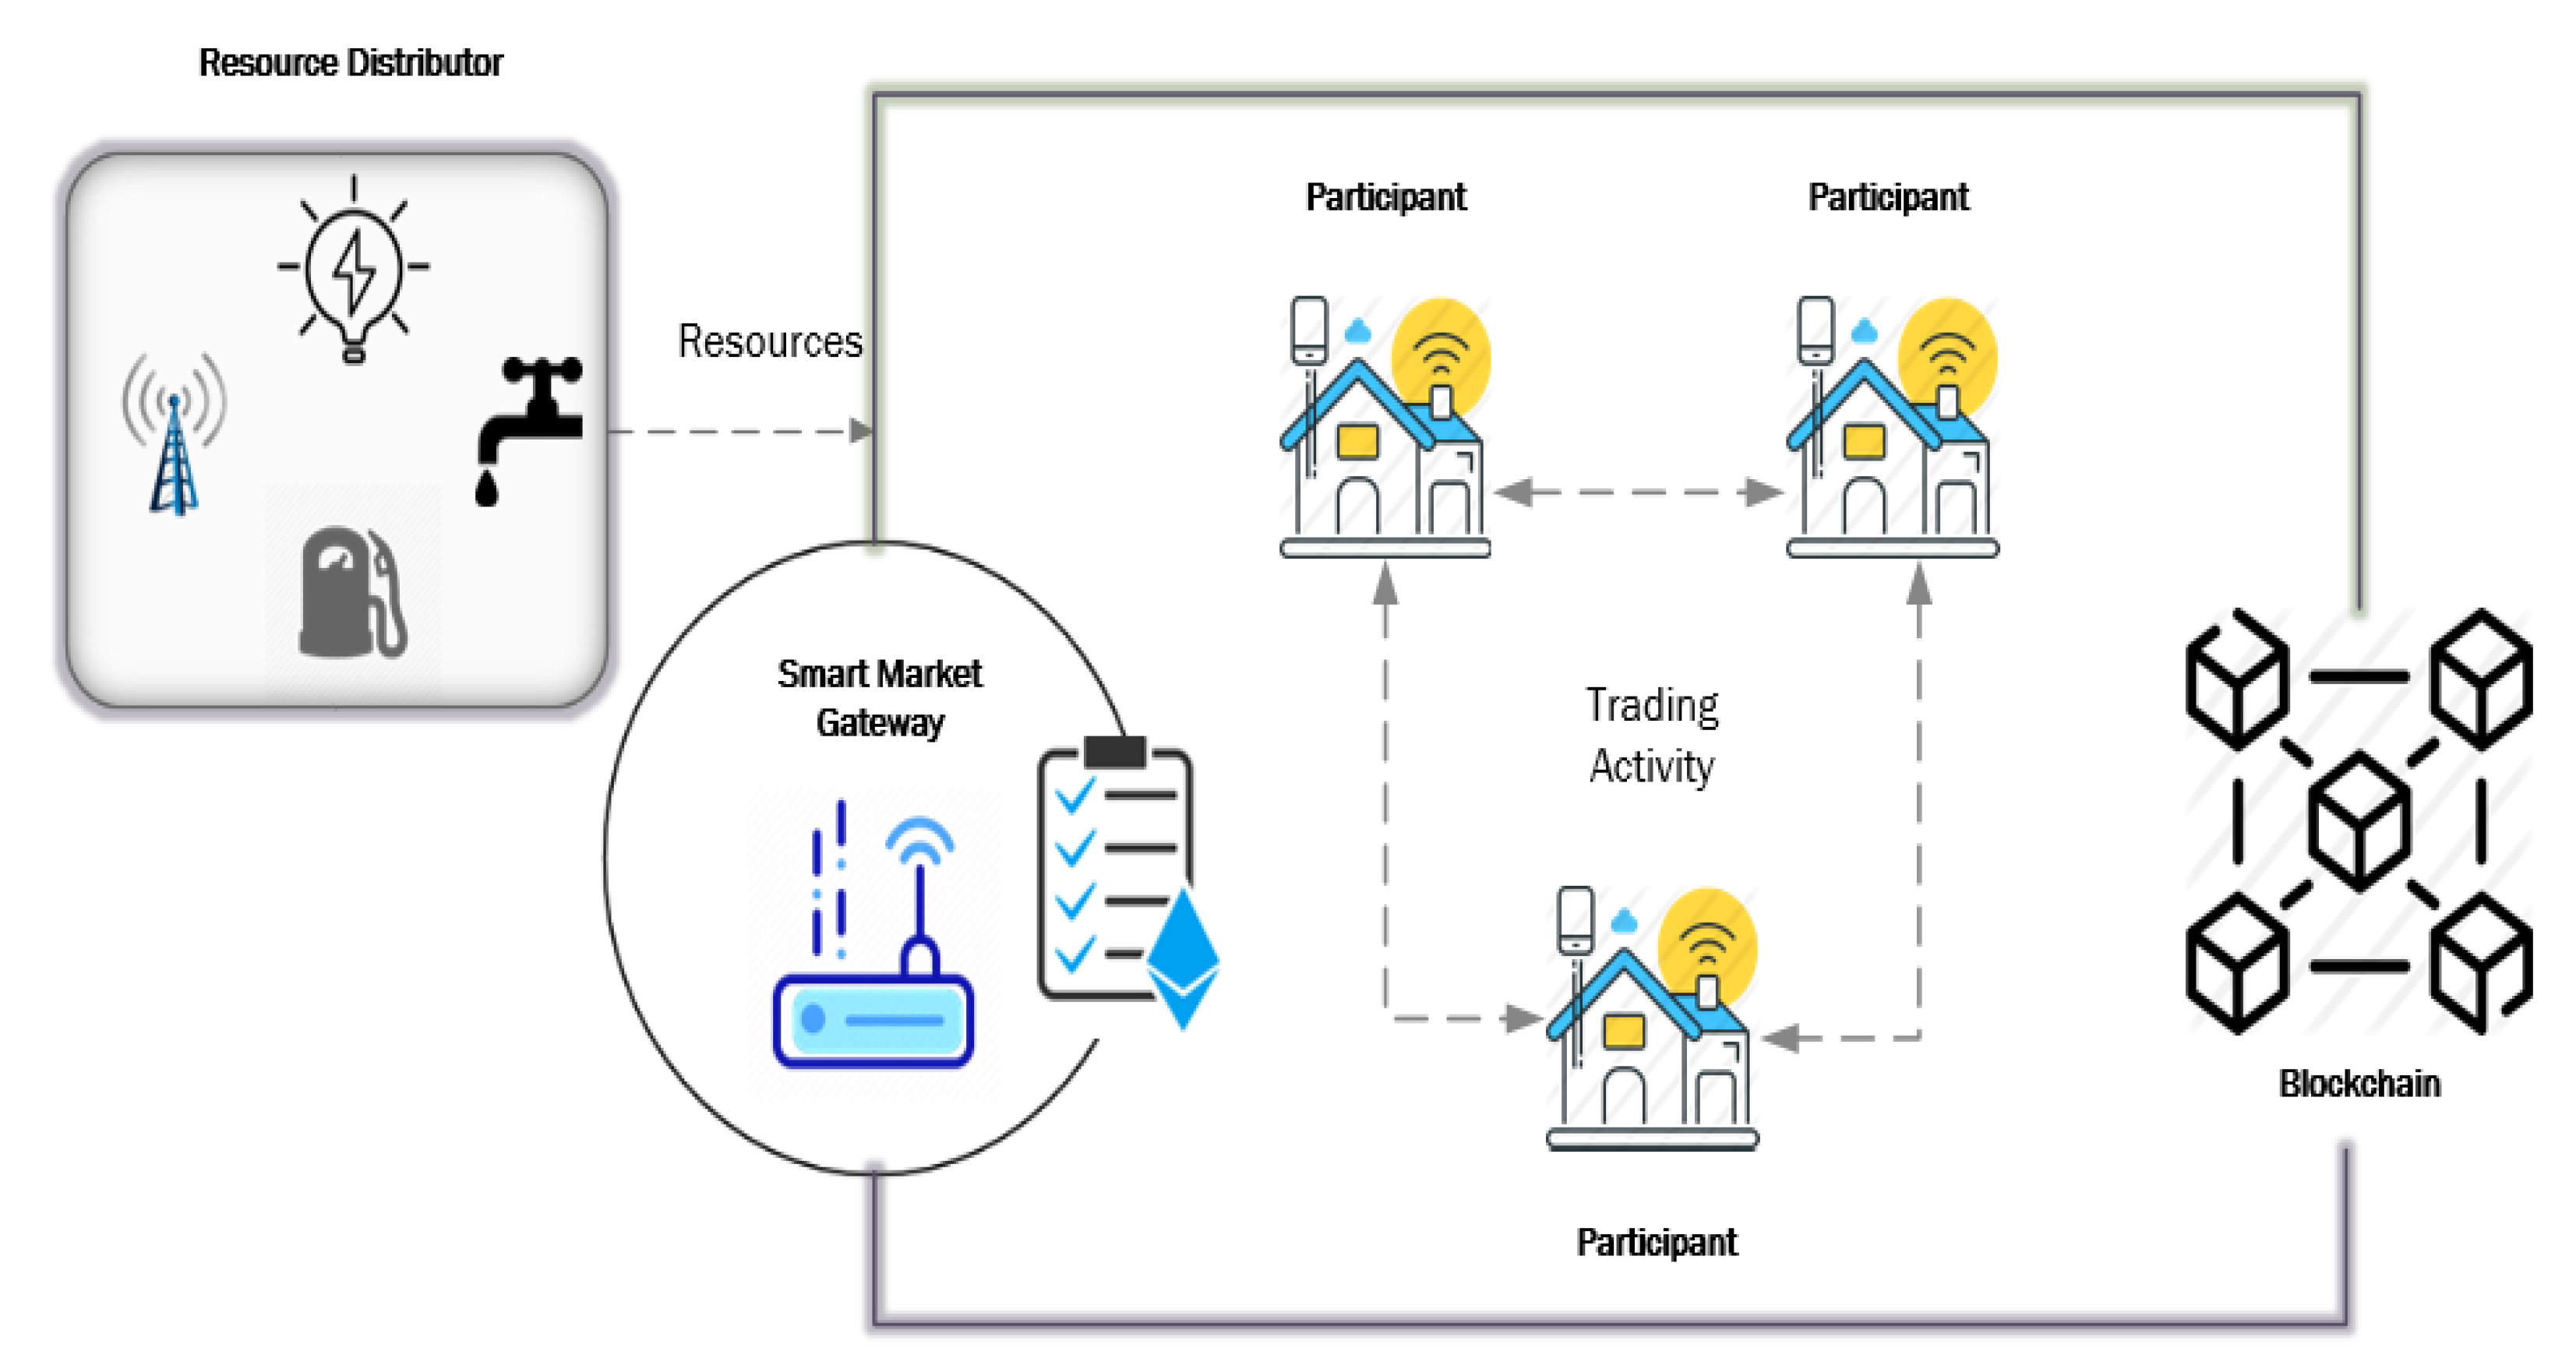
3. System Model
3.1. Network Model
3.2. Trade Model
3.3. Threat Model
- Adversary can carry out a variety of attacks, such as ballot-stuffing and bad-mouthing attacks in the SMP.
- It is presumed that smart gateway is tamper-proof, and thus cannot be breached.
- It is presumed that the adversary does not compromise the blockchain.
4. The Trust Management Model
4.1. Trust Computation and Modeling
| Algorithm 1: Computing trust score for SMP participants. |
 |
4.1.1. Commitment ()
4.1.2. Feedback
5. Security Analysis
6. Performance Analysis
6.1. Simulation Setup
- The SMP population was kept to 30 participants (both sellers and buyers).
- Each trading interaction involved two participants (buyer and seller) chosen in random way. Interactions were conducted in minutes and 60 interactions were carried out in 60 min so that each of the 30 participants acted as a seller or buyer in different cases.
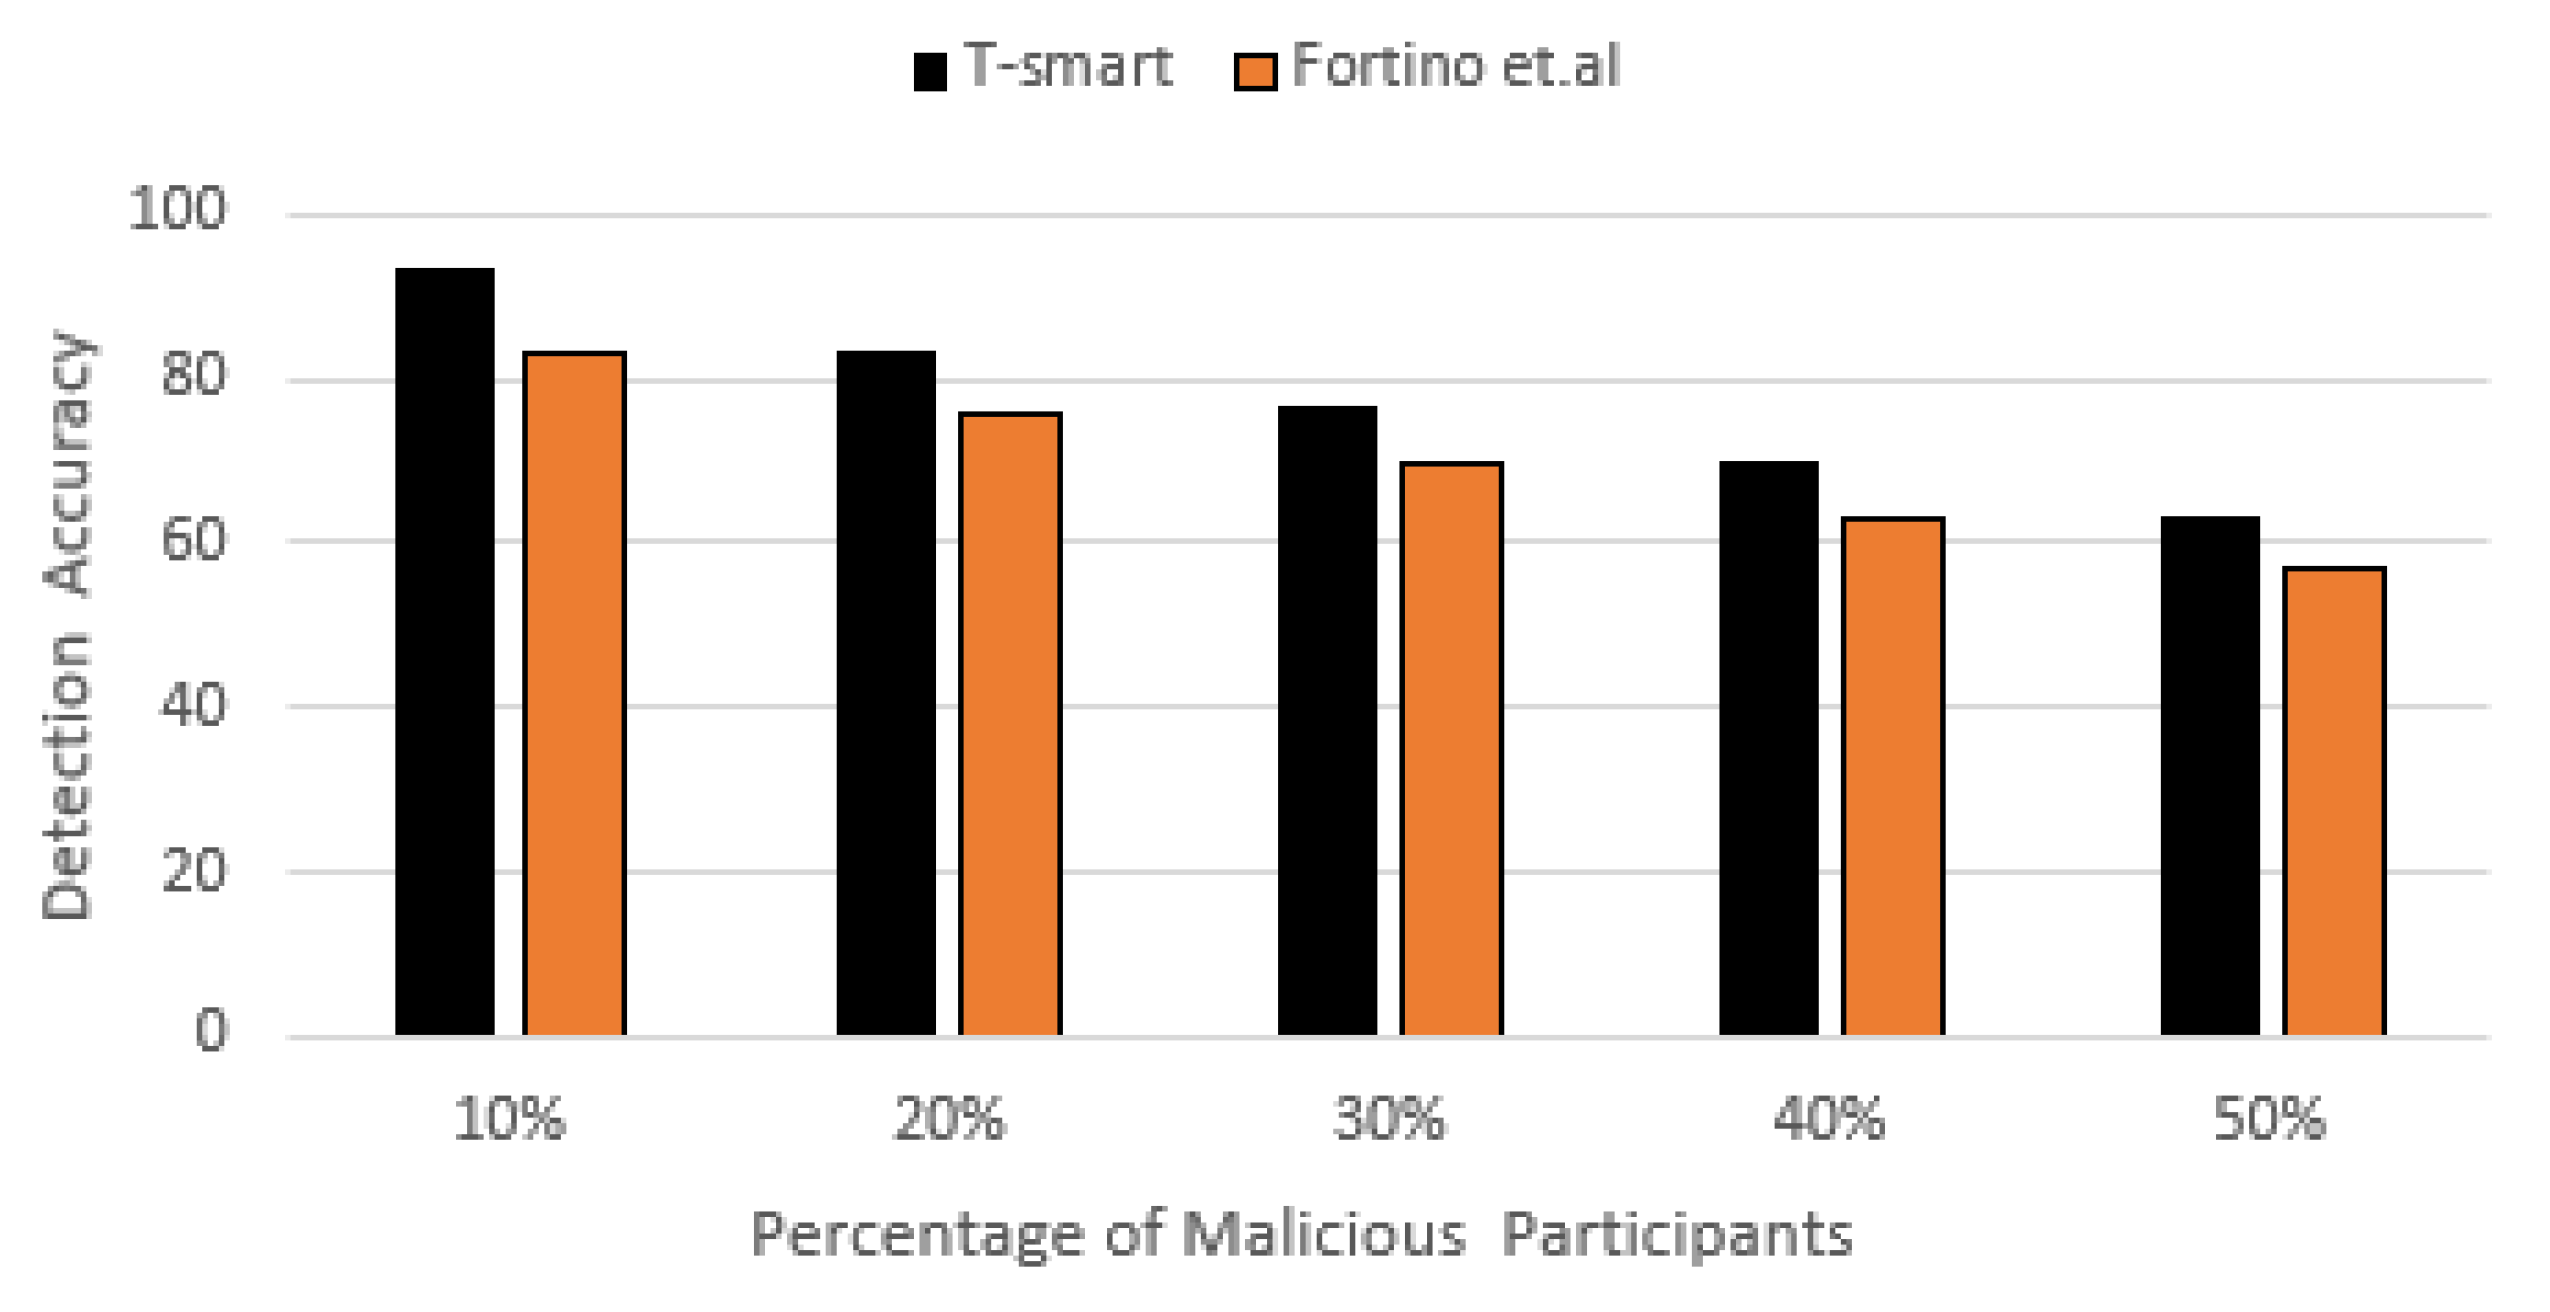
- Percentage of dishonest participants is varied between and .
- Model is also assessed by varying the number of participants from 10, 20 and 30 participants with dishonest participants.
6.2. Performance Parameters
7. Results and Evaluation
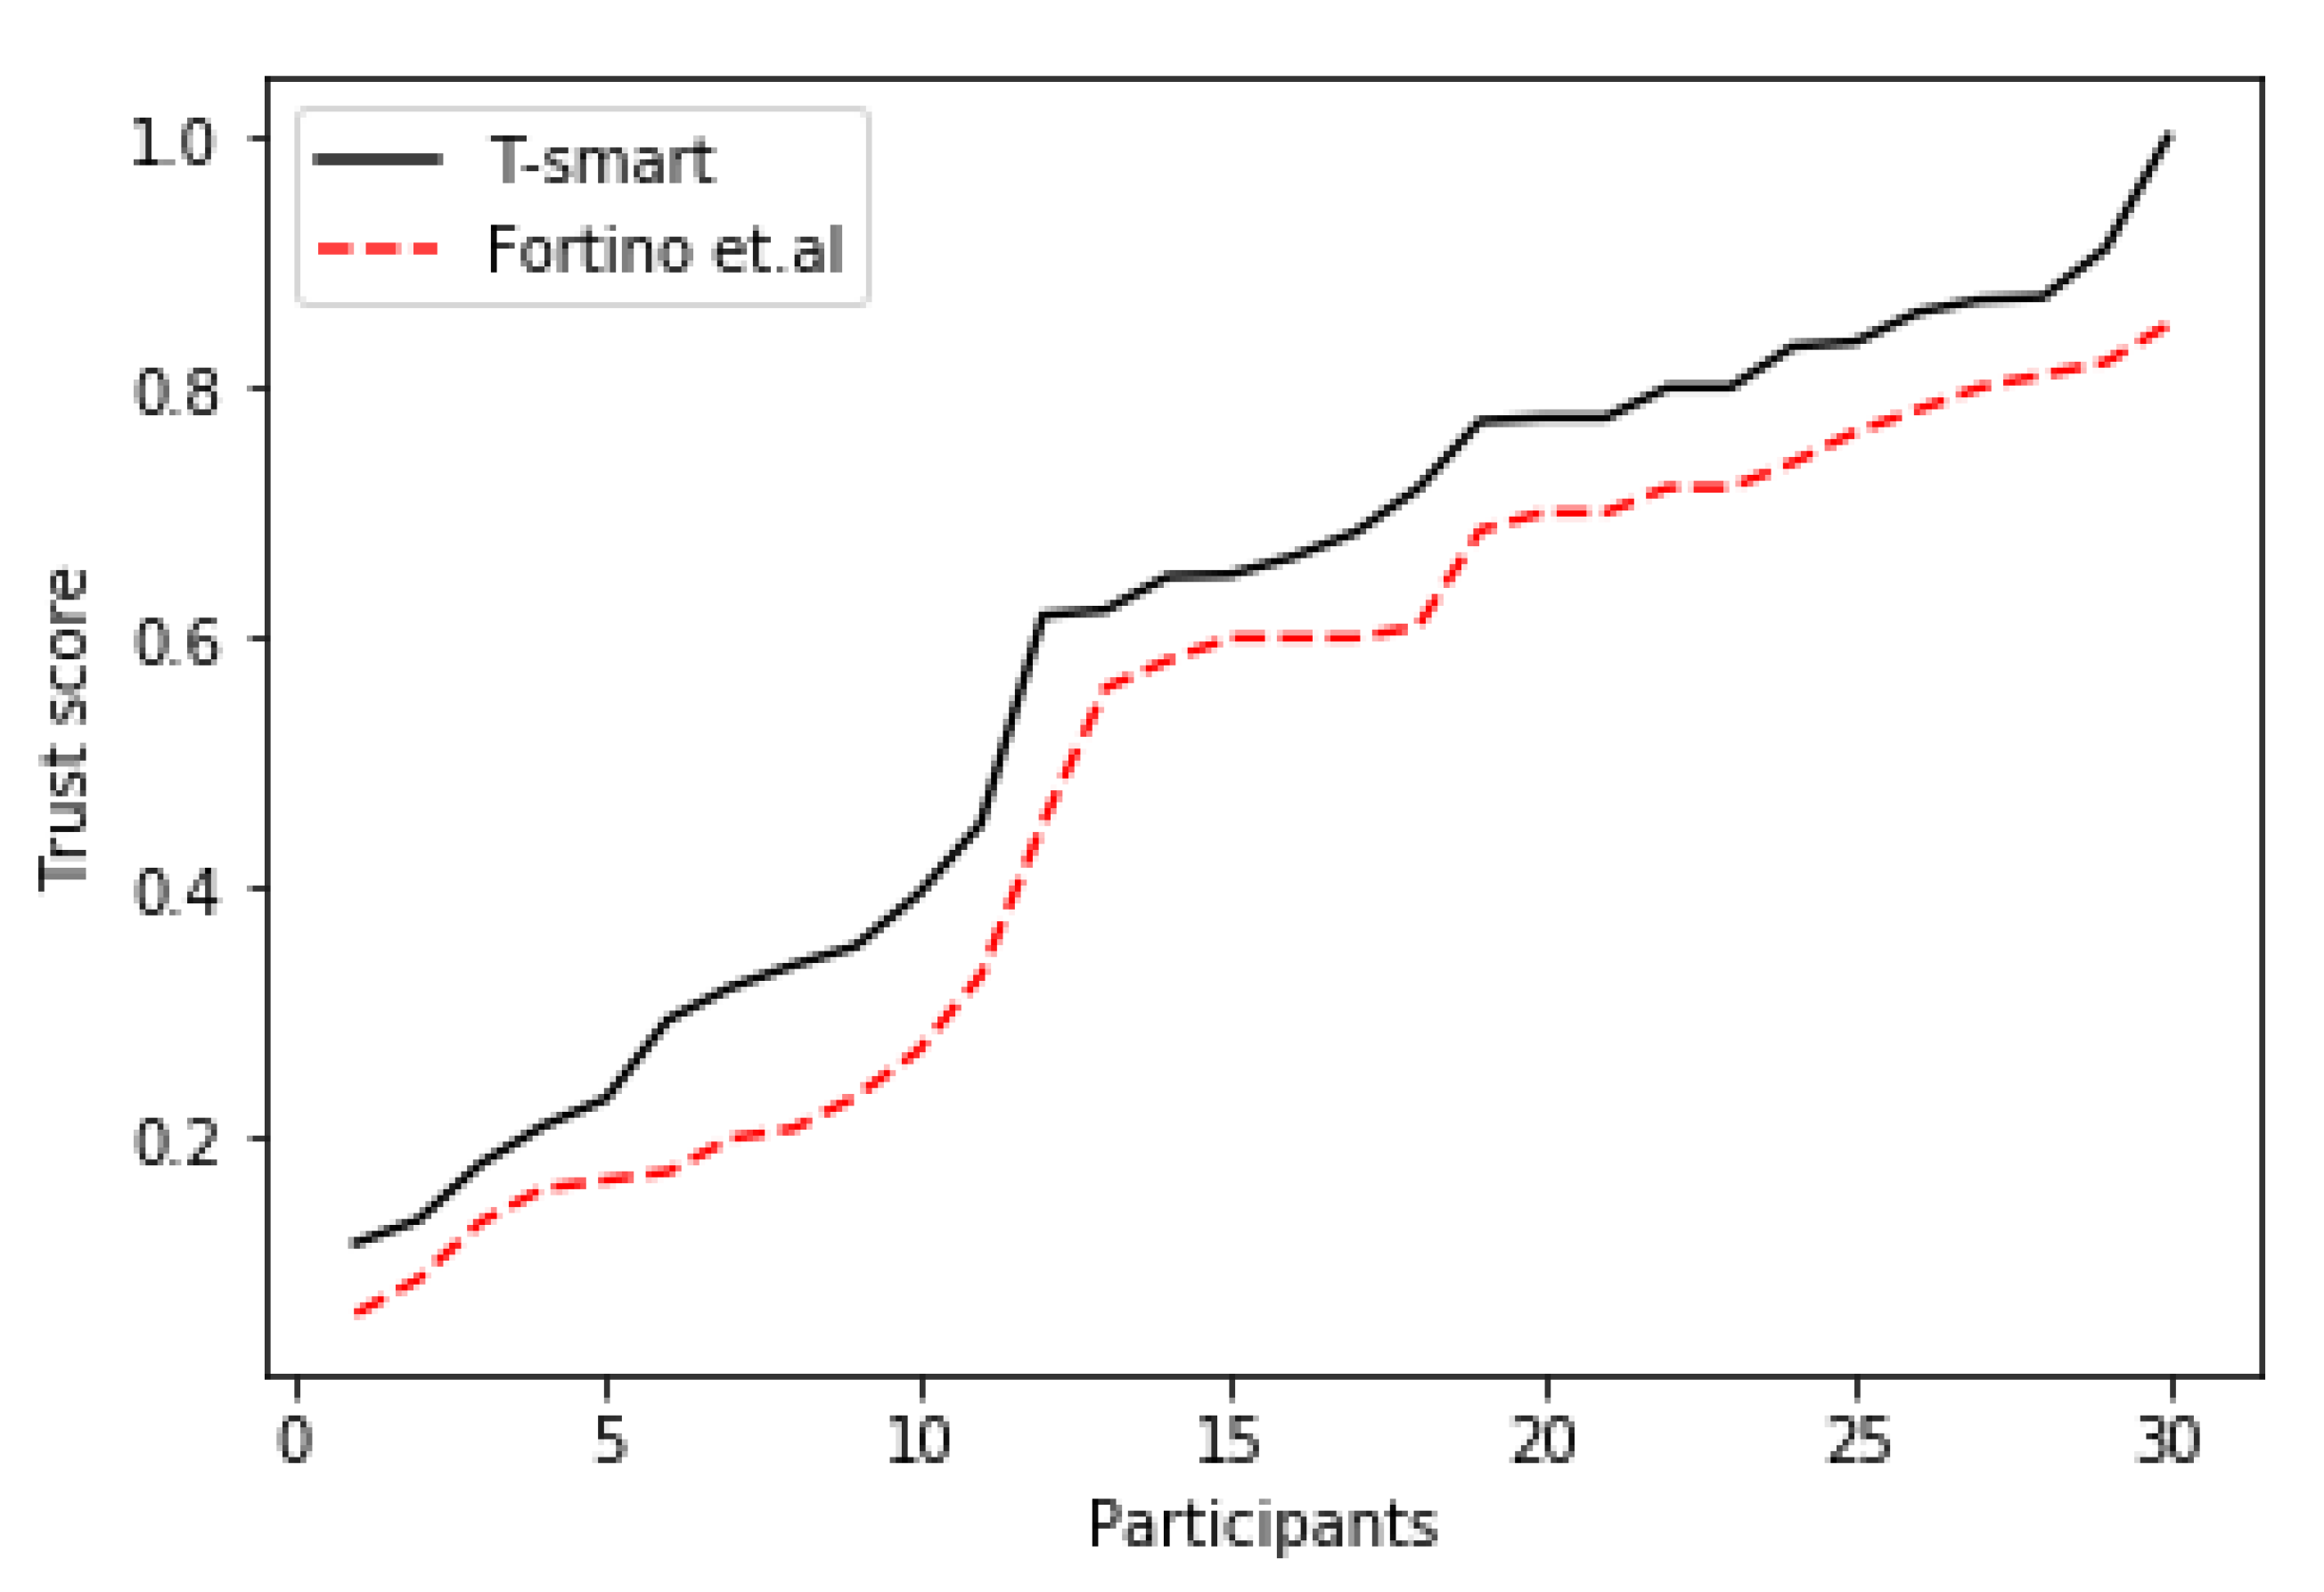
7.1. Trust Score Comparison
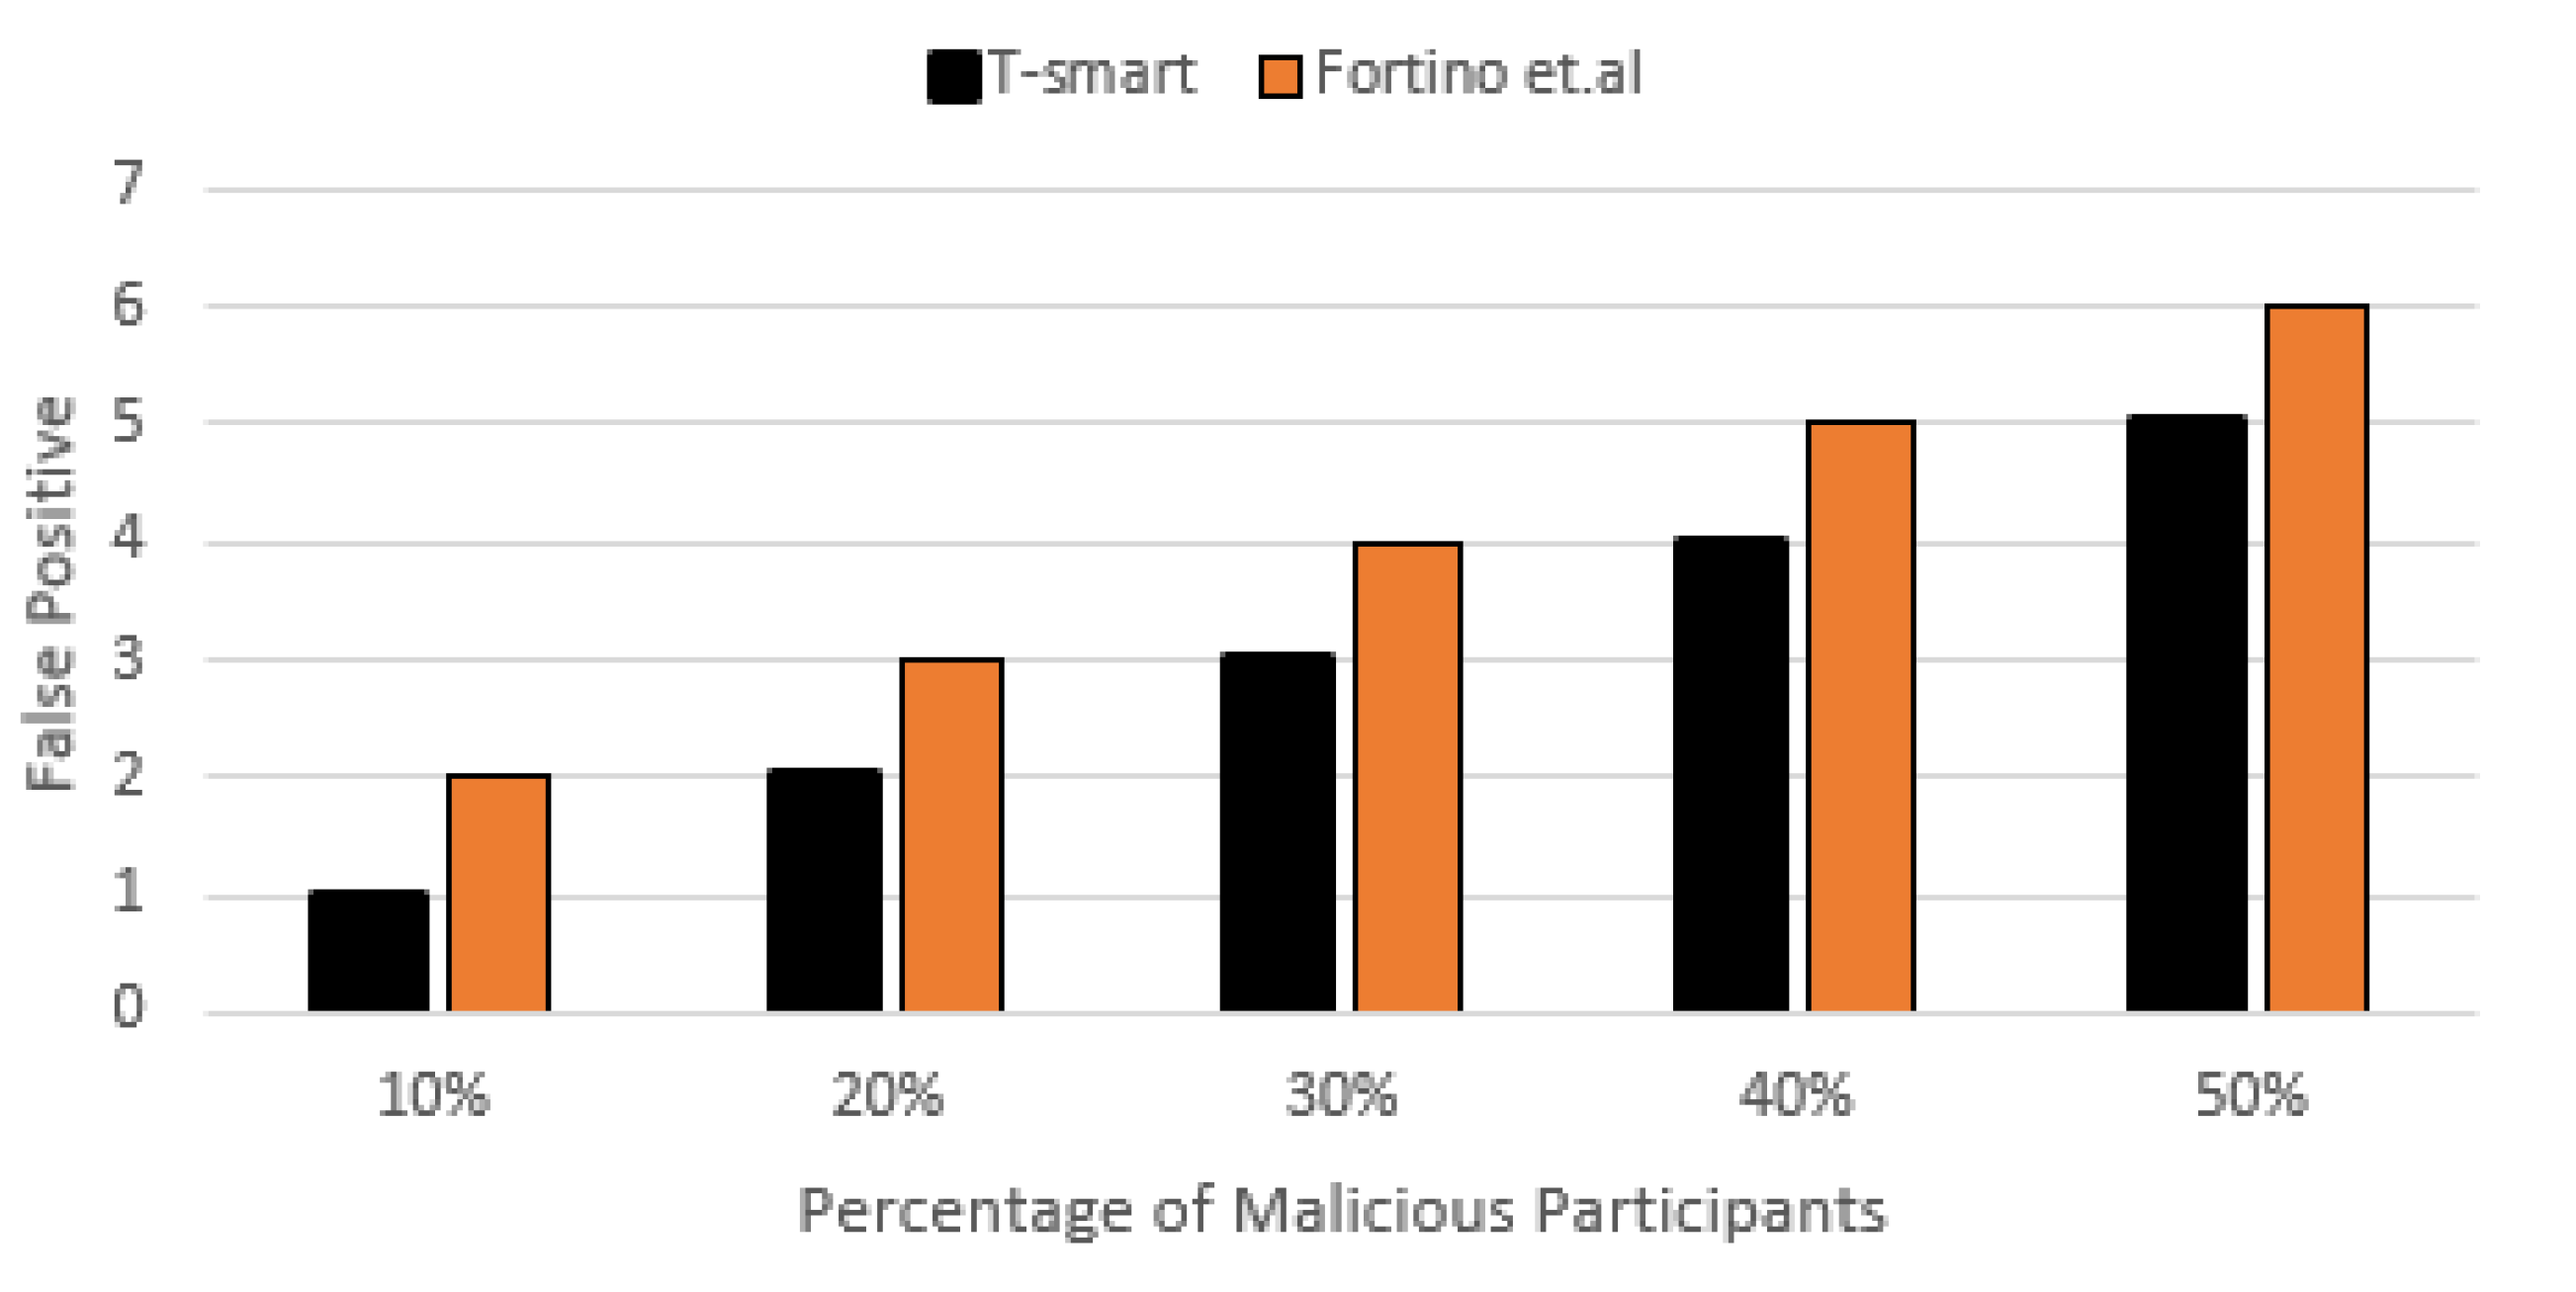
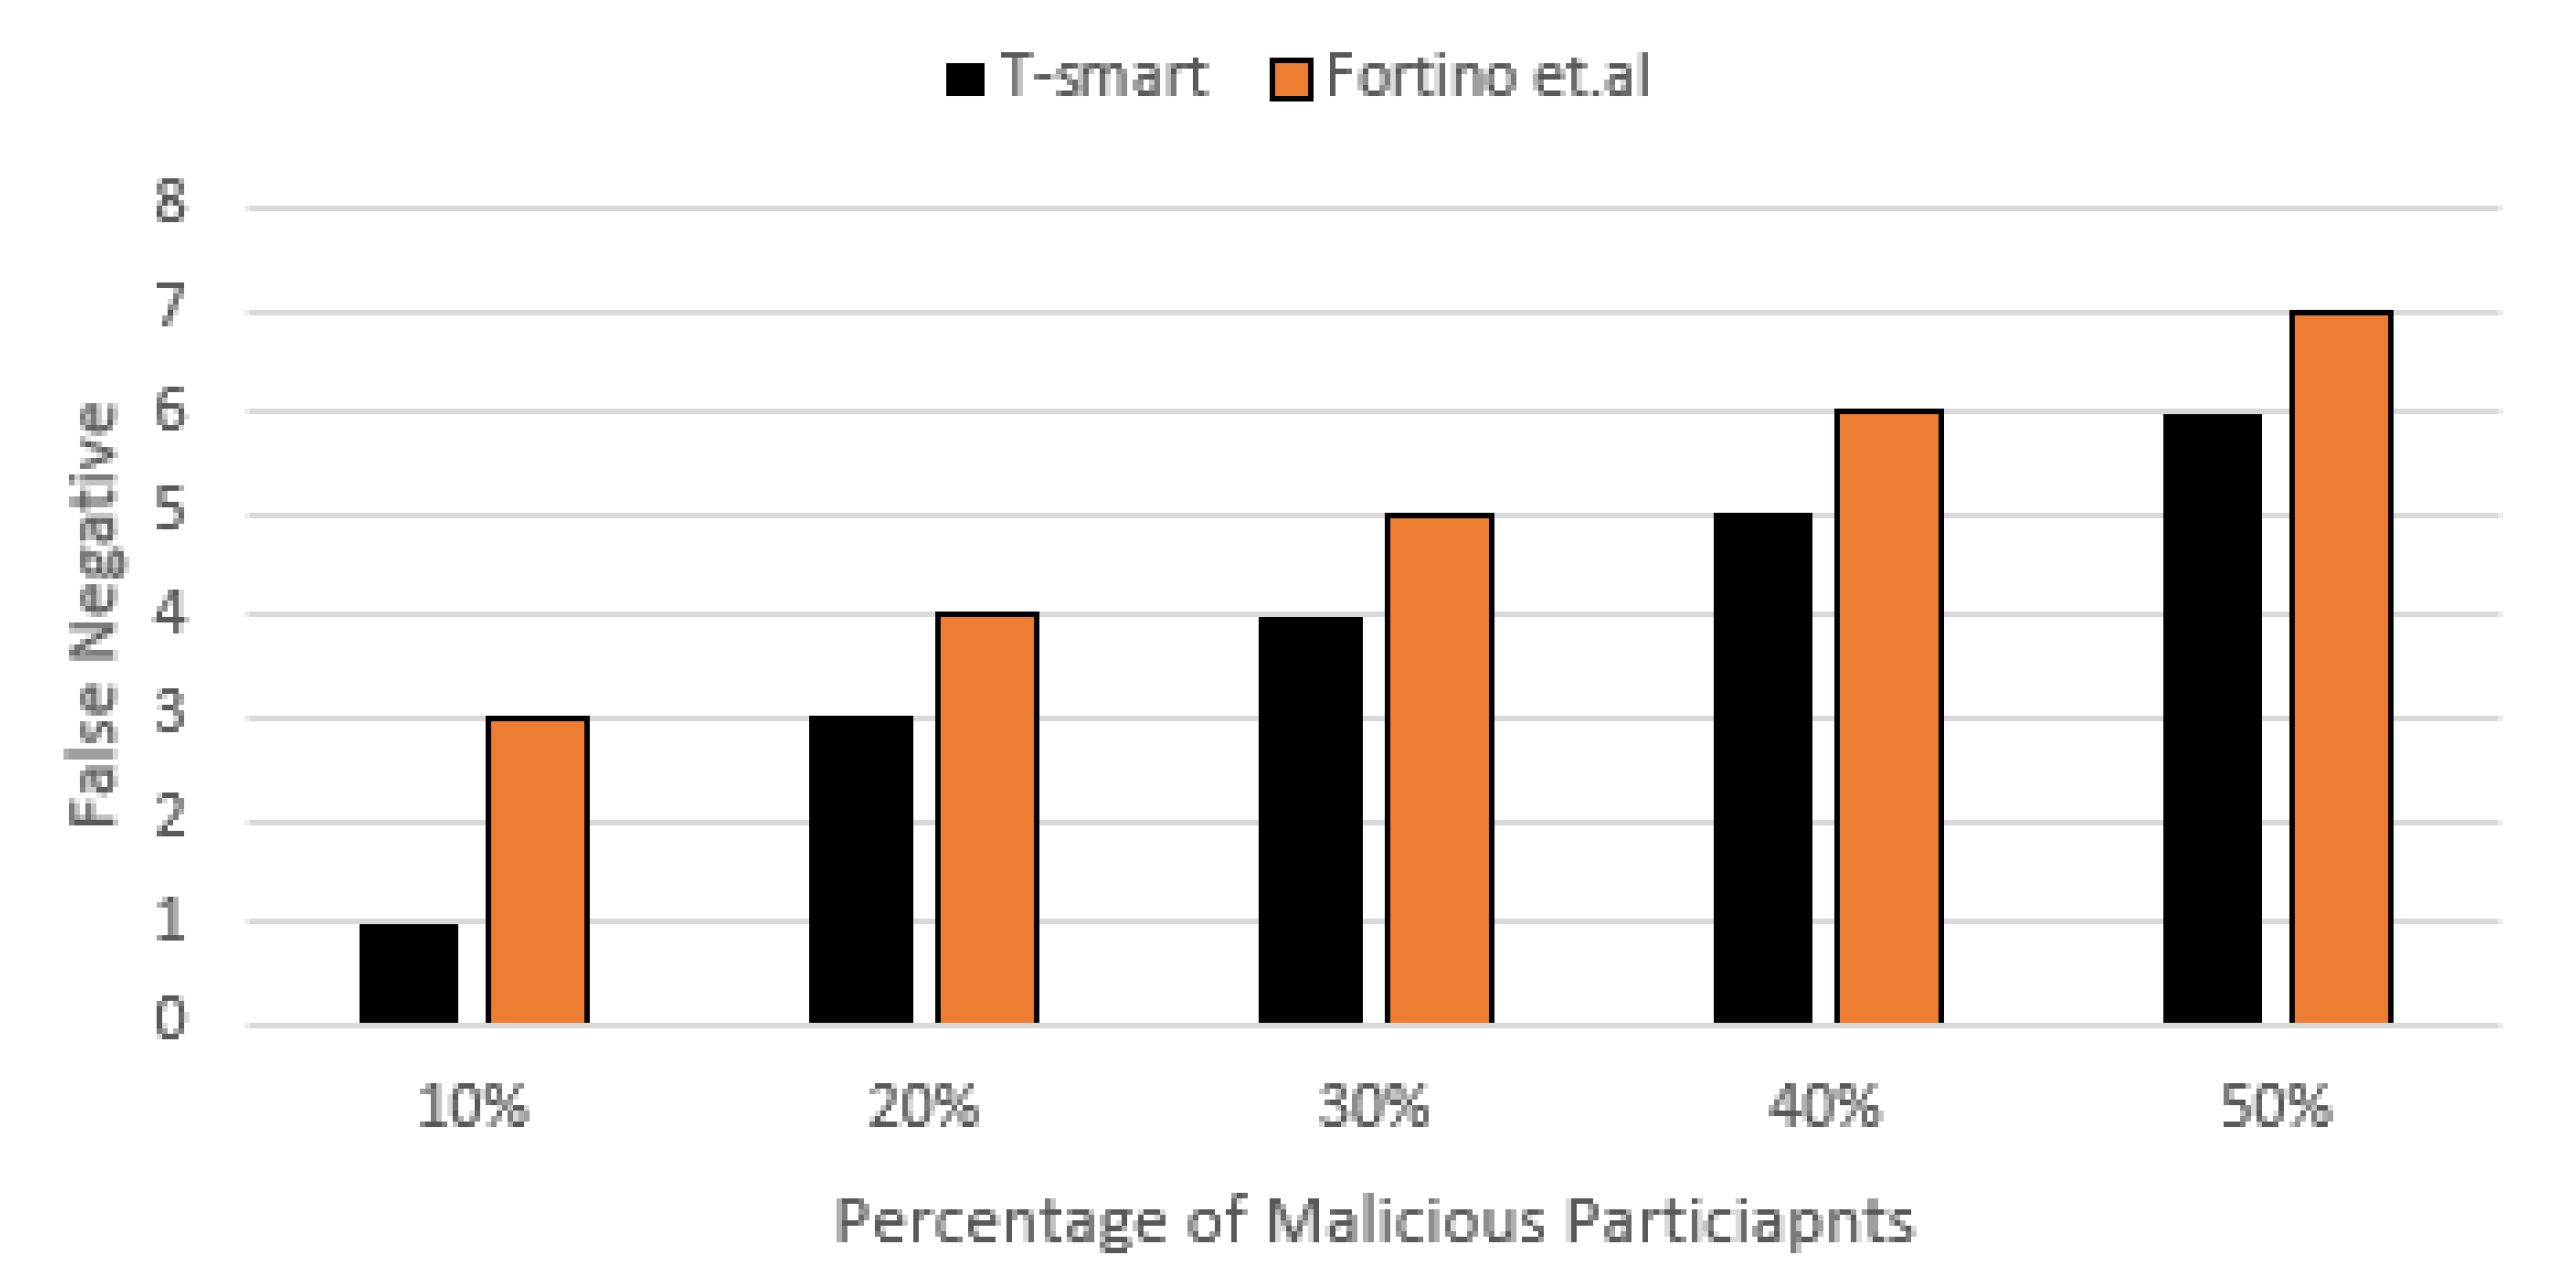
7.2. Increasing Number of Dishonest Participants 10–50%
7.2.1. Detection Accuracy
7.2.2. False Positive and False Negative
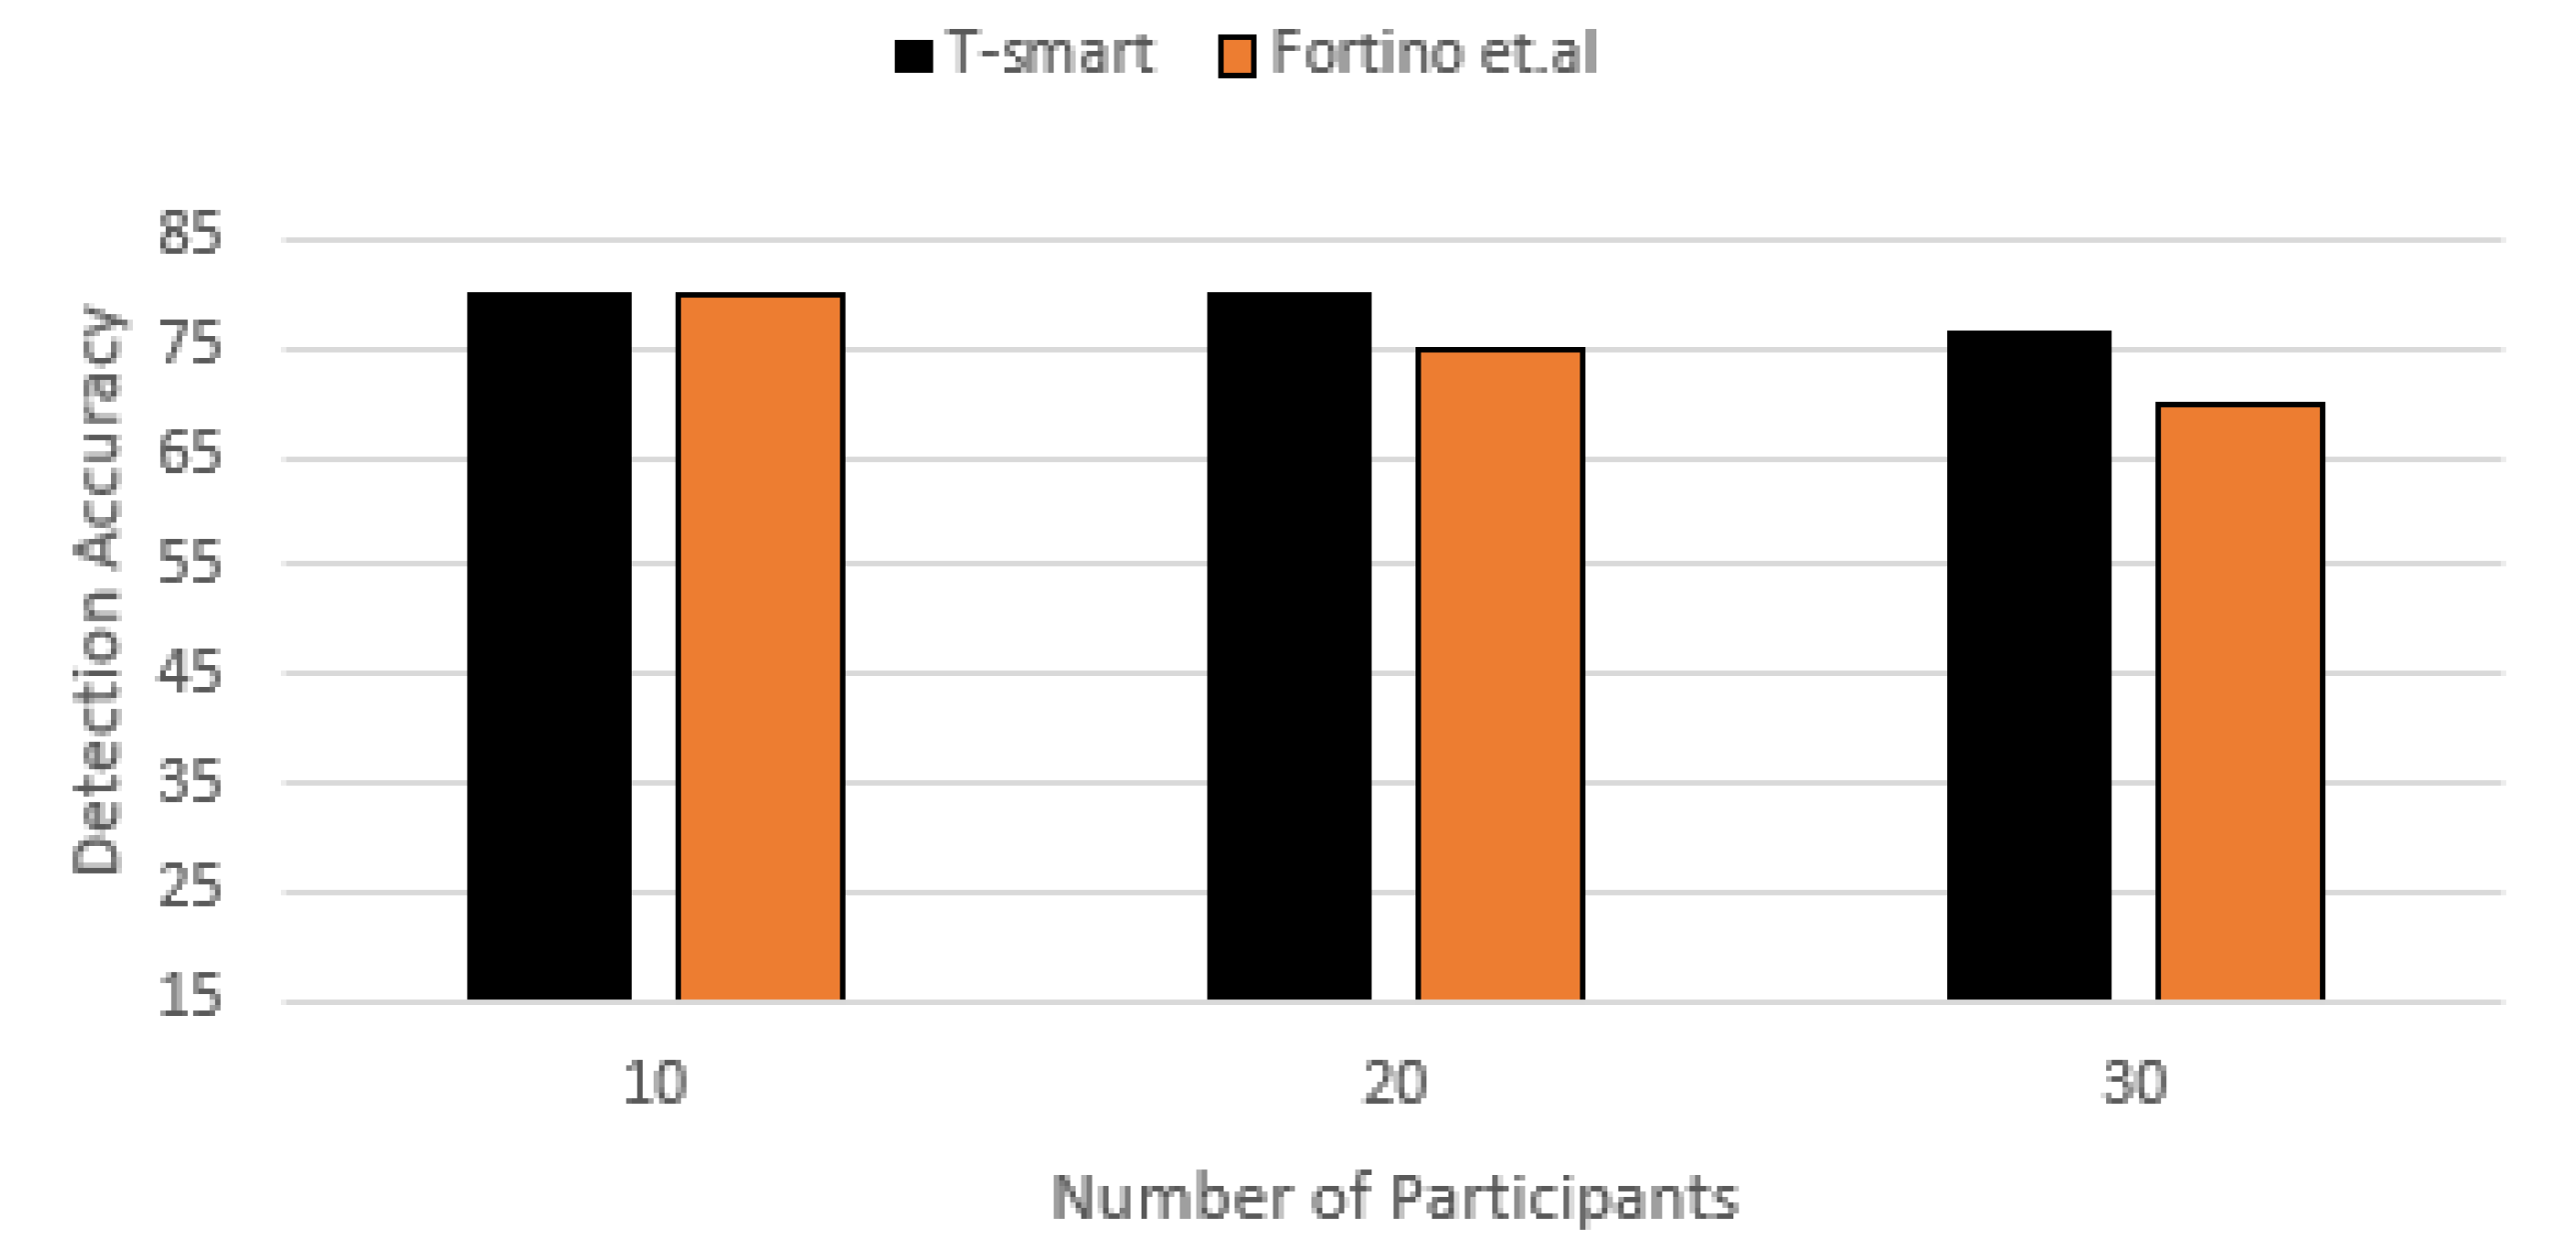
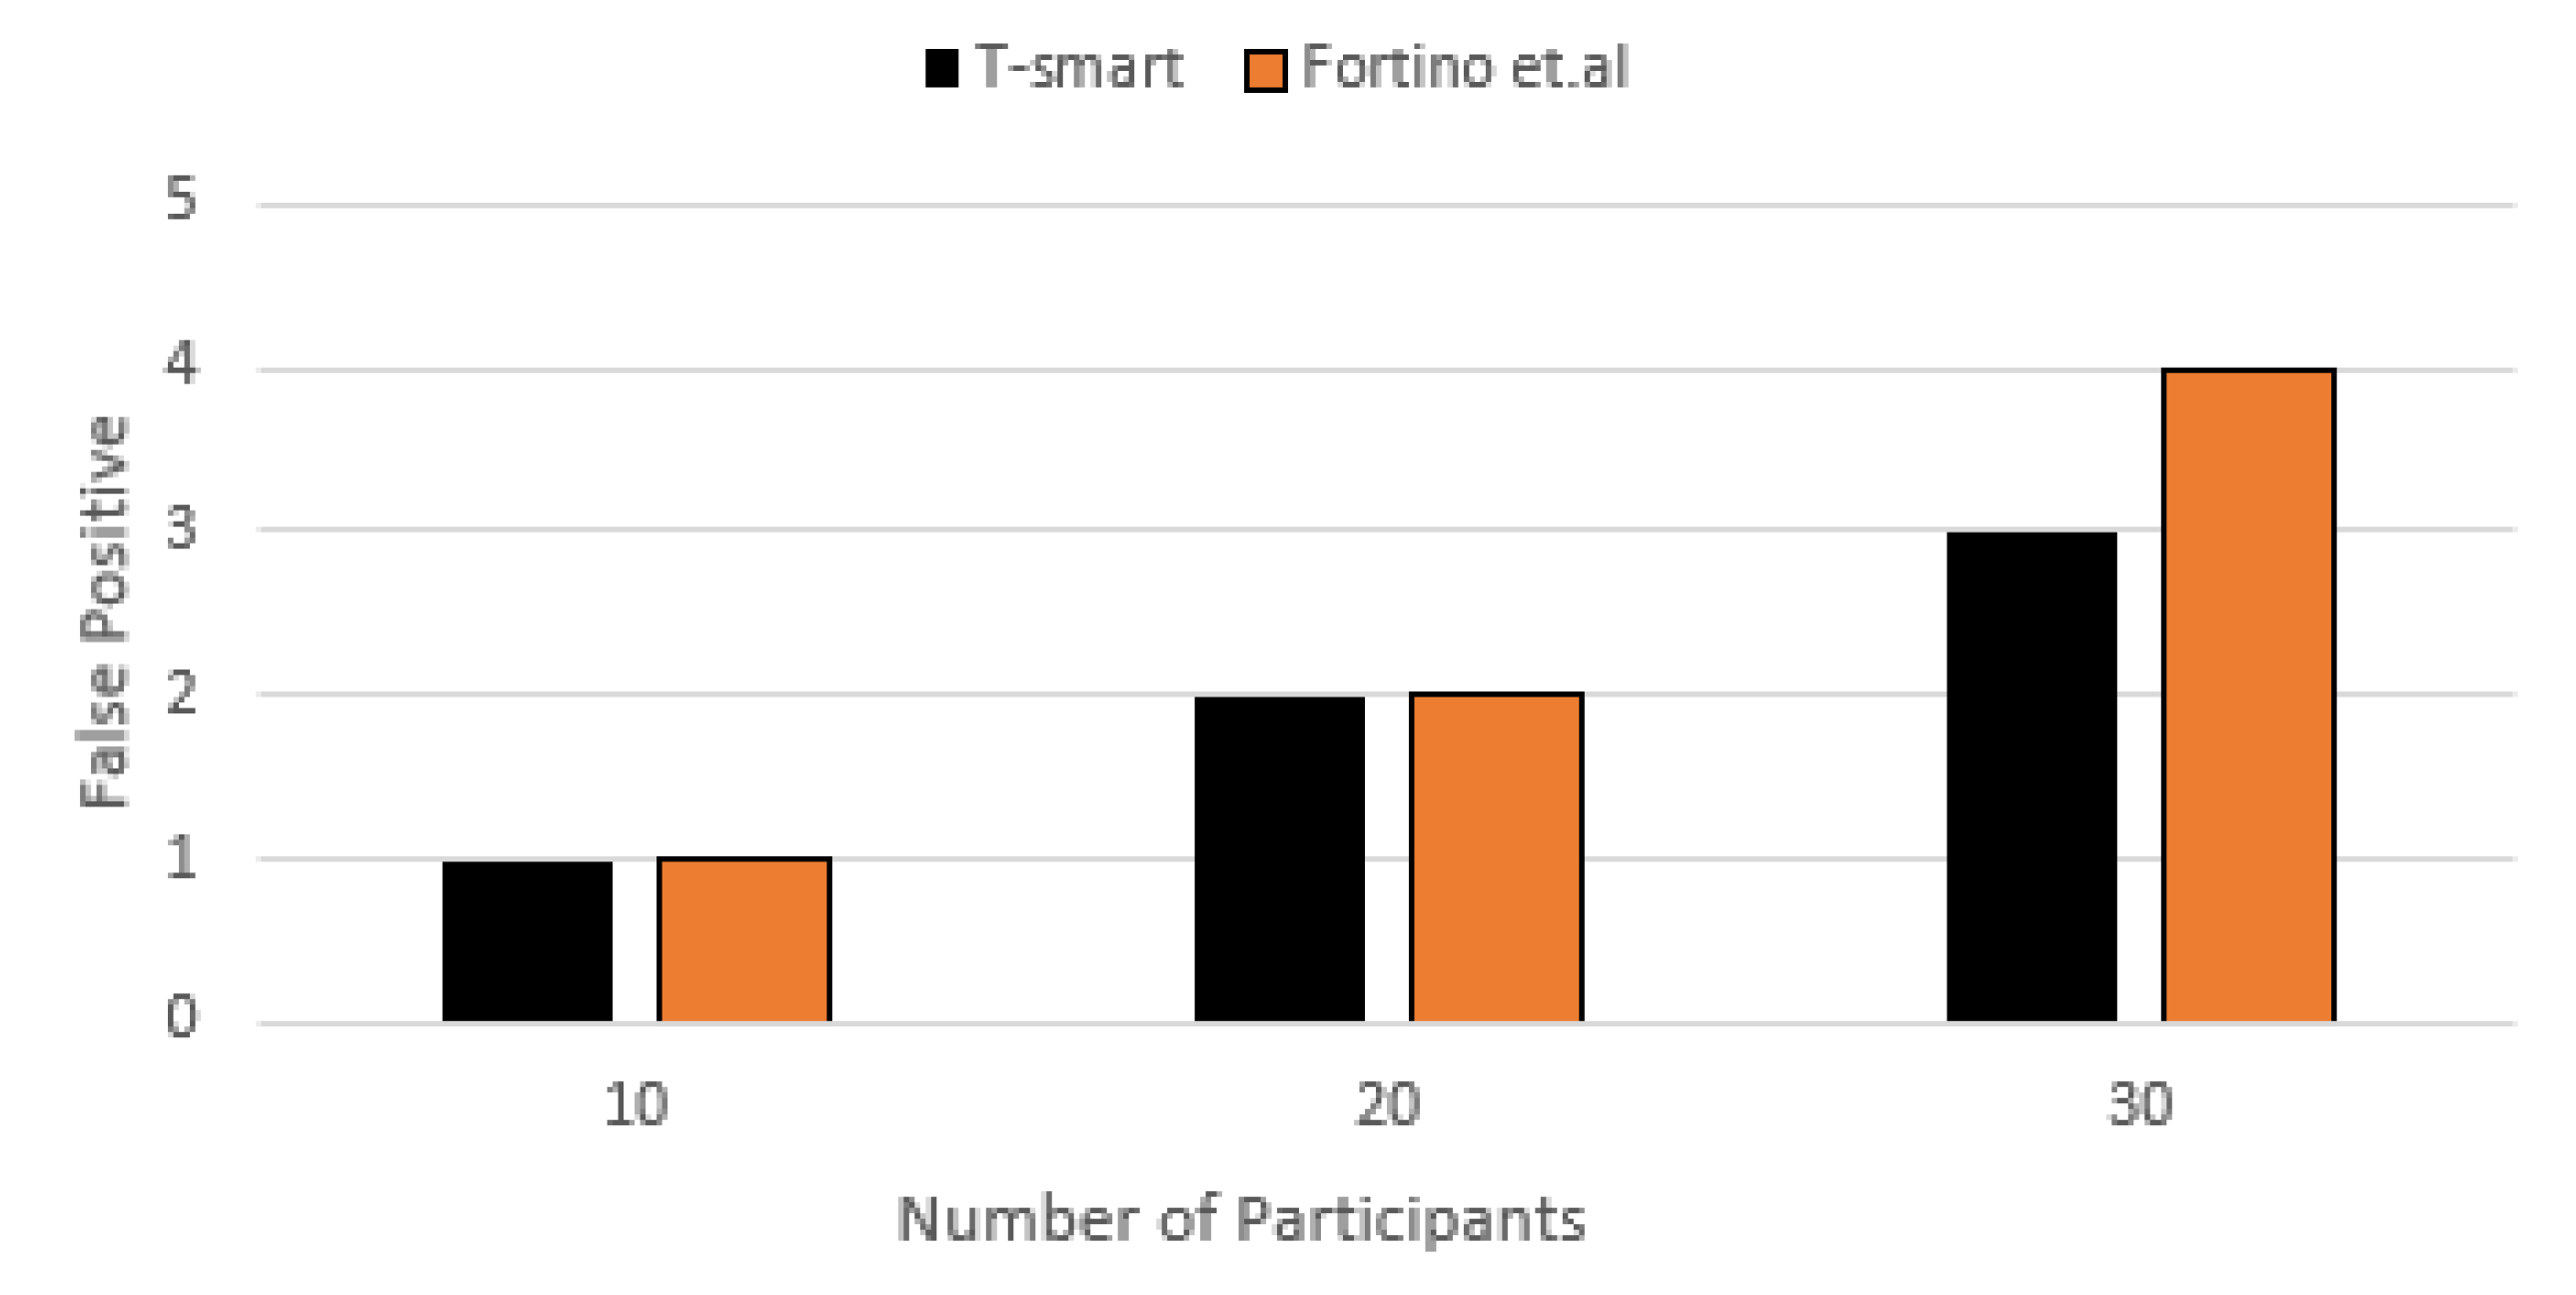
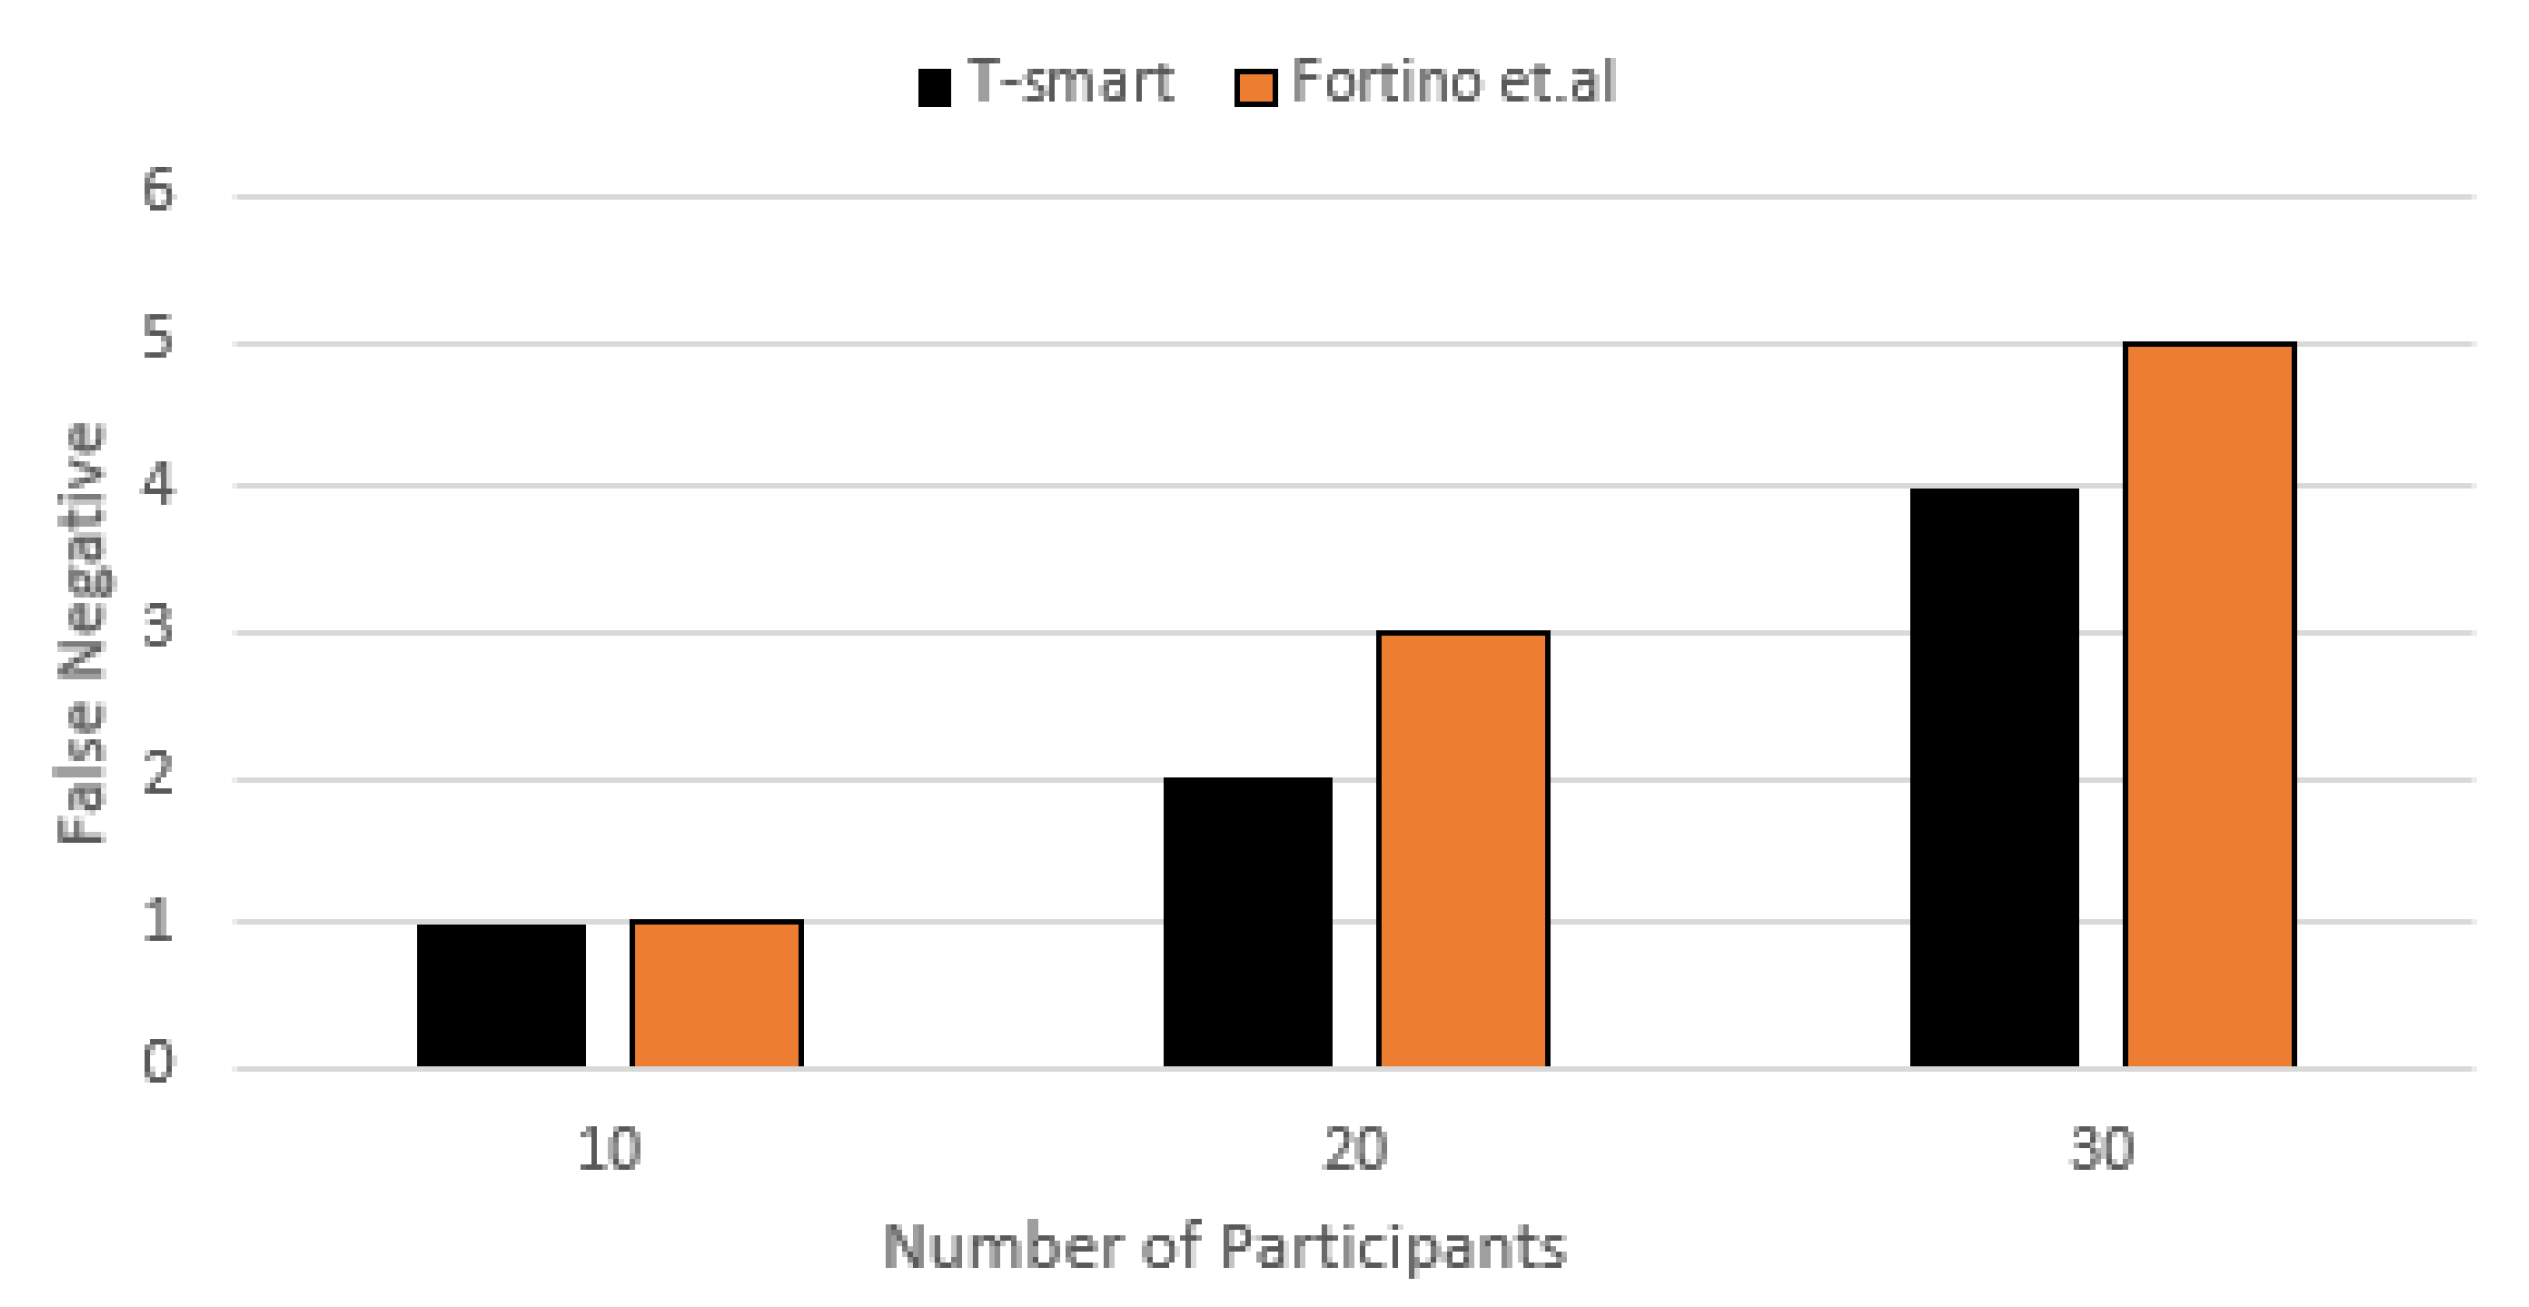
7.3. Increasing Number of Participants
7.3.1. Detection Accuracy
7.3.2. False Positive and False Negative
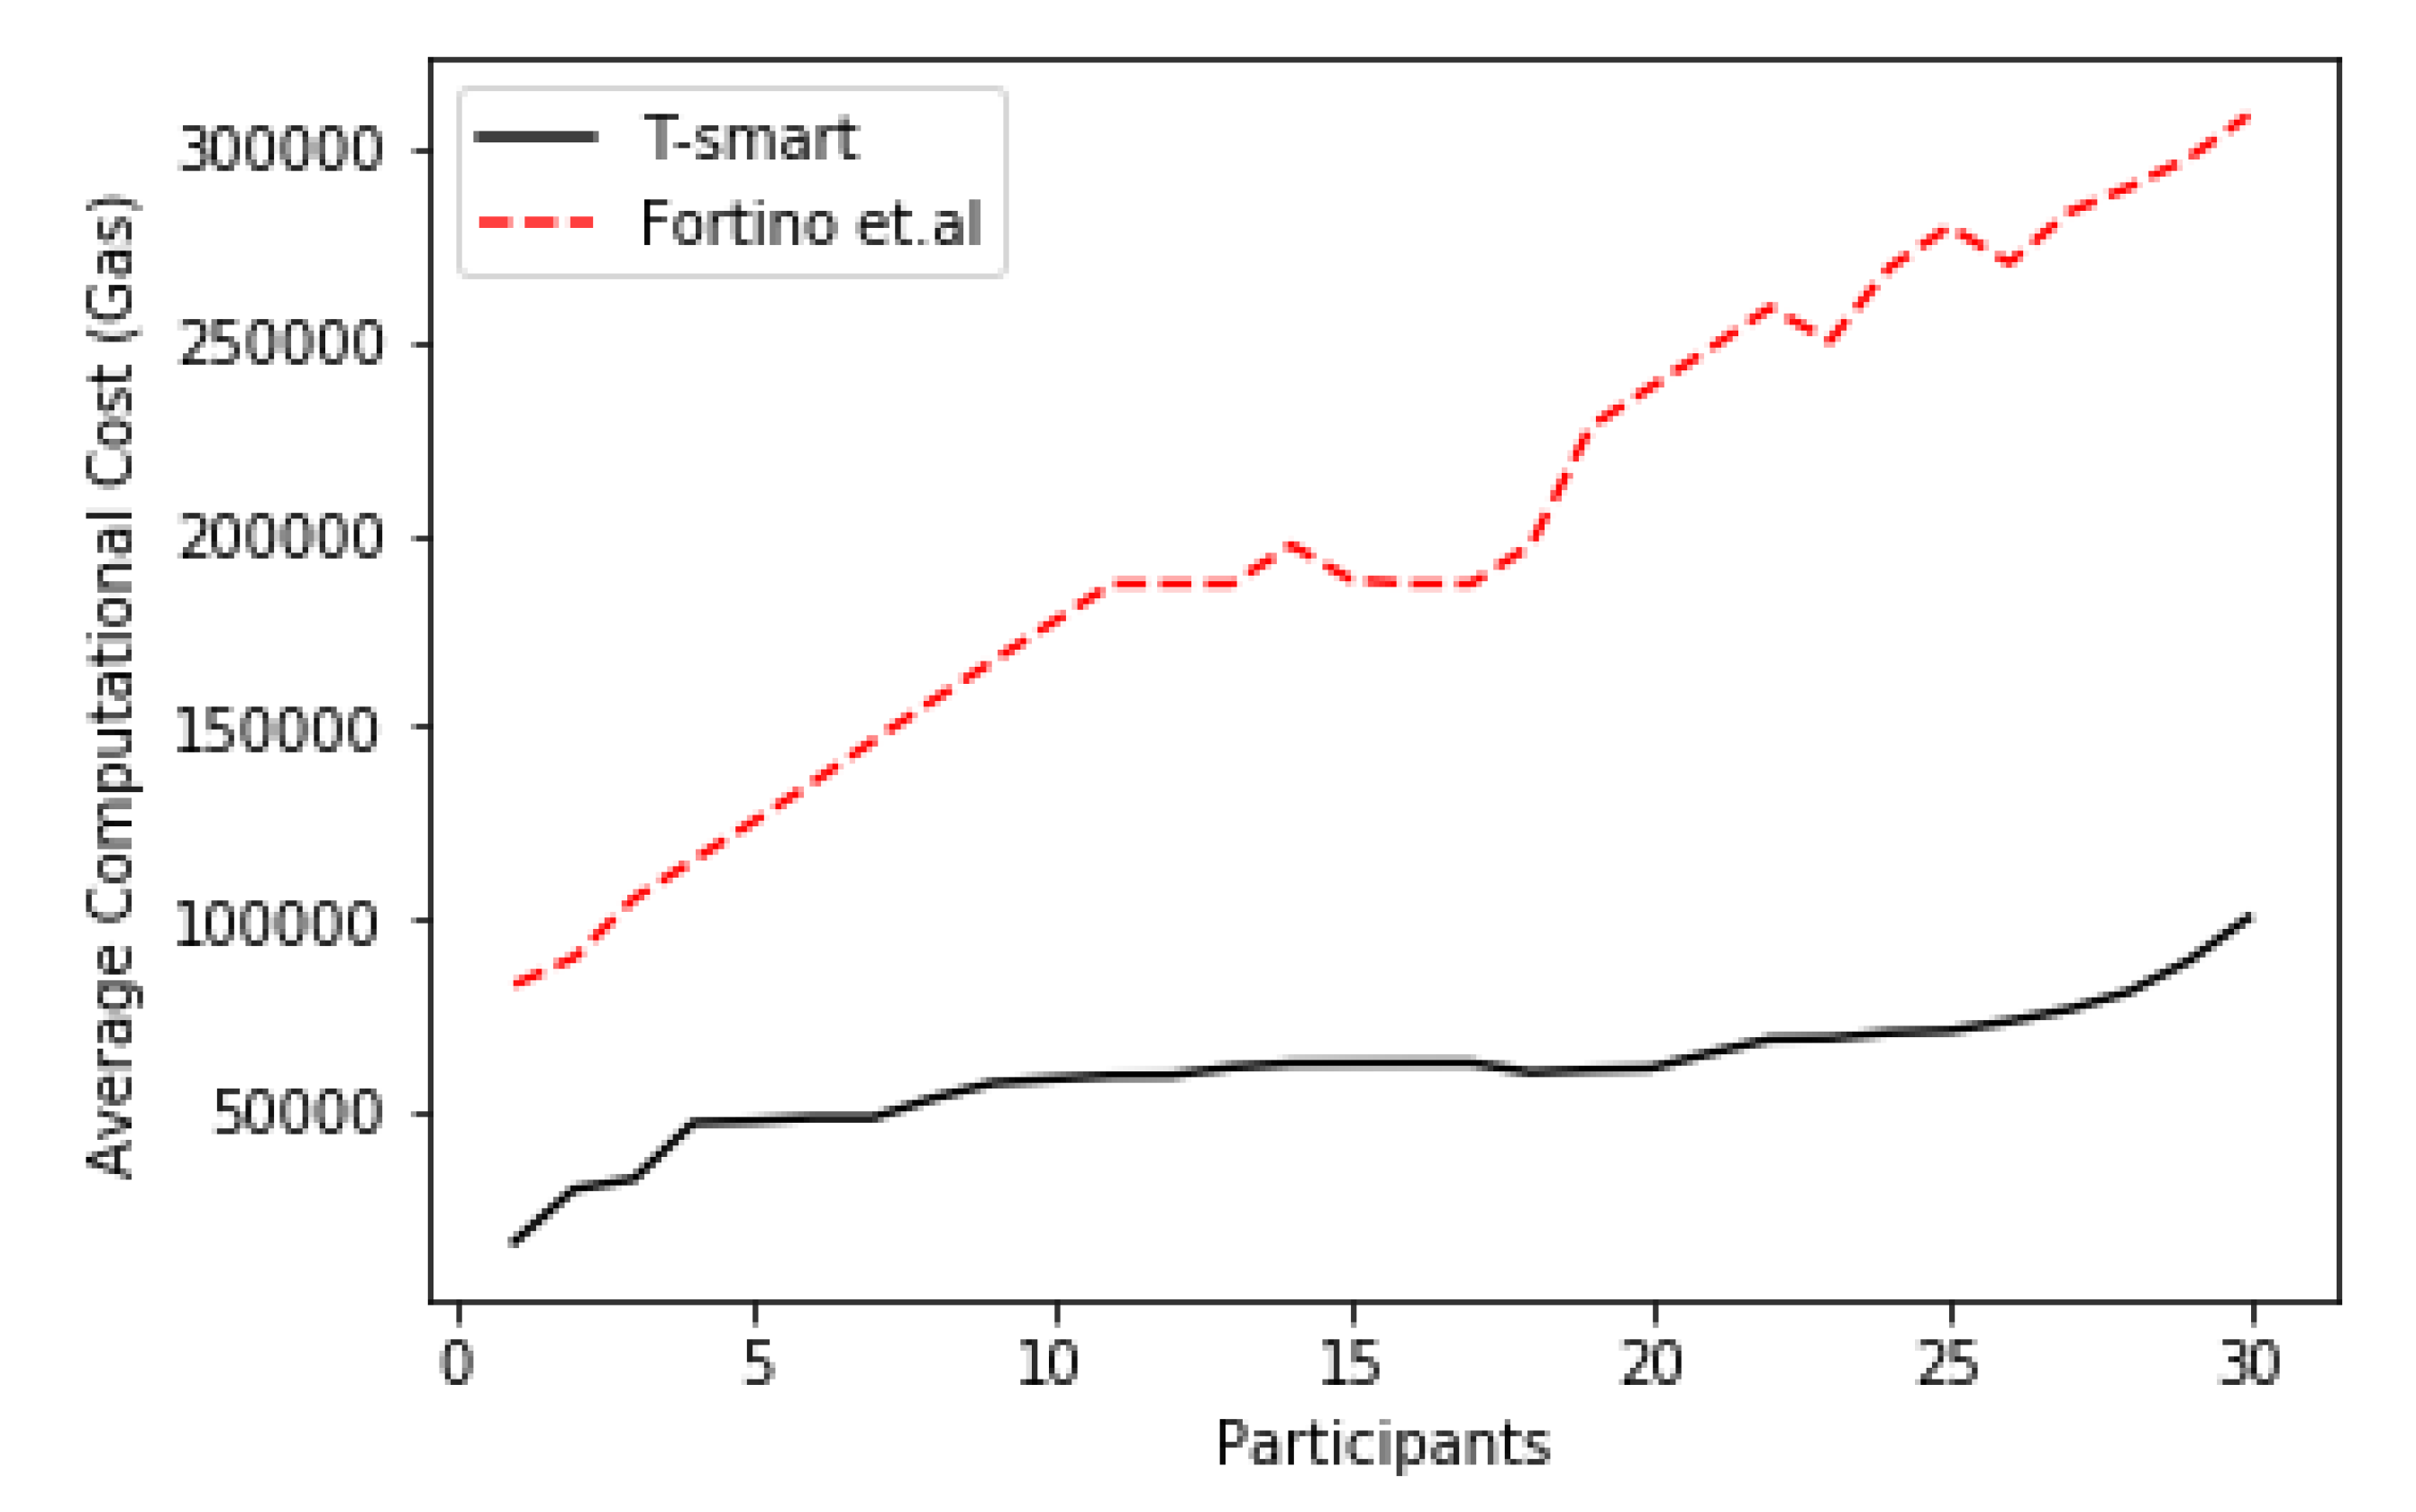
7.4. Average Computational Cost
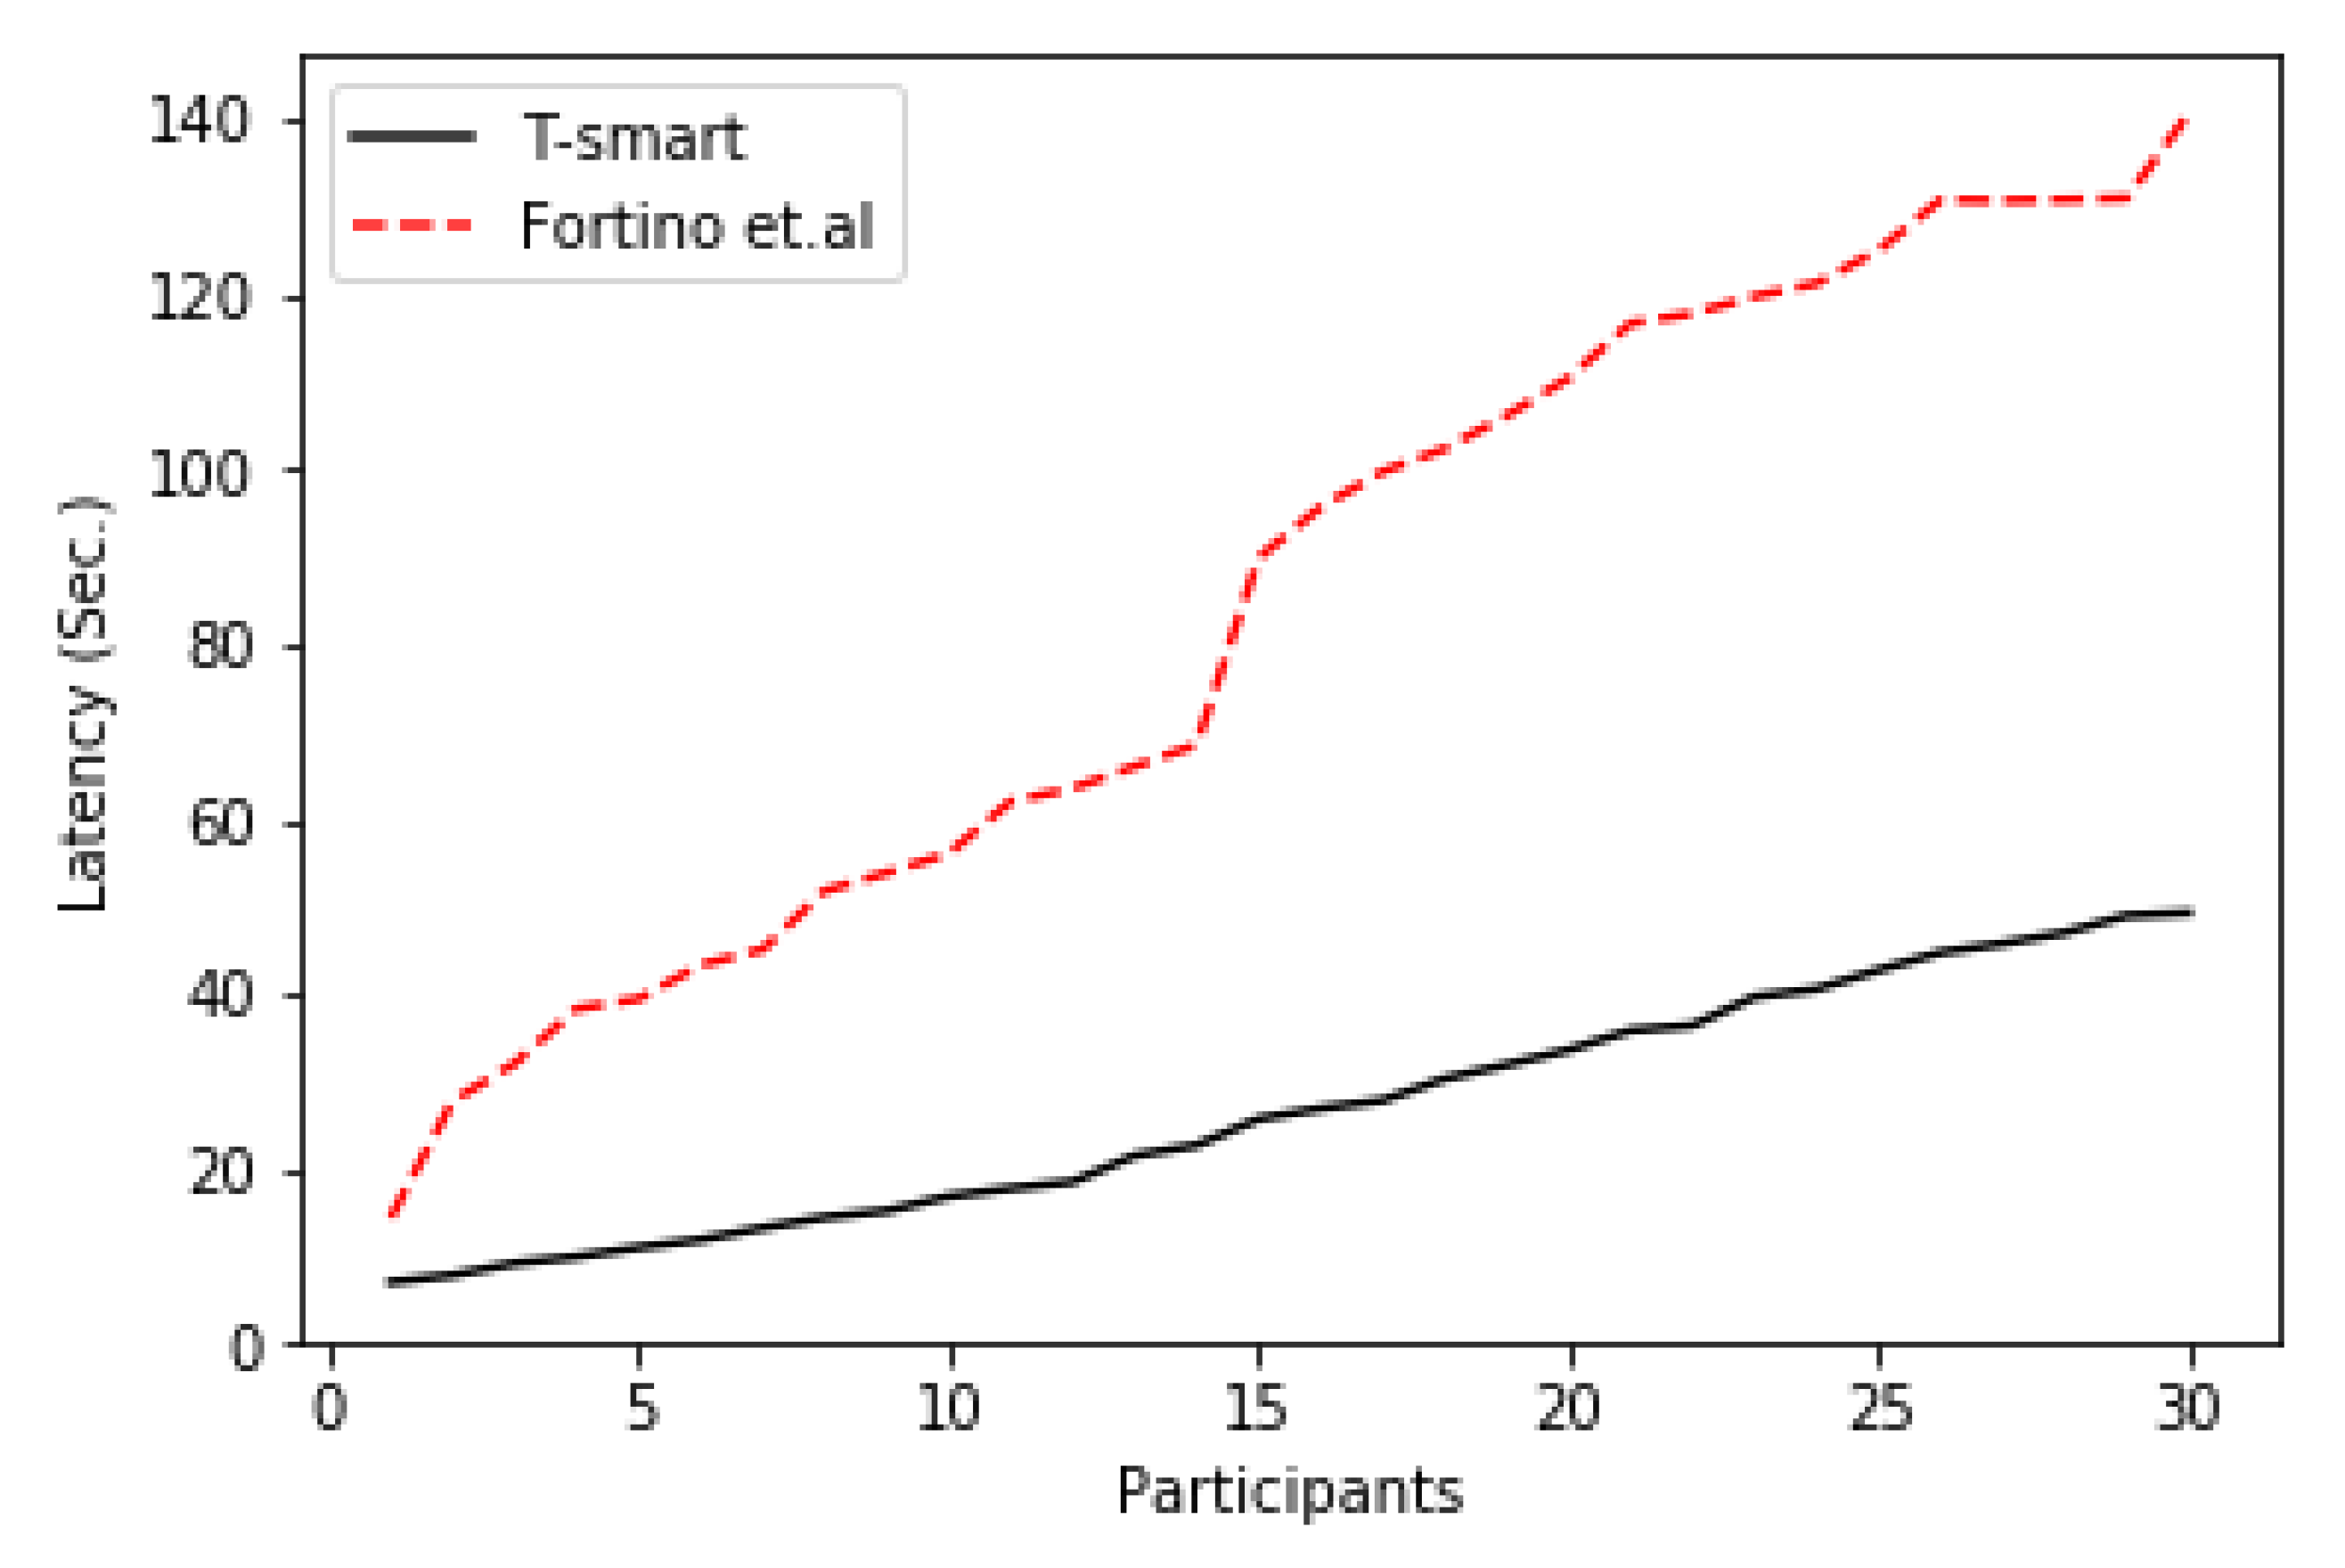
7.5. Average Transaction Latency
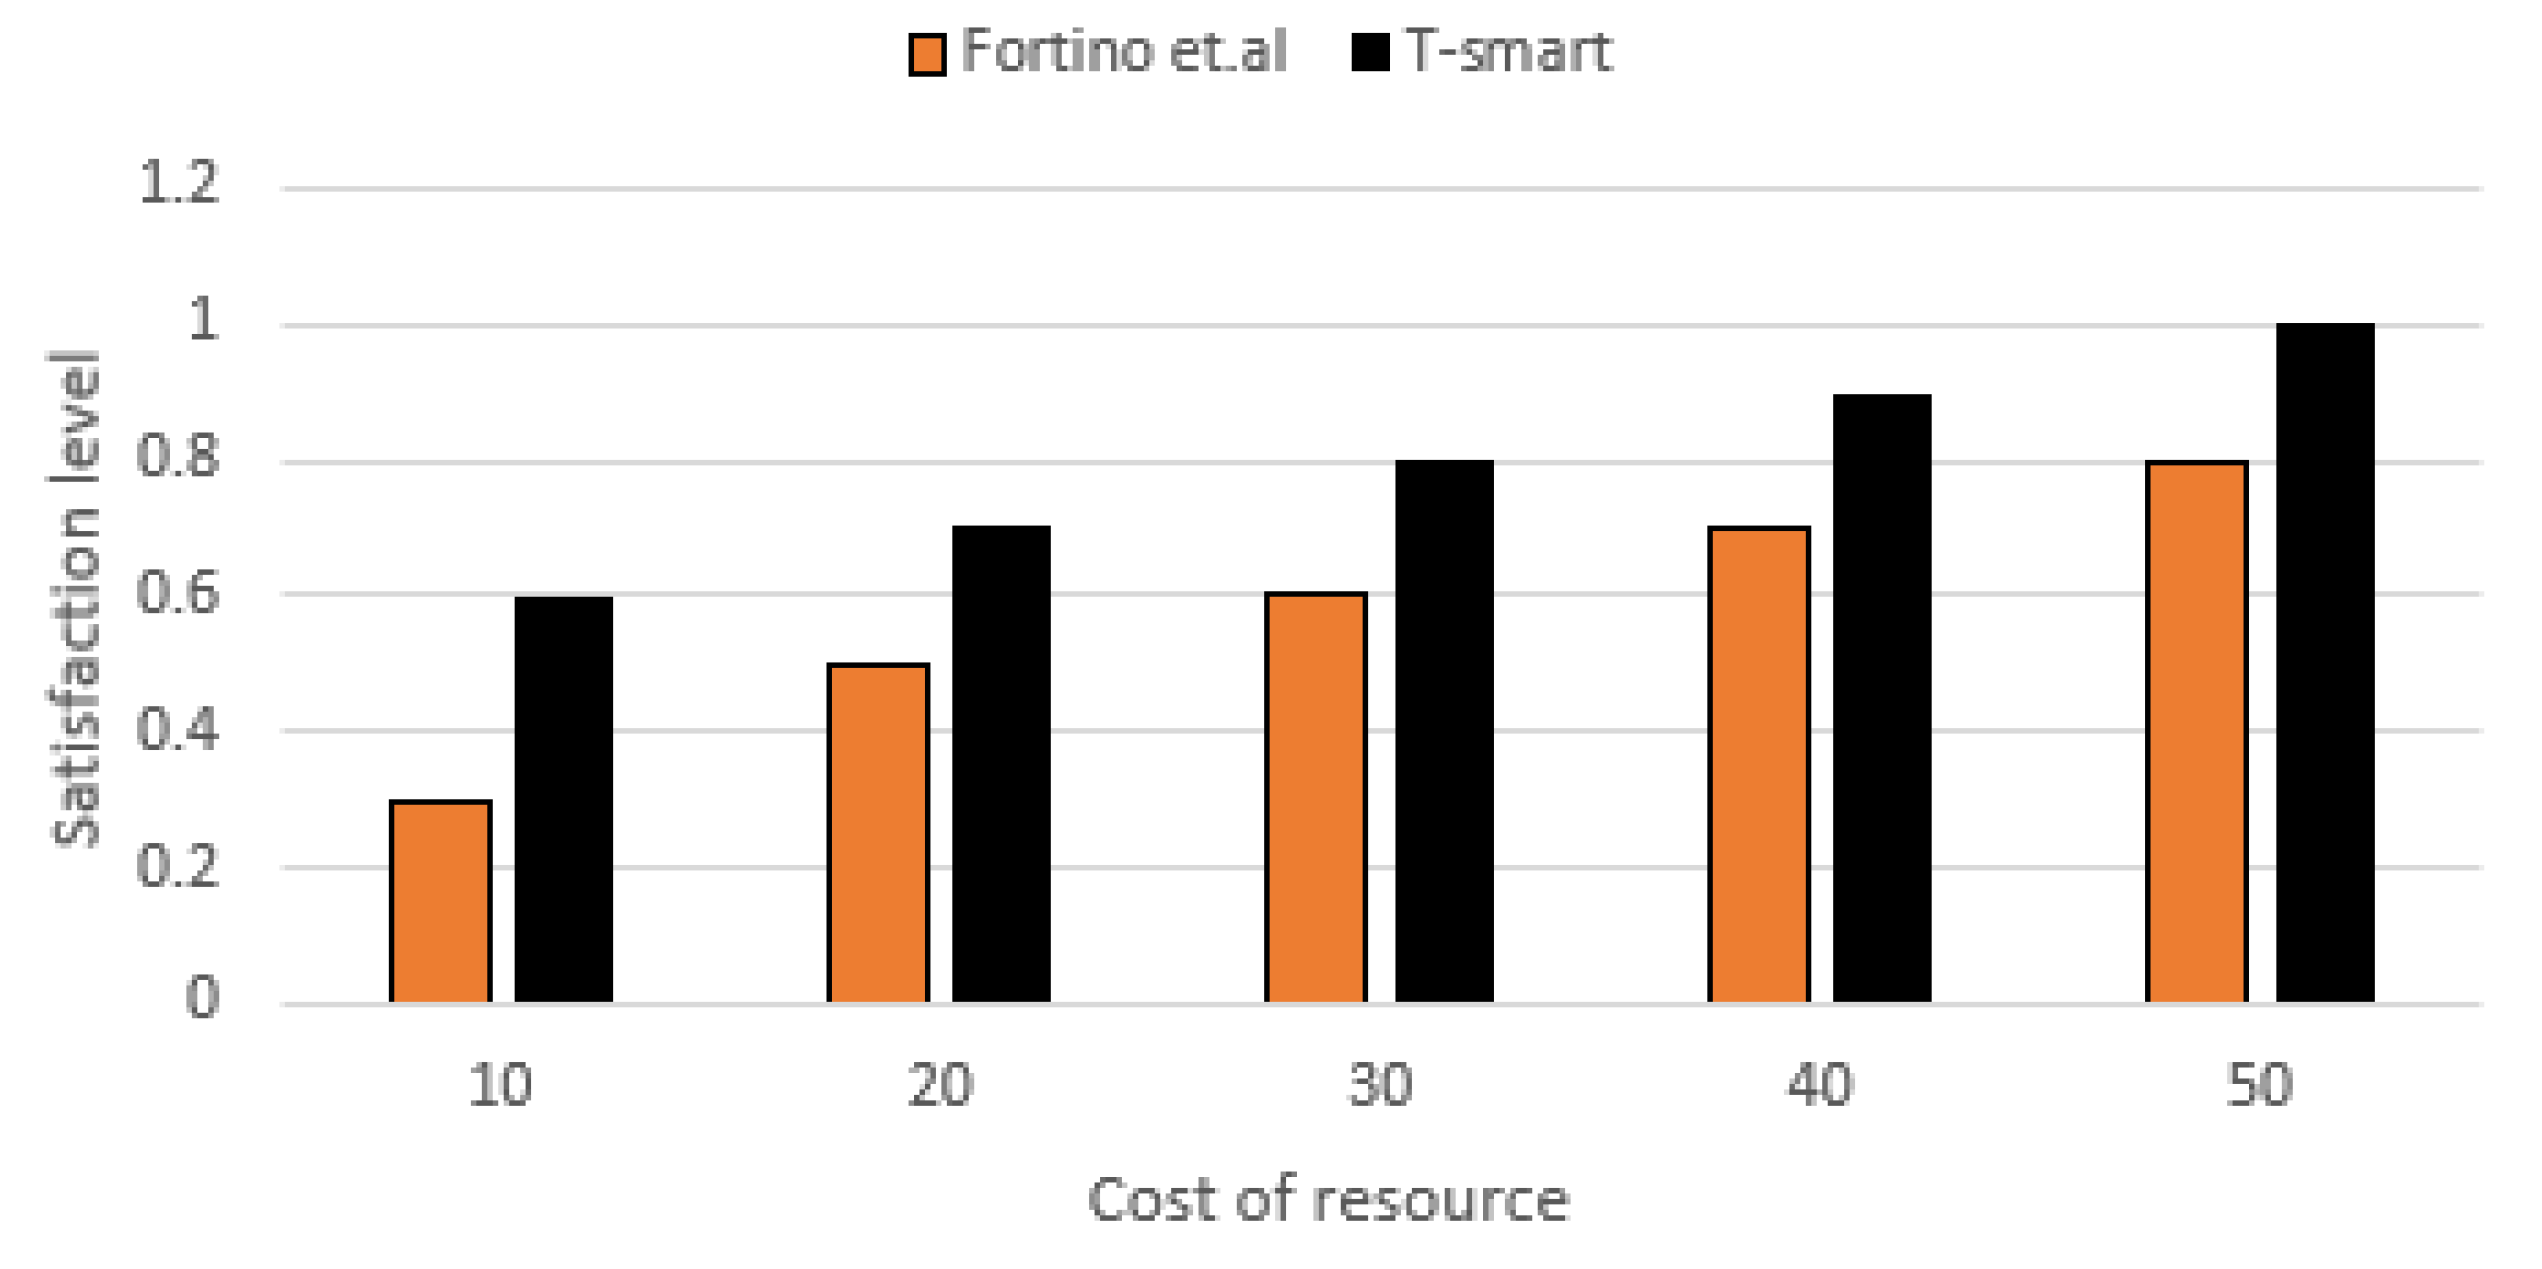
7.6. Satisfaction Level with Respect to Cost
8. Discussions
8.1. Business Environment
8.2. Useability
8.3. Limitations
9. Conclusions
Author Contributions
Funding
Institutional Review Board Statement
Informed Consent Statement
Data Availability Statement
Acknowledgments
Conflicts of Interest
References
- Yakubu, B.M.; Khan, M.I.; Javaid, N.; Khan, A. Blockchain-based secure multi-resource trading model for smart marketplace. Computing 2021, 103, 379–400. [Google Scholar] [CrossRef]
- Buterin, V. Ethereum White Paper. Etherum. 2014. Available online: http://buyxpr.com/build/pdfs/EthereumWhitePaper.pdf (accessed on 2 February 2021).
- Krishnamachari, B.; Power, J.; Kim, S.H.; Shahabi, C. I3: An IoT Marketplace for Smart Communities. 2018, pp. 9–10. Available online: https://dl.acm.org/doi/10.1145/3210240.3223573 (accessed on 7 February 2021).
- Aitzhan, N.Z.; Svetinovic, D. Security and Privacy in Decentralized Energy Trading Through Multi-Signatures, Blockchain and Anonymous Messaging Streams. IEEE Trans. Dependable Secur. Comput. 2018, 15, 840–852. [Google Scholar] [CrossRef]
- Khan, M.A.; Salah, K. IoT security: Review, blockchain solutions, and open challenges. Futur. Gener. Comput. Syst. 2018, 82, 395–411. [Google Scholar] [CrossRef]
- Yu, Y.; Li, Y.; Tian, J.; Liu, J. Blockchain-Based Solutions to Security and Privacy Issues in the Internet of Things. IEEE Wirel. Commun. 2018, 25, 12–18. [Google Scholar] [CrossRef]
- Kouicem, D.E.; Imine, Y.; Bouabdallah, A.; Lakhlef, H. A Decentralized Blockchain-Based Trust Management Protocol for the Internet of Things. IEEE Trans. Dependable Secur. Comput. 2020, 5971, 1–14. [Google Scholar] [CrossRef]
- Fortino, G.; Messina, F.; Rosaci, D.; Sarne, G.M.L. Using Blockchain in a Reputation-Based Model for Grouping Agents in the Internet of Things. IEEE Trans. Eng. Manag. 2019, 67, 1231–1243. [Google Scholar] [CrossRef]
- Chen, I.-R.; Guo, J.; Bao, F. Trust Management for SOA-Based IoT and Its Application to Service Composition. IEEE Trans. Serv. Comput. 2016, 9, 482–495. [Google Scholar] [CrossRef] [Green Version]
- Guo, L.; Zhang, C.; Fang, Y. A Trust-Based Privacy-Preserving Friend Recommendation Scheme for Online Social Networks. IEEE Trans. Dependable Secur. Comput. 2014, 12, 413–427. [Google Scholar] [CrossRef]
- Meng, X.; Liu, D. GeTrust: A Guarantee-Based Trust Model in Chord-Based P2P Networks. IEEE Trans. Dependable Secur. Comput. 2018, 15, 54–68. [Google Scholar] [CrossRef]
- Su, Z.; Liu, L.; Li, M.; Fan, X.; Zhou, Y. ServiceTrust: Trust management in service provision networks. In Proceedings of the IEEE 10th International Conference on Services Computing, SCC 2013, Santa Clara, CA, USA, 28 June–3 July 2013. [Google Scholar]
- Fortino, G.; Messina, F.; Rosaci, D.; Sarné, G.L. Using trust and local reputation for group formation in the Cloud of Things. Future Gener. Comput. Syst. 2018, 89, 804–815. [Google Scholar] [CrossRef]
- Fotia, L.; Messina, F.; Rosaci, D.; Sarné, G.M. Using Local Trust for Forming Cohesive Social Structures in Virtual Communities. Comput. J. 2017, 60, 1–11. [Google Scholar] [CrossRef]
- Di Pietro, R.; Salleras, X.; Signorini, M.; Waisbard, E. A blockchain-based trust system for the internet of things. In Proceedings of the ACM Symposium on Access Control Models and Technologies, SACMAT, Indianapolis, IN, USA, 13–15 June 2018. [Google Scholar]
- Alexopoulos, N.; Daubert, J.; Muhlhauser, M.; Habib, S.M. Beyond the hype: On using blockchains in trust management for authentication. In Proceedings of the IEEE International Conference on Trust, Security and Privacy in Computing and Communications (TrustCom), Sydney, NSW, Australia, 1–4 August 2017; pp. 546–553. [Google Scholar]
- Yang, Z.; Yang, K.; Lei, L.; Zheng, K.; Leung, V.C.M. Blockchain-Based Decentralized Trust Management in Vehicular Networks. IEEE Internet Things J. 2019, 6, 1495–1505. [Google Scholar] [CrossRef]
- Shaikh, R.A.; Jameel, H.; d’Auriol, B.J.; Lee, H.; Lee, S.; Song, Y.J. Group-based trust management scheme for clustered wireless sensor networks. IEEE Trans. Parallel Distrib. Syst. 2009, 20, 1698–1712. [Google Scholar] [CrossRef]
- Guo, J.; Chen, I.-R.; Tsai, J.J.P. A Mobile Cloud Hierarchical Trust Management Protocol for IoT Systems. In Proceedings of the 5th IEEE International Conference on Mobile Cloud Computing, Services, and Engineering, MobileCloud 2017, San Francisco, CA, USA, 6–8 April 2017. [Google Scholar]
- Hassan, H.; El-Desouky, A.I.; Ibrahim, A.; El-Kenawy, E.S.M.; Arnous, R. Enhanced QoS-Based Model for Trust Assessment in Cloud Computing Environment. IEEE Access 2020, 8, 43752–43763. [Google Scholar] [CrossRef]
- Bordel, B.; Alcarria, R.; Martín, D.; Sánchez-Picot, Á. Trust provision in the internet of things using transversal blockchain networks. Intell. Autom. Soft Comput. 2019, 25, 155–170. [Google Scholar] [CrossRef]
- Afonasova, M.; Panfilova, E.; Galichkina, M.A.; Ślusarczyk, B. Digitalization in Economy and Innovation: The Effect on Social and Economic Processes. Pol. J. Manag. Stud. 2019, 19, 22–32. [Google Scholar] [CrossRef]
- Nathan, R.J.; Victor, V.; Gan, C.L.; Kot, S. Electronic commerce for home-based businesses in emerging and developed economy. Eurasian Bus. Rev. 2019, 9, 463–483. [Google Scholar] [CrossRef]
- Lahkani, M.J.; Wang, S.; Urbański, M.; Egorova, M. Sustainable B2B E-Commerce and Blockchain-Based Supply Chain Finance. Sustainability 2020, 12, 3968. [Google Scholar] [CrossRef]
- Longo, R.; Podda, A.S.; Saia, R. Analysis of a Consensus Protocol for Extending Consistent Subchains on the Bitcoin Blockchain. Computing 2020, 8, 67. [Google Scholar] [CrossRef]
- Saia, R.; Carta, S.; Recupero, D.R.; Fenu, G. Internet of entities (IoE): A blockchain-based distributed paradigm for data exchange between wireless-based devices. In Proceedings of the SENSORNETS 2019—Proceedings 8th International Conference Sensor Networks, Prague, Czech Republic, 26–27 February 2019; pp. 77–84. [Google Scholar] [CrossRef]
- Rosaci, D.; Sarné, G.M.; Garruzzo, S. Integrating trust measures in multiagent systems. Int. J. Intell. Syst. 2012, 27, 1–15. [Google Scholar] [CrossRef]
- Guo, J.; Chen, I.-R.; Tsai, J.J. A survey of trust computation models for service management in internet of things systems. Comput. Commun. 2017, 97, 1–14. [Google Scholar] [CrossRef]
- Ahmed, A.I.A.; Ab Hamid, S.H.; Gani, A.; Khan, S.; Khan, M.K. Trust and reputation for Internet of Things: Fundamentals, taxonomy, and open research challenges. J. Netw. Comput. Appl. 2019, 145. [Google Scholar] [CrossRef]
- Resnick, P.; Zeckhauser, R.; Friedman, E.; Kuwabara, K. Reputation systems. Commun. ACM 2000, 43, 45–48. [Google Scholar] [CrossRef]
- Hendrikx, F.; Bubendorfer, K.; Chard, R. Reputation systems: A survey and taxonomy. J. Parallel Distrib. Comput. 2015, 75, 184–197. [Google Scholar] [CrossRef]
- Nitti, M.; Girau, R.; Atzori, L.; Pilloni, V. Trustworthiness management in the IoT: The importance of the feedback. In Proceedings of the 2017 20th Conference on Innovations in Clouds, Internet and Networks, ICIN 2017, Paris, France, 7–9 March 2017. [Google Scholar]
- Ben Saied, Y.; Olivereau, A.; Zeghlache, D.; Laurent, M. Trust management system design for the Internet of Things: A context-aware and multi-service approach. Comput. Secur. 2013, 39, 351–365. [Google Scholar] [CrossRef]
- Al-Hamadi, H.; Chen, I.-R.; Cho, J.-H. Trust Management of Smart Service Communities. IEEE Access 2019, 7, 26362–26378. [Google Scholar] [CrossRef]
- Yu, B.; Wright, J.; Nepal, S.; Zhu, L.; Liu, J.; Ranjan, R. Trust chain: Establishing trust in the iot-based applications ecosystem using blockchain. IEEE Cloud Comput. 2018, 5, 12–23. [Google Scholar] [CrossRef]
- Nitti, M.; Girau, R.; Atzori, L. Trustworthiness Management in the Social Internet of Things. IEEE Trans. Knowl. Data Eng. 2014, 26, 1253–1266. [Google Scholar] [CrossRef]
- Kim, T.-H.; Goyat, R.; Rai, M.K.; Kumar, G.; Buchanan, W.J.; Saha, R.; Thomas, R. A Novel Trust Evaluation Process for Secure Localization Using a Decentralized Blockchain in Wireless Sensor Networks. IEEE Access 2019, 7, 184133–184144. [Google Scholar] [CrossRef]
- Kochovski, P.; Gec, S.; Stankovski, V.; Bajec, M.; Drobintsev, P.D. Trust management in a blockchain based fog computing platform with trustless smart oracles. Futur. Gener. Comput. Syst. 2019, 101, 747–759. [Google Scholar] [CrossRef] [Green Version]
- Chen, I.-R.; Bao, F.; Guo, J. Trust-Based Service Management for Social Internet of Things Systems. IEEE Trans. Dependable Secur. Comput. 2016, 13, 684–696. [Google Scholar] [CrossRef] [Green Version]
- Breban, S.; Vassileva, J. Using Inter-agent Trust Relationships for Efficient Coalition Formation. In Advances in Artificial Intelligence. Canadian AI 2002; Cohen, R., Spencer, B., Eds.; Lecture Notes in Computer Science; Springer: Berlin/Heidelberg, Germany, 2002; Volume 2338. [Google Scholar] [CrossRef]
- Metamask. Brings Ethereum to Your Browser. Metamask Chrome Extention. 2019. Available online: https://metamask.io/ (accessed on 28 April 2021).
- Rinkeby Transaction Details. 2020. Available online: https://rinkeby.etherscan.io (accessed on 15 March 2020).


| Symbol | Description |
|---|---|
| Total number of participant in SMP | |
| z | Member of |
| Percentage of honest participants | |
| Minimum trust score given to participant p by another participant. | |
| Trust score given to p by another participant at time t | |
| Subset of honest and dishonest participants. | |
| Set of honest participants | |
| Weight of previous trust score | |
| Weight of individual feedback trust score | |
| Weight of aggregated feedback trust score | |
| Weight of commitment-based trust | |
| Predication for a participant | |
| The mean trust value of an honest participant , measured by all participants | |
| The mean trust value of a dishonest participant, measured by all participants |
Publisher’s Note: MDPI stays neutral with regard to jurisdictional claims in published maps and institutional affiliations. |
© 2021 by the authors. Licensee MDPI, Basel, Switzerland. This article is an open access article distributed under the terms and conditions of the Creative Commons Attribution (CC BY) license (https://creativecommons.org/licenses/by/4.0/).
Share and Cite
Waleed, M.; Latif, R.; Yakubu, B.M.; Khan, M.I.; Latif, S. T-Smart: Trust Model for Blockchain Based Smart Marketplace. J. Theor. Appl. Electron. Commer. Res. 2021, 16, 2405-2423. https://doi.org/10.3390/jtaer16060132
Waleed M, Latif R, Yakubu BM, Khan MI, Latif S. T-Smart: Trust Model for Blockchain Based Smart Marketplace. Journal of Theoretical and Applied Electronic Commerce Research. 2021; 16(6):2405-2423. https://doi.org/10.3390/jtaer16060132
Chicago/Turabian StyleWaleed, Muhammad, Rabia Latif, Bello Musa Yakubu, Majid Iqbal Khan, and Seemab Latif. 2021. "T-Smart: Trust Model for Blockchain Based Smart Marketplace" Journal of Theoretical and Applied Electronic Commerce Research 16, no. 6: 2405-2423. https://doi.org/10.3390/jtaer16060132