Review

Current State of Japanese Cedar (Cryptomeria japonica D. Don) Pollen Information and Future Directions for Its Airborne Allergen Determination and Improved Pollen Monitoring

Department of Otolaryngology, Head and Neck Surgery, Faculty of Medicine, Yamagata University, Yamagata 990-9585, Japan
Aerobiology 2024, 2(1), 1-17; https://doi.org/10.3390/aerobiology2010001
Submission received: 7 October 2023 / Revised: 18 December 2023 / Accepted: 20 December 2023 / Published: 2 January 2024

Abstract

:
About 40% of cedar pollinosis patients living in the Yamagata Prefecture showed pollinosis symptoms before the first day of the pollen season, which was determined by Durham samplers, the standard sampler for pollen information in Japan. The amount of Cry j 1 (major cedar pollen allergen) per cedar pollen is reported to be six pg. This amount is difficult to measure using the ELISA method, so we applied the highly sensitive ESR radical immunoassay method to measure the allergen; now we can provide information for sensitive patients. It revealed that Cry j 1 exists in orbicles and tapetum. It is presumed that it is smaller than pollen, so it comes from a place where cedar are already in bloom. It is desirable to obtain real-time information on an hourly basis. Currently, information from automatic cedar pollen monitors is becoming main-stream. However, this monitor may count during snowfalls, Asian dust flying, etc., even when there was no apparent pollen examined with a microscope. This paper describes the current status of automatic cedar pollen monitors, their usefulness, and their advantages and disadvantages in comparison with results obtained by other methods of measurement. Lastly, the paper describes expectations for cedar pollen information in the future.

1. Introduction

In the 1980s, the number of patients with pollinosis due to Japanese cedar (cedar) pollen increased rapidly in Japan, and it became a social problem, and it was called a national disease. In the first half of 1990, “The cedar pollen information standardization committee” was established [1], and it became possible to obtain information of the same standard anywhere in the country. The standard is as follows: the airborne samples were collected by a Durham sampler, expressed as grains/cm2. The first day of cedar pollen season was defined as the first day when ≥1 pollen grain/cm2 was observed for ≥2 days. The end day was one day before the first day that 0 pollen grains/cm2 days continued for ≥3 days. As an example, Figure 1 shows the total number of pollen for each year that we have measured in Yamagata City for 41 years from 1983 to this year (2023). In the 1980s, large numbers of pollen were seen every 2 to 3 years. In years when the number was low, the total number was a three-digit value. After 2010, there were no more three-digit years.
Currently, the “NPO Pollen Information Association” serves as the core of the nationwide monitoring system and distributes the data to pollinosis patients and medical institutions on its website. Data are also being disseminated through automatic cedar pollen monitors operated by the government (Ministry of the Environment) and the private sector.
Regarding the first day of cedar pollen season in each year, Sahashi has reported in the Japanese Journal of Palynology every year as “cedar pollen front” namely, the start date of cedar pollen dispersal in each region on a map of Japan (for example, [2,3]). Cedar pollen season starts in the south of the Japanese archipelago and moves north. The information has the advantage that it can be used on the same basis anywhere in the country. Examples of the “cedar pollen front” are shown in Figure 2a,b (a; 6-year mean and b; this year (2023)).
In this way, cedar pollen monitoring and how to provide pollen scattering information have been improved. We are now in an era where we can obtain the necessary data in real-time through automatic cedar pollen monitors (details are described in Section 5). However, the question is how to provide information to sensitive patients who develop symptoms before the first day of cedar pollen season. About 40% of cedar pollinosis patients had already developed pollinosis symptom before the first day of cedar pollen season. This result was obtained from an analysis of a “pollinosis check sheet” provided by Weathernews Inc. (Chiba City, Japan). In this study, only patients who reported to have been “diagnosed with cedar pollinosis at the clinic/hospital” and live in Yamagata Prefecture from mobile phone location information were chosen as subjects to be considered as patients with cedar pollinosis allergy. The study was conducted over a four-year period from 2003 to 2006. Figure 3 shows the analysis results between the airborne Cry j 1 concentration and the symptom score obtained from the sheets [4]. Some of the patients began to show symptoms more than 1 month before the first day of cedar pollen season, on days distributed between late January and early-to-middle February (Table 1). The sheets are managed through mobile phones. It is like an electronic version of a pollen diary. Table 2 shows the relationship between the first day of cedar pollen season and the airborne Cry j 1 concentration at the time.
The most sensitive patients begin to have symptoms at 3 pg/m3, and many other sensitive patients begin to show symptoms at around 20 pg/m3. From these tables, it can be seen that it takes about 3 weeks from the time Cry j 1 reaches 4 pg/m3 to the first day of the season, and about 2 weeks from the time it reaches 20 pg/m3.
To investigate the airborne pollen concentration and the severity of symptoms in patients, the symptoms were classified into three cases: light, moderate, and severe cases based on the past symptoms. Namely, those who answered that “the cedar pollen season is very painful and severe pain” were classified as severe patients. Those who answered that “Symptoms were only seen in years when large amounts of cedar pollen was scattered” or “experience symptoms during a very limited period of the cedar pollen season” were classified as mild patients, and those who do not fall into either of these categories were considered moderate patients. The result is shown in Figure 4.
Following Weber–Fechner’s law that the amount of sensation (symptom score) is proportional to the logarithm of the amount of stimulation, the number of cedar pollen was expressed as a logarithm. In moderate cases (number of cases; 220), symptoms began to appear from approximately the first day of the cedar pollen season. The most severe symptoms appeared when the pollen count was the highest. In light cases (number of cases; 555), symptoms appeared slightly later than they did for moderate cases. Similarly, symptoms became the most severe when the pollen counts were the highest. Meanwhile, for severe cases (number of cases; 1345), symptoms were already observed from the time at which small numbers of pollen were scattered and plateaued at a certain pollen concentration. Many severe cases were sensitive patients who exhibited symptoms before the first day of cedar pollen season. In this case, it is unclear whether there is an upper limit of the airborne Cry j 1 concentration to the onset of symptoms, or whether it is due to the therapeutic effect of using medication. appropriately. In any case, in order to accurately notify the timing of the onset of symptoms in such sensitive patients, ultrasensitive allergen measurements such as ESR radical immunoassay described later are useful for sensitive patients in times like these, but cost and promptness are an issue. We will touch on countermeasures and possible future solutions in the discussion section.
In the first half of this review, I will focus on airborne pollen allergens (mainly Cry j 1) before the onset of cedar pollen scattering, when sensitive patients develop symptoms. Namely, “does only cedar pollen cause cedar pollinosis?” “Is the amount of cedar pollen allergen always proportional to the number of cedar pollen?” To clarify these questions, a method to measure airborne cedar pollen allergen was established and compared with daily cedar pollen counts.
In the second half, the future of pollen monitoring provided by automatic cedar pollen monitors and the remaining issues of providing data for the sensitive patients will be discussed. Residents want information on cedar pollen in the area where they live, and they desired detailed information as quickly as possible. Compared to countries where many types of pollen which causes pollinosis are scattered at the same time, in Japan, most of the pollen in the air during cedar pollen season is only cedar pollen. So, it was not difficult to bring the automatic cedar pollen monitor to the market.
Information on how much cedar pollen will be scattered this spring is important. The condition of male flowers varies greatly from year to year. A large amount of pollen scattering is expected in the years where the previous summer was extremely hot. This issue will be covered in Section 6

2. Do Cedar Pollen Allergens Appear before Cedar Pollen in the Air?

Is the amount of cedar pollen allergens always proportional to the numbers of cedar pollen? To clarify this question, we established a method to measure airborne cedar pollen allergens and compared it with daily cedar pollen counts. The existence of micronic allergens in pollen causes many pollinosis, such as Ambrosia [6], Betula [7,8], Gramineae [9], and cedar [10] pollen has been reported. Agarwal et al. [11,12] sampled air samples on fiberglass with a high-volume air sampler and quantified them with the RAST inhibition test. They said particulate aeroallergens may exist in amorphous forms as well as in pollen grains and fungal spores, and symptoms of allergic diseases presumably correlate with the total amount of allergen exposure. The causative agent of cedar pollinosis is cedar pollen allergens. Therefore, a more relevant parameter may be the actual concentration of airborne allergenic particles rather than pollen grains. Since Cry j 1 is the most causative allergen in the pollen, we decided to target this allergen.
In order to answer the question, “Are airborne cedar pollen and airborne cedar pollen allergens always proportional?”, from the analysis using Andersen multi-stage air sampler, Cry j 1 was detected even in small-sized fractions that did not contain cedar pollen, indicating the existence of a pollen-free amorphous form Cry j 1 [13]. Similar results were obtained with birch pollen and birch pollen allergen (Bet v) [14].
Schumacher et al. [15] developed a method for collecting allergens from the pollen of Bermuda grass of Gramineae in the air with a Burkard sampler (seven day recording volumetric spore trap). They transferred them to a nitrocellulose membrane, treated with FITC-labeled antibodies, and observed with a fluorescence microscope. We used their method to compare the number of cedar pollen allergens (Cry j 1) present in the air with that of cedar pollen. We transferred samples to a nitrocellulose membrane in the same way as they did. However, an enzyme-labeled antibody was used for visualization to allow visual confirmation. These Cry j 1-bearing particles can be seen as spots on the membrane [16,17]. Figure 5 is an example of visualized Cry j 1 spots.
We also checked if this immunoblotting technique is applicable to pollen other than cedar. Studies targeting the Lol p allergen in grassland yielded similar results [18] and similar results were also obtained in a study targeting the birch Bet v allergen conducted in Turku, Finland [7]. We also tried using human IgE antibodies from cedar pollinosis patients instead of monoclonal antibodies [19]. This can be applicable not only to pollen, but also to fungi (Cladosporium) [20] and mites [21]. We also developed a method to automatically count the number of spots [22]. It became possible to count spots automatically and to obtain the number of spots easily. It is reported that the number of spots is larger than the number of pollen in Bermuda grass [15].
Is there a way to tell which spots are pollen-derived and which are non-pollen spots? Razmovski et al. [23] used samples from the Burkard sampler to allow direct microscopic observation of the particles from which the spots originated. Melinex tape is usually used to collect air samples, but instead of this, acrylic pressure-sensitive adhesive tape (Avery Dennison, Painesville, OH, USA) and PVDF membrane (Amersham Life Science, Hybound type) were used. An antigen–antibody reaction was performed in an aqueous solution while the particles were pressed to identify whether or not the particles possessed the allergen [24]. An example is shown in the illustration of Figure 6 (cedar pollen) and Figure 6 (Gramineae pollen). As seen in Figure 6, cedar pollen (a–c) has dark spots in the center around the pollen, and thinner spots towards the periphery. Spots with a dark center and a thin periphery can be seen even in particles smaller than pollen (d and e). There were also spots where no particles were found (an example: dotted circle in Figure 6a). Similar results were obtained with the grass pollen allergens (Figure 7) [24].
It was investigated whether this immunoblotting technique could be applicable to pollen allergens other than cedar pollen allergen. Studies targeting the Dac g allergen in the urban area of Yamagata City yielded similar results (Figure 8).

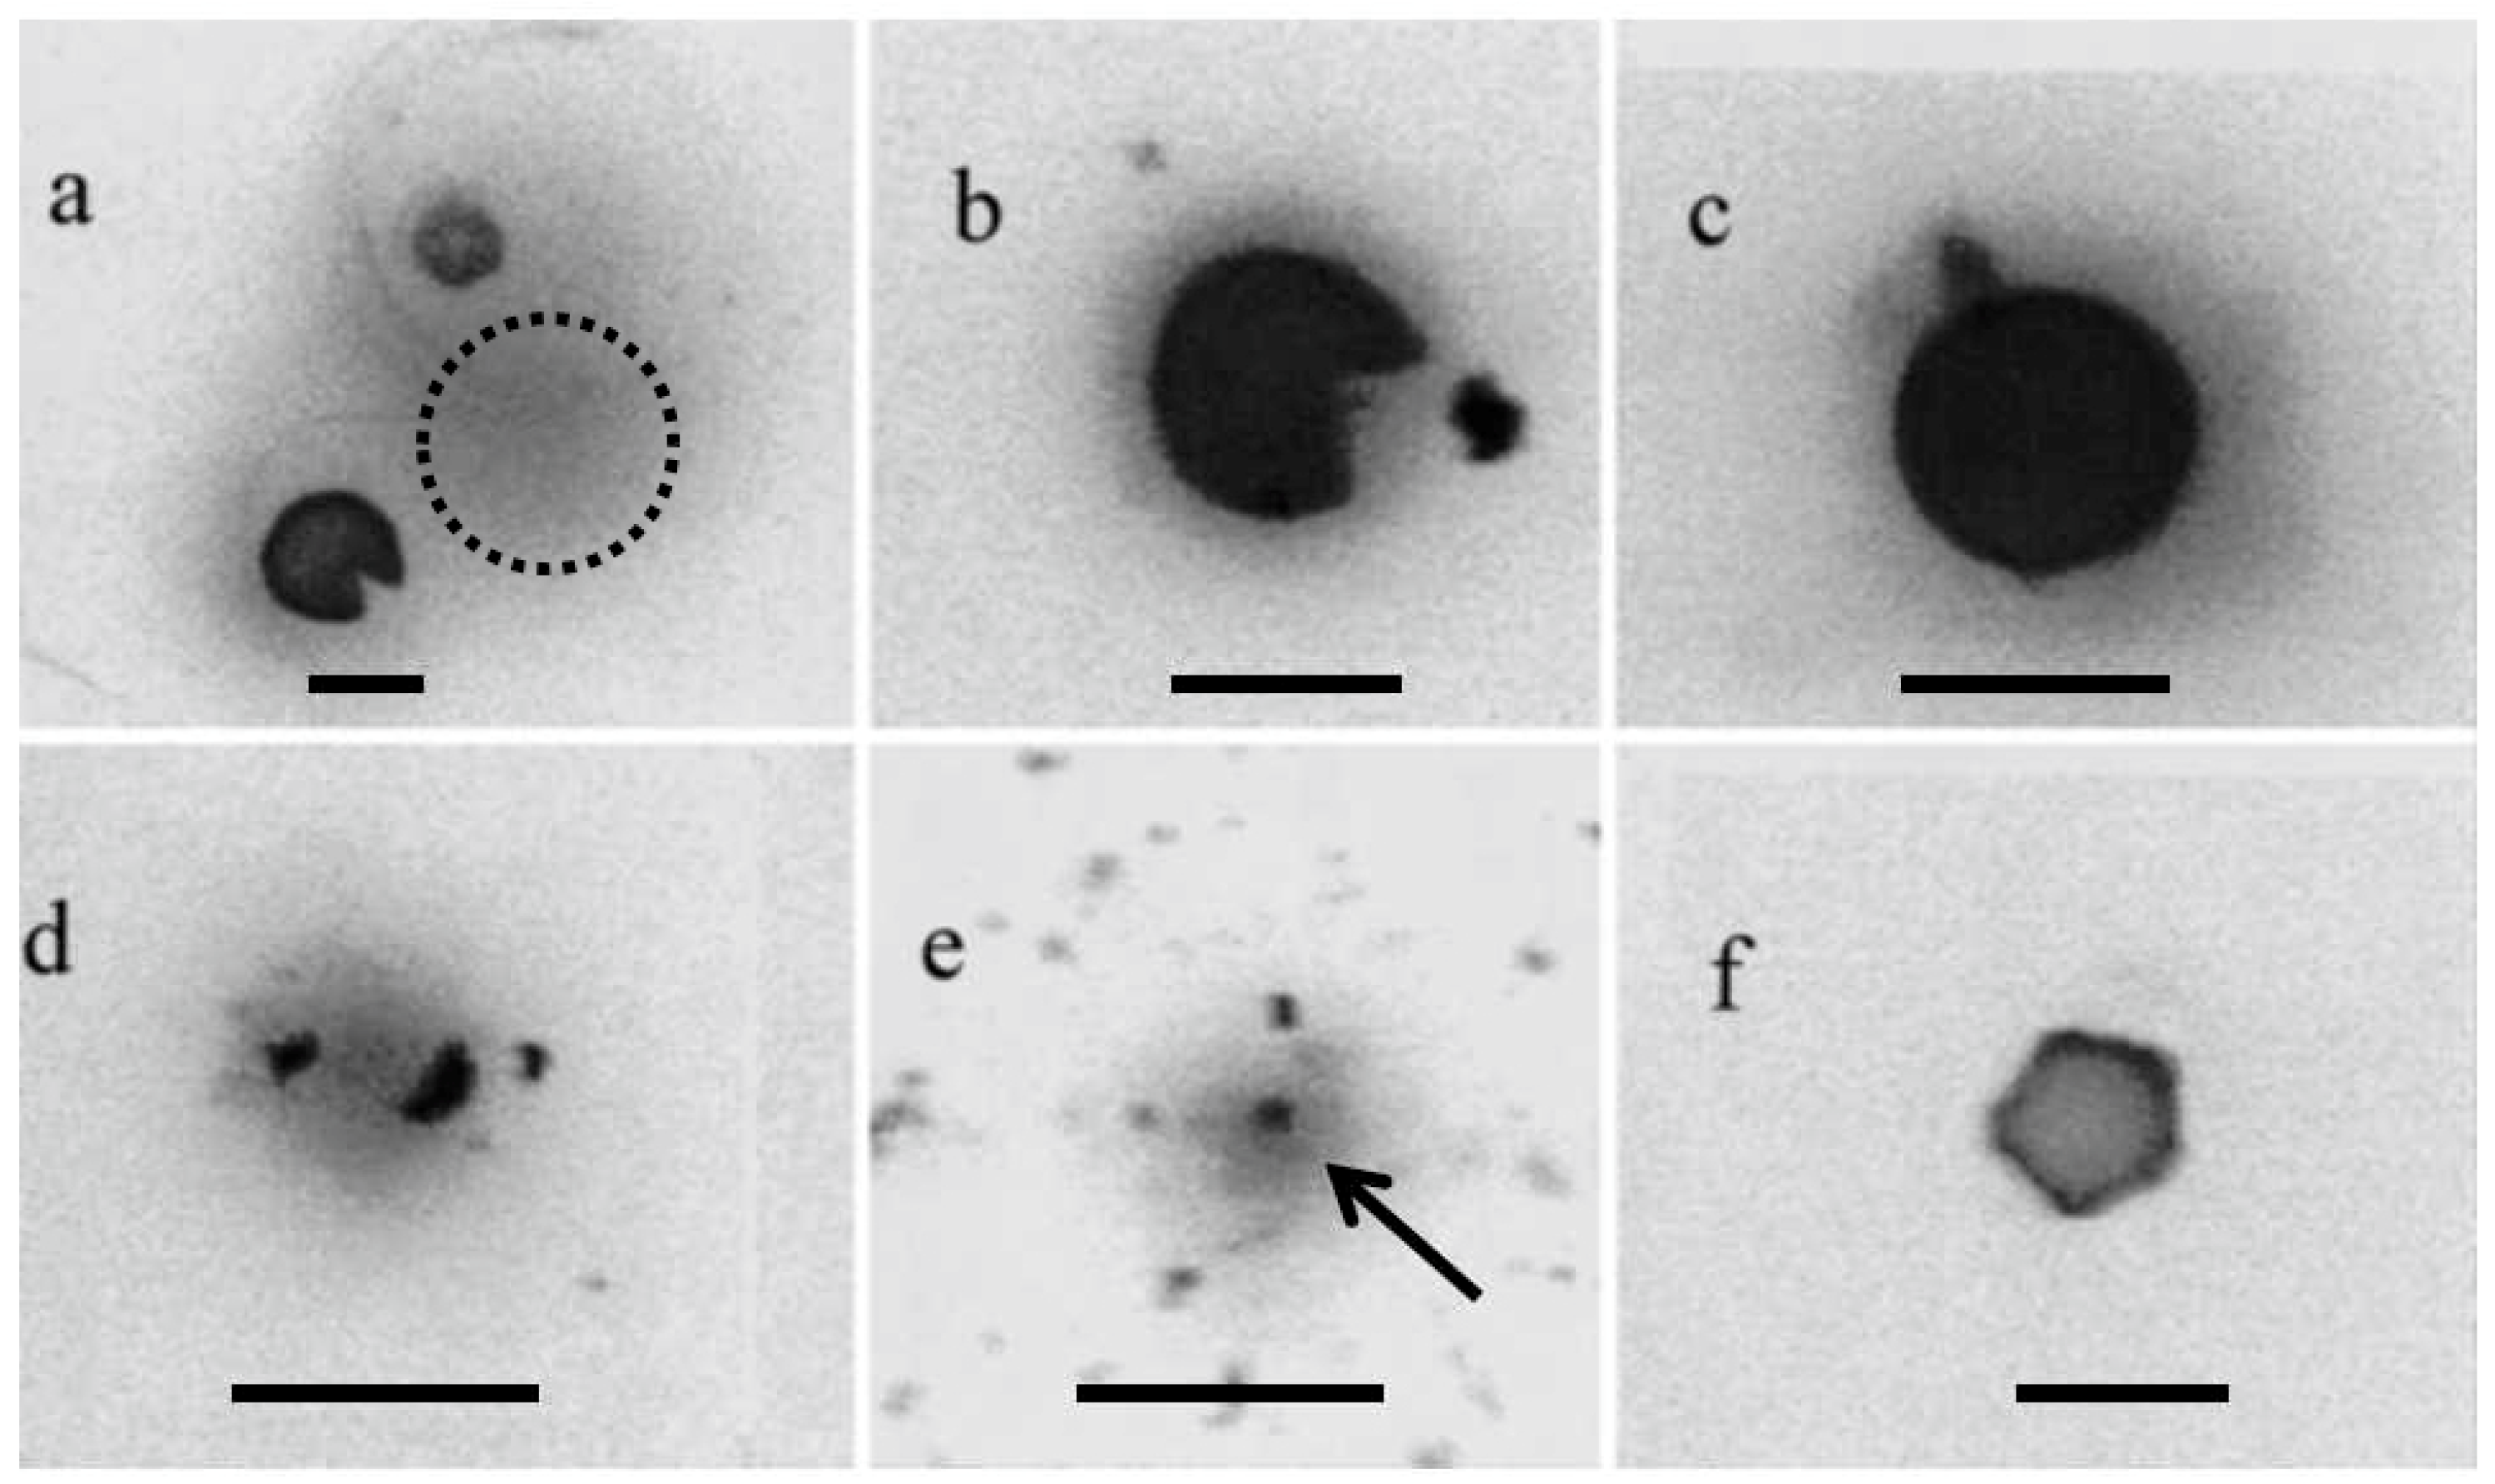
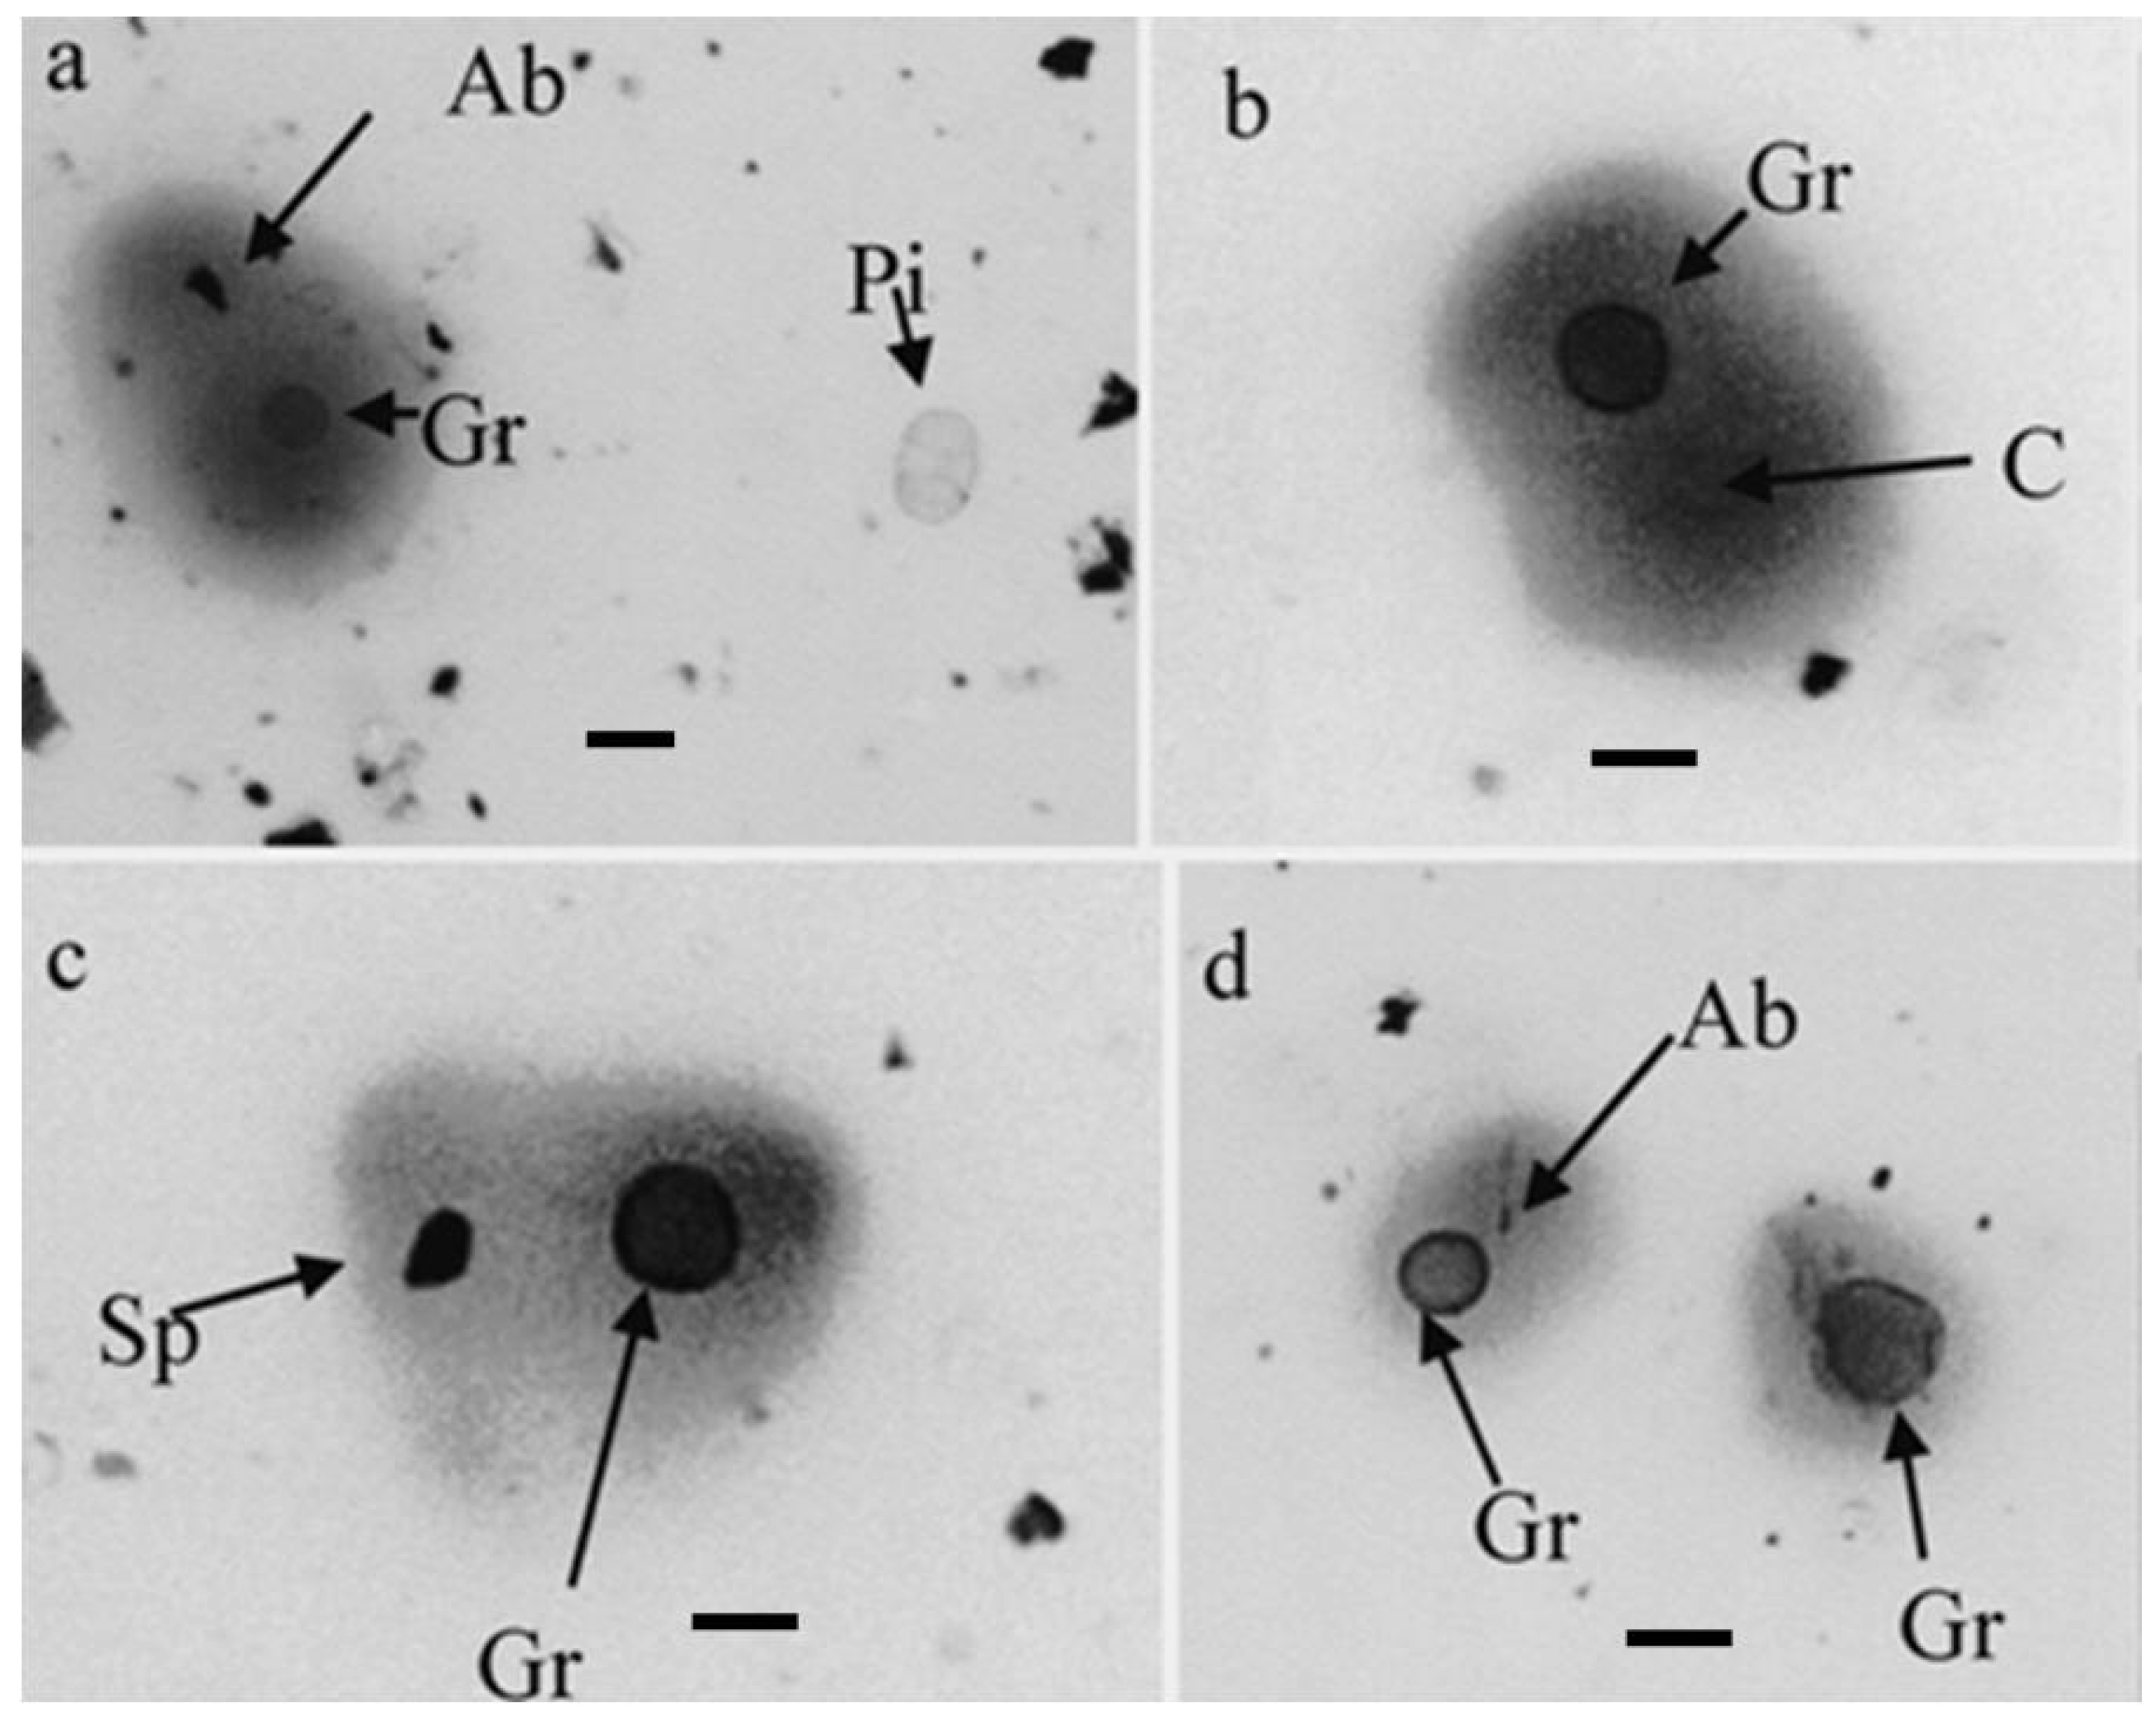
3. Particles Containing Cry j 1 Other Than Cedar Pollen Present in the Air

Then, what kind of cedar pollen allergens containing particles exist in the air before the pollen season? Cedar pollen is differentiated by the summer of the previous year. In order to know at what stage the male flower bud begins to produce cedar pollen allergens, we investigated the Cry j 1 (major cedar pollen allergen) level at each stage of the male flower bud from September of the previous year, the time male flower buds begin to differentiate (pollen tetrad), to March when dispersal begins (mature pollen). As a result, Cry j 1 was not detected at the tetrad stage, and even immature pollen in November was only 1/10 of the amount of Cry j 1 compared to mature pollen during the pollen season [26].
It is known that there are two kinds of allergens (Cry j 1 [27] and Cry j 2 [28]) in cedar pollen. It was revealed that Cry j 1 exists in orbicles on the surface of the sexine of the pollen by immunocytochemical studies. The origin is in the tapetum (the tissue surrounding tissue), where the Cry j 2 is present in starch granules in the cytoplasm [29,30]. Localization of cross-reactive allergens to Cry j 1 in the pollen grains of Cupressus arizonica and Cupressus sempervirens (Cupressaceae) has also been investigated, and the cross-reactive allergens were seen in the orbicles and wall [31]. The role of orbicles is also discussed in Betula [32].
There are fine particulate allergens (sometimes called subpollen or size-segregated allergenic particles), in addition to pollen, that cause pollinosis. They have been reported of ragweed [6,33], birch [7,8], grass [9] and cedar. They are subpollen particles (SPP) derived from pollen grains; fine particles might generate from wind induced mechanical rupture [34], orbicles simultaneously released from pollen during flowering [29,32], and starch granules released from pollen grains due to rain [35,36]. In the case of birch pollen, Bet v 1 is mainly found in the starch granules and, to a slight extent, in the orbicles and intine from immunocytochemical study [37,38]. Birch pollen grains were shown to germinate on leaves after light rain and release starch granules [39,40,41]. Asthma due to thunderstorms has also been reported [42]. Simultaneously, a rise in the allergen concentration in the air was measured without the presence of pollen grains [35,36]. In the case of Gramineae pollen, spots against Phl p 5 were present in high numbers, whereas the air contained almost no grass pollen grains [8]. Lol P 9, one of the Gramineae pollen allergens, is localized in starch granules [40]. Suphioglu et al. [43] found starch granules with Lol p 9 allergens released from rye grass pollen in the air after rain. In the case of ragweed, pollen grains release subpollen particles (SPP) of respirable size upon hydration [33]. A similar phenomenon has been reported with birch and cypress pollen [39,44]. Pollen rupture is hypothesized to occur due to the allergens in the fine aerosol fraction (<5 μm). In addition, wind induced impaction might also generate SPP [44]. This release of fine particles from pollen due to rain, wind, etc., has been reported for various types of pollen that cause pollinosis. Wang et al. [44] have observed that higher concentrations of the allergenic Cry j 1 were detected in particle size equal to or less than 1.1 μm (PM 1.1) during Yellow Sand events, especially on rainy days, and the size-segregated cedar pollen allergenic particles increase after rainfall in large cities, as it is thought that the cedar pollen allergen attaches to air pollutants (for example, diesel exhaust gas) and floats in the air. They conclude that rainwater trapping Yellow Sand is one of the important factors that affect the release of allergenic pollen species of Cry j 1.

4. Ultrasensitive Measurement Method for Cry j 1 (ESR Radical Immunoassay)

Figure 9 shows the relationship between the numbers of cedar pollen in the air and the amount of Cry j 1 in 2008 (from 3 March to 25 April). Both values did not always match. This is because the Cry j 1 value includes fine particles that contain Cry j 1 in addition to cedar pollen. Correlation analysis from the first day to the end of cedar pollen season is r = 0.543 (moderate correlation, n = 46, p < 0.1) in 2008 [45]. The dashed line box indicates the amount of Cry j 1 at the time when sensitive cedar pollinosis patients exhibited symptoms (from 26 January to 28 February), which occurs before the cedar pollen season. Most sensitive cedar pollinosis patients began experiencing symptoms in the period indicated by the dashed square. Many sensitive patients begin to develop symptoms at airborne concentrations of Cry j 1 about 3 to 20 pg/m3. Conventional ELISA kits had a sensitivity of 150 to 250 pg/mL [27,46]. This amount is difficult to measure with the kits. This method would be difficult even with other pollen, for example birch pollen: 3.2 pg Bet v 1/pollen [47].
ESR radical immunoassay solved this problem [48]. In a broad sense, this assay is an ELISA because it uses an HRP antibody as a secondary antibody. Usually, a chromogenic substrate is used as the enzyme substrate and is quantified using a spectrometer. Here, a stable radical substrate is used instead of a chromogenic substrate. Radicals are unstable substances, but the reaction product (nitroxide radical) is a stable radical. In this method, an extracted air sample is placed on an anti-Cry j 1 antibody plate (solid phase) and reacted. After the reaction, it is washed and reacted with an HRP (Horseradish peroxidase)—labeled Cry j 1 antibody (secondary antibody). The amount of nitroxide radicals generated as a result of the enzymatic reaction is measured using an ESR (electron spin resonance) device. The amount of Cry j 1 is proportional to the amount of nitroxide radicals. This method was originally developed as an ultra-sensitive measurement method for hepatitis viruses and applied to quantify airborne pollen allergens. Conventional methods require at least 13 pollen grains to be detected, but this method is 100 times more sensitive and can detect even one pollen grain or less. The detection limit was estimated to be 3.5 pg/mL and it is possible to measure 0.1 pg/m3 of airborne Cry j 1 in a sample which needs 30 μL for each measurement. It became possible to measure a very small amount of Cry j 1 before the first day of cedar pollen season [48]. Rantio-Lehtimaki et al. [7] reported that sensitive birch pollen-allergic patients may experience symptoms when the allergen level reaches about 5 pg/m3 of Bet v 1. It seems that some patients become symptomatic at roughly the same airborne concentrations of Cry j 1 (cedar pollen) or Bet v 1 (birch pollen). According to a HIALINE study of five European countries, more than 10-fold differences in daily Bet v 1 release were measured, which could be explained by the long range transport of pollen with a deviating Bet v 1 release [49]. Long-distance transportation is possible even in Cry j 1 containing particles. Examining particles emitted from cedar with an Aerosizer, two peaks were obtained. One was the peak of cedar pollen, which had a particle size of 30–37 μm (the average was 34 μm). The other was fine particles of 0.6–1.2 μm (the average was 0.7 μm), and the number of fine particles was more than eight times that of cedar pollen [10]. The fine particulates are considered as ruptured pollen fragments containing the pollen allergens such as tapetum/exime debris and orbicles. They are thought to exist on the surface of pollen grains and allow the pollen grains to exist separately instead of clumping together [29,36]. Since the fine particulates are smaller than pollen, it is thought that they come from a place where cedar is already blooming and cedar pollen cannot be reached [29].

5. Detailed Pollen Monitoring by Real-Time Pollen Monitors

In Japan, pollen other than cedar pollen is rarely seen during the cedar pollen season. Especially during the first half of the dispersal period, most of the airborne pollen is cedar pollen. Even in the latter half of the season, most of it is cedar pollen though there are some areas where cypress pollen is scattered. Therefore, cedar pollen monitors were devised not to identify and count pollen morphology, but instead to identify the size of suspended particles. A laser beam is applied and the intensity of the reflected light is related to size, which is used to determine whether the particle is of interest or not. In order to select spherical particles, beams are irradiated from both vertical and horizontal directions to select pollen grains.
Based on this idea, several types of automatic cedar pollen monitors have been developed Figure 10 [50,51,52,53]. The first monitors developed (Figure 10a,d) had the suction port facing upward. This is because the Durham sampler, which has become a standard sampler, is a sampler that captures naturally falling pollen. These automatic monitors have a good correlation with the Durham sampler and the Burkard sampler, except when it is snowing or when Yellow Sand is coming. Pollen Robo has a suction port at the bottom (Figure 10c). Figure 10e shows the exterior (outer box) of PS2 pollen sensor by Shin’ei Technology Co. Ltd. Kobe City, Japan. The dashed line box shown on the top left in the figure is the sample suction/measurement part. Because it is attached to the outer box when used, suction can be carried out from various directions. Miki et al. [54] are investigating the effect of orientation of the air inlet and the presence of obstacles near the monitor on airborne pollen concentration. As a result, if the air inlet has a vertical orientation, there is a risk of measurement errors in pollen concentration that are proportional to the vertical wind speed.
In my experience, the type with the suction port at the bottom is harder to count particles with, other than cedar pollen, but that does not mean it does not count them at all. Then, a type with the suction port at the bottom is preferable since it does not count much during snowfall. The monitor that attracts attention is the “Pollen Robo” developed by Weathernews Inc. One thousand monitors are lent out to volunteers all over Japan every year. Detailed hourly data can be provided in near real-time. “Pollen Robo” is a reliable device during the full-fledged pollen scattering season. The automatic cedar pollen monitor does not look at the cedar pollen itself, and it picks up spherical particles that are the same size as cedar pollen. The monitor developed by the Kowa Research Institute is no different from other monitors in that they measure size, but it also looks at fluorescence, so it does not count particles do not emit fluorescence. In Europe, various types of pollen that cause pollinosis are scattered at the same time, so there is a monitor that can morphologically identify and count each type of pollen [48,55,56]. These automatic pollen monitors look at the morphology of pollen, so they do not count any particles other than pollen. The Pollen Robo is a simple machine that is suitable for detailed data from multiple points, as 1000 monitors are deployed every year.
Is it possible to measure Cry j 1 in a short time, close to real-time if possible? This can be measured using the surface plasmon resonance phenomenon. Because pollinosis is an immediate-type allergic reaction, it develops immediately upon contact with the allergen (within 15 min at the latest). Namely, when pollen comes into contact with the nasal mucosa, allergens are immediately eluted in nasal discharge. Therefore, it is sufficient to extract a sample for a short time from the sample after sampling and send it for measurement. Measurement of eluted allergens with a surface plasmon resonance device yields immediate values [57]. However, the problem is the surface plasmon resonance device is expensive and not suitable for everyday information.

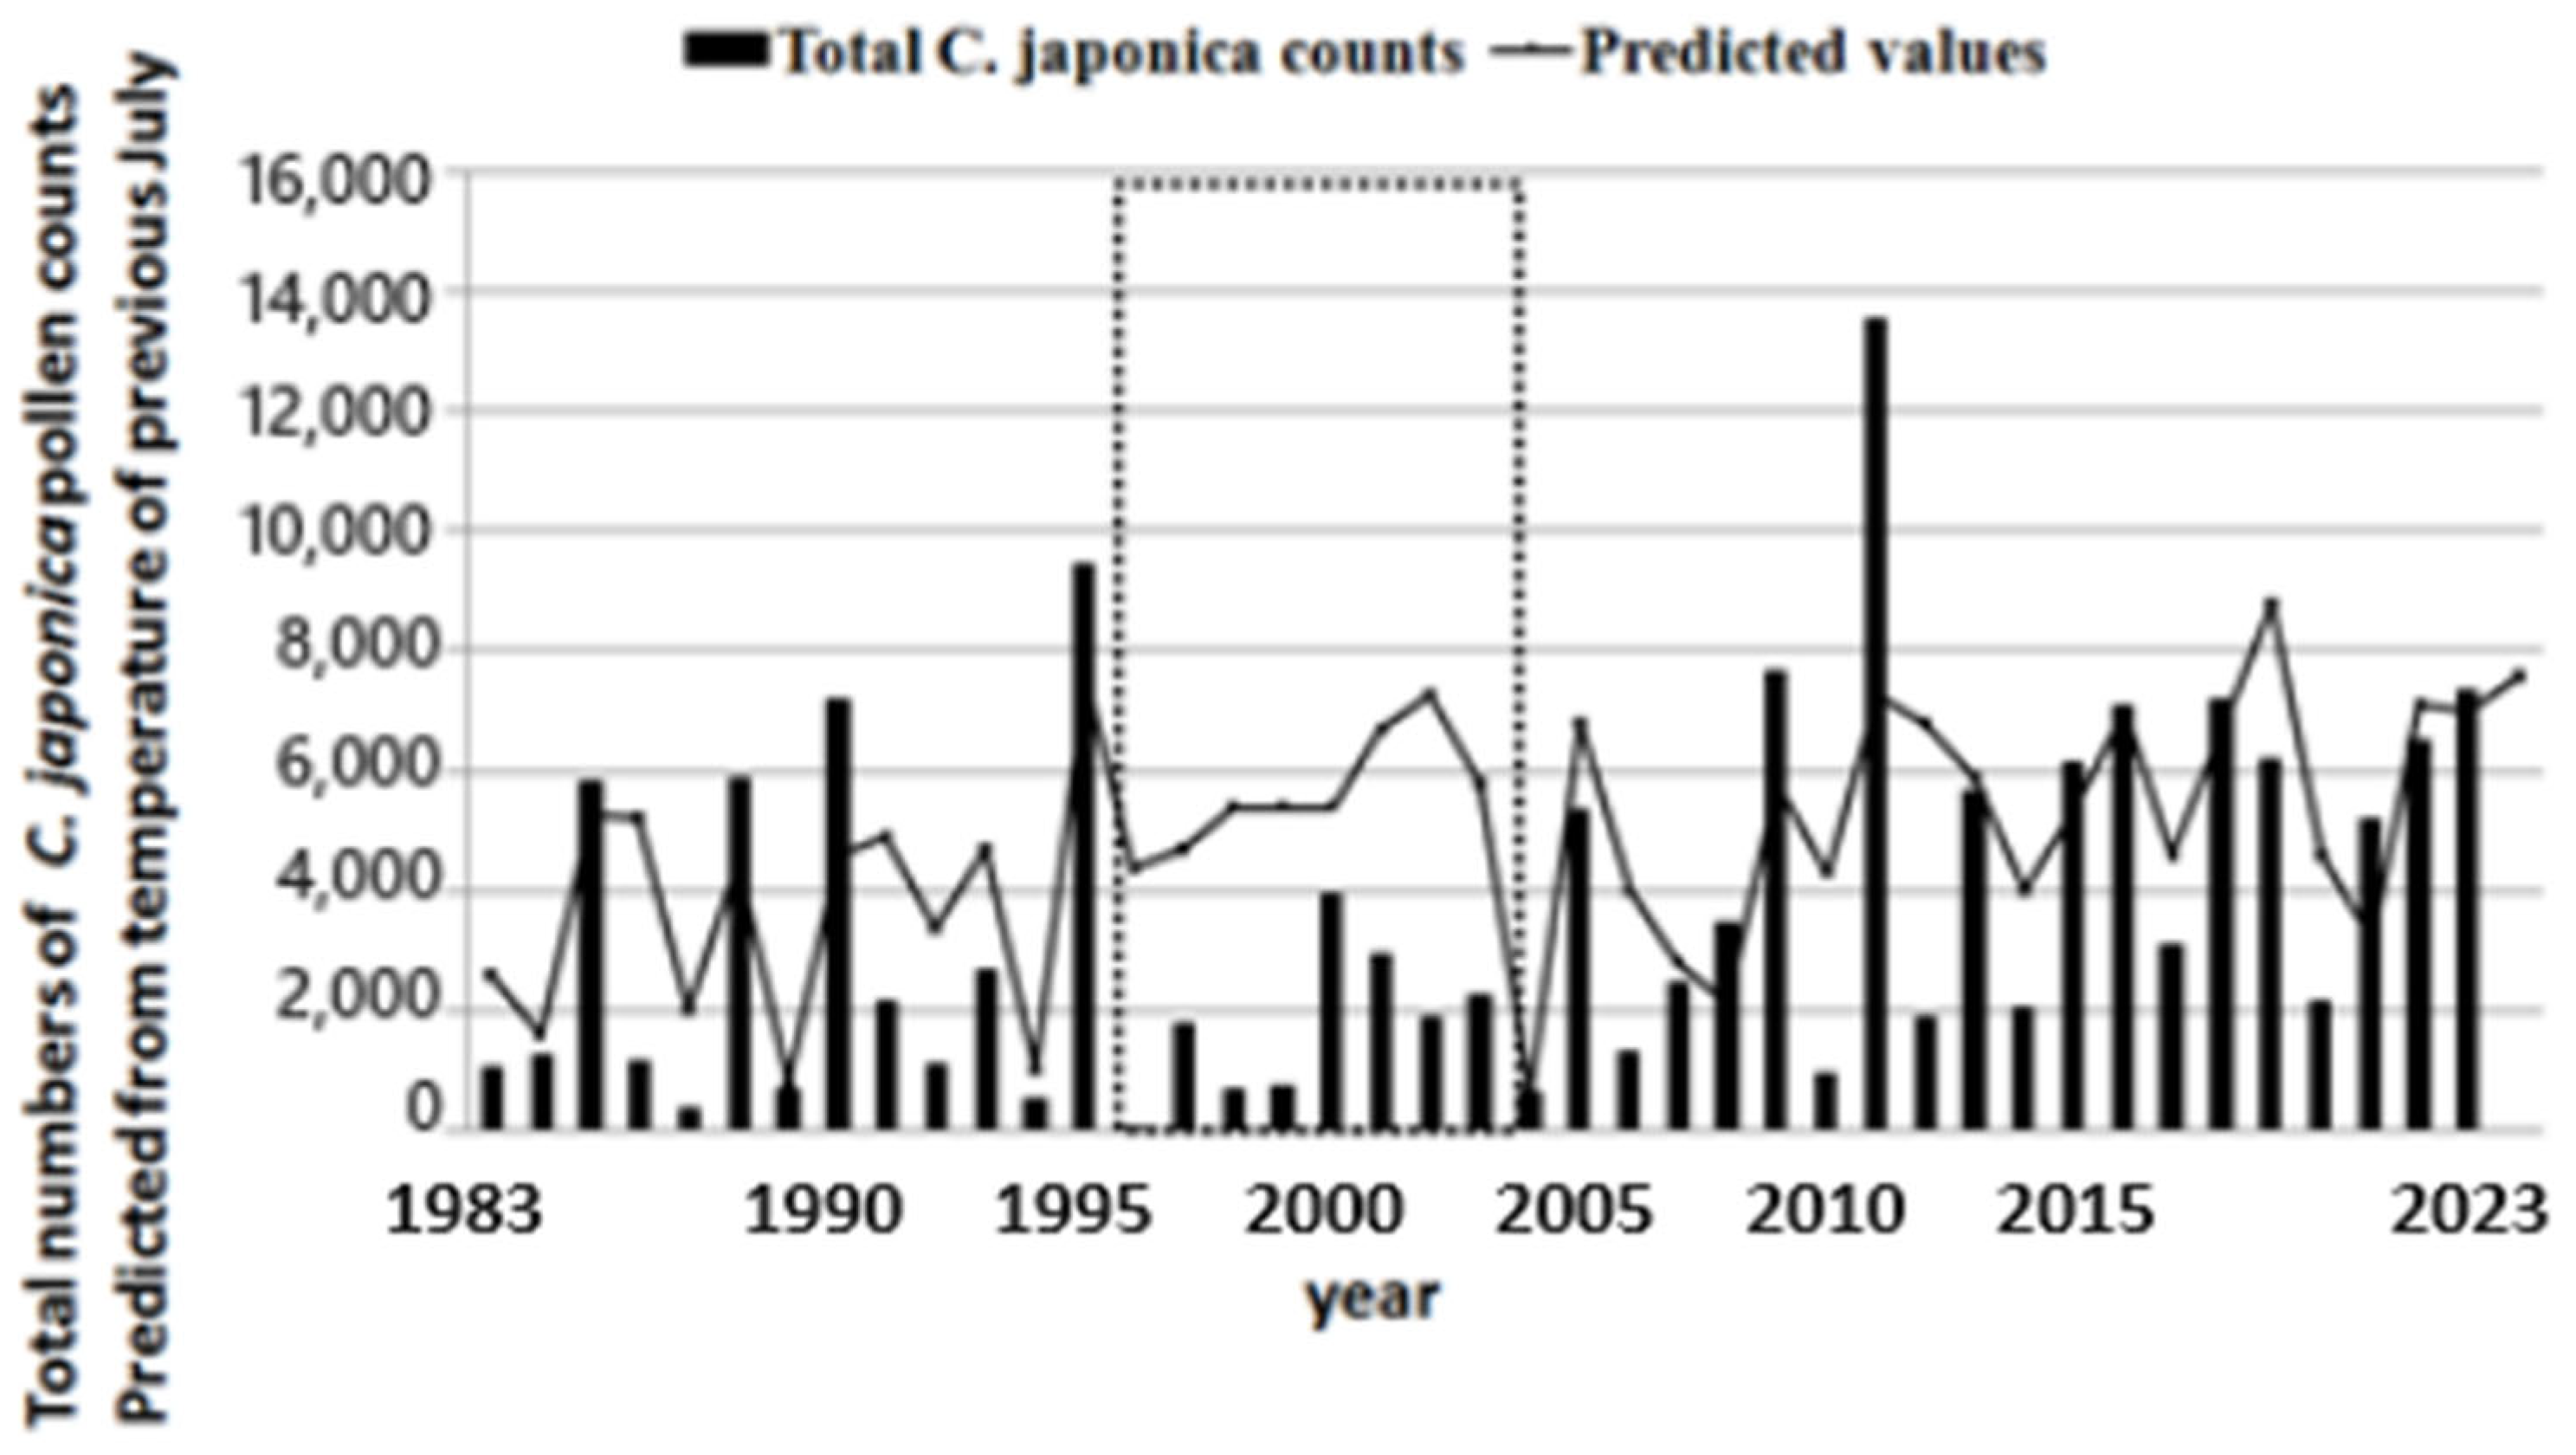
6. Method for Predicting the Total Amount of Cedar Pollen Scattered and Factors That Affect the Prediction

What modifies the amount of pollen scattered? There are two methods: one is based on weather conditions in the summer, and the other is determined by actually observing the condition of flower buds. Various studies conducted in the 1980s to 1990s found that higher temperatures, more sunlight, and less rain in the first half of the summer promote the formation of cedar flower buds. Nowadays, weather companies and pharmaceutical manufacturers use these predicted data to inform the amount of cedar pollen next spring as of this autumn. There are people all over the country who are commissioned by the “NPO Pollen Information Association” to observe male cedar pollen buds of the fixed points and predict the amount of pollen that will scatter next spring.
We plan to report on this subject separately, so we will describe here the results we experienced in Yamagata City. Figure 1 shows the total number of cedar pollen scattered for each year in Yamagata City from 1983 to 2023. The actual measured values are shown in a bar graph, and the predicted values based on the monthly average of the maximum daily temperature in July are shown in a line graph. Annual cedar pollen dispersal fluctuates greatly. As can be seen from the figure, the year after a large amount of pollen scattering, the pollen scattering was not as large as predicted. However, there were periods when this prediction did not necessarily apply (1996 to 2003, period indicated by the dotted line box in the figure). We used the maximum temperature of the previous year, but it was not applicable to all years. It seems that the condition of male flower buds was not good in the year following the year when a large amount of pollen was scattered, probably because the cedar tree strength was weakened.
Recently, another factor that affects the total pollen counts has been found. It is the passage of a cold front. Looking at the day when the most amount of cedar pollen was scattered during the season, it was during a time that a cold front was present, or within 2 h before or after its passage. It is speculated that a large amount of pollen was generated in areas where the temperature had risen by a passing warm front, and the generated pollen was carried by the cold front that followed, causing pollen enrichment prior to the cold front arrival [58]. Pollen enrichment has also been observed when pollen crosses mountain ranges [59]. On days like this, pollen is collected from a wide area in addition to pollen from the surrounding forests as usual. Therefore, the pollen count will be higher than expected (Details of this will be reported separately).
Out-of-season cedar pollen scattering was first reported in 1992 [60]. It is said that cedar trees go dormant due to the drop in temperature starting in December, and as temperatures rise around February of the following year, the dormancy is broken and they begin to scatter. Cedar trees that should bloom the following spring may bloom unexpectedly in years when autumn temperatures are abnormally high. It is mainly seen from November to December. It is also thought that immature male cedar flower buds bloom early (crazy blooming) without going dormant depending on the weather conditions. It increases in the fall of the year before mass dispersal. In 1995, many cedar pollen grains were scattered all over the country, but in the fall of the previous year, some people complained of symptoms of cedar pollen allergy. However, there have been no reports of many subsequent cases. There are still many things that we do not understand about autumn cedar pollen allergy, and this remains a challenge for the future [61].

7. Expectations for Cedar Pollen Information

In Japan, cedar pollen information began in the 1990s as nationally unified information obtained using a Durham sampler. Kishikawa et al. [62] also described the usefulness of the Durham sampler for cedar pollen information. Currently, information from automatic cedar pollen monitors is becoming mainstream. The information from this monitor has the advantage of being able to provide detailed hourly information almost in real-time, but this monitor may show a small number of counts during snowfalls, Asian dust flying, etc., even when there was no apparent pollen examined with a microscope. As mentioned above, about 40% of the pollinosis patients show pollinosis symptoms before the first day of the pollen season, so information during this period is important. Measurement by the ESR radical immunoassay is ideal, but the ESR measuring device is expensive, so it is not suitable for providing information in various places. As an alternative method, we developed the latex agglutination method [63] fluoro ELISA assay [64]. The measurement limit of these methods are ca. 10 pg/m3. As the result is presented in Table 2, it is possible to measure the airborne Cry j 1 on the first day of cedar pollen season in 5 out of 8 years from 2009 to 2016. Therefore, we believe that even simple methods can cover part of the period when sensitive patients develop symptoms. However, without information about Cry j 1, by exchanging information on the internet using mobile phones, it may be possible to figure out the timing of your onset. Weathernews Inc. is already running this kind of idea on their homepage. The following is currently being done: If you write your symptoms on their homepage by using a two-way communication system, you can find out how many cedar pollinosis patients are living in your area. Just by writing on their website whether you have the symptoms, you can find out the current status among people living in the same area. Although this is not currently being done, we could show the percentage of people who showed pollinosis symptoms (sensitive patients) on a map of Japan, just as Sahashi showed the front northward movement of cedar pollen on a map of Japan. If we could provide real-time information for patients who develop symptoms before the first day of cedar pollen season, it would be visually excellent information.

8. Discussion

Sensitive patients begin to develop symptoms when airborne Cry j 1 concentration reaches 1 to 20 pg/m3. The time is approximately two to three weeks before the cedar pollen season depending on the year and each patient. This is the time to begin medication for sensitive patients whose symptoms start before the pollen season, and also the time to start the provision of pollen information. Airborne Cry j 1 data was provided by Yamagata Prefecture from 2003 to 2016. These data were provided on the website of the Yamagata Prefectural Institute of Public Health. An example is shown in Figure 11. This data was actually posted on the website in 2015, the first day of the cedar pollen season for that year was March 1st, and the amount of Cry j 1 on that day was 200 pg/m3. A and B in Figure 11 are data before the cedar pollen season. These are useful data for sensitive patients, and we have created this information in the hope that it will serve as a guide to starting treatment or drug therapy. We have discussed the importance of Cry j 1 allergen monitoring as a means of providing for patients with sensitivity to cedar pollen.
In this review, we have mainly focused on Cry j 1 as an indicator of airborne cedar pollen allergen. A report including Cry j 2 other than Cry j 1 has been published recently [65]. According to the report, a weak correlation was found between the Cry j 1 and Cry j 2 concentrations, although the peak days differed. Measurement of Cry j 2 has not yet been established, unlike Cry j 1. In the report, samples were collected using a Durham sampler. Therefore, we cannot get new knowledge about Cry j 2 before the cedar pollen season which we talked about here. Cry j 3 is known to exist as a cedar pollen antigen, and further investigation will be necessary in the future.
In the case of cedar pollen, Cry j 1 is said to be present in the air even before the pollen season. How about pollen other than cedar pollen? In the case of Bet v allergen, Bet v allergen was also detected in the fraction that does not contain pollen. In this study, a tandem filter system is composed of a 5 μm pore filter and a 0.3 μm pore Millipore filter [14]. However, the amount of fine particulate allergens is only 1% of the total amount of Bet v allergen (below 5 μm is 244 ng in the 1998 survey). Bet v 1 allergen is mainly found in starch granules and, to a slight extent, in the orbicles and intine [32,38]. The majority of fine particulate allergens are considered to be ruptured pollen fragments and orbicles. Therefore, it makes sense that Bet v allergen may be found mainly in the fraction above the 5 μm pore filter. From the correlation analysis, a weak correlation (r = 0.501, n = 15, p < 0.1) was observed between the numbers of birch pollen and the amounts of birch pollen allergen collected on Millipore filters. This means that fine particulate Bet v allergens are also scattered at the same time as birch pollen.

9. Conclusions

Currently, monitoring data from automatic cedar pollen monitors is mainly used. In particular, 1000 Pollen Robo are installed in Japan every year, making it possible to obtain hourly real-time data near where people live. The problem is with the data around the time of the first day of the cedar pollen season. Automatic cedar pollen monitors do not identify pollen, so when only a few particles are scattered, it is impossible to distinguish between pollen and floating particles other than pollen. This year, a highly sensitive ELISA kit became commercially available. We hope that information provision to sensitive patients will progress in the future.

Funding

This research received no external funding.

Acknowledgments

Thank you to Ayumi Kusada, Shingo Ozu, Yuya Yamashita, Daisuke Abe, Daiki Miura and Shuji Imoto of Weathernews Inc. for providing the data from the mobile phone site “pollinosis check sheets”. We appreciate suggestive comments of three anonymous reviewes. We would like to thank editors who proofread the text and for English language editing.

Conflicts of Interest

The author declares no conflict of interest.

References

  1. Sahashi, N.; Kishikawa, R.; Nishima, S.; Nagano, H. Standardization of procedure for atmospheric pollen counts and pollen forecast in Japan. Jpn. J. Palynol. 1994, 39, 129–134. [Google Scholar]
  2. Sahashi, N.; Murayama, K. Change in the northward movement of the pollen front of Cryptomeria japonica in Japan, during 1986–1991. Allerg. Immunol. 1993, 25, 150–153. [Google Scholar]
  3. Sahashi, N. The Cryptomeria japonica Pollen Front in 2023 & Characteristics of cedar and Chamaecyparis obtusa Pollen Scattering. Jpn. J. Palynol. 2023, 69, 13–24. [Google Scholar]
  4. Takahashi, Y.; Aoyama, M.; Yoshitake, M.; Abe, E.; Ohta, N.; Sakaguchi, M. Relationship between airborne Cry j 1 and the onset time of the symptoms of Japanese cedar pollinosis patients. Allergol. Int. 2007, 56, 277–283. [Google Scholar] [CrossRef] [PubMed]
  5. Takahashi, Y.; Suzuki, Y.; Ohta, N.; Kakehata, S. Multi-point analysis of airborne Japanese cedar (Cryptomeria japonica D. Don) pollen by Pollen Robo and the relationship between pollen count and the severity of symptoms. Aerobiologia 2019, 35, 635–646. [Google Scholar] [CrossRef]
  6. Agarwal, M.K.; Swanson, M.C.; Reed, D.E.; Yunginger, J.W. Airborne ragweed allergens: Association with various particle sizes and short ragweed plant parts. J. Allergy Clin. Immunol. 1984, 72, 687–693. [Google Scholar] [CrossRef] [PubMed]
  7. Rantio-Lehtimäki, A.; Viander, M.; Koivikko, A. Airborne birch pollen antigens in different particle sizes. Clin. Exp. Allergy 1994, 24, 23–28. [Google Scholar] [CrossRef]
  8. Yli-Panula, E.; Takahashi, Y.; Rantio-Lehtimäki, A. Comparison of direct immuno staining and electroimmunoassay for analysis of airborne grass-pollen antigens. Allergy 1997, 52, 541–546. [Google Scholar] [CrossRef]
  9. Spieksma, F.T.M.; Nikkel, B.; Dijikman, J.H. Seasonal appearance of grass pollen allergen in cultural, micronic aerosol of various size fractions, relationship with airborne grass pollen concentration. Clin. Exp. Allergy 1995, 25, 234–239. [Google Scholar] [CrossRef]
  10. Takahashi, Y.; Sasaki, K.; Nakamura, S.; Miki-Hiroshige, H.; Nitta, H. Aerodynamic size distribution of the parti- cles emitted from the flowers of allergologically important plants. Grana 1995, 34, 45–49. [Google Scholar] [CrossRef]
  11. Agarwal, M.K.; Yunginger, J.W.; Swanson, M.C.; Reed, C.E. An immunochemical method to measure atmospheric allergens. J. Allergy Clin. Immunol. 1981, 68, 194–200. [Google Scholar] [CrossRef]
  12. Agarwal, M.K.; Yunginger, J.W.; Swanson, M.C. Immunochemical quantitation of airborne short ragweed, Alternaria, antigen E, and Alt-I allergens: A two-year prospective study. J. Allergy Clin. Immunol. 1983, 72, 40–45. [Google Scholar] [CrossRef] [PubMed]
  13. Takahashi, Y.; Sakaguchi, M.; Inouye, S.; Miyazawa, H.; Imaoka, K.; Katagiri, S. Existense of exine free airborne allergen particles of Japanese cedar (Cryptomeria japonica) pollen. Allergy 1991, 46, 588–593. [Google Scholar] [CrossRef]
  14. Takahashi, Y.; Sakaguchi, M.; Von-Pfaler, M.; El-Ghazaly, G. Relationship between numbers of birch pollen and dif- ferent particle sizes of the pollen antigens (Bet v) in the air in Stockholm, Sweden. Allergol. Int. 2003, 52, 111–114. [Google Scholar] [CrossRef]
  15. Schumacher, M.J.; Griffith, R.D.; O’Rouke, M.K. Recognition of pollen and other particulate aeroantigens by immunoblot microscopy. J. Allergy Clin. Immunol. 1988, 82, 608–616. [Google Scholar] [CrossRef] [PubMed]
  16. Takahashi, Y.; Nagoya, T.; Watanabe, M.; Inouye, S.; Sakaguchi, M.; Katagiri, S. A new method of counting airborne Japanese cedar (Cryptomeria japonica) pollen allergens by immunoblotting. Allergy 1993, 48, 94–98. [Google Scholar] [CrossRef] [PubMed]
  17. Takahashi, Y.; Sakaguchi, M.; Inouye, S.; Nagoya, T.; Watanabe, M.; Yasueda, H. Confirmation of the airborne pollen antigen carrying particles by immunoblotting. Allerg. Immunol. 1993, 25, 132–136. [Google Scholar]
  18. Takahashi, Y.; Sakaguchi, M.; Inouye, S.; Yasueda, H.; Shida, T.; Katagiri, S. Airborne grass pollen antigens in a grass- land as studied by immunoblotting with anti-Lol p1 antibody. Grana 1993, 32, 302–307. [Google Scholar] [CrossRef]
  19. Takahashi, Y.; Nilsson, S.; Berggren, B. Aeroallergen immunoblotting with human IgE antibody. Grana 1995, 34, 357–360. [Google Scholar] [CrossRef]
  20. Suzuki, S.; Takahashi, Y.; Yasueda, H.; Saito, A. Measurement of airborne Cladosporium spp. antigens by aeroallergen immunoblotting and the seasonal fluctuation. Arerugi 2008, 57, 1175–1181. [Google Scholar]
  21. Sakaguchi, M. Measurement of indoor airborne mite allergens. Allergol. Int. 2005, 54, 35–38. [Google Scholar] [CrossRef]
  22. Kawashima, S.; Takahashi, Y.; Aikawa, S. An attempt of applying the image processing for the automatic estimation of sampled airborne pollen. Arerugi 1995, 44, 1150–1158. [Google Scholar] [PubMed]
  23. Razmovski, V.O.; Meara, T.S.M.; Tovey, E.R. A new method for simultaneous immunodetection and morphologic identification of individual source of pollen allergens. J. Allergy Clin. Immunol. 2000, 105, 725–731. [Google Scholar] [CrossRef] [PubMed]
  24. Takahashi, Y.; Nagoya, T.; Ohta, N. Identification of airborne pollen and airborne particles with pollen allergens (Cry j 1, Dac g) by aeroallergen immunoblotting technique. Arerugi 2002, 51, 609–614. [Google Scholar] [PubMed]
  25. Takahashi, Y.; Aoyama, M.; Abe, E.; Aita, T.; Kawashima, S.; Ohta, N.; Sakaguchi, M. Development of electron spin resonance radical immunoassay for measurement of airborne orchard grass (Dactylis glomerata) pollen antigens. Aerobiologia 2008, 24, 53–59. [Google Scholar] [CrossRef]
  26. Takahashi, Y.; Mizoguchi, J.; Katagiri, S.; Sakaguchi, M.; Inouye, S.; Ishikawa, M.; Tonosaki, A.; Iwao, F. Development and distribution of the major pollen allergen (Cry j 1) in the male flower buds of Japanese cedar (Cryptomeria japonica). Arerugi 1989, 38, 1354–1358. [Google Scholar]
  27. Yasueda, H.; Yui, Y.; Shimizu, T.; Shida, T. Isolation and partial characterization of the major allergen from Japanese cedar (Cryptomeria japonica) pollen. J. Allergy Clin. Immunol. 1993, 71, 77–86. [Google Scholar] [CrossRef]
  28. Sakaguchi, M.; Inouye, S.; Taniai, M.; Ando, S.; Usui, M.; Matuhasi, T. Identification of the second major allergen of Japanese cedar pollen. Allergy 1994, 45, 309–312. [Google Scholar] [CrossRef]
  29. Miki-Hiroshige, H.; Nakamura, S.; Yasueda, H.; Shida, T.; Takahashi, Y. immunochemical localization of the allergenic proteins in the pollen of Cryptomeria japonica. Sex. Plant Reprod. 1994, 7, 95–100. [Google Scholar]
  30. Nakamura, S. Immunocytochemical localization of the allergenic proteins of Japanese cedar pollen and their origin. Kenbikyo (Microscope) 2006, 42, 50–54. [Google Scholar]
  31. Suárez-Cervera, M.; Takahashi, Y.; Vega-Maray, A.; Seoane-Camba, J.A. Immunocytochemical localization of Cry j 1, the major allergen of Cryptomeria japonica (Taxodiaceae), in Cupressus arizonica and Cupressus sempervirens (Cupressaceae) pollen grains. Sex Plant Reprod. 2003, 16, 9–15. [Google Scholar] [CrossRef]
  32. El-Ghazaly, G.; Takahashi, Y.; Nilsson, S.; Grafstrom, E.; Berggren, B. Orbicles in Betula pendula and their possible role in allergy. Grana 1996, 34, 300–3004. [Google Scholar] [CrossRef]
  33. Smiljanic, D.; Apostolovic, S.; Trifunovic, J.; Ognjenovic, M.L.; Mihajlovic, L.; Burazer, M.; van Hage, T.; Velickovic, C. Subpollen particles are rich carriers of major short ragweed allergens and NADH dehydrogenases: Quantitative proteomic and allergomic study. Clin. Exp. Allergy 2017, 47, 815–828. [Google Scholar] [CrossRef]
  34. Visez, N.; Chassard, G.; Azarkan, N.; Naas, O.; Sénéchal, H.; Sutra, J.-P.; Poncet, P.; Choël, M. Wind-induced mechanical rupture of birch pollen: Potential implications for allergen dispersal. J. Aerosol Sci. 2015, 89, 77–84. [Google Scholar] [CrossRef]
  35. Schäppi, G.; Taylor, P.E.; Staff, I.A.; Suphioglu, C.; Knox, R.B. Source of Bet v 1 loaded inhalable particles from birch revealed. Sex. Plant Reprod. 1997, 10, 315–323. [Google Scholar] [CrossRef]
  36. Schäppi, G.; Taylor, P.; Staff, I.; Rolland, J.; Suphioglu, C. Immunologic significance of respirable atmospheric starch granules containing major birch allergen Bet v 1. Allergy 1999, 54, 478–483. [Google Scholar] [CrossRef] [PubMed]
  37. El-Ghazaly, G.; Nakamura, S.; Takahashi, Y.; Cresti, M.; Walles, B.; Milanesi, C. Localization of the major allergen Bet v 1 in Betula pollen using monoclonal antibody labeling. Grana 1996, 35, 369–374. [Google Scholar] [CrossRef]
  38. El-Ghazaly, G.; Moate, R.; Cresti, M.; Walles, B.; Takahashi, Y.; Ferreira, F.; Obermeyer, G. Localization and release of antigens from tapetum and pollen grains of Betula pendula. Protoplasma 1999, 208, 37–46. [Google Scholar] [CrossRef]
  39. Sénéchal, H.; Visez, N.; Charpin, D.; Shahali, Y.; Peltre, G.; Biolley, J.-P.; Lhuissier, F.; Couderc, R.; Yamada, O.; Malratdomenge, A.; et al. A Review of the effects of major atmospheric pollutants on pollen. grains, pollen content, and allergenicity. Sci. World J. 2015, 2015, 940243. [Google Scholar] [CrossRef]
  40. Singh, M.B.; Hough, T.; Theerakulpist, P.; Avjioglu, A.; Davies, S.; Smith, P.M.; Taylor, P.; Simpson, R.J.; Ward, L.D.; McCluskey, J.; et al. Isolation of cDNA encoding a newly identified major allergic protein of rye-grass pollen: Intercellular targeting to amyloplast. Proc. Natl Acad. Sci. USA 1991, 88, 1384–1388. [Google Scholar] [CrossRef]
  41. Taylor, P.E.; Flagan, R.C.; Miguel, A.G.; Valenta, R.; Glovsky, M.M. Birch pollen rupture and the release of aerosols of respirable allergens. Clin. Exp. Allergy 2004, 34, 1591–1596. [Google Scholar] [CrossRef] [PubMed]
  42. Taylor, P.E.; Jacobson, K.W.; House, J.M.; Glovsky, M.M. Links between pollen, atopy and the asthma epidemic. Int. Arch. Allergy Immunol. 2007, 144, 162–170. [Google Scholar] [CrossRef] [PubMed]
  43. Suphioglu, C.; Singh, M.B.; Taylor, P.; Bellomo, R.; Holmes, P.; Puy, R.; Knox, R.B. Mechanism of grass pollen-induced asthma. Lancet 1992, 339, 567–572. [Google Scholar] [CrossRef] [PubMed]
  44. Wang, Q.; Gong, X.; Suzuki, M.; Lu, S.; Sekiguchi, K.; Nakajima, D.; Miwa, M. Size-segregated allergenic particles released from airborne Cryptomeria japonica pollen grains during the Yellow Sand events within the pollen scattering seasons. Asian J. Atmos. Environ. 2003, 7, 191–198. [Google Scholar] [CrossRef]
  45. Aita, T.; Mogami, K.; Takahashi, Y.; Abe, E.; Aoyama, M. A survey of the Cryptomeria japonica pollen and the allergen of Cryptomeria japonica (Cry j 1) in Yamagata-City. Rep. Yamagata Prefectual Inst. Public Health 2008, 41, 20–22. [Google Scholar]
  46. Watanabe, M.; Tamura, M.; Nagoya, T.; Takahashi, Y.; Katagiri, S. An enzyme-linked immune-sorbent assay for the quantitation of the major allergen from Japanese cedar (Cryptomeria japonica) pollen, Cry j 1, using monoclonal antibody. Arerugi 1992, 41, 1535–1539. [Google Scholar]
  47. Buters, J.T.M.; Antunes, C.; Galveias, A.; Bergmann, K.C.; Thibaudon, M.; Galan, C.; Schmidt-Weber, C.; Oteros, J. Pollen and spore monitoring in the world. Clin. Transl. Allergy 2018, 8, 9. [Google Scholar] [CrossRef]
  48. Aoyama, M.; Takahashi, Y. Development of super-sensitive radical immunoassay for Cry j 1. Arerugi 2004, 53, 1089–1090. [Google Scholar]
  49. Buters, J.T.M.; Thibaudon, M.; Smith, M.; Kennedy, R.; Rantio-Lehtimäki, A.; Albertini, R.; Reese, G.; Weber, B.; Galan, C.; Brandao, R.; et al. Release of Bet v 1 from birch pollen from 5 European countries. Results from the HIALINE study. Atmos. Environ. 2012, 55, 496–505. [Google Scholar] [CrossRef]
  50. Kawashima, S.; Clot, B.; Fujita, T.; Takahashi, Y.; Nakamura, K. An algorithm and a device for counting airborne pollen automatically using laser optics. Atmos. Environ. 2007, 41, 7987–7993. [Google Scholar] [CrossRef]
  51. Kawashima, S.; Thibaudon, M.; Matsuda, S.; Fujita, T.; Lemonis, N.; Clot, B.; Oliver, G. Automated pollen monitoring system using laser optics for observing seasonal changes in the concentration of total airborne pollen. Aerobiologia 2017, 33, 351–362. [Google Scholar] [CrossRef]
  52. Mitsumoto, K.; Yabusaki, K.; Aoyagi, H. Classification of pollen species using autofluorescence image analysis. J. Biosci. Bioeng. 2009, 107, 90–94. [Google Scholar] [CrossRef] [PubMed]
  53. Mitsumoto, K.; Yabusaki, K.; Kobayashi, K.; Aoyagi, H. Development of a novel real-time pollen-sorting counter using species-specific pollen autofluorescence. Aerobiologia 2010, 26, 99–111. [Google Scholar] [CrossRef]
  54. Miki, K.; Kawashima, S.; Fujita, T.; Nakamura, K.; Clot, B. Effect of micro-scale wind on the measurement of airborne pollen concentrations using volumetric methods on a building rooftop. Atmos. Environ. 2017, 158, 1–10. [Google Scholar] [CrossRef]
  55. Oteros, J.; Pusch, G.; Weichenmeier, I.; Heimann, U.; Möller, R.; Röseler, S.; Traidl-Hoffmann, C.; Schmidt-Weber, C.; Buters, J.T.M. Automatic and online pollen mon itoring. Allergy Immunol. 2015, 167, 158–166. [Google Scholar] [CrossRef] [PubMed]
  56. Šaulien, I.; Šukien, L.; Daunys, G.; Valiulis, G.; Vaitkevičius, L.; Matavulj, P.; Brdar, S.; Panic, M.; Sikoparija, B.; Clot, B.; et al. Automatic pollen recognition with the Rapid-E particle counter: The first-level procedure, experience and next steps. Atmos. Meas. Tech. 2018, 12, 3435–3452. [Google Scholar] [CrossRef]
  57. Takahashi, Y.; Ohashi, T.; Nagoya, T.; Sakaguchi, M.; Yasueda, H.; Nitta, H. Possibility of real-time measurement of an airborne Cryptomeria japonica pollen allergen based on the principle of the surface plasmon resonance. Aerobiologia 2001, 17, 313–318. [Google Scholar] [CrossRef]
  58. Takahashi, Y.; Kawashima, S.; Suzuki, Y.; Kakehata, S. Relationship between large amounts of Cryptomeria japonica D. Don pollen scattering and cold front passage. Int. J. Plant Anim. Environ. 2022, 12, 134–137. [Google Scholar]
  59. Takahashi, Y.; Kawashima, S.; Suzuki, Y.; Ohta, N.; Kakehata, S. Enrichment of airborne Japanese cedar (Cryptomeria japonica) pollen in mountain ranges when passing through a front accompanying temperate low pressure. Aerobiologia 2018, 34, 105–110. [Google Scholar] [CrossRef]
  60. Taira, H.; Teranishi, H.; Kenda, Y. Sugi (Cryptomeria japonica, D. Don) pollen scattering out of season. Arerugi 1992, 41, 1466–1471. [Google Scholar]
  61. Sahashi, N.; Kisikawa, R. The Truth about Pollinosis–Allergy Causing Plants and Pollinosis; ALGTM002A; Torii Pharmaceutical Co., Ltd.: Tokyo, Japan, 2016. (In Japanese) [Google Scholar]
  62. Kishikawa, R.; Sahashi, N.; Saitoh, A.; Kotoh, E.; Shimoda, T.; Shoji, S.; Akiyama, K.; Nishima, S. Japanese cedar airborne pollen monitoring by Durham’s and Burkard samplers in Japan: Estimation of the usefulness of Durham’s sampler on Japanese cedar pollinosis. Glob. Environ. Res. 2009, 13, 55–62. [Google Scholar]
  63. Takahashi, Y.; Aoyama, M. Development of the simple method for measurement the content of Cry j 1 in the air by latex-agglutination test. Arerugi 2006, 55, 28–33. [Google Scholar] [PubMed]
  64. Abe, E.; Takahashi, Y.; Aoyama, M. A highly-sensitive method for the measurement of pollen allergen (Cry j 1 and Dac g) by fluoro enzyme-linked immunosorbent assay. Rep. Yamagata Prefectual Inst. Public Health 2007, 40, 5–8. [Google Scholar]
  65. Tomizawa, H.; Saito, H.; Toyoma, S.; Kawasaki, Y.; and Yamada, T. Investigation of Cry j 1 and Cry j 2 concentrations in Japanese cedar pollen and non-pollen seasons. Iran. J. Public Health 2022, 51, 705–707. [Google Scholar] [CrossRef]
Figure 1. Total numbers of cedar pollen (bar graph) and predicted values (line graph). Period indicated by the dotted line box in the figure (1996 to 2003) did not apply the prediction based on the monthly average of the maximuum daily temperature in July. See Section 6 for details.
Aerobiology 02 00001 g001
Figure 2. (a). Average cedar pollen front (6-year mean), drawing mainly from the correlation be- tween latitude and integrated maximum January temperature at each observation site analyzed during 1986 to 1991. The front is drawn up in every 10-day period. For example, 6 year-means [2]. (b). The 2023 cedar pollen front. The symbols in the diagram are the first days of cedar pollen season in each region [3].
Aerobiology 02 00001 g002
Figure 3. Relationship between airborne Cry j 1 and mean symptom scores of cedar pollinosis patients. The figure shows an example from 2003. The arrow indicates the first day of cedar pollen season [4]. (A) Airborne Cry j 1 concentration, (B) Numbers of subjects each day, (C) Symptom scores.
Aerobiology 02 00001 g003
Figure 4. Relationship between pollen count and symptom score during 2018. Based on the severity of the symptoms divided into three cases (light, moderate, and severe), the symptom score of each case is presented by the bar graph. The logarithms of the scattered pollen counts are presented in the line graph (solid line: Durham sampler, dashed line: Pollen Robo) [5].
Aerobiology 02 00001 g004
Figure 5. Example of aeroallergen immunoblotting method obtained on 30 March 1991. Cry j 1 spots stained with monoclonal antibody (KW-S91). Visualization was performed with alkaline phosphatase conjugated anti-mouse IgG [16].
Aerobiology 02 00001 g005
Figure 6. Cry j 1 spots from airborne sample of cedar pollen season treated with anti-Cry j 1 mono- clonal antibody. (ac): cedar pollen dotted circle in (a): no spot is detected. (d,e): airborne fine particulate. Arrow indicates orbicles confirmed with an electron microscope, (f): Alnus spp. pollen. The unit bar in each figure indicates 30 μm. The magnification is different for each figure.
Aerobiology 02 00001 g006
Figure 7. Dac g spots from airborne samples during grass pollen season treated with anti-Dac g rabbit IgG. (ad) are areas where spots containing grass pollen were observed. The unit bar in each figure indicates 30 μm. The magnification is different for each figure. Abbreviations are as follows: Ab; airborne fine particulate, Gr; grass pollen, Pi; Pinus pollen (no spot is detected), Sp; spore, C; no obvious particle is found.
Aerobiology 02 00001 g007
Figure 8. Daily fluctuations of airborne Orchard grass allergen (Dac g allergen) of grass pollen and Cry j 1 allergen measured by immunoblotting in the urban area of Yamagata City where there is no large community [25].
Aerobiology 02 00001 g008
Figure 9. Comparison of daily values of Cry j 1 obtained with ESR radical immunoassay and the cedar pollen with Durham sampler in 2008. The slide glass of the Durham sampler and the sample from cyclone sampler CM90 (Burkard Co., Ltd., Rickmansworth, UK) were exchanged at 7 a.m. every day. The comparison period is cedar pollen season (from the first day of cedar pollen season (11 March) to the end of the pollen season (26 April)). Arrow ①: the first day of cedar pollen observed by microscope, arrow ②: the first day of the cedar pollen season.
Aerobiology 02 00001 g009
Figure 10. Durham sampler and four types of automatic cedar pollen monitors. (a) Durham sampler, (b) KH-3000 monitor by Yamato Co., Ltd. Yokosuka City, Japan, (c) Pollen Robo by Weathernews Inc. Chiba City, Japan, (d) KP-1000 monitor by Kowa Research Institute, Tsukuba City, Japan and (e) PS2 pollen senser by Shin’ei Technology Co., Ltd., Kobe City, Japan.
Aerobiology 02 00001 g010
Figure 11. Example of airborne Cry j 1 data provided by Yamagata Prefecture measured by ESR radical immunoassay (provided in 2015, personal communication from Ms. K. Mogami). The vertical arrow indicates the first day of cedar pollen season obtained with a Durham sampler. Announcement on 20 February. Announcement on 27 February, Announcement on 11 March, Announcement on 20 March. The vertical axis shows the concentration of Cry j 1 in the air, and the scale of the vertical axis differs by more than 1000 times between 20 February (0–40 pg/m3) and 20 March (0–50,000 pg/m3). Black arrow is the first day of cedar pollen season.
Aerobiology 02 00001 g011
Table 1. Results of day when pollinosis symptoms appeared, the first day of cedar pollen season, and the first day airborne Cry j 1 reaches certain levels (2003–2006) [4].
Year2003200420052006
(1) The first day pollinosis symptoms appearded in some patients2-Feb12-Feb26-Jan26-Jan
(2) The first day of the pollen season11-Mar12-Mar11-Mar7-Mar
(3) Rtes of patients who showed symptoms before the first day40.50%42.60%42.20%35.10%
(4) The first day of Cry j 1 reaching ca. 5 pg/m315-Mar17-Mar11-Mar7-Mar
(5) The first day of cedar pollen observed by microscopy1-Mar11-Mar11-Mar27-Feb
(6) The first day of Cry j 1 reaching ca. 1 pg/m324-Feb24-Feb24-Jan13-Feb
Table 2. Cedar pollen count and Cry j 1 concentration on the first day of cedar pollen season, and the start day of Cry j 1 reaching approximately 4 pg/m3 and 20 pg/m3. The data provided are for the period from 2009 to 2016 (personal communication from Ms. K. Mogami).
Year20092010201120122013201420152016
(1) The first day of the cedar pollen seasondate27-Feb25-Feb11-Mar17-Mar8-Mar17-Mar28-Feb20-Feb
pollen counts(grains/cm2)26204732142
amounts of Cry j 1(pg/m3)421063167416134120032
(2) Amounts of Cry j 1year20092010201120122013201420152016
first day beyond 4 pg/m3(pg/m3)30-Jan5-Feb1-Feb3-Feb29-Jan21-Feb13-Feb2-Feb
first day beyond 20 pg/m3(pg/m3)30-Jan25-Feb1-Feb8-Mar21-Feb27-Feb18-Feb14-Feb
Disclaimer/Publisher’s Note: The statements, opinions and data contained in all publications are solely those of the individual author(s) and contributor(s) and not of MDPI and/or the editor(s). MDPI and/or the editor(s) disclaim responsibility for any injury to people or property resulting from any ideas, methods, instructions or products referred to in the content.

