1. Introduction
Cellulose derivatives with side-chain etherification such as hydroxypropyl cellulose (HPC,
Figure 1) are water soluble at 25 °C, in contrast to cellulose. These derivatives are important in a wide variety of applications. HPC is an ingredient in formulae known as “artificial tears”, used to relieve eye dryness and irritation resulting from some ophthalmic diseases. It is also used as a thickener, stabilizer, and emulsifier in animal feedstuffs [
1], as a binder in tablet formulae, and as a rheology modifier in a wide variety of personal care and household products [
2]. HPC at high concentrations (typically over 50% by weight) in aqueous solution can undergo self-organization into cholesteric liquid crystal phases [
3]. HPC adopts a right-handed helical structure, which reflects right-handed circularly polarized light and transmits left-handed circularly polarized light [
4]. These solutions exhibit an iridescent color that can be tuned as a function of the concentration, ionic strength, and temperature [
5,
6,
7,
8]. The color change arises from changes in the helical pitch angle with concentration and temperature [
9]. The reflected colors range from the near-infrared at concentrations less than 60% (or higher temperature) to ultraviolet at concentrations greater than 70% (or lower temperature) [
10]. As such, HPC is of great interest to the photonics community. Thermoresponsive aqueous foams of aqueous solutions of HPC have been investigated and the foam properties related to bulk solution properties [
11].
The solubility of HPC decreases at higher temperatures. The cloud point, the temperature at which HPC starts to precipitate, is near 45 °C [
2]. The phase behavior of HPC in aqueous solutions containing 20% to 80% HPC was studied by Guido [
12]. In the temperature range between −3 °C and 40 °C, the thermotropic effect was attributed to the increasing chain flexibility with temperature. Guido found an isotropic phase below the cloud point and no gel-like structures in the turbid state above the cloud point at concentrations equal to those used in the work presented herein and concluded that HPC in water is not a rigid molecule.
Raman spectroscopy has been used to study the interactions of HPC and water. Weselucha-Birczynska et al. [
13] studied HPC in solutions with water contents of 0.69, 1.41, and 2.17 g/g water as a function of time. Using the O-H stretching region between 3000 cm
−1 and 3600 cm
−1, three bands were attributed to three types of water binding, which they termed non-freezing water, freezing bound water, and free water. The relative levels of the various types of water were observed by Talik and Hubicka at times from 1 to 22 days. Shifts in the intensity ratios of the C-H stretching bands at 2885 cm
−1 and 2936 cm
−1 were due to the increased local chain disorder in the 0.69 g/g sample over eight days [
14].
Using
1H NMR, Martin-Pastor and Stoyanov [
15] found that water retention is a function of the HPC chain length and that hydrated HPCs with shorter chain lengths retain smaller amounts of water in the hydrated structures.
Previous studies have concentrated on types of water binding, chain ordering, and overall phase behavior. However, the structure of the side chains of HPC in water and their response to temperature and other factors is still not well known. The objective of this work was to measure the
trans-gauche (
t-g) rotational isomerism of hydroxypropyl chains as a function of temperature in solution. The presence of ions in the Hofmeister series can also affect the solubility [
16]. The effect of SO
4−2 and Cl
− from salts with K
+, Na
+, and Ba
+2 cations on the side-chain structure was also probed here. SO
4−2 was selected as a known “kosmotrope”; i.e., a water structure-maker, stabilizing the H-bonding networks between water molecules [
8]. Ba
+2 was selected for its “chaotropic” properties, breaking water H-bond networks [
17]. The univalent ions Cl
−, Na
+, and K
+ are in the middle of the Hofmeister series [
18].
2. Materials and Methods
All the solutions studied contained 2% Klucel™ pharmaceutical grade HPC (Ashland). This weight percentage of solute results in clear solutions at room temperature. Three molecular weights of Klucel were used: 95 kDa (LF), 370 kDa (GF), and 850 kDa (MF). The moles of HP substitution for LF, GF, and MF were 3.2, 3.6, and 3.7, respectively.
Half of the water required for preparation of a 2% solution was heated to 50 °C. HPC was added to the warm water over a 10-min period, and the resulting mixture was stirred for 30 min. Next, the remaining water at room temperature was added, resulting in a slurry. The slurry was allowed to cool to room temperature with continued stirring, resulting in a clear solution. Salts were added to the room temperature HPC solutions and stirred. The salt concentrations used were 0.54 M for univalent ion solutions. To match the ionic strength, solutions with divalent ions were 0.18 M. HPC and salt concentrations were selected to yield clear solutions at room temperature with sufficient signal-to-noise for infrared spectra.
Attenuated total reflectance (ATR) infrared spectra were acquired with a Perkin–Elmer Frontier FTIR (PerkinElmer, Waltham, MA, USA) equipped with a Pike Technologies (Pike Technologies, Fitchburg, WI, USA) GladiATR temperature-controlled single-bounce diamond ATR accessory. The top of the sample chamber was covered to prevent evaporation. The sample volume was 0.25 mL. Spectra were collected over the temperature range from 25 °C to 55 °C in 3 °C intervals.
Thermogravimetric analysis (TGA) was used to check the samples for potential water loss upon heating during ATR experiments. TGA experiments were performed using a TGA Q5000 (TA Instruments—Waters LLC, New Castle, DE, USA). The weight loss from three samples of the original solutions of 2% Klucel LF 95 kDa HPC was compared with that from three samples subjected to the experimental protocol above. The mean water content of the unheated samples was measured to be 98.98% ± 0.03%. The mean water content of the samples subjected to the protocol was 97.83% ± 0.11%. The mean values were compared using the Student’s t-test. The differences in sample water content with or without the protocol were statistically insignificant, with a p value of 0.1.
Principal component analysis (PCA) was employed to analyze the changes in side-chain rotational isomerism using SOLO + MIA™ version 9.2 software from Eigenvector Research (Manson, WA, USA). This method of analysis was selected because the peak widths and possible overlaps can make it difficult to visually compare spectra and distinguish features. While procedures such as curve-fitting are also an option, assumptions or previous knowledge about peak shapes, widths, positions and heights are necessary to fit the spectra. PCA requires no such assumptions. In contrast, PCA uses only the variability in the dataset to illustrate changes in spectral features. Spectra were preprocessed with baseline correction, normalization to unity, and mean centering (subtraction of the mean spectrum from each individual spectrum) prior to PCA of the spectral region between 1400 cm
−1 and 1300 cm
−1. The mean centering of the spectra allows the first PC to describe the variation of the data within the cloud of data points formed by the infrared frequencies and intensities [
19].
3. Results
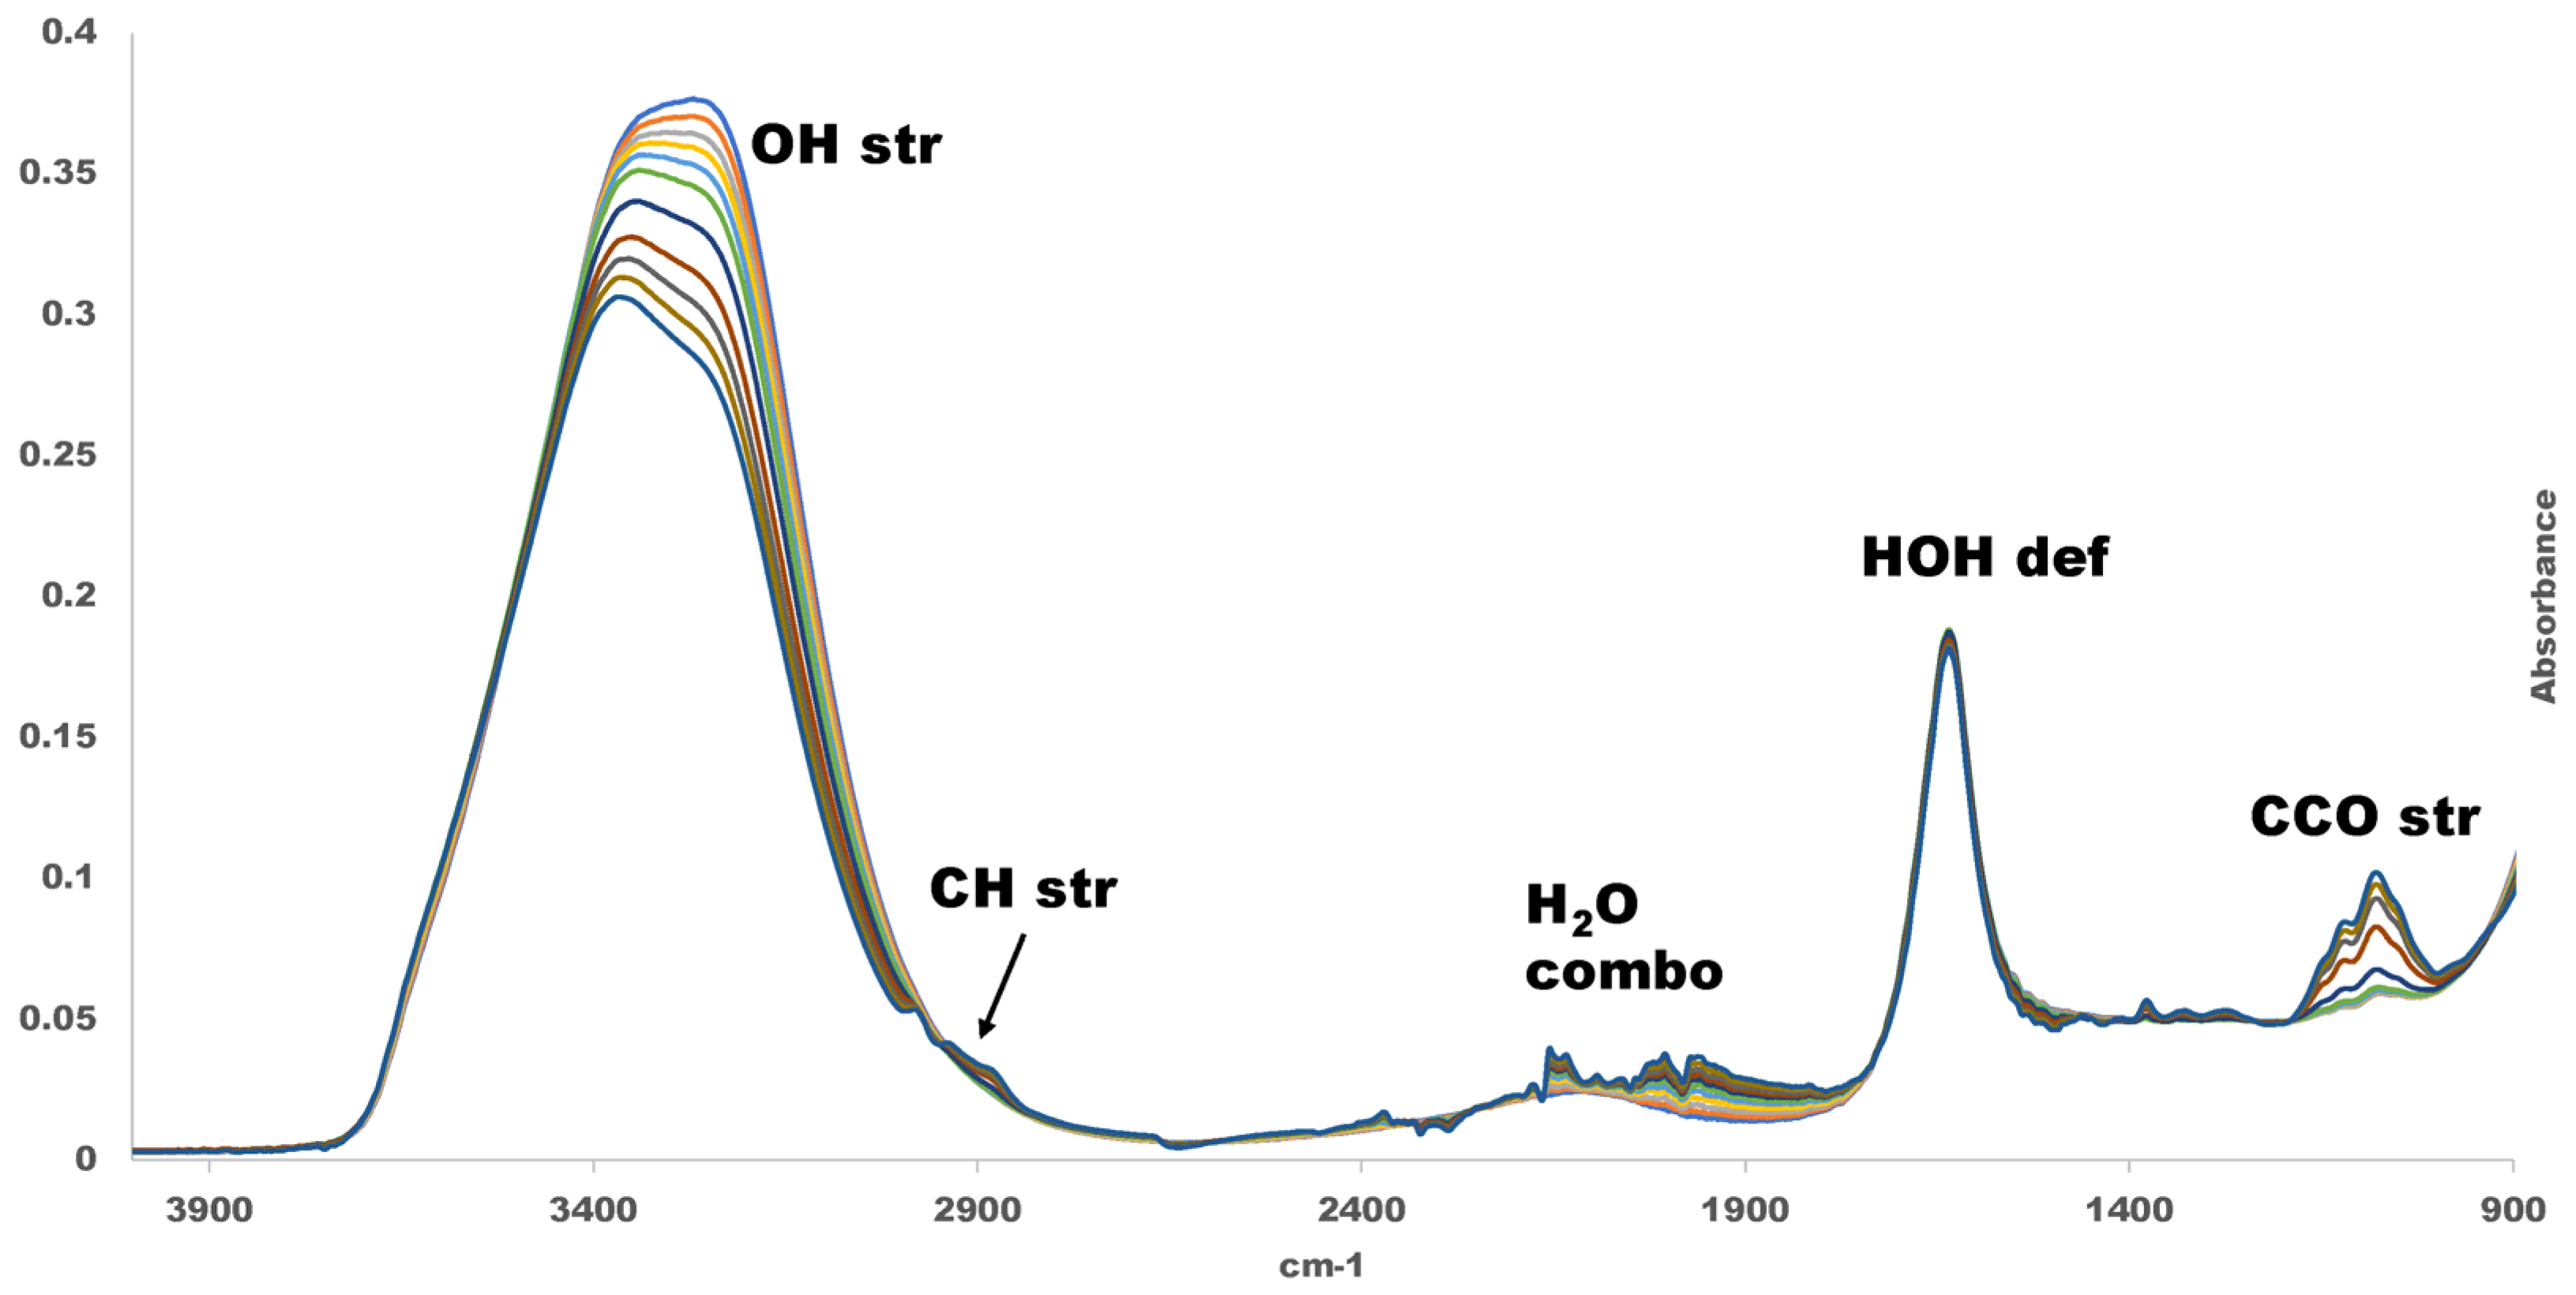
The raw spectra of the IR/ATR spectrum of 95 kDa HPC are shown in
Figure 2. The spectra are characterized by six regions. The O-H stretch occurs near 3500 cm
−1. As the temperature increases, the overall intensity of the band decreases. A factor responsible for the intensity decrease with temperature is the decrease in the O-H bond length due to less effective H-bonding, which results in a reduced change in the dipole moment with absorption and hence lower intensity [
20]. The intensity of the lower frequency sector of the O-H stretch band also decreases relative to the higher frequency sector. This is because H-bonding decreases with temperature, causing the band to shift to a higher frequency. The increased intensity of the C-C-O out-of-phase stretch near 1100 cm
−1 with temperature was due to the precipitation of the HPC with increasing temperature. The bands near 3000 cm
−1 are the −CH
2− (methylene) symmetric and asymmetric stretching modes and the −CH
3 (methyl) stretches. These appear very weak due to the strong water absorption in the region near 3500 cm
−1. The water combination band occurs near 2100 cm
−1. This band is broad and normally featureless. The features observed are due to the background of the diamond ATR element, which increases with temperature. The H-O-H deformation mode is found near 1650 cm
−1. Methylene wagging modes occur between 1300 cm
−1 and 1400 cm
−1. These were shown by Snyder to be sensitive to
t-g isomerization about the methylene C-C bonds and were the primary focus of this work.
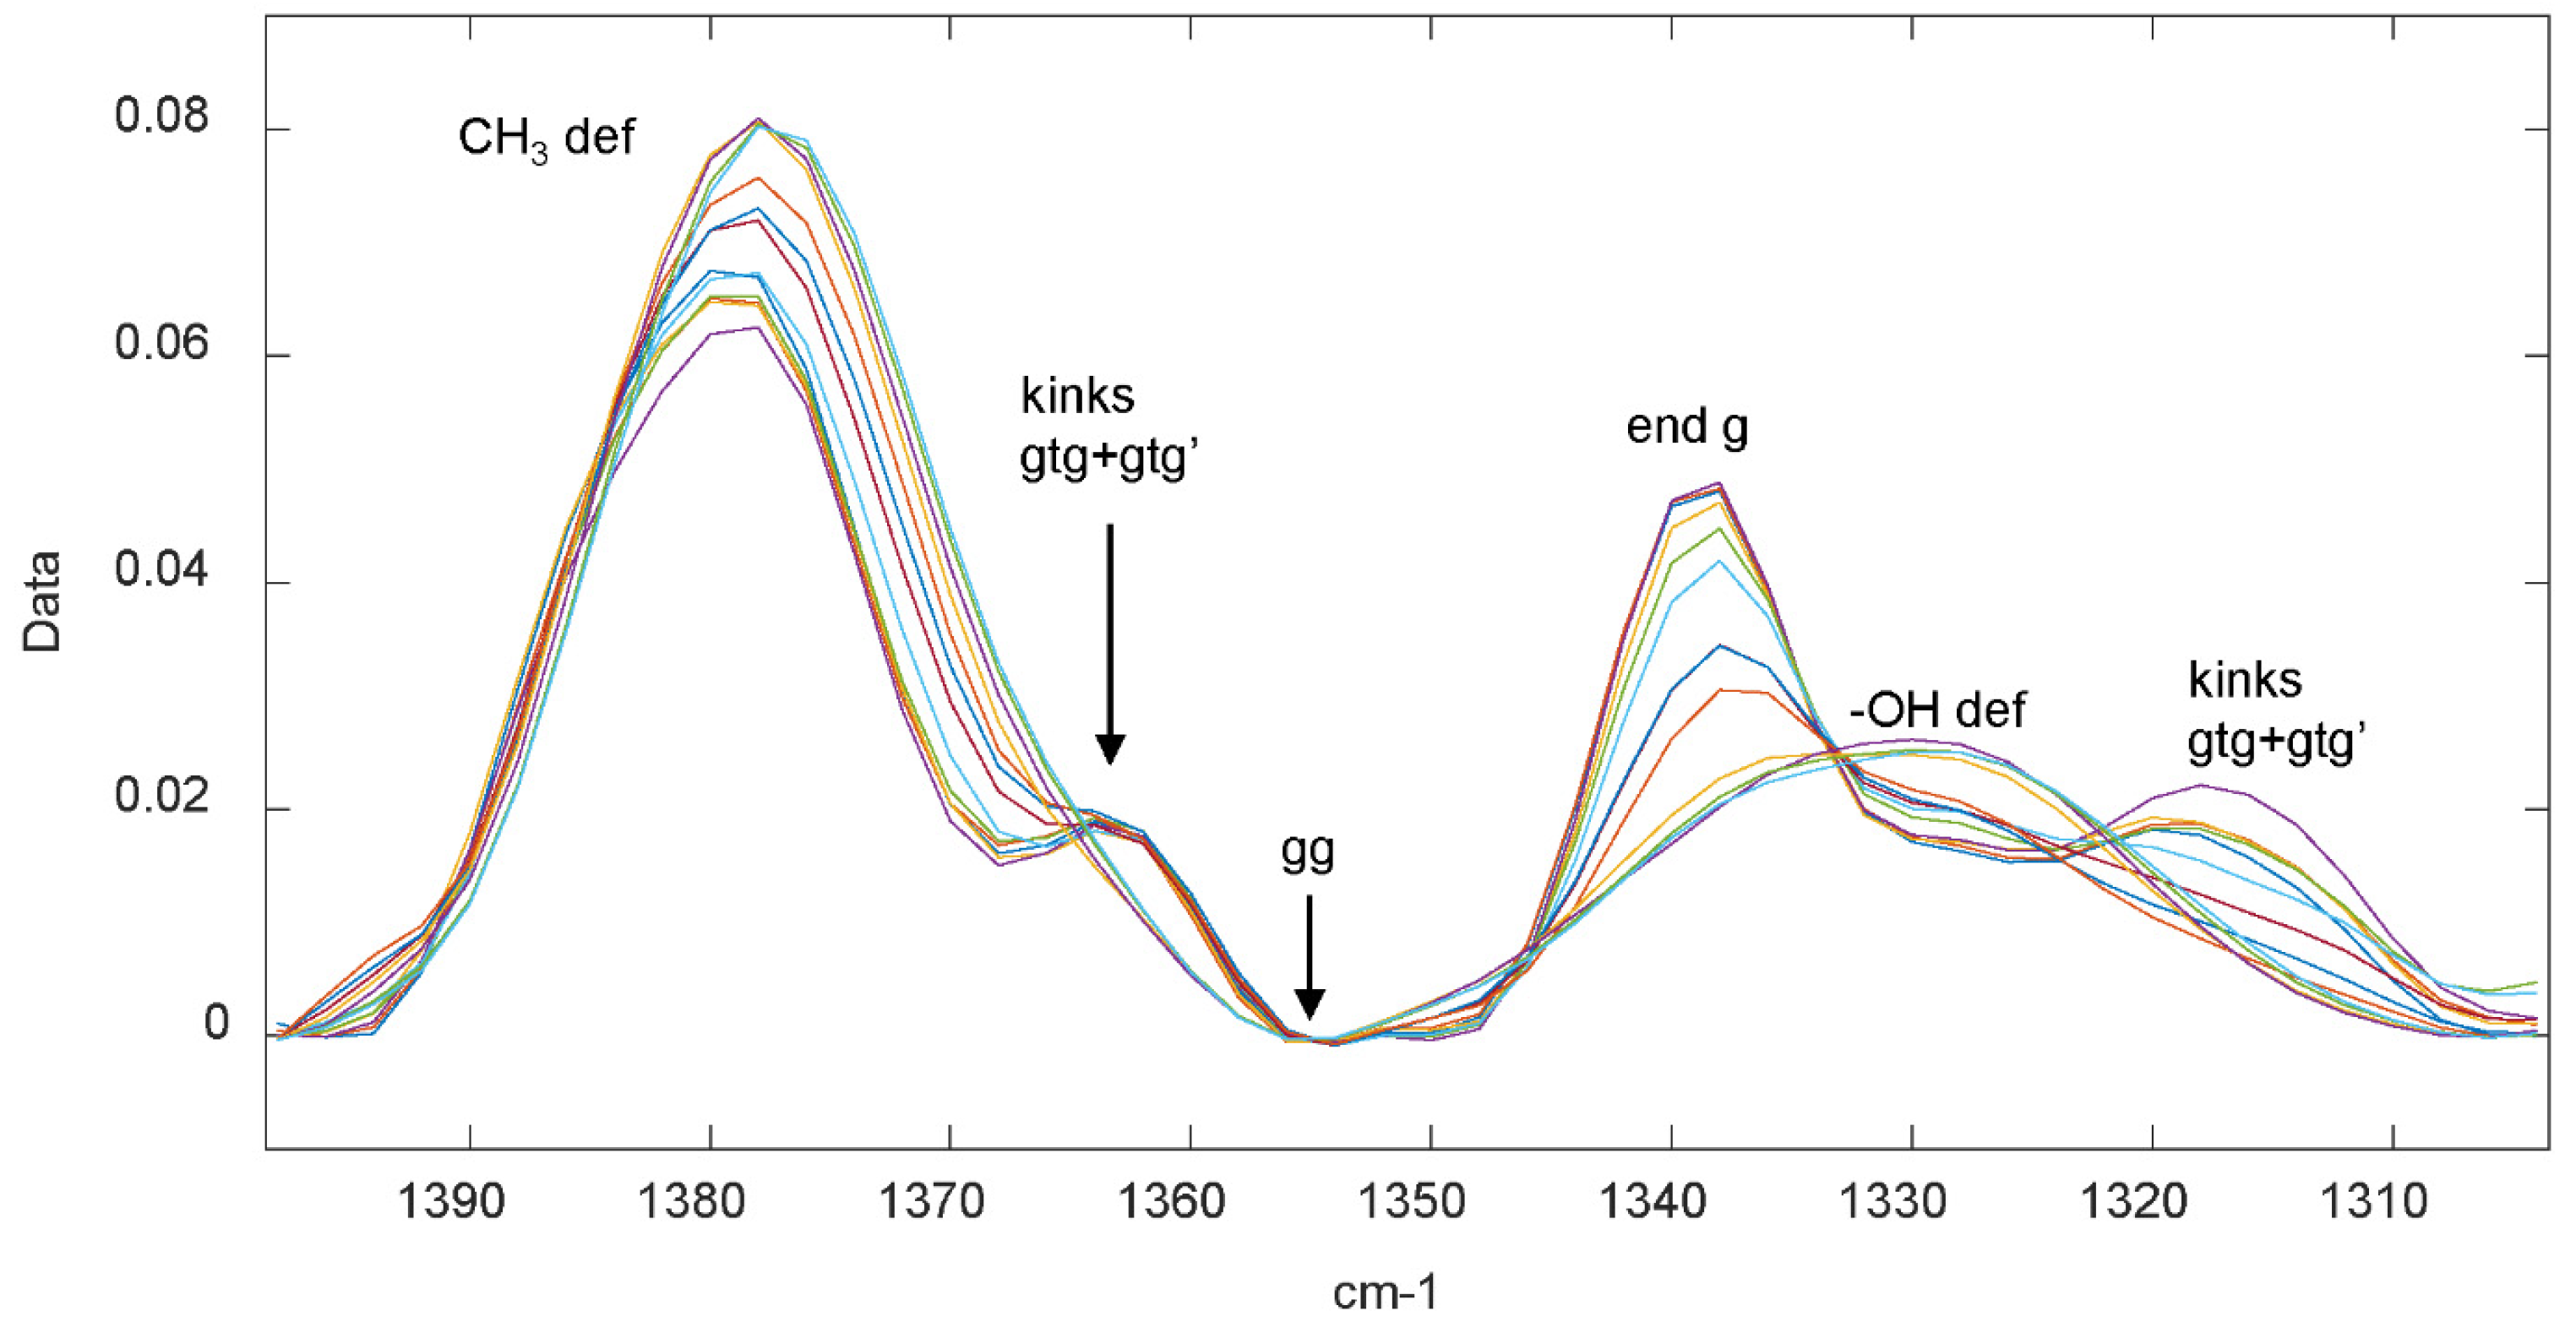
Representative baseline-corrected normalized spectra of the methylene wagging region are given in
Figure 3 for a 2% solution of 95 kDa HPC. The raw data for all three molecular weights studied are shown in
Figure 4 at the high and low temperatures of the experiment. The bands in this region were assigned by Snyder [
21] to the methyl “umbrella” symmetric deformation mode near 1380 cm
−1, and the bands due to the chain kink conformers (
gtg +
gtg′) were at 1365 cm
−1, the double
g conformers at 1350 cm
−1, the end-
g at 1340 cm
−1, and another kink band (
gtg′ +
gtg) at 1315 cm
−1 (
g with prime indicates rotation in the opposite direction from
g without prime). Finally, the HPC HO- in-plane deformation occurs at 1328 cm
−1. With increasing temperatures, the kink intensities near the 1315 cm
−1 and 1360 cm
−1 bands decreased along with the end-
g near 1340 cm
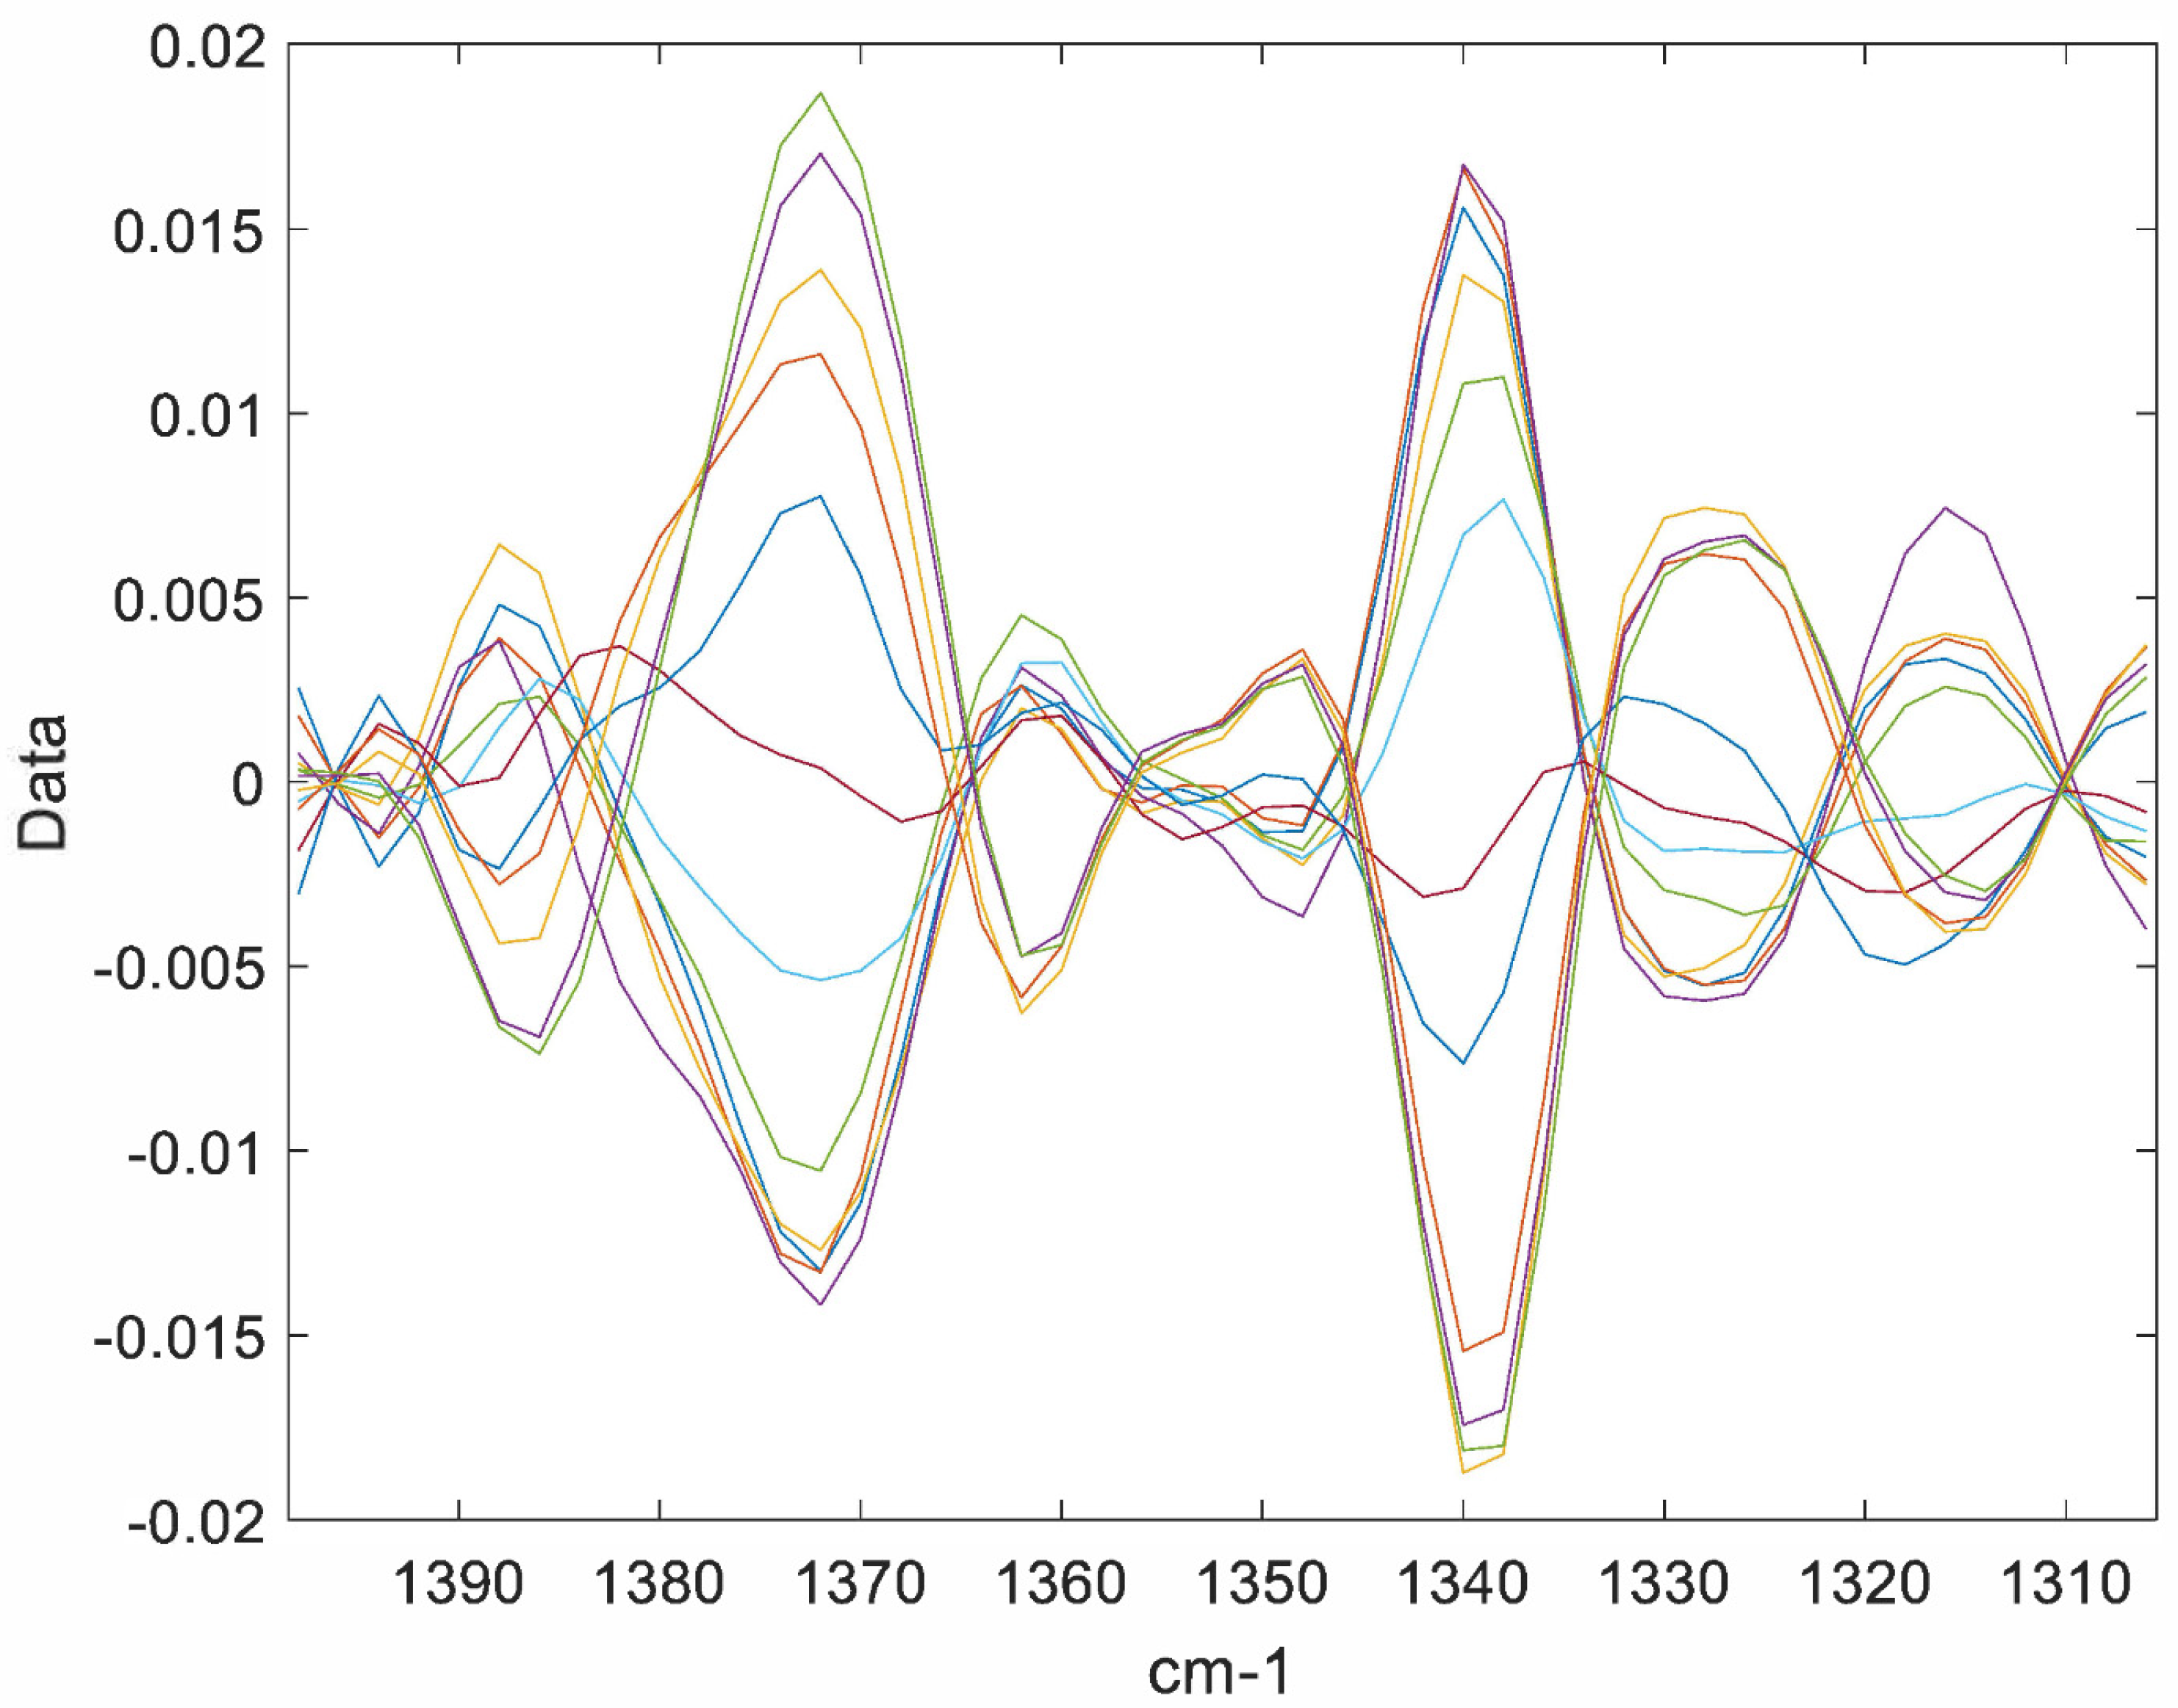
−1, while the intensity of the methyl umbrella mode increased. As the IR bands in this region are broad, PCA was used to better reveal the changes occurring across all spectra in the dataset in a smaller number of principal components (PCs). The relative contribution of a given PC to the overall variability in a dataset is given by the score. The data used as input to PCA, in this case each preprocessed spectrum (baseline corrected, normalized, and mean-centered), can be reconstructed by multiplying the value of the PC at each wavelength by the score for that PC for a given sample, i.e., at a given temperature. An example of preprocessed data with mean centering is given in
Figure 5. For example, if the value of the PC at 1340 cm
−1 is multiplied by the score at 25 °C, the value of the resulting intensity at 1340 cm
−1 is positive, meaning that there are more end-
g rotamers in the 25 °C spectrum than in the average spectrum, which is the case and is indicated by the mean-centered input data.
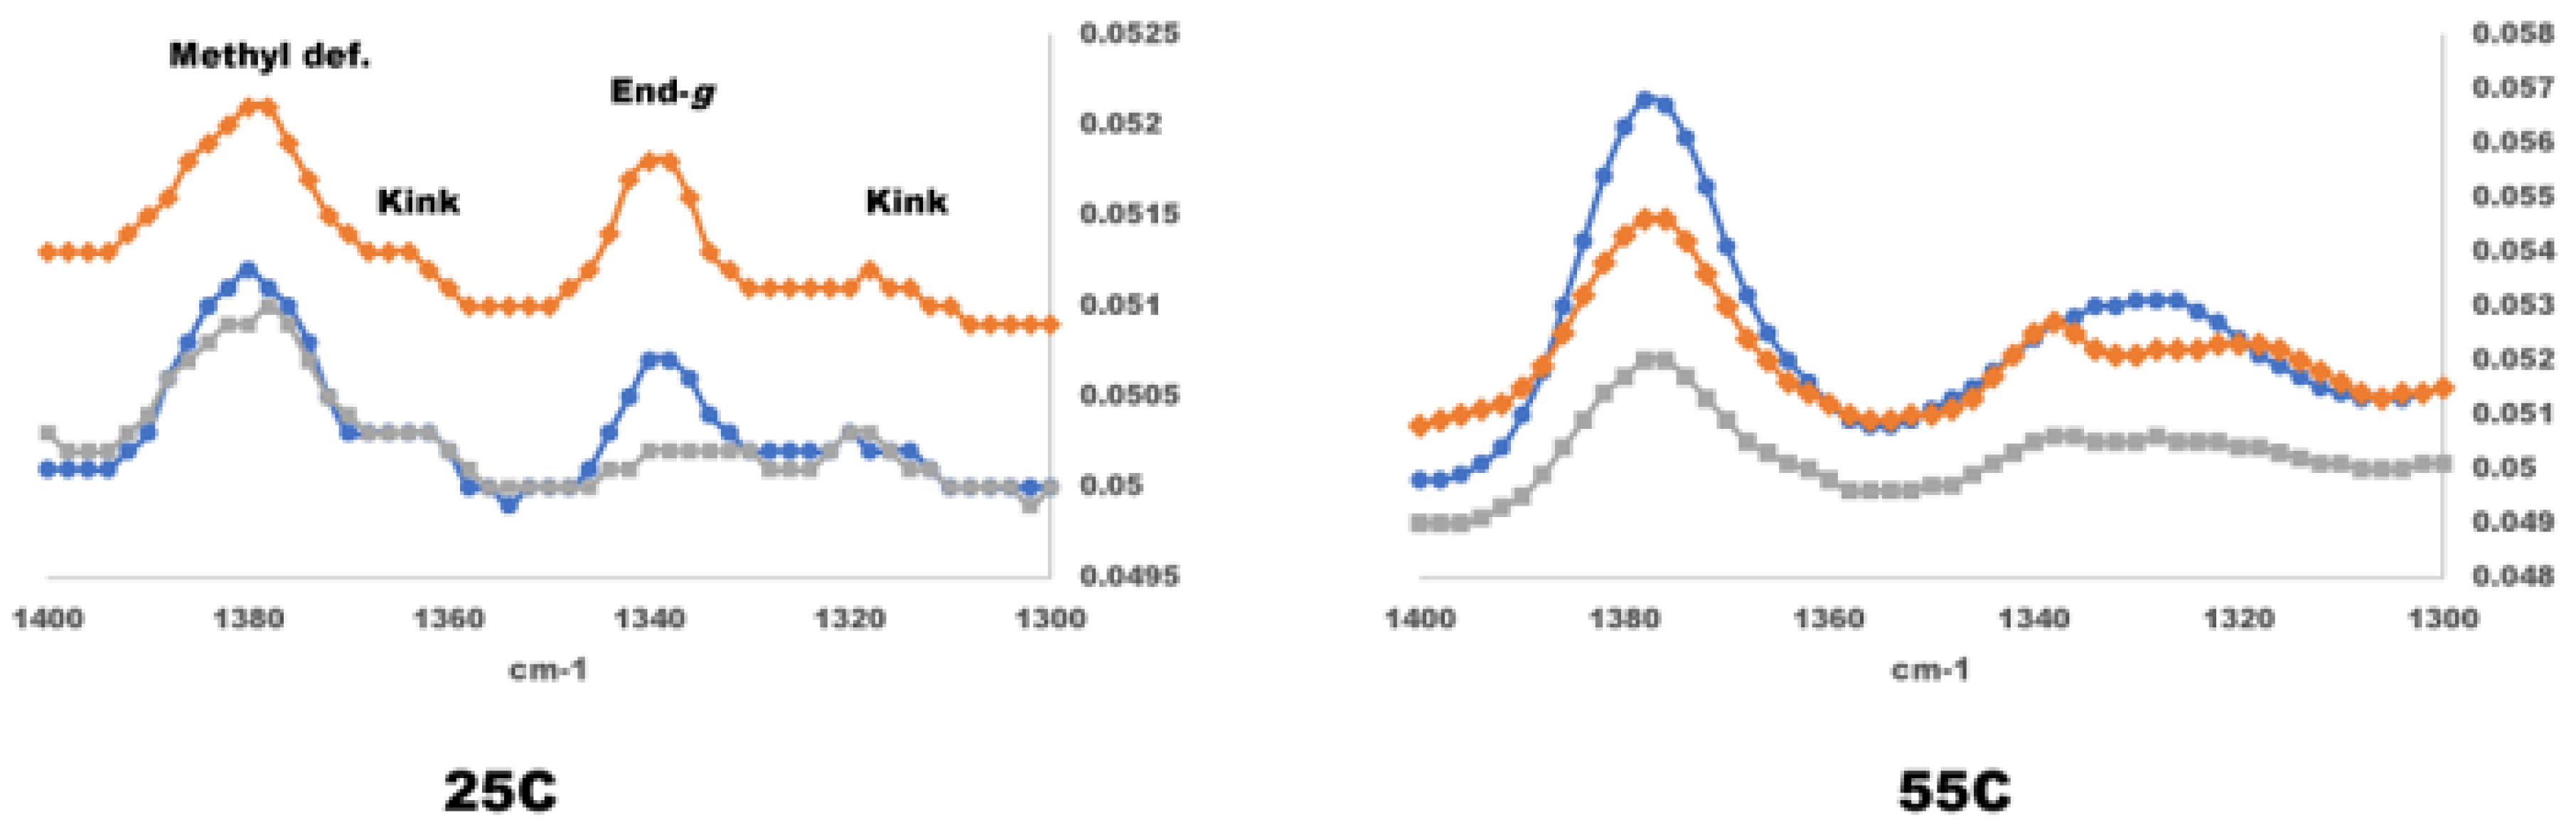
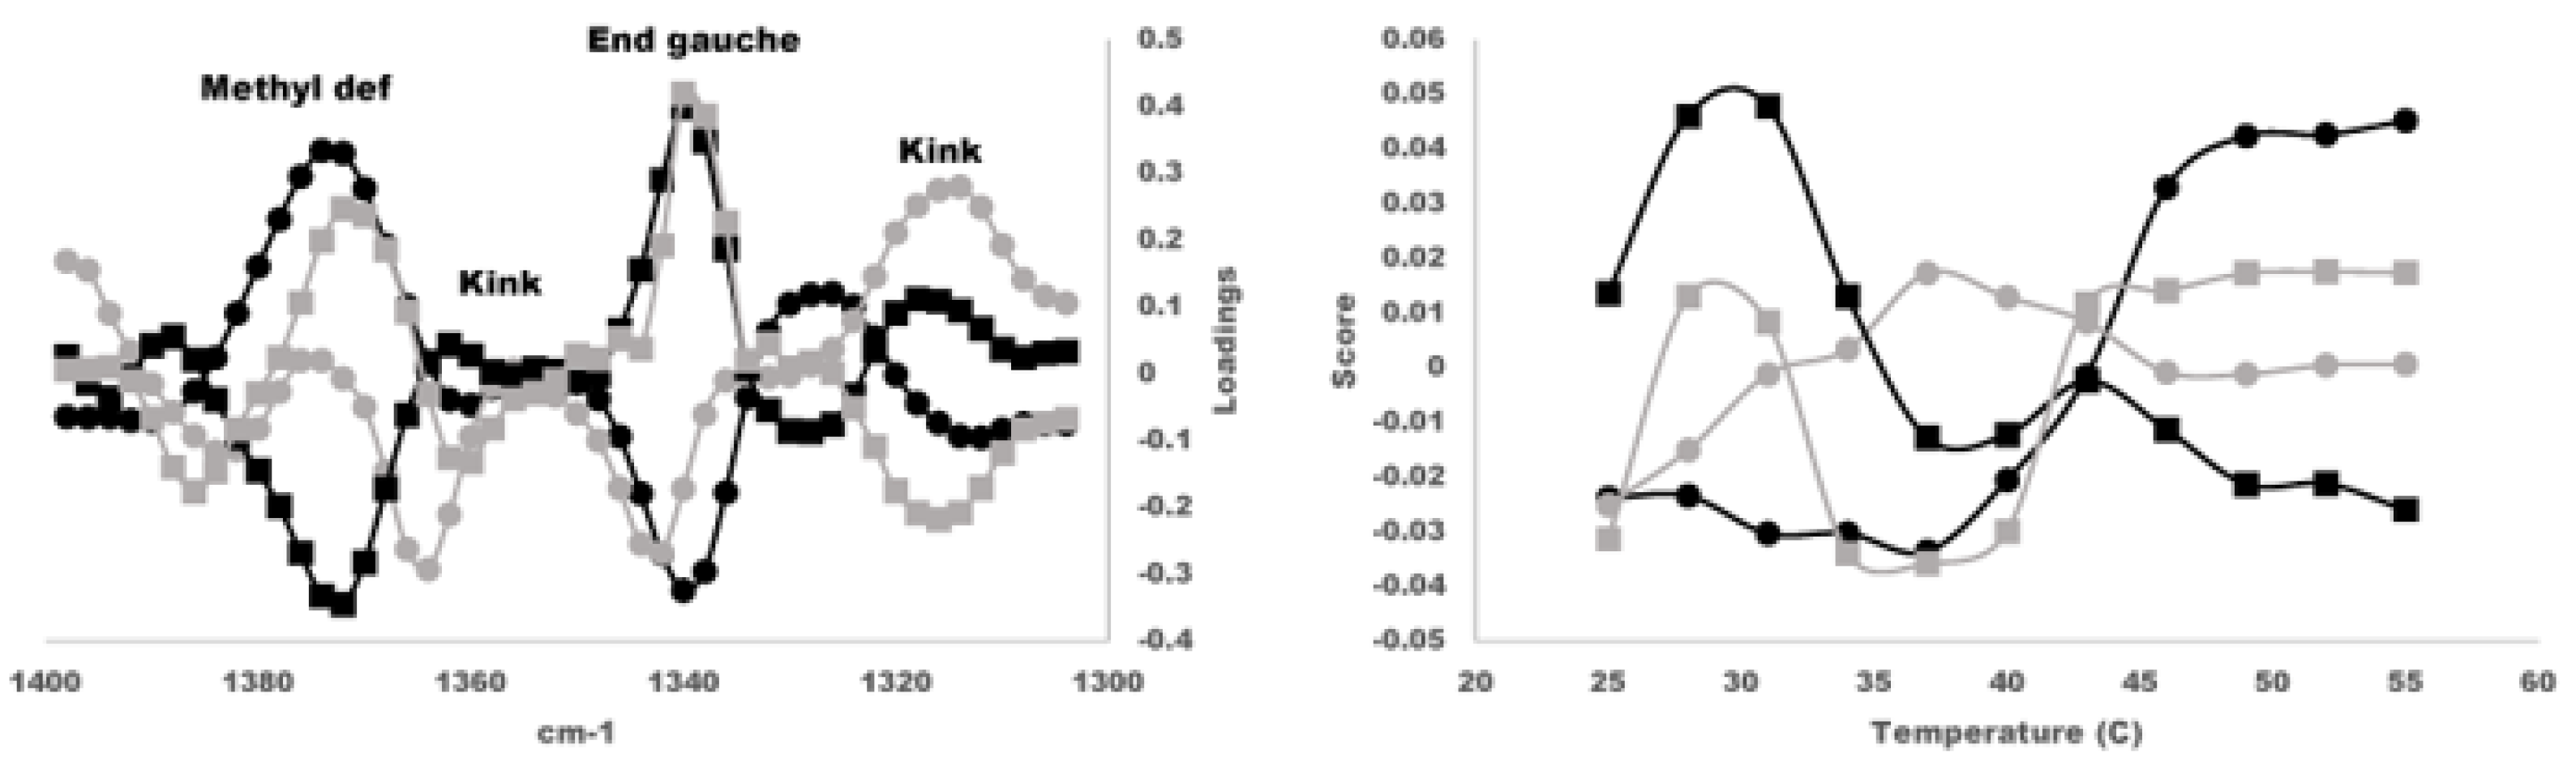
The first PC typically contains most of the variation in the dataset. PC1 for the 95 kDa HPC (LF) is shown in the left panel of
Figure 6 for 2% aqueous solutions of HPC without ions and with 0.54 M KCl, 0.18 M K
2SO
4, and 0.18 M BaCl
2 (Ba
+2 chaotropic). Without ions, the first PC accounted for 94.12% of the spectral changes occurring with temperature, with the rest of the variability arising from nonchemical sources such as noise. PC1 shows that the largest sources of variability in the 95 kDa sample arose from the methyl deformation near between 1370 cm
−1 and 1380 cm
−1, and the end-
g isomer near 1340 cm
−1. Changes in a PC occurring in opposite (positive or negative) directions indicated that these variations were anticorrelated, i.e., one band increased as the other decreased. Smaller changes occurred for the kink bands, which also decreased in intensity with temperature relative to the methyl band. One PC accounted for 95.65% of the variability with KCl and 92.16% with K
2SO
4. One PC described 92.47% of the variability with BaCl
2. The end-
g and kink conformers decrease. However, the transition ranges occurred at lower temperature for KCl and K
2SO
4. The OH- deformation band intensity increased and was anticorrelated with the
g bands. Similar changes occurred for 2% 95 kDa HPC with 0.54 M KCl and 0.18 M K
2SO
4. One PC accounted for 95.65% (KCl) and 92.16% (K
2SO
4) of the variability. However, the transition ranges occurred at lower temperatures for KCl and K
2SO
4.
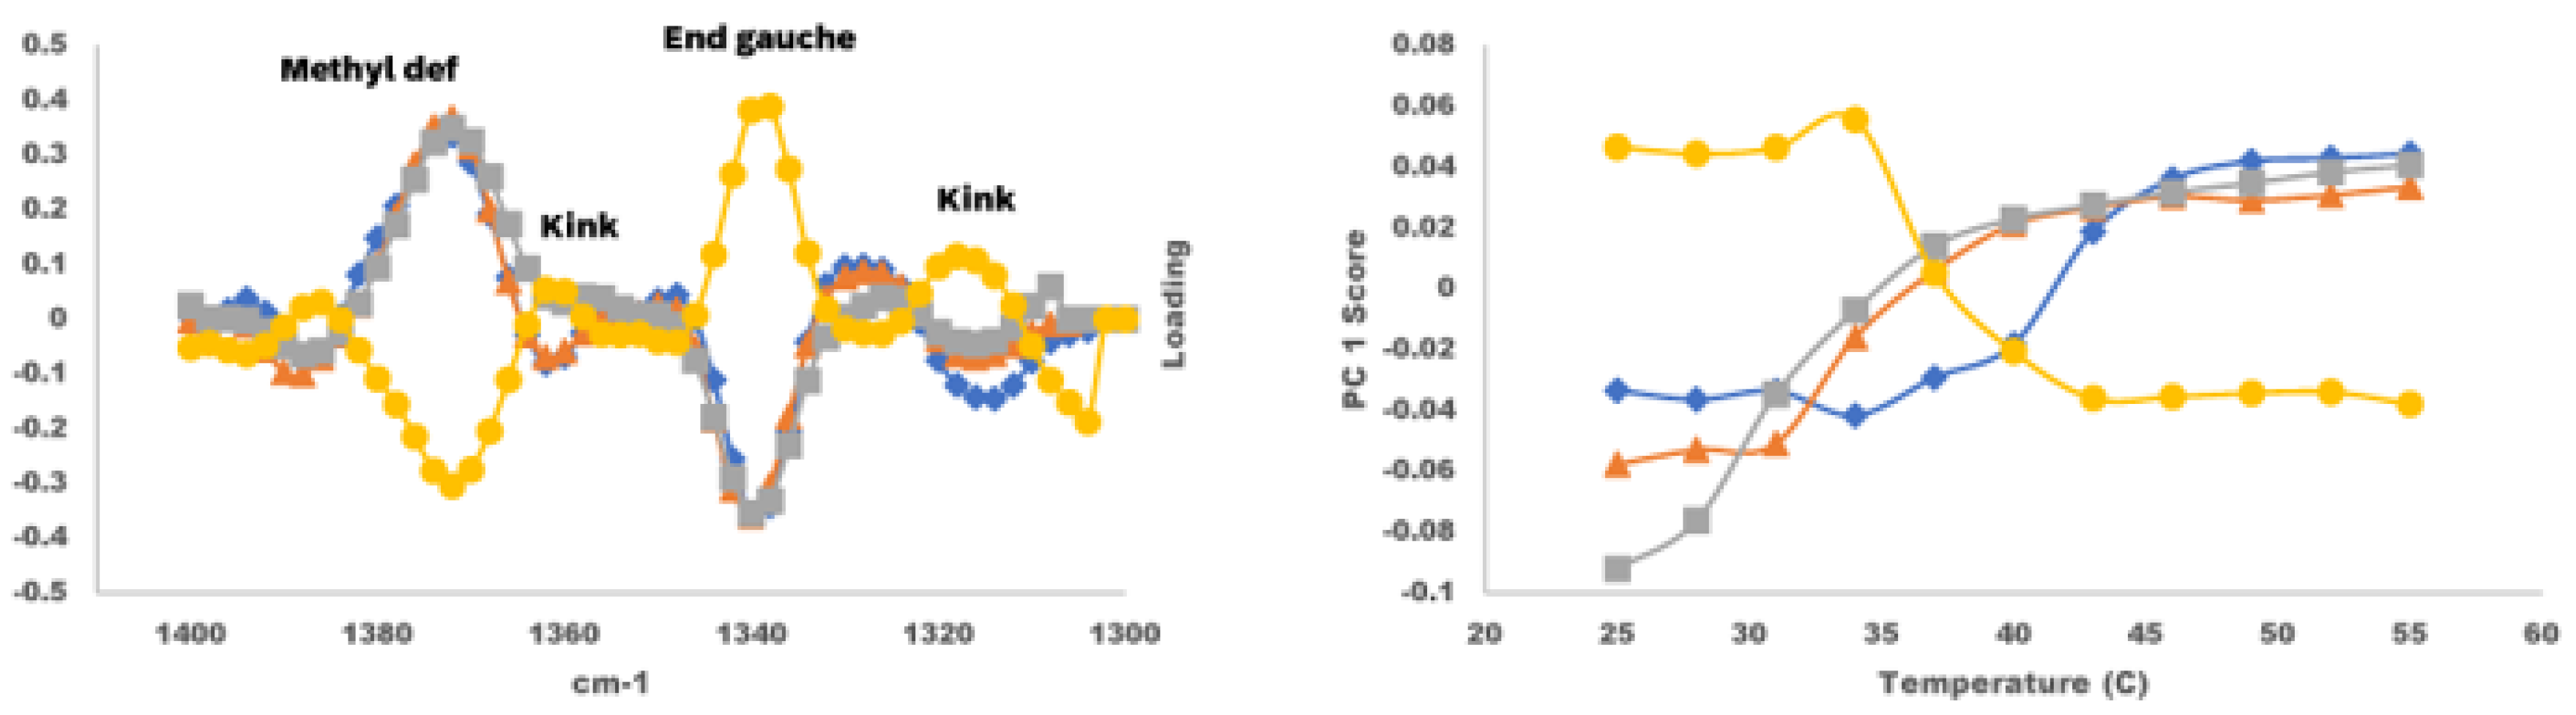
The rotational isomerism of the HPC of molecular weight 380 kDa and 950 kDa with temperature is shown in
Figure 7. The changes which occurred, in contrast to those of the 95 kDa HPC, are described by two principal components. The 380 kDa HPC underwent decreases in end-
g and kink (gtg + gtg′) conformers with increasing temperature. For example, if the values of the loadings (negative) of the first principal component near 1340 cm
−1 are multiplied by the values of the scores at each temperature, the resultant is positive at lower temperatures and negative at higher temperatures—that is, a decrease. The increases in the methyl deformation at 1360 cm
−1 and HO- intensity near 1330 cm
−1 with temperature were accompanied by a decrease in the end
g conformers as with the 95 kDa HPC. This was also described by the first PC. A second PC described a change with temperature in which a decrease in the 1360 cm
−1 kink (gtg + gtg′) band was correlated with a decrease in the end-
g coupled with a shift in the end-
g band by 2–3 cm
−1. The first PC accounted for 82.64% of the changes in the spectra; the second was 10.36%. Notable in this case of PC2 is the presence of the kink band near 1315 cm
−1 anticorrelated with the end-
g, with this kink rotamer increasing with temperature to 37 °C, then ultimately decreasing in the more ordered high-temperature state. This indicates the presence of more complex structural behavior than for 95 kDa HPC. Methyl deformation, end-
g, and kink bands are shifted, indicating different regions of conformational ordering.
The changes in the spectra of the 850 kDa HPC were also described by two PCs, closer in relative contribution than those observed in the lower molecular weight HPC. The first PC accounted for 51.27% of the spectral changes and showed the kink band near 1340 cm−1, anticorrelated with the methyl and HO- deformation intensities. The second PC accounted for 37.44% of the spectral changes and indicated a methyl band slightly shifted from that of the first PC. Anticorrelated with the methyl band were pronounced changes in the 1360 cm−1 kink band and 1315 cm−1 kink band, the former the gtg + gtg′ conformer and the latter the gtg′ + gtg conformer. The second PC also indicated the presence of structural changes in which the end-g and kink band were anticorrelated with both kink rotamers, with the kinks increasing with temperature to 37 °C before ultimately decreasing in the more ordered high-temperature state. The methyl deformation was shifted. The methyl deformation variation in PC1 decreased, and the intensity was anticorrelated with that of the end-g. In PC2, the methyl deformation and end-g were correlated, while the end-g and kinks were anticorrelated, with both kink conformers first increasing and then ultimately decreasing at higher temperatures.
4. Discussion
The conformational sensitivity of methylene wagging frequencies in sequences of five or fewer methylene groups was first discussed by Snyder [
21] in liquid n-paraffins. The ratio of the 1375 cm
−1 methyl deformation and the band at 1344 cm
−1 was constant at room temperature regardless of the paraffin chain length, so that the 1344 cm
−1 band was assigned as the wagging mode at the ends of the molecule. The calculated frequency for a
tg rotamer was 1346 cm
−1, and the analysis showed the mode to be localized. The wagging modes of the
gtg and
gtg′ rotamers were found by Snyder to be uncoupled from other modes. One of these wagging modes was symmetric with respect to the center of the
t bond and was calculated to be at 1369 cm
−1. The second, antisymmetric with respect to the center of the
t bond, had a calculated frequency of 1310 cm
−1. This pair of modes exhibited similar temperature dependence and were not associated with the ends of the molecule. Forms involving
gg’ rotamers occurred near 1352 cm
−1. Snyder determined that the intensity of the methylene wagging modes adjacent to
t rotamers is extremely small and does not contribute any significant intensity to the wagging region. Later, Snyder and Zerbi examined the rotameric behavior of a series of simple aliphatic ethers, in which the
g or
t bond of a methylene group may be to an O atom [
22]. Films of methyl ethyl ether existed in the
t form at −196 °C. Bands in the 1400 cm
−1–1300 cm
−1 region absent in the solid film were observed in the liquid at 25 °C. Calculations allowed assignment of these to the
g form. The
t rotamer of diethyl ether was observed at −196 °C. A band assigned to the
tg rotamer appeared at 1299 cm
−1 in the liquid at 25 °C. A band assigned to a
tgt rotamer, not observed at −196 °C, appeared in the liquid 25 °C spectrum of 1,2 dimethoxyethane.
The energetics of the
t-g isomerization have been the subject of several studies. Wieser et al. [
23] measured Δ
H = 1100 cal/mol, Perchard et al. [
24] measured Δ
H = 1370 ± 100 cal/mol, and Maissara et al. [
25] found Δ
H = 1400 ± 150 cal/mol. A
t-g Δ
H = 1150 ± 110 cal/mol was determined for vapor phase diethyl ether by Kanesaka, Snyder, and Strauss [
26], who concluded that the effect of intermolecular interaction on
t-g isomerization is small.
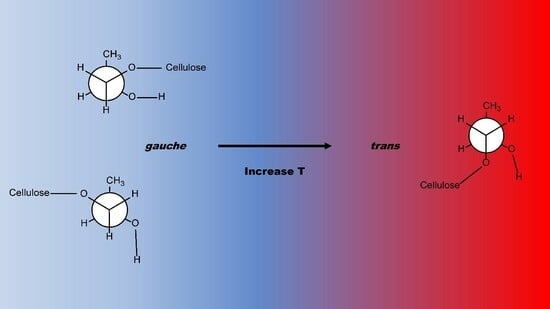
The H atoms of -OH or methylene-OH substituents of the glucose monomers of cellulose can be etherified with hydroxypropyl groups to form the ether bonds in HPC. The g-t rotamers for a single HP group bound to a glucose monomer ring -O, without subsequent etherification, are pictured in the Graphical Abstract. The rotamers occurring at lower temperatures pictured are end-g, with the bond to the substituent O atom of the cellulose chain at an angle of 60° relative to the terminal methyl group. The bond to the cellulose chain of the high-temperature t rotamer is located 180° from the methyl group. Non-end-g conformers (kinks, gtg or gtg′) may occur when etherification occurs at the O atom of a methylene group bound to the glucose monomer ring.
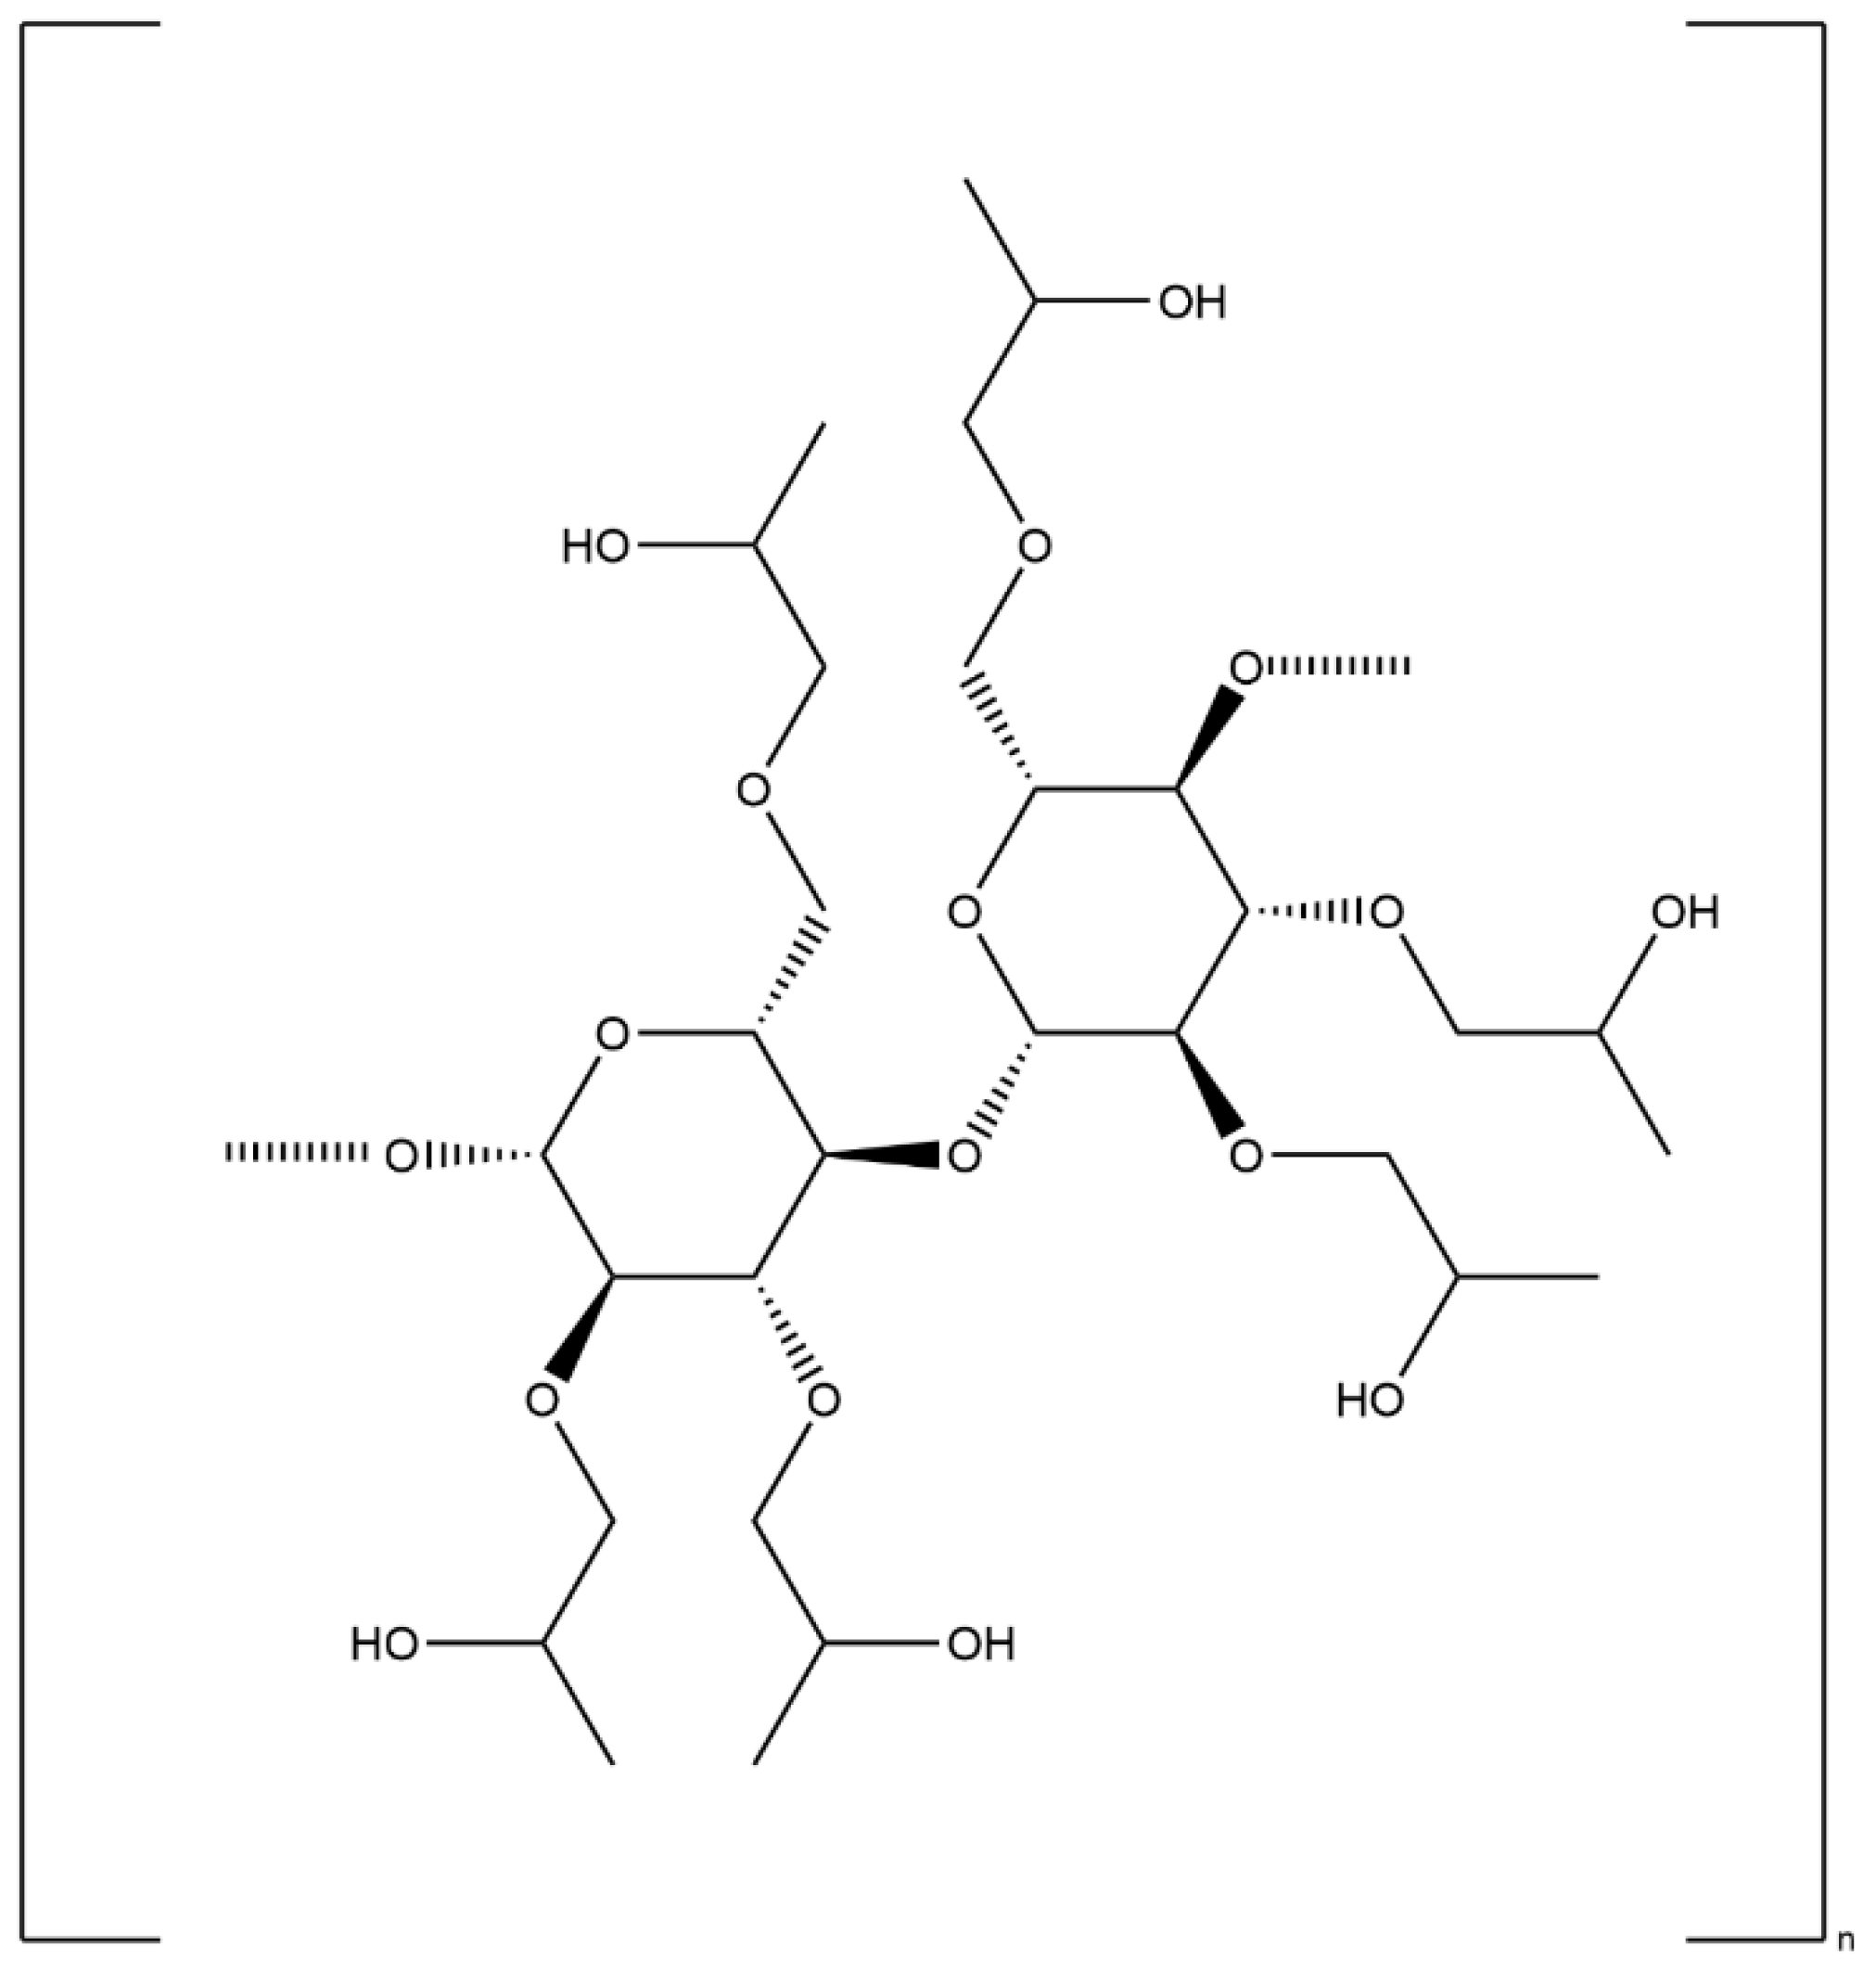
Side chain conformational possibilities are determined by the molar substitution (MS) and the -OH at which substitution (etherification) takes place. Molar substitution (MS) numbers reflect averages per glucose monomer unit, so that some -OH or methylene OH groups may remain unsubstituted. If each −OH and methylene -OH substituent H atom is etherified with a single hydroxypropyl group, there may be as many as eight potential locations for methylene g bonds in the side chains. Because the MS is between three and four for the HPC studied here, there may be further etherification at the -CH(OH)- hydroxyl groups in a side chain by additional hydroxypropyl groups. If a sequential etherification occurs at the HP -CHOH- hydrogen, two more potential g bond positions are added to the side chain. If a single etherification occurs at a ring OH, there are two possible methylene g bonds. For etherification at the CH2OH, there are four g positions. The number of potential g bond positions increase to four and six for the first sequential etherification at OH or CH2OH, respectively. For the second sequential etherification, the corresponding g sites are six and eight. A single g bond forms a bend of the chain. Those g bonds, part of the gtg or gtg′ sequences (tg’ bond rotation opposite to gt), form kinks. Single g bends form large excursions of the chain that do not pack as well as kinks in the precipitate, so that they usually occur as end-g bonds. The spectra show no evidence for the presence of “double g” (gg) conformers. Thus, end-g and kink rotamers are the most significant contributors to the HPC side-chain structure. With the decrease in the g rotamers with temperature, t rotamers will replace them.
The methyl symmetric deformation (umbrella) mode occurs near 1370 cm
−1. This mode increased in intensity and shifted to a lower wavenumber with increasing temperature in all the datasets in this work. Painter et al. observed this previously [
27] in polypropylene. The band appeared at 1378 cm
−1 in the melt and at 1376 cm
−1 in ordered polypropylene. Normal coordinate calculations of Snyder and Schachtschneider [
28] showed that methyl deformations are not entirely localized, with contributions from methine and methylene deformations. The mixing of normal modes changes the dipole moment derivative and hence the intensity. Intensity changes of the methyl deformation mode have been used previously in studies of crystallinity changes in cellulose by Nelson and O’Connor [
29]. The authors found that the ratio of the methyl umbrella band with that of the C-H stretch at 2900 cm
−1 correctly ranked samples of lattice types I and II in the same order as X-ray, density, and moisture sorption and was an improvement over X-ray and density measurements for accessibility.
A band unrelated to methylene wagging is the methylene -OH in-plane deformation mode observed near 1330 cm
−1. These arise from unetherified C-O-H groups. Blackburn et al. [
30] used the ratio of the O-H in-plane deformation intensity to that of the O-H stretch at 3336 cm
- to calculate a “Hydrogen Bond Index, HBI”, to determine qualitative crystallinity changes in cellulose and found that the HBI increased and the crystallinity decreased. While not essential to the structural analysis presented in this work, it is noted that the intensity of the HO- in-plane deformation changed with temperature.
The 370 kDa and 850 kDa systems demonstrate the utility of Principal Component Analysis in observing spectral changes. In these cases, more than one principal component was required to describe the temperature variation of the solutions, i.e., the existence of several species and/or phases was indicated. These variations may not have been evident in a univariate analysis. In the case of proteins, the chaotrope Ba+2 causes “salting-in,” with increased H-bonding to the protein and consequently an increase in the solubility. In contrast, Ba+2 caused a lowering of the cloud point in HPC. This is consistent with a transition to a more ordered phase as indicated by the shift in intensity and position of the methyl deformation, with better packing between side chains on adjacent polymer strands’ chains due to increases in t rotamers with temperature.
Attenuated total reflectance proved useful to circumvent issues of high absorbance primarily due to water, permitting use of the structural sensitivity of the methylene wagging modes and the methyl symmetric deformation modes in detecting changes in the rotational isomeric state and the overall ordering with temperature. ATR proved useful in detecting the precipitation of HPC at higher temperatures and may be an alternative method for use in cloud point; i.e., phase transition measurements.


