Article

Toward a Holistic Understanding of Factors That Support or Inhibit Graduate Student Success

by
Karen M. Collier
* and
Margaret R. Blanchard
Department of STEM Education, North Carolina State University, Raleigh, NC 27695, USA
*
Author to whom correspondence should be addressed.
Trends High. Educ. 2023, 2(3), 389-408; https://doi.org/10.3390/higheredu2030023
Submission received: 11 May 2023 / Revised: 16 June 2023 / Accepted: 20 June 2023 / Published: 23 June 2023
(This article belongs to the Special Issue STEM in Higher Education)

Abstract

:
The goal of this research was to gain a holistic understanding of factors that support or inhibit graduate student success, with a particular interest in the experiences of underrepresented minorities, females in STEM, and first-generation college students. The Graduate Student Success Survey (GSSS) was developed and validated with 537 M.S. and Ph.D. students at a research-intensive university in the southeastern United States. Guided by Maslow’s Hierarchy of Needs and informed by salient factors described in the literature and published surveys, items were developed to measure students’ perceptions of imposter syndrome, microaggressions, microaffirmations, mentoring, sense of belonging, financial support, and mentor relationships. This manuscript details the development of these items and validation of the GSSS with full- and part-time thesis-based graduate students across twelve colleges, six of which were STEM-focused. Validity and reliability were tested with exploratory and confirmatory factor analysis, resulting in a survey with seven subscales. Findings revealed significant differences in these graduate students’ experiences based on their gender identity, racial and ethnic group, citizenship status, and program area. The findings of this study report the experiences of graduate students at one institution. However, the validated survey and the recommendations resulting from the findings could be used to scaffold student success and provide insight for faculty and administrators on how to better support students.

1. Introduction

Earning a graduate degree is a pathway that can lead to increased opportunity and success. Historically, students in graduate programs in the United States (U.S.) have been middle to upper-middle class, White, and predominantly male, particularly in science, technology, engineering, and mathematics (STEM) fields [1]. The participation of a broader range of students from diverse backgrounds has been found to positively contribute to disadvantaged students’ social mobility and economic potential in STEM and enrich STEM fields by contributing alternative perspectives [2,3]. However, first-generation college students, especially those who experience the intersectionality of racial, gender, and socioeconomic inequalities, are less likely to persist in STEM [4,5,6,7,8,9]. Previous research has shown that an array of secondary factors (e.g., lack of social capital, increased work and family obligations, and a lower sense of belonging) negatively influence students’ academic journey [10,11]. A number of scaffolding supports, such as academic guidance, mentoring, financial support, fostering feelings of belonging, and social integration, can improve graduate students’ academic success [9,12,13].
Ph.D. programs have attrition rates that hover around 50% for residential programs and can be as high as 70% for online programs, whereas other professional programs (e.g., medical school) have much lower rates, ranging from 5% to 15% [14,15,16]. The attrition rates for students who are often underrepresented in graduate programs (e.g., underrepresented minorities and females in STEM) tend to be even higher [15]. The loss of doctoral students has depleted university resources for other students [17]. There are critical gaps in the literature as to why students who are completing Ph.D. programs struggle to complete their programs and what factors contribute to their departure.
Underrepresented students may have social capital deficits linked to their lower socioeconomic backgrounds, potentially leading to a lower sense of belonging [18,19,20,21,22,23]. They also may encounter additional challenges with psychological barriers (i.e., imposter phenomenon, microaggressions, and a lack of microaffirmations) [24,25,26,27,28,29]. Mentor support and opportunities to participate in research and publications assist students in understanding the nuances of graduate school, whereas financial support can help motivate students to persist [30,31,32,33].
The purpose of this research is to understand the barriers and supports students encounter in graduate school (i.e., financial support, mentor support, sense of belonging, microaffirmations, microaggressions, imposter syndrome, and access and opportunities to conduct research and write academic papers), with a focus on underrepresented groups (i.e., females in STEM, underrepresented minorities, international students, part-time students, and first-generation students). Understanding the experiences that graduate students face can provide insight into potential systemic-level supports that can be developed to enhance students’ experiences. As students are better supported, their potential for academic success will increase, creating a more diverse and inclusive climate in graduate school.
The research aimed to gain a holistic understanding of factors that support or inhibit graduate student success and to parse out the findings based on how students identified in terms of gender, first-generation status, minority status, and research focus. The first step was to develop a valid and reliable instrument. Next, findings were analyzed based on students’ self-identified demographic factors. The following questions guided this research:
  • Does the Graduate Student Success Survey (GSSS) demonstrate evidence of validity and reliability in measuring factors that support or inhibit graduate student success?
  • What factors do graduate students identify as supporting or inhibiting their success, and do these differ based on demographic factors?

1.1. Underrepresented Graduate Students

First-generation college students are individuals whose parents have not earned a bachelor’s degree, and they comprise 29.8% of doctoral recipients in the United States. First-generation college students are more likely to be members of underrepresented minorities (URM) [9,34,35]. In 2019, the U.S. population was comprised of 13.4% Black and 18.5% Hispanic individuals [36]. However, Black and Hispanic individuals received only 7.1% and 8.1% of doctoral degrees awarded to U.S. citizens, respectively [36]. Black and Hispanic students earned substantially fewer doctoral degrees in the physical sciences, at 2.3% and 6.9%, respectively [7]. As with URM, females are disproportionately underrepresented as doctoral degree recipients in many STEM fields. Females (51.5% of the adult U.S. population) receive 54.5% of the doctoral degrees in the life sciences but only 25.8% in mathematics and 24.0% in engineering [8].

1.2. Factors Affecting Graduate Student Success

The following sections will explore key factors that influence student success in higher education.

1.2.1. Sense of Belonging

Sense of belonging, the degree to which an individual believes they are included and valued in a community, is thought to contribute to the success of graduate students [28]. Similar to hunger or personal safety, the authors assert that this desire to belong can influence an individual’s behavior, potentially leading to anxiety, stress, or depression. For graduate students, a sense of belonging goes beyond academia and includes socio-psychological aspects of identity, social connectedness with peers, and mental health [37,38]. Since graduate students spend most of their time with department members and advisors, their sense of belonging is often tied to faculty more than their peers [39,40]. In studying undergraduate attrition, Tinto found that a student’s sense of belonging was connected to feelings of acceptance, support, and encouragement from faculty [41]. Prior research has shown that a lack of role models and mentors at a university can negatively affect females’ and URM’s sense of belonging [42].

1.2.2. Imposter Phenomenon/Syndrome

The impostor phenomenon, or imposter syndrome, refers to the experience of high-achieving, successful individuals who attribute their accomplishments to luck and have a fear of being exposed as a fraud [29]. Individuals with imposter syndrome have difficulty maintaining positive self-perceptions of their productivity, capabilities in academia, and success, especially in relation to their peers [25,28]. Previous research has found that participants with characteristics of imposter syndrome reported lower academic self-efficacy, negative perspectives of their academic context, and pessimistic outlooks toward attaining their doctorate [29].

1.2.3. Microaffirmations and Microaggressions

Racial microaggressions are words and actions that stereotype or invalidate racially minoritized individuals [43,44]. In contrast, racial microaffirmations are words or actions experienced that support racial identities, recognize racialized realities, and advance social justice [26,27]. Alfred et al. found that the retention of females in STEM is negatively inhibited by a lack of encouragement and validation from faculty (absence of microaffirmations), as well as the competitive and individualistic nature of STEM disciplines [24]. Stockard et al. found that underrepresented students in STEM graduate programs experience microaggressions through “subtle, insidious, and continual social and psychological hostilities and devaluation” [45] (p. 6). Despite these experiences, URM students in their study were more likely to persist in their education and aspire to be professors who emphasize research and teaching.

1.2.4. Mentoring

During graduate school, students can have an array of mentors through advisors, research supervisors, and professors. Mentoring relationships can help all graduate students, especially underrepresented students, navigate the graduate school’s new cultures and expectations [46]. Females and URMs may have greater difficulty navigating such interactions due to deficits in social capital and a lack of a diverse group of professors [47]. Mentor relationships have the potential to encourage and advise students who typically struggle in graduate school. Girves and Wemmerus asserted that students’ relationships with faculty members impact the students’ educational and professional development, potentially determining career success [48].

1.2.5. Access and Opportunity for Career Advancement

Most graduate students are continuing generation students (71%) who benefit from their family’s collective history, or social capital, to inform their graduate school experiences [12,34,48]. Inhibited by less social capital, first-generation students are often reluctant to engage with faculty members and need help to gain social capital due to financial and work commitments, potentially inhibiting students’ participation in research, papers, or conferences [10,49]. Though these aspects are not woven into graduate programs, they are often considered critical in refining students’ skills for future careers.
For students who lack social capital, graduate programs need to better support students in acquiring these experiences. Most graduate students need assistance to achieve academic writing at a level to be accepted in quality peer-review journals [50]. As Mullen shared, higher education needs to provide greater support for graduate students in publishing their research, and she suggests using research-based writing models that assist students with academic skills and professionalization [32]. As a partial solution, graduate assistantships enhance degree progress by involving students in projects with faculty and fellow graduate students, which provides opportunities to learn about the norms and expectations of the discipline [51,52].

1.2.6. Financial Support

Graduate students can receive financial support from assistantships, fellowships, and loans. Assistantships allow students to apprentice into the academic profession while learning the norms and expectations of their department, whereas fellowships are used to recruit top students but may diminish socialization and create feelings of isolation [53]. Students who rely on loans may have concerns about indebtedness, whereas those with outside employment may be distracted from their studies [51]. Hoskins and Goldberg linked financial support to graduate student motivation and attrition [30]. Financial support impacted graduate student persistence, but it did not guarantee completion [54]. In a survey about successful graduate students, affordable tuition was classified as even more important than financially providing for their family; however, these financial stresses were less important to graduate students than self-esteem and professors’ interest in their academic success [55].

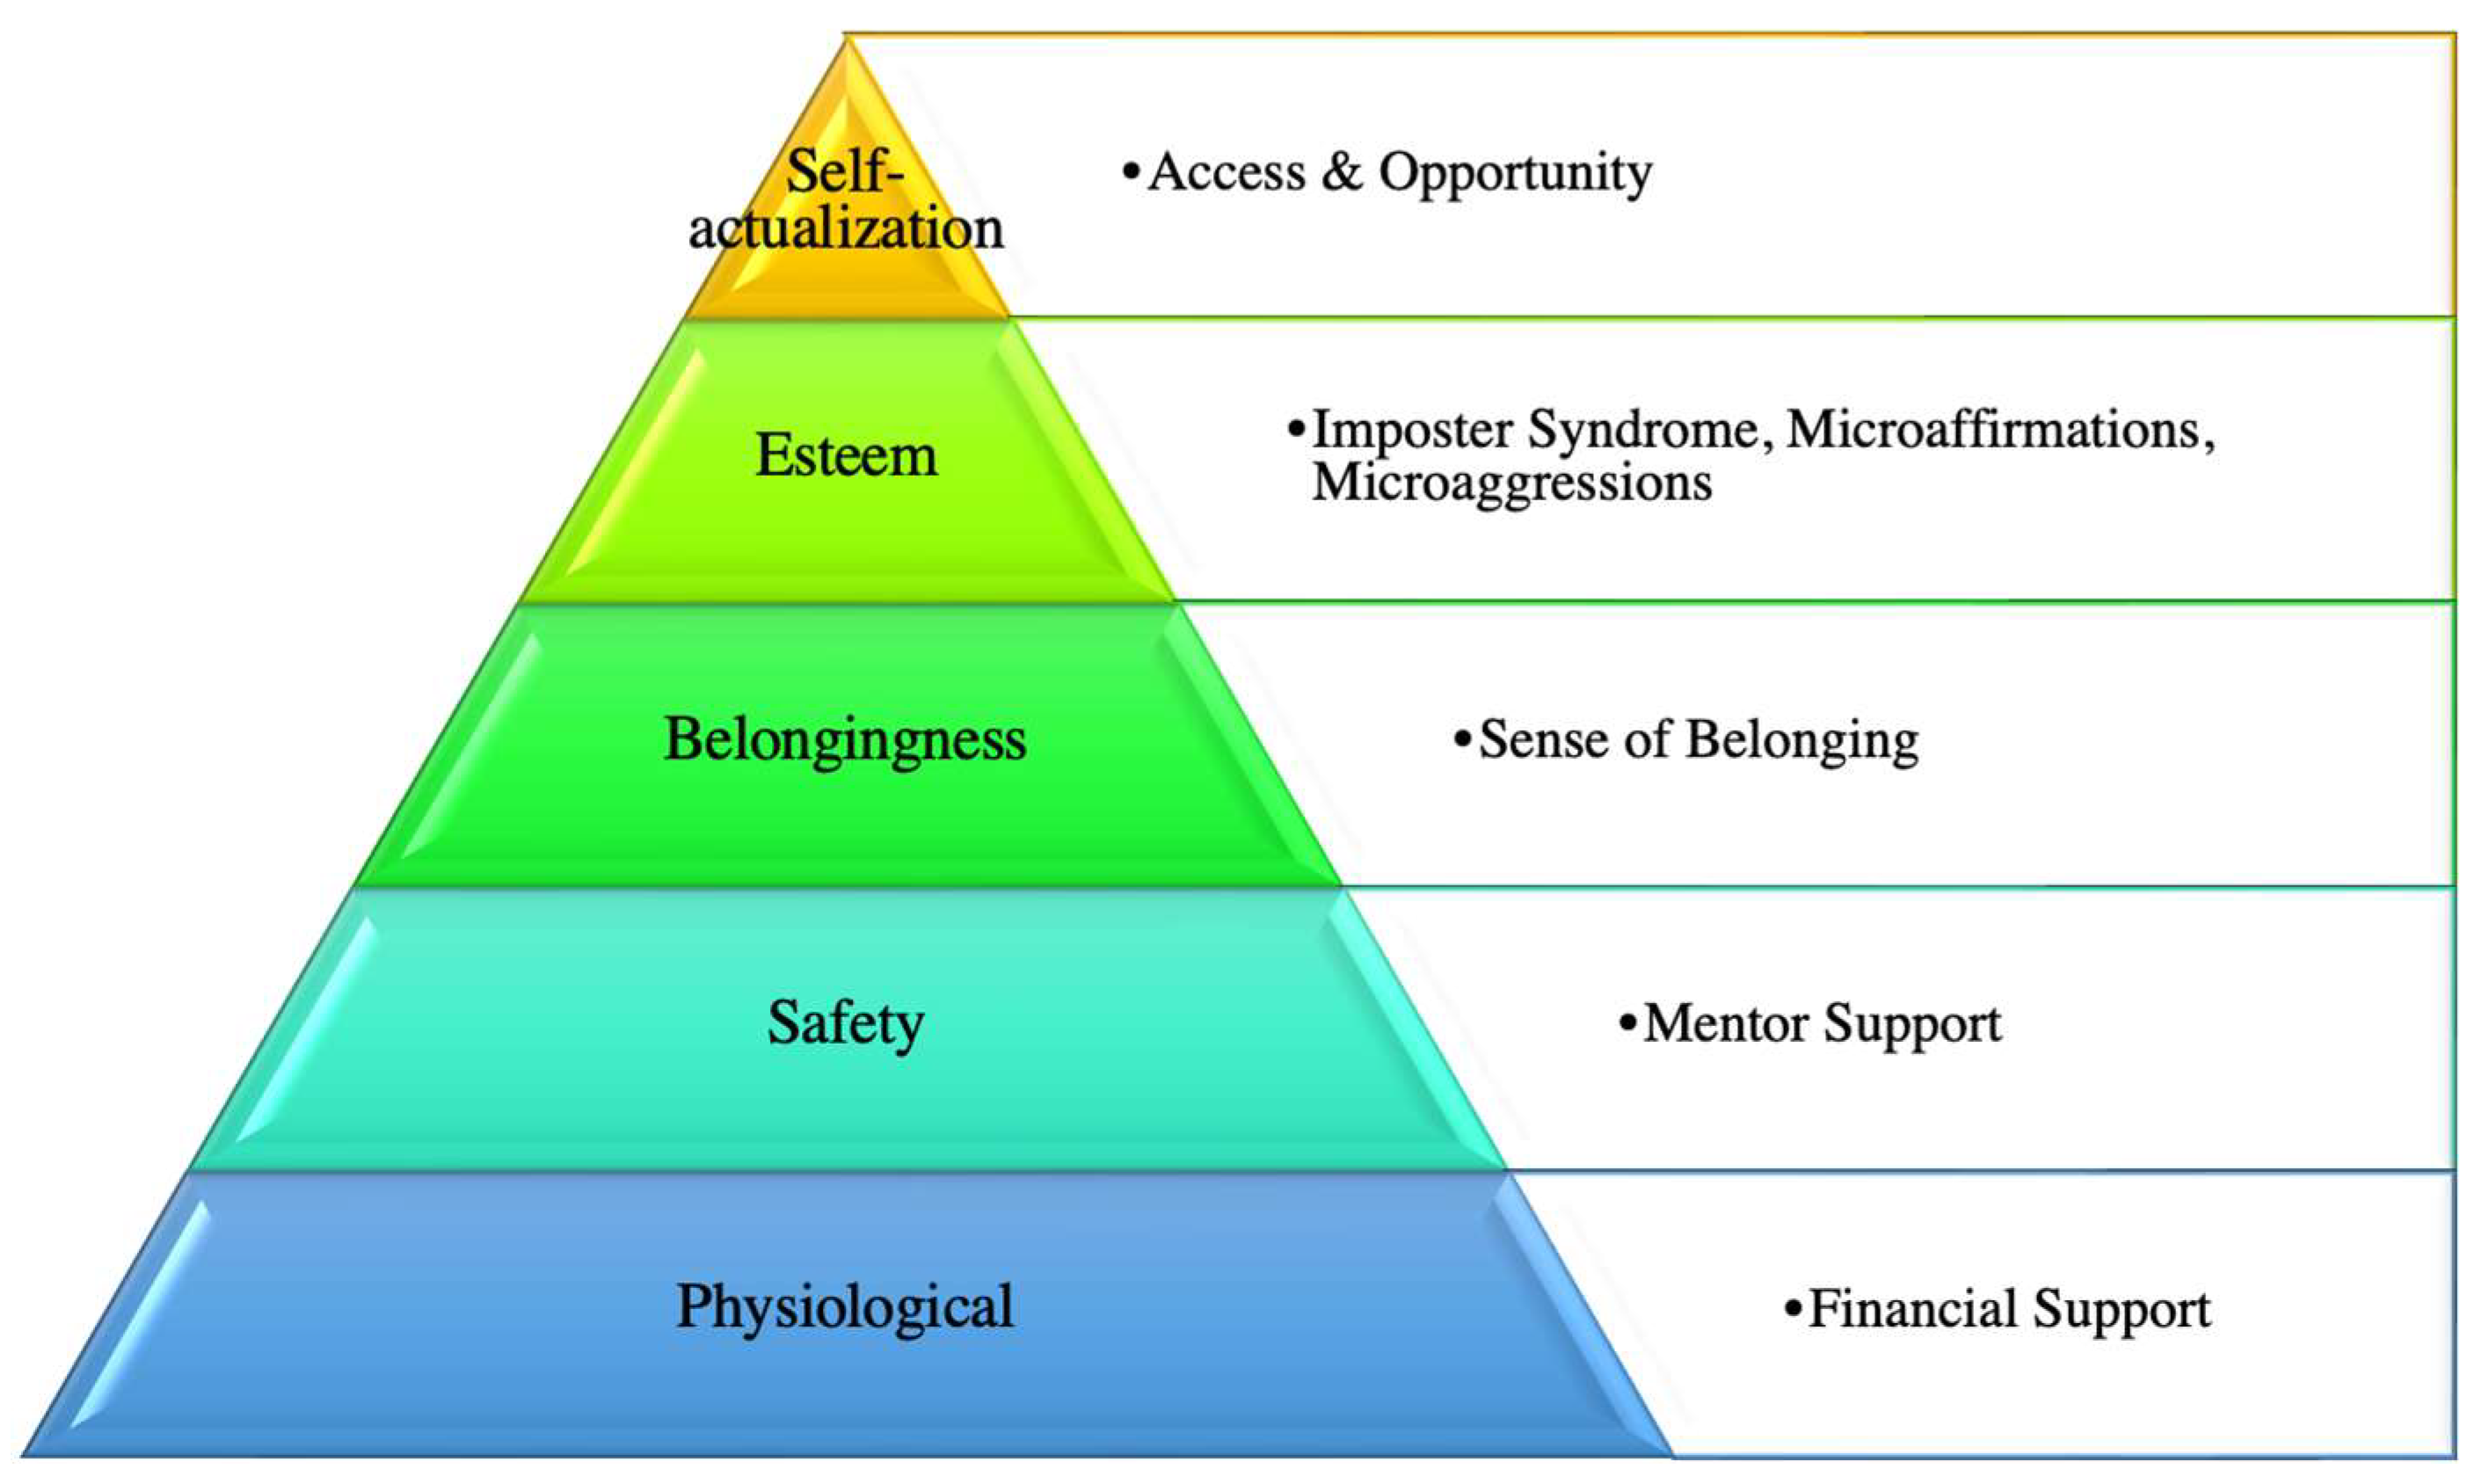
1.3. Theoretical Framework

Maslow’s Hierarchy of Needs is a motivational theory in psychology based on a five-stage model often depicted in a pyramid [56,57]. Deficiency needs motivate people when unmet (i.e., psychological, safety, belongingness, and esteem), and the motivation to fulfill them increases the longer these needs are unmet. Individuals desire to grow and reach their highest level of self-actualization [58]. Maslow posited that the lower levels must be partially satisfied before progressing to the high-level needs [59]. Applying the Hierarchy of Needs theory to education takes a holistic approach by looking at a student’s physical, emotional, social, and intellectual qualities and their impact on learning. Maslow described the need for students to feel emotionally and physically safe and accepted before they could reach their full potential, and that teachers have an essential role in creating those supportive environments [59,60].
As depicted by Maslow’s hierarchy, an individual’s behavior will first be motivated by physiological needs (e.g., food, shelter, and warmth) [56,57]. Though students were not asked directly about their food, shelter, or clothing, the financial support they received during graduate school is the basis for meeting their physiological needs. After physiological needs, individuals focus on safety needs that entail security, order, stability, and freedom from fear [56,57]. Mentor support can be used to reflect upon safety, providing students with greater insight into completing a graduate program, creating feelings of security, stability, and freedom from fear. In this study, survey items corresponding to key factors for graduate success were developed and validated for the GSSS, and these subscales were linked to Maslow’s Hierarchy of Needs (Figure 1).
Once the physiological and safety needs are met, love and belongingness follow. This level involves a human’s need for interpersonal relationships and belonging to a group (e.g., family, friends, work) [56,57]. Sense of belonging can be used to understand students’ belongingness, measuring their social connectedness to their environment. Esteem is the last level in the deficient needs and can be divided into: (1) esteem for oneself, as with achievement and independence, and (2) reputation and respect from others [56,57]. From the survey’s constructs, esteem for oneself is inversely represented by imposter phenomenon items, and reputation or respect correspond to microaffirmations and microaggression items.
Maslow described the need for self-actualization as a need “to become everything one is capable of becoming” [59] (p. 64). A student’s sense of self-actualization can be reflected in the survey subscale, access and opportunity, representing the aspects of graduate school that allow students to reach their full potential as researchers through creative activities (i.e., publishing papers, presenting at conferences, and conducting research). Maslow believed every individual could move toward the level of self-actualization but that one’s progress was often inhibited by a failure to meet the lower needs or inhibited by negative experiences [59].

1.4. Existing Survey Measures

Prior work on college success has focused on undergraduate models, whereas graduate student studies focused on attracting the best and/or underrepresented students [41,61,62]. There is limited information on factors associated with graduate student retention or degree progression. Girves and Wemmerus created a model to link department and student characteristics, financial support, and student perceptions of faculty, program involvement, department satisfaction, and alienation to predict progress toward master’s or doctoral degrees [51]. The study found that factors related to academic integration, students’ relationship with faculty, and department characteristics were important, but social integration did not predict degree progress. The study also found that the type of financial support was important for doctoral students, and student characteristics were influential for master’s students. Girves and Wemmerus posited that it is important to identify and understand differences in degree program patterns by different groups of students to develop strategies for enhancing retention and graduate degree completion, as strategies may differ between groups [51].
In developing the GSSS, previously validated instruments were located and considered for use during the initial face validity process (see the Section 2). The O’Meara et al. graduate students’ sense of belonging survey provided insights for items relating to the sense of belonging, whereas the 2000 National Doctoral Program guided the development of items with mentor relationships [63,64]. The Clance IP Scale was referenced to assist in item development for the imposter phenomenon [65]. The Racial Microaggressions Scales and the Racial and Ethnic Microaggressions Scale gave insight into the wording of the original GSSS’s race and gender microaggression items [66,67]. The Estrada et al. survey for undergraduate persistence in science career pathways informed the development of items in the GSSS’s microaffirmation scale [68]. Various items for the previously mentioned validated surveys were selected and modified to accommodate the needs of the current study. Other items were created based on areas of concern from the literature and suggestions from fellow faculty members, including financial support and advisor relationships [69].

2. Materials and Methods

2.1. Survey Development

During the survey development, experts on equity and inclusion were consulted on the topics addressed, and an expert in psychometrics was consulted for the survey design. The survey was shared in multiple rounds of iterations, with approximately 15 faculty members, the graduate school dean and staff, the university diversity, equity, and inclusion committee members, and a diverse group of graduate students. After suggestions were considered and edits were made, the survey comprised 10 demographic questions and 51 questions developed from previous scales or areas of concern from the literature. IRB approval for the study was obtained, and students were asked to provide informed consent online prior to beginning the survey.

2.2. Survey Distribution

The survey was administered to thesis-based master’s and doctoral students via Qualtrics “https://www.qualtrics.com/login/ (accessed on 8 December 2020)”. Participants attended an R1 university in the southeastern United States that enrolled approximately 36,000 students, with 5400 graduate students. The graduate student population comprised slightly fewer females (48.4%), and approximately one-quarter of the students identified as a racial/ethnic minority (24%). Thirty-one percent of the graduate students enrolled at the university were international, and faculty members were approximately 50% female and predominantly White (79.4%). This university is part of a state-wide system, and each university has a chancellor. At this university, the twelve colleges have their dean, distinct cultures, and in many ways, operate independently. In addition, there is a strong focus on STEM areas. These factors led to asking participants to identify their program area. No names were solicited, and the identities of the individuals who responded were hidden from the researchers. Invitations to participate in the survey were emailed to 4044 graduate students in research-based master’s or Ph.D. programs in early December, with the assistance of the university’s research administration office. Students graduating in December were not included in the survey as they were receiving other surveys related to graduation. In addition, students who were in non-research-based graduate programs were not included in the study (e.g., Master of Arts in Teaching). Of the 696 surveys begun, 537 participants completed at least 97% of the survey items.

2.3. Data Cleaning

When factor analysis is carried out with exploratory factor analysis (EFA) followed by confirmatory factor analysis (CFA), researchers often collect a single sample, as was performed in this study, and then split it into two halves. Without a specific splitting method proposed, most researchers use a random split approach with the hope that the random split will send equivalent sets from the original to the subsamples [70]. With smaller samples lacking common variance, equivalent samples are harder to obtain. Lorenzo-Seva advised employing a splitting method that produces equivalent (representative) subsamples [70].
Representative samples for EFA and CFA were obtained by sorting the responses by demographic information in the following order: college, race, gender, first-generation bachelor’s degree, first-generation graduate degree, US/international student, full-time/part-time, master’s/Ph.D., and department. Responses that matched the various iterations of the sorting mechanism were alternatingly assigned to EFA and CFA. After sorting, 274 responses were designated for EFA, and 277 responses were designated for CFA.

2.4. Exploratory Factor Analysis

The software package Statistical Package for the Social Sciences version 27 (2020) was used for data analysis. Testing for validity, exploratory factor analysis (EFA) was conducted to identify latent constructs and the variables that represent them in the instrument. From the original survey, 51 items were used in the analysis, including the following 9 categories, which were listed in this order in the survey but not labeled: (1) Microaggressions—Race (4 items), (2) Microaggressions—Gender (4 items), (3) Microaffirmations (5 items), (4) Imposter Syndrome (4 items), (5) Sense of Belonging (6 items), (6) Financial (8 items), (7) Mentor Relationships (7 items), (8) Professional Development (7 items), and (9) Thesis/Dissertation Process (6 items).

Factor Extraction, Rotation, and Retention

The Shapiro–Wilk test of normality revealed that the data were not normally distributed; therefore, principal axis factoring (PAF) was selected as the method of factor extraction, with maximum likelihood (ML) selected as the preferred method [71,72]. PAF was performed on the 51 items, followed by Promax rotation, a well-established oblique rotation that permits correlations among factors [72,73]. The EFA was conducted with five factors, as determined by the MAP (minimum average partial) analysis. Through an iterative process, items with communalities less than 0.200, cross-loading greater than 0.32, and covariances less than 0.4 were eliminated, resulting in the removal of 19 items [71,72,73,74].
The suitability of EFA for the dataset was evaluated for the 32-item, 5-factor model, and the Kaiser–Meyer–Olkin (KMO) measure of sampling adequacy and the Bartlett’s test of sphericity were 0.874 and p = 0.000, respectively [73]. The factor correlation matrix indicated the highest correlation of 0.505 between factors 1 and 3, whereas other factors ranged from −0.004 to 0.305. The eigenvalues for the 5-factor model ranged from 8.036 to 1.212 and explained 47.842% of the variance in the data.
Items from multiple scales (in the original survey) were redistributed and consequently entitled Faculty/Program Support and Respect (Factor 1) and Access and Opportunities (Factor 3). Factor 1 thus combined the originally intended categories of Sense of Belonging, Mentor Relationships, and Microaffirmations, which was different from the original intention of the researchers, based on the literature and prior surveys developed on these constructs. However, Cronbach’s alphas calculated for this five-factor model revealed that the values for the first three factors were very good, and those for the fourth and fifth factors were respectable (Table 1) [75].

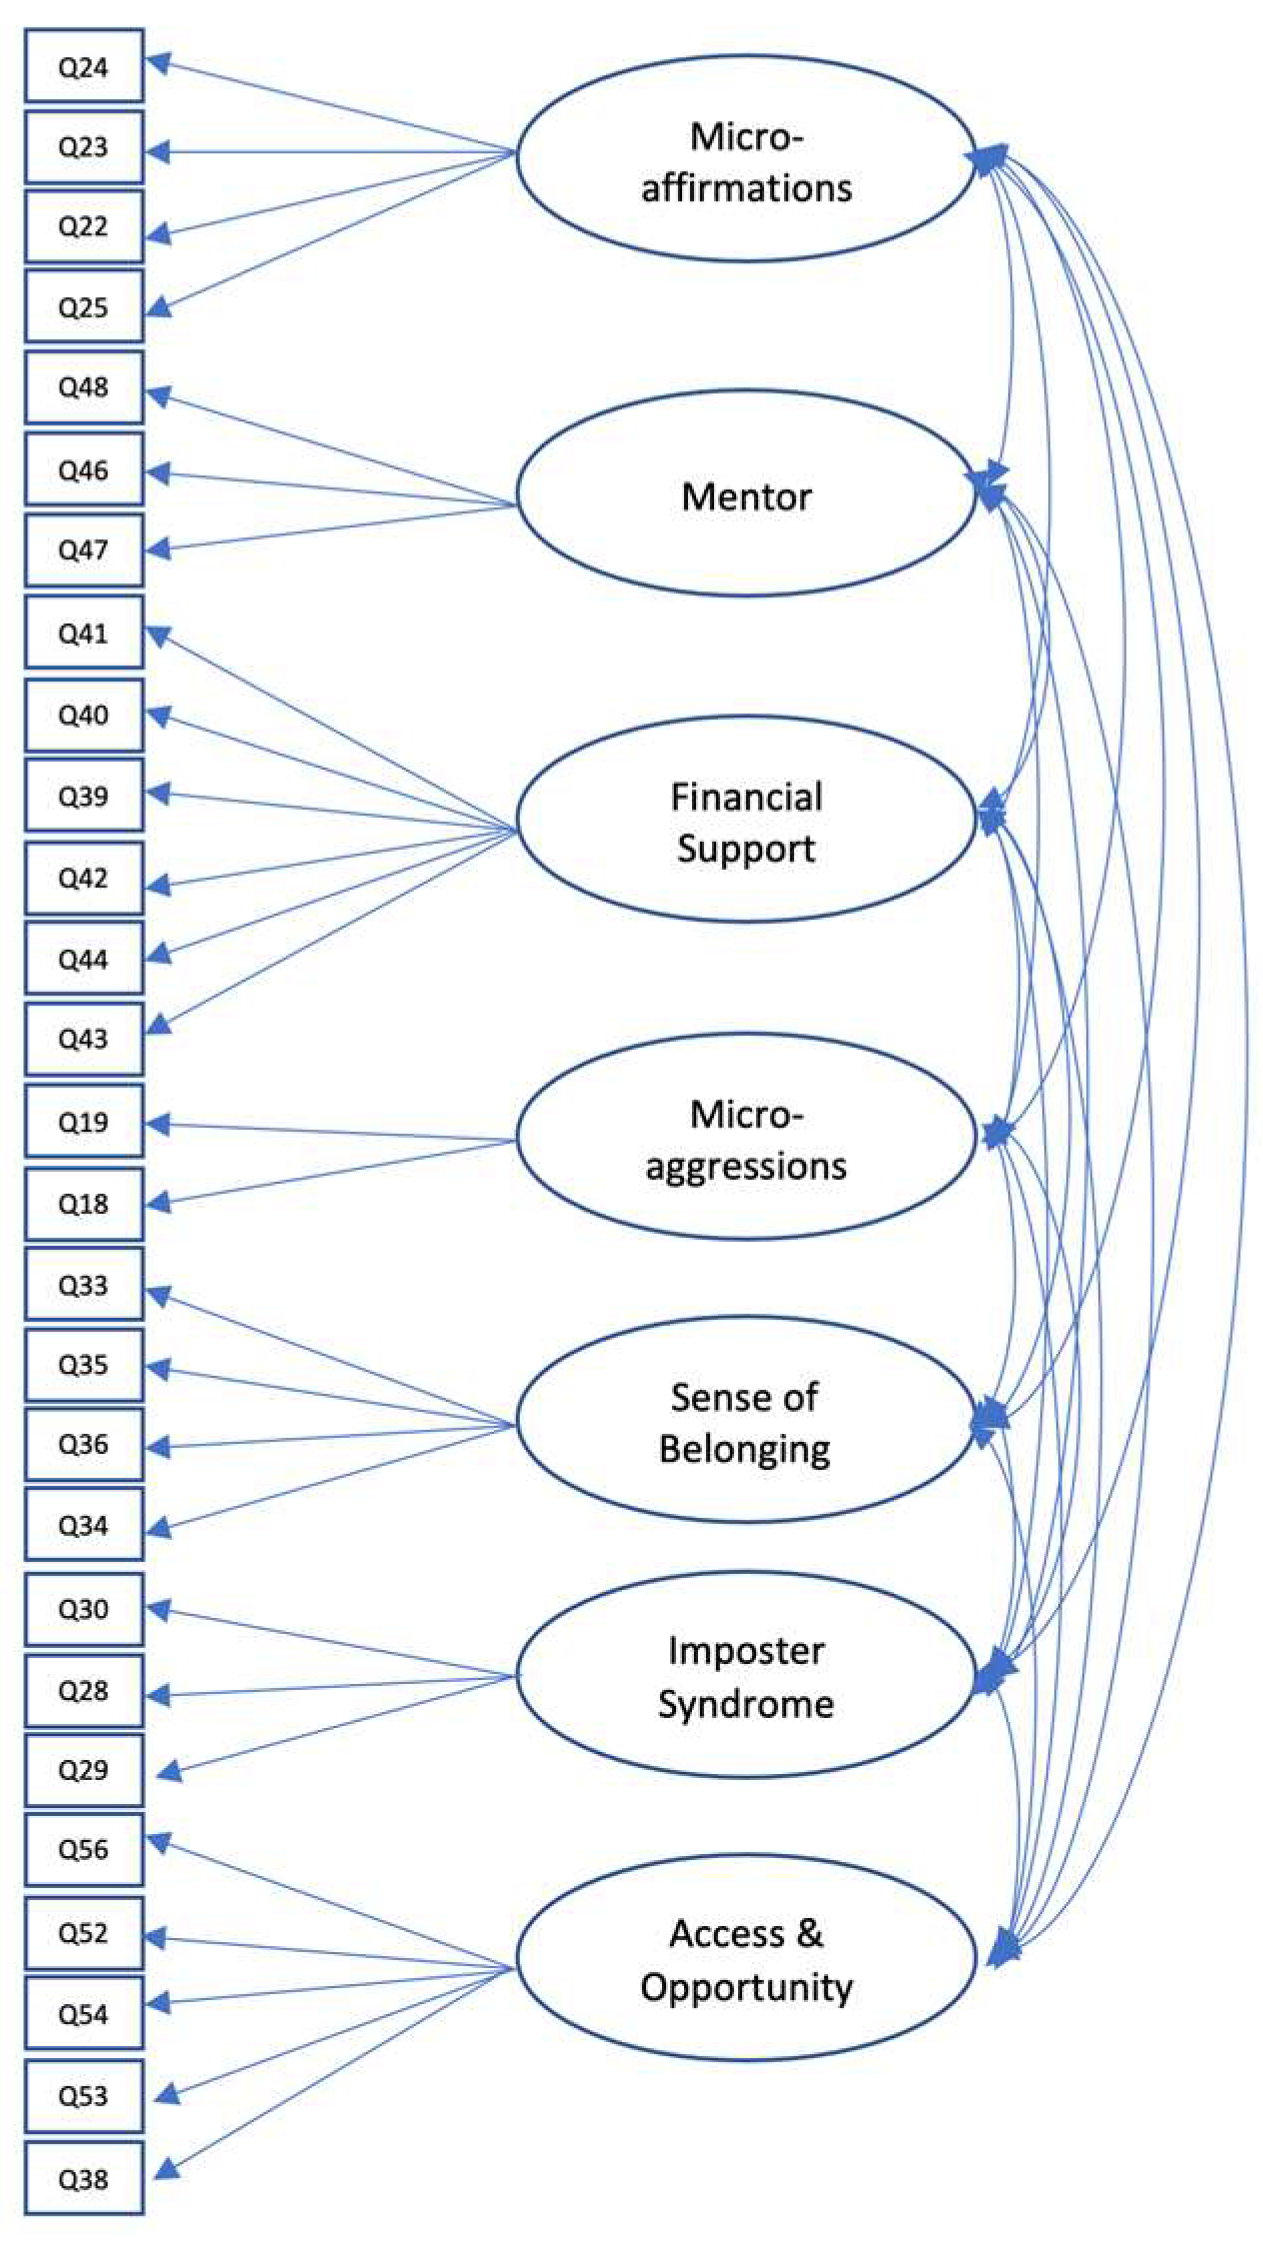
2.5. Confirmatory Factor Analysis

EFA can be described as an orderly simplification of interrelated measures to explore the possible underlying factor structure without imposing a preconceived structure [76,77]. CFA allows the researcher to test hypotheses of relationships between observed variables and underlying latent constructs based on knowledge from theory and empirical research [77]. Though the EFA from the first half of the data produced a five-factor model, CFA did not support this design, as seen in the poor model fit (Table 2, Step 1). The modification indices of the five-factor models suggested that several items on factor one be moved to other factors or eliminated. The issue with the EFA five-factor solution was that it did not conform to the underlying theory that drove the original subscale items (e.g., [77,78]).
After reviewing the literature on CFA and considerations of the nature of subscales, the decision was made to restore the survey subscales to be consistent with their original theoretical basis by splitting Support and Respect back into the originally intended categories of Sense of Belonging, Mentor Relationships, and Microaffirmations [79,80]. However, the 7-factor, 32-item model resulted in a poor fit (Table 2, Step 2). Based on modification indices, 4 items were removed in an iterative process, resulting in an acceptable fit for the 7-factor, 28-item model (Table 2, Step 3).
For this model (Figure 2), the Chi-square test results indicated an improved yet still poor fit (χ2(329, n = 271) = 620.919, p < 0.000). The results of the goodness of fit analyses indicated an acceptable fitting model (>0.90) with a CFI = 0.907. Though a CFI of 0.95 or greater is preferred, a value of 0.90 is acceptable [81]. The RMSEA revealed a reasonable fit at 0.057, and the SRMR was considered a good fit at 0.058 since it falls between 0.05 and 0.08 [81]. The EFA dataset was applied to the 7-factor, 28-item CFA model to see if the revised survey developed during the CFA was supported by the data in the original EFA. The EFA data were found to have an acceptable fit with this model (Table 3, Step 4), further supporting the 7-factor CFA model. The factor loadings for the items are represented in Table 3 for the 7-Factor CFA model.

3. Results

It was important to understand more about the participants in the sample. Research has shown that students’ experiences in higher education can greatly differ based on demographic characteristics, including gender, race, ethnicity, citizenship status, and first-generation status (e.g., [18,24,29,45,82,83]). Therefore, descriptive statistics were analyzed to describe the characteristics of the individuals who participated in the survey, along with item analysis to identify differences in item responses based on demographic characteristics (e.g., gender, race/ethnicity, citizenship status, part-time status).

3.1. Descriptive Statistics

Participants typed in their preferred responses for race/ethnicity and gender, responses were grouped, and small numbers of subgroups by race and ethnicity were condensed for analysis. For Race/Ethnicity, categories included: No Response (2.4%), African (0.4%), African American/Black (5.6%), Asian (14.2%), Hispanic/Latino (5.2%), Middle Eastern (9.9%), Multiracial (3.0%), Native American (1.3%), Turkish (0.4%), and White/Caucasian (57.7%). Of the respondents, 56.4% were Female/Woman, 39.9% were Male/Man, 3% were Nonbinary, and 0.7% had No Response. First-generation bachelor’s students comprised 22.7%, and 51.4% were first-generation graduate students. Seventy-eight percent were U.S. citizens, and 92.6% were full-time students. For degree type, 79.7% of the respondents were doctoral students, and 19.9% were master’s students. Second-year graduate students comprised 27.4%, followed by first-year graduate students at 25%. Third-year to fifth-year and beyond ranged from 19.4% to 12.1%. Students represented twelve colleges, six of which were STEM-focused.

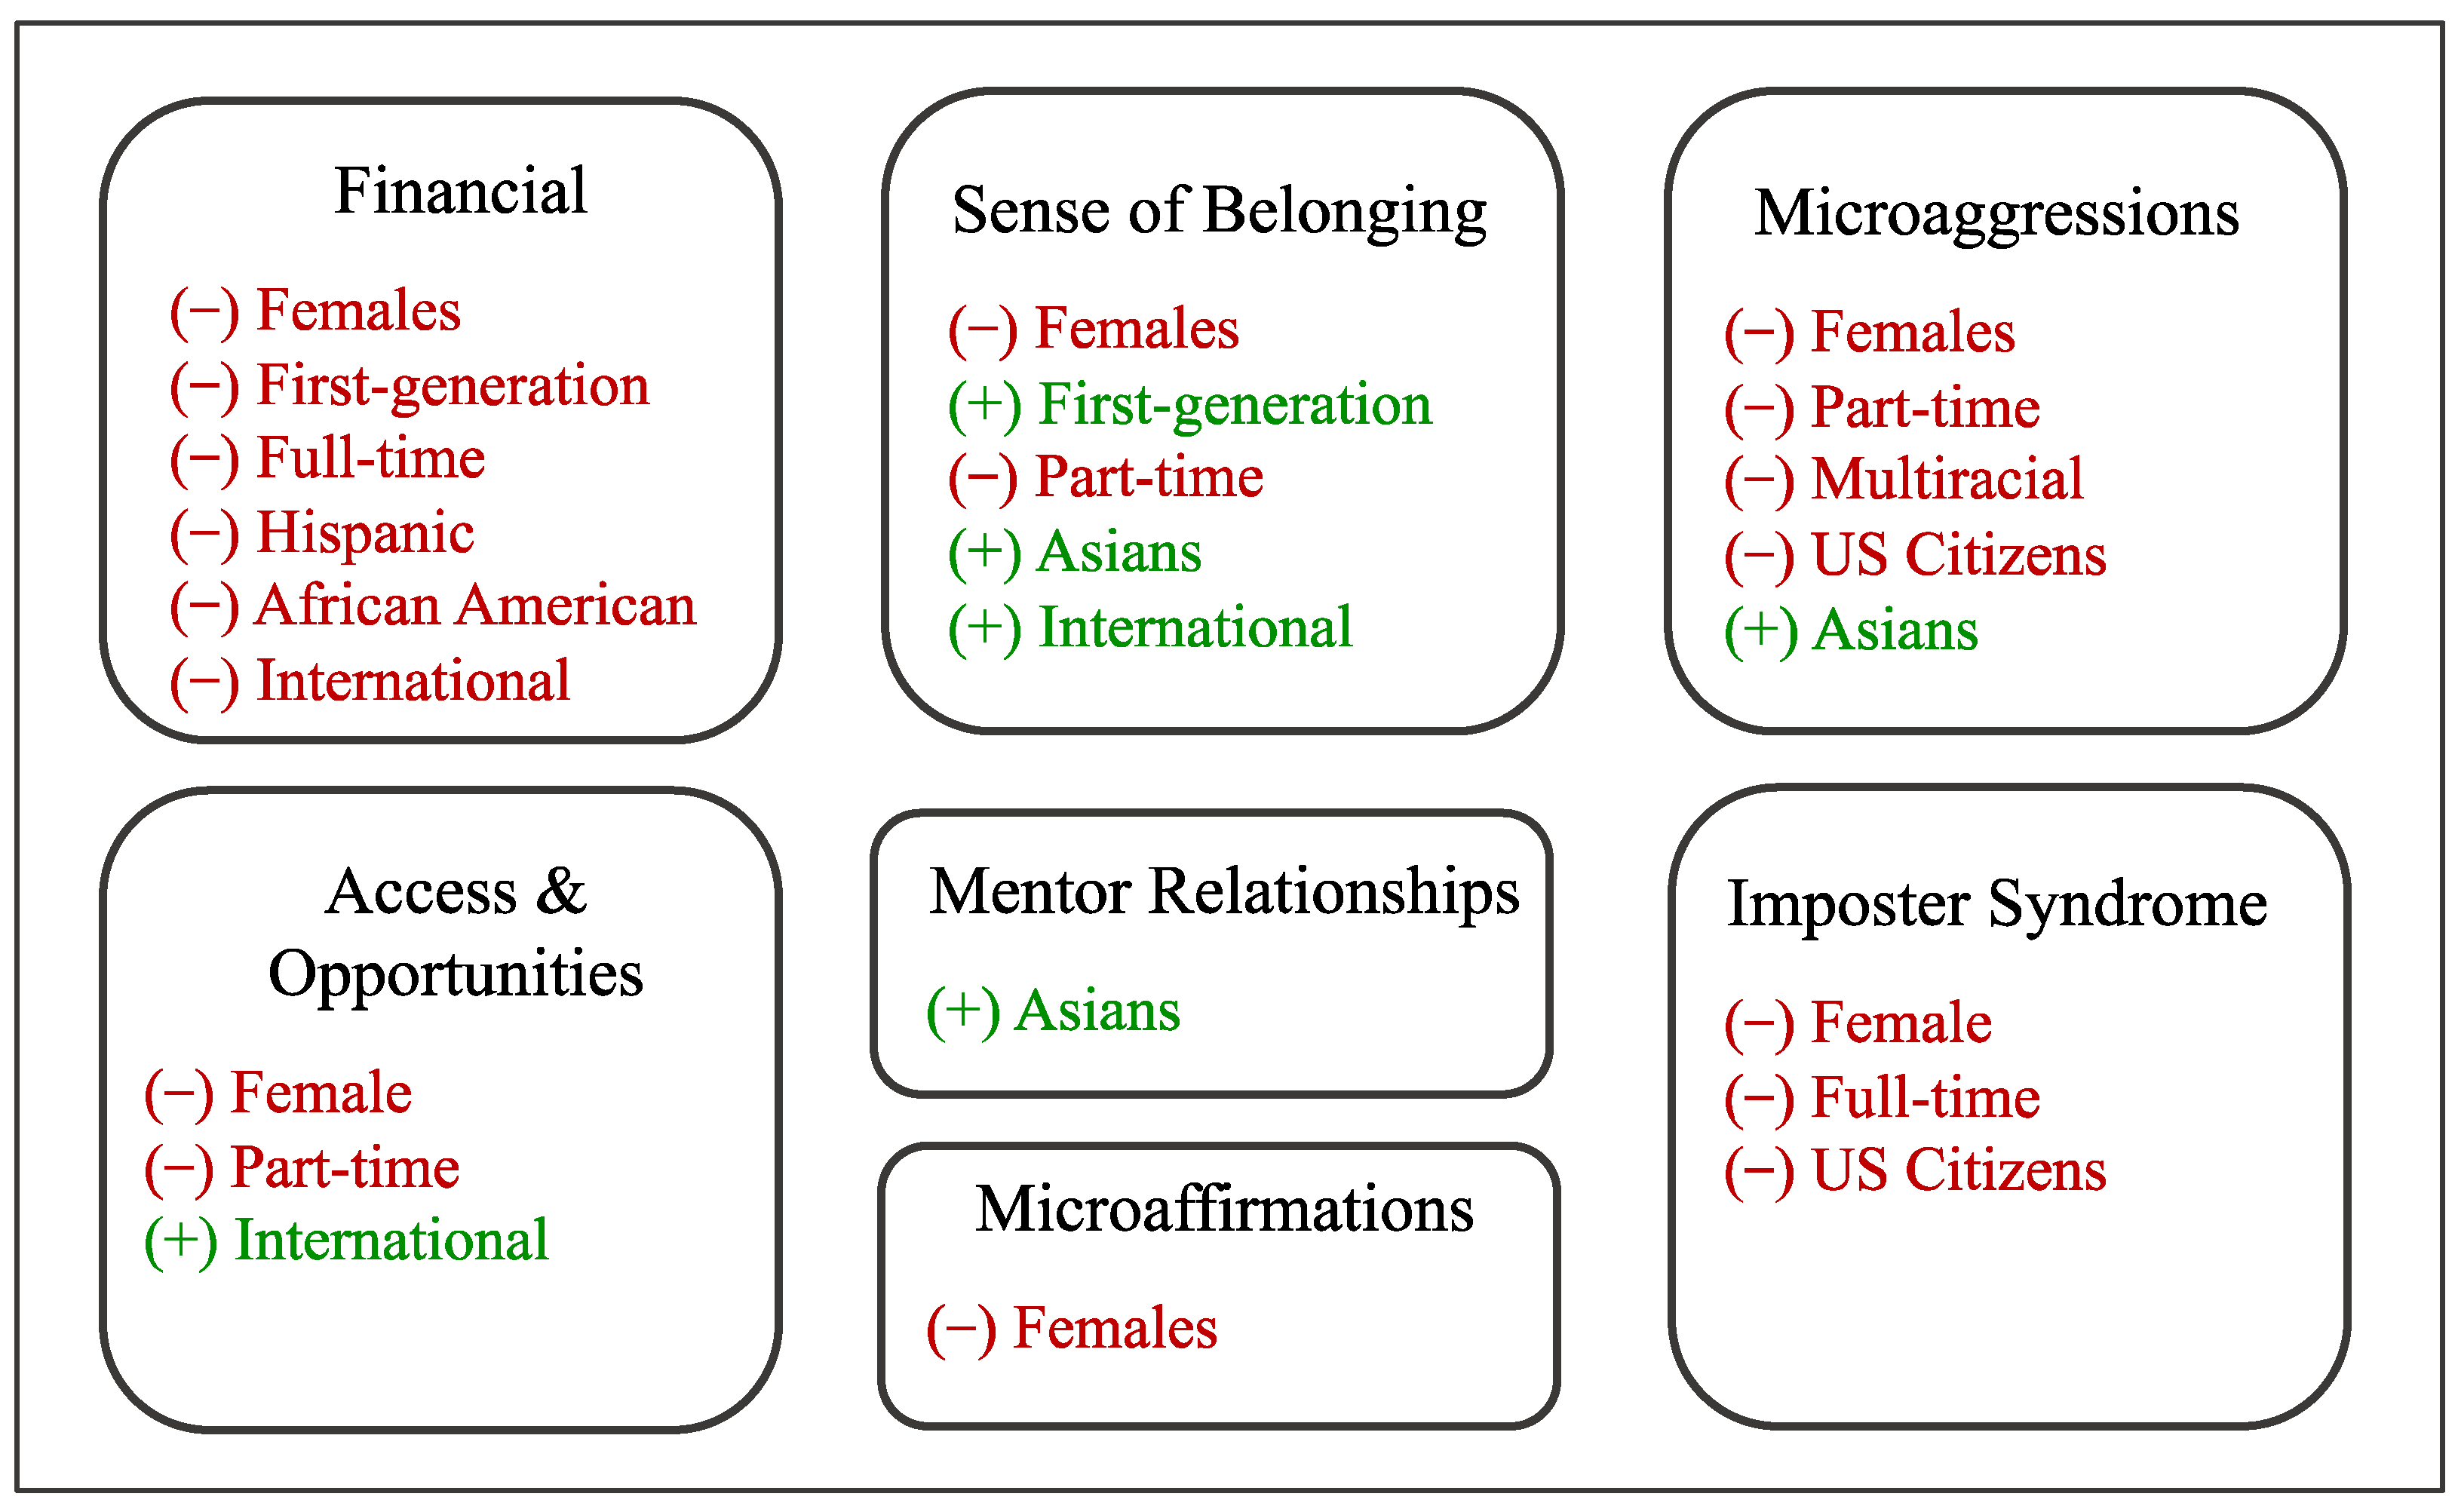
3.2. Graduate Student Success Survey Item Analysis

All survey items were evaluated with a 5-point Likert scale, with 1 representing “strongly disagree” and 5 representing “strongly agree”. For reverse-coded items, a score of 5 represented “strongly disagree” and an R is displayed beside the item number (i.e., Q18R). If a subgroup revealed a lower mean score for reverse-coded constructs, this indicated a more prevalent concern and was considered an inhibiting factor. Before item analysis by subgroup, the survey items were tested for normality with the Shapiro–Wilk test and the Kolmogorov–Smirnov test, and all items failed to reveal normality. Consequently, a one-way, nonparametric ANOVA test, the Kruskal–Wallis test, was utilized to identify significant relationships between survey items and subgroups.

3.2.1. Race and Ethnicity

Asian students had a greater sense of belonging than Hispanic/Latino, Middle Eastern, and White/Caucasian students (Q33) and felt less isolated than Hispanic/Latino, Middle Eastern, Multiracial, and White/Caucasian students (Q36R). Asian students perceived more faculty feedback than Hispanic/Latino, Middle Eastern, and White/Caucasian students (Q48). In contrast, Hispanic/Latino students expressed more financial concerns than Asian, Middle Eastern, and White/Caucasian students. African American students indicated greater financial concerns than Middle Eastern and White/Caucasian students (Q43R; Table 4).
Overall, the microaggressions related to one’s gender were experienced differently by different racial and ethnic groups. Asian students perceived fewer microaggressions based on their gender than students who were Hispanic/Latino (Q18R, Q19R), Middle Eastern (Q18R), Multiracial (Q18R), White/Caucasian (Q18R, Q19R), and African American/Black (Q19R). African American/Black students perceived fewer microaggressions based on their gender than did Middle Eastern, Multiracial, and White/Caucasian students (Q18R). In contrast, Multiracial students perceived more microaggressions for gender than students who were White/Caucasian (Q18R, Q19R), Middle Eastern (Q19R), and Asian (Q19R; Table 4).

3.2.2. Gender

Females expressed fewer occurrences of microaffirmations (Q22–Q25) and more microaggressions based on their gender than male students (Q18R, Q19R). Females also expressed a lower sense of belonging (Q35) and fewer opportunities to write papers for publications (Q56). Females expressed higher rates of imposter syndrome (Q28RQ30R) and shared more concerns about financial support over the summer (Q40R; Table 5).

3.2.3. Student Status

U.S. citizens felt more isolated than international students (Q36R), yet international students perceived less support from other graduate students (Q34). International students had more concerns about financial support (Q40R, Q43R) but expressed that they had more opportunities to write academic papers for publications than students who were U.S. citizens (Q56). Students who were U.S. citizens perceived more microaggressions for gender (Q18R, Q19R) and had a greater sense of imposter syndrome than did international students (Q28R–Q30R; Table 5).
Part-time students responded that they felt more isolated in their program (Q36R) and had fewer opportunities for writing academic papers (Q56) or opportunities for assistantships for research (Q38). Full-time students had more financial concerns about summer support (Q40R) and affording technology (Q44R). Full-time students responded that they had a greater sense of imposter syndrome (Q28R–Q30R), whereas part-time students perceived more microaggressions for gender (Q19R; Table 5).
First-generation bachelor’s students (n = 122) had a greater sense of belonging with their advisors (Q32, M = 4.25, SD = 1.025) than non-first-generation bachelor’s students (n = 413; Q32, M = 4.02, SD = 1.092). However, first-generation bachelor’s students had greater concerns over financial issues regarding debt (Q42R, M = 3.06, SD = 1.451) than non-first-generation bachelor’s students (Q42R, M = 3.41, SD = 1.388).

3.3. Limitations

The findings of this study should be considered in light of a number of limitations. As a result of the validation process, the retained microaggression items focused on gender and did not include race. The survey sampled students at one point in time at an R1 research university in the southeastern U.S. and took place during a global pandemic. Researchers organized the open-response demographic items into condensed categories for analysis. Therefore, if the survey had explored other factors, taken place outside of a pandemic, condensed the race and ethnicity differently, or taken place at a different time or with a different sample, the results would likely have been different. Conducting a mixed-methods study in future research may illuminate issues that were not as prominent through the survey as with the microaggressions related to race/ethnicity. Keeping these limitations in mind, the findings will now be discussed.

4. Discussion

Gaining insight into a holistic view of graduate students’ experiences through survey research provides knowledge about aspects of graduate education that tend to be anecdotal or specific to particular students and programs. Findings can inform graduate programs about where to focus their efforts to enhance graduate education. This work was informed by Maslow’s Hierarchy of Needs theory, whereby students’ lower-level needs (i.e., psychological support and safety) must be partially met before they can attend to higher-level needs (i.e., belonging and esteem) [56,57]. Ultimately, at the highest level of self-actualization, graduate students will successfully create new knowledge and all the activities associated with that scholarship. The findings of this study sought to provide insight into whether, in this sample, there were needs that were unmet or partially met. In addition, the analysis using demographic factors will highlight if differences in students’ experiences were linked to factors, such as gender and first-generation status.

4.1. Validity and Reliability of the GSSS to Explore Experiences of Graduate Students

The GSSS was developed to have a theoretically based, holistic measure to explore the experiences of thesis-based graduate students. The final survey is composed of 28 items, with 7 subscales, which range between 2 and 6 items that measure: Microaffirmations, Sense of Belonging, Mentor Relationships, Financial, Access and Opportunities, Imposter Syndrome, and Microaggressions. The original EFA validated a model with 5 factors and 32 items. Some of the subscales matched constructs from the literature, such as Sense of Belonging, whereas others contained items from multiple scales, as with Imposter Syndrome and Microaggressions. However, the five-factor model had a poor model fit with CFA. After reviewing the literature on CFA and considerations of the nature of subscales, the decision was made to split Support and Respect back into the originally intended categories of Sense of Belonging, Mentor Relationships, and Microaffirmations [79,80]. Additional modifications were made to improve the model fit until an acceptable model was found, with 7 factors and 28 items [81]. The survey operated better and conformed more closely to constructs in the literature (e.g., [24,28,45]).
Many prior surveys focused on one factor, and therefore did not represent the complexity of underrepresented students’ challenges experienced in graduate school (e.g., [64,65,67]). With the development of the GSSS, multiple facets of graduate students’ experiences were explored through the seven subscales. The range of factors provides a more holistic depiction of students’ experiences, including financial aspects, mentor relationships, sense of belonging, and imposter syndrome (e.g., [28,29]).
Many of the survey items that were not retained were reverse-coded items, which has been a problem discussed in the literature [84]. This included the removal of all the microaggression questions related to race, making the survey unable to capture these concerns expressed by URM students. This was disappointing, especially considering that the survey was conducted at an R1 research university with higher percentages of White students.

4.2. Factors That Influence Graduate Students’ Success and Areas of Needed Support

Findings from the GSSS highlighted variances in barriers students encountered based on demographic characteristics (Figure 3). Financial support and microaggressions were concerns for many underrepresented groups. Other students perceived more feelings related to imposter syndrome and a lower sense of belonging. In contrast, concerns with microaffirmations and mentor relationships were not as widespread across the subgroups.

4.2.1. Race and Ethnicity

Demographic information allowed extensive analysis of differences between groups of students (Figure 3). Hispanic and African American students expressed more financial concerns, whereas Multiracial students perceived more microaggressions. Hispanic students had a lower sense of belonging and perceived less faculty feedback, and Hispanic and Multiracial students felt more isolated. Although studies similar to this are not present in the literature, there are a number of studies at the undergraduate level that have investigated related constructs. Havlik et al. found that undergraduate URM students experienced a sense of otherness based on their race, ethnicity, first-generation status, and socioeconomic status, feelings that were exacerbated when being tokenized in class or asked to represent their entire culture [82]. In a similar study, Bettencourt et al. documented a similar lack of belonging in URM first-generation college students and found that they also experienced pressure to be an economic success for themselves and their families [85].

4.2.2. Gender

In this study, females emerged to have a range of challenges, including a lower sense of belonging, more imposter syndrome, more microaggressions, and fewer microaffirmations than their male counterparts. Females also perceived less financial support and fewer opportunities to write academic papers. Similar to the findings in this study, Tao and Gloria found that the imposter phenomenon particularly affected women, resulting in a lower sense of academic self-efficacy, a more negative view of the academic context, and more pessimistic feelings about obtaining their doctorate [29]. Walton et al. found that interventions on social belongingness and affirmations helped undergraduate female engineering students manage stress from social marginalization, raising their grade point averages [86]. The details of the female graduate students’ environments that may have influenced their feelings of belonging were beyond the scope of this study.

4.2.3. Intersection of Race and Gender

Being a woman and a URM led to a higher combination of negative support factors. Females and URM students perceived more concerns with financial support, a lower sense of belonging, and more microaggressions. As supported by the literature, females who also identify as a URM encounter greater struggles (e.g., less recognition, fewer supportive relationships, stereotyping, and self-doubt), necessitating additional supports to assist with their persistence during their academic careers (e.g., [24,45]). In an undergraduate study, Kendricks et al. found that females and URM had a lower sense of belonging and associated these with a lack of female and/or URM mentors [42]. Greater access to mentors and role models can reduce these inhibiting factors for female and URM students (e.g., [24,87]).

4.2.4. Student Status—International Students

International students in this study expressed a stronger sense of belonging but experienced more concerns with financial support. They also perceived less support from other graduate students. These findings resonate with those of Curtin et al., who found that international students reported a stronger sense of belonging and placed a higher value on research-related and academic experiences [39]. In contrast, Girves and Wemmerus noted that because international students had to be enrolled full-time and demonstrate sufficient financial support to continue their program, they had greater motivation to complete their degree [51]. Consistent with this study, Nguyen found that international graduate students often struggle with financial concerns, which can lead to stress that negatively impacts their academic performance [88]. This study responded to the concerns of Ren and Hagedorn that the diverse needs of the international graduate population are not fully understood [83].

4.2.5. Student Status—Part-Time

Part-time students in the survey felt more isolated and perceived more microaggressions than full-time students. They also felt they had fewer opportunities for writing academic papers and conducting research. Since part-time students work during the day, they often take classes in the evening. The work/school schedule part-time students often follow may inhibit participation in social functions, contributing to a lower sense of belonging. Similarly, their limited time on campus could interfere with part-time students’ participation in research, writing for publications, and attending conferences. In prior work, Pascarella et al. asserted that increased work responsibilities of undergraduate students contributed to lower levels of involvement in extracurricular activities, limiting their obtainment of social capital [4]. Similarly, Ward et al. found that working undergraduate students were less likely to volunteer in a research lab because they needed to financially contribute to their families to pay for their education [89]. In the current study, this trend is reflected in part-time graduate students’ lower perceptions of Access and Opportunity, documenting these factors with graduate students.

4.2.6. Student Status—First-Generation Students

Findings in this study indicated differences in graduate students who were the first in their families to attend college or graduate school. These individuals perceived greater financial concerns but also had a greater sense of belonging. Continuing generation students use their family’s collected history and knowledge to inform their graduate school experiences as a cognitive map to assist students in making informed decisions [12,48]. In contrast, first-generation students arrive at college with limited social capital and struggle to gain more due to financial and work commitments [10,90]. Gardner suggested that increased interactions with advisors and other students could improve first-generation students’ cognitive map [12]. Comparably, Johnson et al. promoted a program-specific cohort model in which first-generation students may benefit from taking core classes together [91].

4.2.7. Financial Support

The findings of this study indicated that concerns with financial support were particularly salient for students who identified as female, part-time, and URM. The greater financial concerns in several of these subgroups may reflect the lack of social capital (e.g., navigating the financial aspects of the university) in underrepresented students. Vasil and McCall argued that underrepresented students, who often lack a family background with college experience, are often unaware of how stipends may be taxed, the cost of student fees, or the cost of attending conferences [92]. The study’s findings suggest the need for more guidance to assist students in understanding the financial aspects of graduate school while navigating assistantships, fellowships, student loans, and the financial aid process. Sullivan and Repak addressed the financial challenges students experienced in graduate school, including a lower standard of living and expenses not covered by assistantships [93]. As many graduate students are unable to complete their graduate degrees due to financial strain, it is imperative that financial planning is incorporated into graduate education [93].
Additional support through mentor relationships, financial planning, and social connectedness can assist underrepresented students in addressing the barriers they encounter and improve their success through greater degree attainment and improved mental well-being [25,87,93]. The administration of this survey could provide data on graduate students to inform university leaders of the underlying issues in their programs, departments, colleges, and/or universities.

5. Conclusions

This research sought to gain a holistic understanding of factors that support or inhibit graduate student success, particularly those students who have been historically underrepresented. The Graduate Student Success Survey (GSSS) was developed and validated for use with M.S. and Ph.D. students at a university in the southeastern United States. This instrument is composed of 28 items over 7 factors: Microaffirmations, Sense of Belonging, Mentor Relationships, Imposter Syndrome, Access and Opportunities, Microaggressions, and Financial Support. The findings of this survey demonstrated that graduate students’ experiences often varied based on factors such as citizenship, race and ethnicity, or gender.
Initial analysis of the survey results revealed that some subgroups were more affected by aspects of Maslow’s Hierarchy of Needs than others [58]. Females had more concerns with physiological needs (Financial Support), belongingness (Sense of Belonging), and esteem (Imposter Syndrome, Microaffirmations, and Microaggressions). Underrepresented minority students struggled with physiological needs (Financial Support), safety (Mentor Support), belongingness (Sense of Belonging), and esteem (Microaggressions). The survey also revealed differences between first-generation college students and physiological support (Financial Support). In contrast, part-time students were impacted by belongingness (Sense of Belonging), esteem (Microaggressions), and self-actualization (Access and Opportunity).

5.1. Recommendations for University Programs

The findings of this survey suggest that there are concerns and differing needs of graduate students based on a wide range of demographic factors and program areas. The GSSS findings led to a number of recommendations to assist students and further develop faculty to support these students. These include:
  • Raise the awareness of faculty and administrators about the differences in the experiences of graduate students based on gender, race and ethnicity, and student status.
  • Work with faculty to help them understand the critical role of graduate student mentoring, require mentoring training, and offer additional mentoring support or programs to students.
  • Develop a program-specific cohort model and encourage informal student cohorts.
  • Include graduate student mentorship between beginning students and those with some experience.
  • Provide clear information about students’ financial obligations and comprehensive financial planning counseling.
  • Allocate greater financial support through assistantships, fellowships, financial aid, and student loans.
  • Provide professional development opportunities for graduate students with academic writing, publishing, and conference presentations.
  • Offer seminars or workshop series for graduate schools on salient issues (i.e., imposter syndrome, microaggressions, career development, research, and publication).

5.2. Recommendations for Future Research

Planned future iterations of this survey may provide more definitive insight into the challenges experienced by disadvantaged groups and identify supports that address the inequalities for success shared by some subgroups, with the following modifications:
  • Focus more deeply on the profile of the respondents (e.g., socioeconomic background, international status, or first-generation status) and common environmental factors that provoke their needs in the context of Maslow’s pyramid.
  • More broadly distribute the survey with subsequent administrations to capture a greater diversity of graduate students’ experiences by increasing the number of underrepresented students (e.g., females, URM, international students), types of universities (e.g., HBCU, private institutions), and locations of universities (beyond the southeastern United States).
  • Beyond the survey, it is recommended that graduate students, particularly those who are underrepresented in their programs, be interviewed to understand more about their environments and how they influence their feeling of belonging and other success factors.
Developing and implementing the Graduate Students Success Survey was a positive step toward a more holistic understanding of factors that support or inhibit graduate student success. Considering the expected drop in college enrollment expected in 2025, it seems more important than ever to meet the needs of a diverse range of students [94,95]. It is hoped that the findings and recommendations of this study will help to enhance graduate education and improve inclusivity and success for all students.

Author Contributions

Conceptualization, K.M.C. and M.R.B.; methodology, K.M.C. and M.R.B.; validation, K.M.C.; formal analysis, K.M.C.; writing—original draft preparation, K.M.C.; writing—review and editing, K.M.C. and M.R.B.; visualization, K.M.C. and M.R.B.; project administration, M.R.B.; funding acquisition, M.R.B. All authors have read and agreed to the published version of the manuscript.

Funding

This research was funded by UNITED STATES DEPARTMENT OF AGRICULTURE NATIONAL INSTITUTE OF FOOD AND AGRICULTURE (USDA NIFA), grant number (#2017-67009-26771) and College of Education and the Provost’s Office at NORTH CAROLINA STATE UNIVERSITY.

Institutional Review Board Statement

The study was conducted in accordance with the Declaration of Helsinki, and approved by the Institutional Review Board of NORTH CAROLINA STATE UNIVERSITY (23581 and 4 December 2020).

Informed Consent Statement

Informed consent was obtained from all subjects involved in the study.

Data Availability Statement

The datasets generated and analyzed during the current study are not publicly available due to the potential to compromise the individuals’ privacy but are available from the corresponding author upon reasonable request.

Acknowledgments

We are grateful for our colleagues who reviewed many drafts of the original items and the graduate students who took the time to respond to the survey and share their views of their graduate experiences. A special thank you to the Graduate School Dean Peter Harries for his support and Nancy Whelchel, assistant vice provost for institutional research and analysis, for her assistance in the distribution of the survey.

Conflicts of Interest

The authors declare no conflict of interest.

References

  1. Women, Minorities, and Persons with Disabilities in Science and Engineering: 2019; National Science Foundation, National Center for Science and Engineering Statistics: Alexandria, VA, USA, 2019.
  2. Miller, J.A.; Joseph, A.; Langford, G.M.; Fedoroff, N.V.; Natalico, D.S.; Savitz, M.; Simberloff, D. The Science and Engineering Workforce: Realizing Americas Potential; National Science, Board, National Science Foundation: Alexandria, VA, USA, 2003; pp. 3–69.
  3. Xu, Y.J. Career Outcomes of STEM and Non-STEM College Graduates: Persistence in Majored-Field and Influential Factors in Career Choices. Res. High. Educ. 2013, 54, 349–382. [Google Scholar] [CrossRef]
  4. Pascarella, E.T.; Pierson, C.T.; Wolniak, G.C.; Terenzini, P.T. First-Generation College Students: Additional Evidence on College Experiences and Outcomes. J. High. Educ. 2004, 75, 249–284. [Google Scholar] [CrossRef]
  5. Moreira, R.G.; Butler-Purry, K.; Carter-Sowell, A.; Walton, S.; Juranek, I.V.; Challoo, L.; Regisford, G.; Coffin, R.; Spaulding, A. Innovative Professional Development and Community Building Activity Program Improves STEM URM Graduate Student Experiences. Int. J. STEM Educ. 2019, 6, 34. [Google Scholar] [CrossRef] [Green Version]
  6. Park, J.J.; Kim, Y.K.; Salazar, C.; Hayes, S. Student–Faculty Interaction and Discrimination from Faculty in STEM: The Link with Retention. Res. High. Educ. 2020, 61, 330–356. [Google Scholar] [CrossRef]
  7. Survey of Earned Doctorates; National Science Foundation, National Center for Science and Engineering Statistics: Alexandria, VA, USA, 2020.
  8. Educational Attainment; U.S. Census Bureau: Suitland, MD, USA, 2020.
  9. Katrevich, A.V.; Aruguete, M.S. Recognizing Challenges and Predicting Success in First-Generation University Students. J. STEM Educ. Innov. Res. 2017, 18, 40–44. [Google Scholar]
  10. Pratt, I.S.; Harwood, H.B.; Cavazos, J.T.; Ditzfeld, C.P. Should I Stay or Should I Go? Retention in First-Generation College Students. J. Coll. Stud. Retent. Res. Theory Pract. 2019, 21, 105–118. [Google Scholar] [CrossRef]
  11. Stephens, N.M.; Fryberg, S.A.; Markus, H.R.; Johnson, C.S.; Covarrubias, R. Unseen Disadvantage: How American Universities’ Focus on Independence Undermines the Academic Performance of First-Generation College Students. J. Pers. Soc. Psychol. 2012, 102, 1178. [Google Scholar] [CrossRef] [Green Version]
  12. Gardner, S.K. The Challenges of First-Generation Doctoral Students. New Dir. High. Educ. 2013, 2013, 43–54. [Google Scholar] [CrossRef]
  13. Stephens, N.M.; Townsend, S.S.; Hamedani, M.G.; Destin, M.; Manzo, V. A Difference-Education Intervention Equips First-Generation College Students to Thrive in the Face of Stressful College Situations. Psychol. Sci. 2015, 26, 1556–1566. [Google Scholar] [CrossRef] [Green Version]
  14. Maher, B.M.; Hynes, H.; Sweeney, C.; Khashan, A.S.; O’Rourke, M.; Doran, K.; Harris, A.; Flynn, S.O. Medical School Attrition-beyond the Statistics a Ten Year Retrospective Study. BMC Med. Educ. 2013, 13, 13. [Google Scholar] [CrossRef]
  15. Sowell, R.; Zhang, T.; Bell; Redd, K. Ph.D. Completion and Attrition: Analysis of Baseline Program Data from the Ph. D. Completion Project; Council of Graduate Schools: Washington, DC, USA, 2008; ISBN 1-933042-18-4.
  16. Terrell, S.R.; Snyder, M.M.; Dringus, L.P.; Maddrey, E. A Grounded Theory of Connectivity and Persistence in a Limited Residency Doctoral Program. Qual. Rep. 2012, 17, 62. [Google Scholar] [CrossRef]
  17. Willis, B.; Carmichael, K.D. The Lived Experience of Late-Stage Doctoral Student Attrition in Counselor Education. Qual. Rep. 2011, 16, 192–207. [Google Scholar] [CrossRef]
  18. Gardner, S.K.; Holley, K.A. “Those Invisible Barriers Are Real”: The Progression of First-Generation Students through Doctoral Education. Equity Excell. Educ. 2011, 44, 77–92. [Google Scholar] [CrossRef]
  19. Kusserow, A. When Hard and Soft Clash: Class-Based Individualisms in Manhattan and Queens. In Facing Social Class: How Societal Rank Influences Interaction; Russell Sage Foundation: New York, NY, USA, 2012; pp. 195–215. ISBN 10-9780871544797. [Google Scholar]
  20. Lareau, A.; Weininger, E.B. Cultural Capital in Educational Research: A Critical Assessment. Theory Soc. 2003, 32, 567–606. [Google Scholar] [CrossRef]
  21. Miele, J.; Nguyen, V.H. On Par with the Rest: First-Generation College Students and Cultural Intelligence. J. Furth. High. Educ. 2020, 44, 809–817. [Google Scholar] [CrossRef]
  22. O’Shea, S. “Kids from Here Don’t Go to Uni”: Considering First in Family Students’ Belonging and Entitlement within the Field of Higher Education in Australia. Eur. J. Educ. 2021, 56, 65–77. [Google Scholar] [CrossRef]
  23. Thayer, P.B. Retention of Students from First Generation and Low Income Backgrounds; Council for Opportunity in Education, 1025 Vermont Ave: Washington, DC, USA, 2000.
  24. Alfred, M.V.; Ray, S.M.; Johnson, M.A. Advancing Women of Color in STEM: An Imperative for US Global Competitiveness. Adv. Dev. Hum. Resour. 2019, 21, 114–132. [Google Scholar] [CrossRef]
  25. Byars-Winston, A.; Dahlberg, M.L. The Science of Effective Mentorship in STEMM. Consensus Study Report; National Academies Press: Washington, DC, USA, 2019; ISBN 978-0-309-49729-9. [Google Scholar]
  26. Rolón-Dow, R.; Davison, A. Racial Microaffirmations: Learning from Student Stories of Moments That Matter. Divers. Discourse Newark 2018, 1, 1–9. [Google Scholar]
  27. Rolón-Dow, R.; Davison, A. Theorizing Racial Microaffirmations: A Critical Race/Latcrit Approach. Race Ethn. Educ. 2021, 24, 245–261. [Google Scholar] [CrossRef]
  28. Stachl, C.N.; Baranger, A.M. Sense of Belonging within the Graduate Community of a Research-Focused STEM Department: Quantitative Assessment Using a Visual Narrative and Item Response Theory. PLoS ONE 2020, 15, e0233431. [Google Scholar] [CrossRef]
  29. Tao, K.W.; Gloria, A.M. Should I Stay or Should I Go? The Role of Impostorism in STEM Persistence. Psychol. Women Q. 2019, 43, 151–164. [Google Scholar] [CrossRef]
  30. Hoskins, C.M.; Goldberg, A.D. Doctoral Student Persistence in Counselor Education Programs: Student–Program Match. Couns. Educ. Superv. 2005, 44, 175–188. [Google Scholar] [CrossRef]
  31. Mireles-Rios, R.; Garcia, N.M. What Would Your Ideal Graduate Mentoring Program Look Like?: Latina/o Student Success in Higher Education. J. Lat. Educ. 2019, 18, 376–386. [Google Scholar] [CrossRef]
  32. Mullen, C.A. The Need for a Curricular Writing Model for Graduate Students. J. Furth. High. Educ. 2001, 25, 117–126. [Google Scholar] [CrossRef]
  33. Strayhorn, T.L. The Role of Supportive Relationships in Facilitating African American Males’ Success in College. Naspa J. 2008, 45, 26–48. [Google Scholar] [CrossRef]
  34. Doctorate Recipients from U.S. Universities: 2020; National Science Foundation, National Center for Science and Engineering Statistics: Alexandria, VA, USA, 2021.
  35. Dika, S.L.; D’Amico, M.M. Early Experiences and Integration in the Persistence of First-Generation College Students in STEM and Non-STEM Majors. J. Res. Sci. Teach. 2016, 53, 368–383. [Google Scholar] [CrossRef]
  36. QuickFacts: United States 2019; U.S. Census Bureau: Suitland, MD, USA, 2019.
  37. Fisher, A.J.; Mendoza-Denton, R.; Patt, C.; Young, I.; Eppig, A.; Garrell, R.L.; Rees, D.C.; Nelson, T.W.; Richards, M.A. Structure and Belonging: Pathways to Success for Underrepresented Minority and Women PhD Students in STEM Fields. PLoS ONE 2019, 14, e0209279. [Google Scholar] [CrossRef]
  38. Mousavi, M.P.S.; Sohrabpour, Z.; Anderson, E.L.; Stemig-Vindedahl, A.; Golden, D.; Christenson, G.; Lust, K.; Bühlmann, P. Stress and Mental Health in Graduate School: How Student Empowerment Creates Lasting Change. J. Chem. Educ. 2018, 95, 1939–1946. [Google Scholar] [CrossRef]
  39. Curtin, N.; Stewart, A.J.; Ostrove, J.M. Fostering Academic Self-Concept: Advisor Support and Sense of Belonging among International and Domestic Graduate Students. Am. Educ. Res. J. 2013, 50, 108–137. [Google Scholar] [CrossRef]
  40. Griffin, K.; Baker, V.; O’Meara, K.; Nyunt, G.; Robinson, T.; Staples, C.L. Supporting Scientists from Underrepresented Minority Backgrounds: Mapping Developmental Networks. Stud. Grad. Postdr. Educ. 2018, 9, 19–37. [Google Scholar] [CrossRef] [Green Version]
  41. Tinto, V. Dropout from Higher Education: A Theoretical Synthesis of Recent Research. Rev. Educ. Res. 1975, 45, 89–125. [Google Scholar] [CrossRef]
  42. Kendricks, K.; Nedunuri, K.V.; Arment, A.R. Minority Student Perceptions of the Impact of Mentoring to Enhance Academic Performance in STEM Disciplines. J. STEM Educ. Innov. Res. 2013, 14, 38–46. [Google Scholar]
  43. Pierce, C. Psychiatric Problems of the Black Minority. In American Handbook of Psychiatry; Basic Books, Inc.: New York, NY, USA, 1974; Volume 2. [Google Scholar]
  44. Sue, D.W.; Capodilupo, C.M.; Torino, G.C.; Bucceri, J.M.; Holder, A.; Nadal, K.L.; Esquilin, M. Racial Microaggressions in Everyday Life: Implications for Clinical Practice. Am. Psychol. 2007, 62, 271. [Google Scholar] [CrossRef]
  45. Stockard, J.; Rohlfing, C.M.; Richmond, G.L. Equity for Women and Underrepresented Minorities in STEM: Graduate Experiences and Career Plans in Chemistry. Proc. Natl. Acad. Sci. USA 2021, 118, e2020508118. [Google Scholar] [CrossRef]
  46. Wilson, Z.S.; Holmes, L.; Degravelles, K.; Sylvain, M.R.; Batiste, L.; Johnson, M.; McGuire, S.Y.; Pang, S.S.; Warner, I.M. Hierarchical Mentoring: A Transformative Strategy for Improving Diversity and Retention in Undergraduate STEM Disciplines. J. Sci. Educ. Technol. 2012, 21, 148–156. [Google Scholar] [CrossRef]
  47. Cole, D.; Griffin, K.A. Advancing the Study of Student-Faculty Interaction: A Focus on Diverse Students and Faculty. In Higher Education: Handbook of Theory and Research; Springer: Dordrecht, The Netherlands, 2013; Volume 28, pp. 561–611. ISBN 978-94-007-5835-3. [Google Scholar]
  48. Lovitts, B.E. Leaving the Ivory Tower: The Causes and Consequences of Departure from Doctoral Study; Rowman & Littlefield Publishers: New York, NY, USA, 2002; ISBN 978-0-7425-0941-2. [Google Scholar]
  49. Miyazaki, Y.; Janosik, S.M. Predictors That Distinguish First-Generation College Students from Non-First Generation College Students. J. Multicult. Gend. Minor. Stud. 2009, 3, 673–685. [Google Scholar]
  50. Gray, P.; Drew, D.E. What They Didn’t Teach You in Graduate School: 299 Helpful Hints for Success in Your Academic Career; Stylus Publishing, LLC: Sterling, VA, USA, 2012; ISBN 10-1579226442. [Google Scholar]
  51. Girves, J.E.; Wemmerus, V. Developing Models of Graduate Student Degree Progress. J. High. Educ. 1988, 59, 163–189. [Google Scholar] [CrossRef]
  52. Ethington, C.A.; Pisani, A. The RA and TA Experience: Impediments and Benefits to Graduate Study. Res. High. Educ. 1993, 34, 343–354. [Google Scholar] [CrossRef]
  53. Rodriguez, J.E. Faculty Mentoring of Minority Graduate and Professional Students: The Irvine Experiment; Division of Graduate Studies and Research, University of California: Irvine, CA, USA, 1984. [Google Scholar]
  54. Lovitts, B.E.; Nelson, C. The Hidden Crisis in Graduate Education: Attrition from Ph. D. Programs. Academe 2000, 86, 44. [Google Scholar] [CrossRef]
  55. Bain, S.; Fedynich, L.; Knight, M. The Successful Graduate Student: A Review of the Factors for Success. J. Acad. Bus. Ethics 2011, 3, 1. [Google Scholar]
  56. Maslow, A.H. A Theory of Human Motivation. Psychol. Rev. 1943, 50, 370. [Google Scholar] [CrossRef] [Green Version]
  57. Maslow, A.H. Motivation and Personality; Harper Row: New York, NY, USA, 1954. [Google Scholar]
  58. McLeod, S. Maslow’s Hierarchy of Needs. Simply Psychol. 2007, 1, 1–18. Available online: https://www.simplypsychology.org/maslow.html (accessed on 1 June 2023).
  59. Maslow, A.H. Motivation and Personality, 3rd ed.; Harper and Row: New York, NY, USA, 1987. [Google Scholar]
  60. Maslow, A.H. Toward a Psychology of Being; Sublime Books: Floyd, VA, USA, 2014; ISBN 978-1-62755-622-4. [Google Scholar]
  61. Spady, W.G. Dropouts from Higher Education: Toward an Empirical Model. Interchange 1971, 2, 38–62. [Google Scholar] [CrossRef]
  62. Malaney, G.D. An Analysis of Financial Aid in the Recruitment of Graduate Students at the Ohio State University. J. Stud. Financ. Aid 1984, 14, 11–19. [Google Scholar] [CrossRef]
  63. O’Meara, K.; Griffin, K.A.; Kuvaeva, A.; Nyunt, G.; Robinson, T.N. Sense of Belonging and Its Contributing Factors in Graduate Education. Int. J. Dr. Stud. 2017, 12, 251–279. [Google Scholar] [CrossRef] [Green Version]
  64. Barnes, B.J.; Randall, J. Doctoral Student Satisfaction: An Examination of Disciplinary, Enrollment, and Institutional Differences. Res. High. Educ. 2012, 53, 47–75. [Google Scholar] [CrossRef]
  65. Clance, P.R. The Impostor Phenomenon: When Success Makes You Feel Like a Fake; Bantam Books: Toronto, ON, USA, 1986; ISBN 10-0553257307. [Google Scholar]
  66. Torres-Harding, S.R.; Andrade, A.L., Jr.; Romero Diaz, C.E. The Racial Microaggressions Scale (RMAS): A New Scale to Measure Experiences of Racial Microaggressions in People of Color. Cultur. Divers. Ethnic Minor. Psychol. 2012, 18, 153. [Google Scholar] [CrossRef] [Green Version]
  67. Nadal, K.L. The Racial and Ethnic Microaggressions Scale (REMS): Construction, Reliability, and Validity. J. Couns. Psychol. 2011, 58, 470–480. [Google Scholar] [CrossRef]
  68. Estrada, M.; Young, G.R.; Nagy, J.; Goldstein, E.J.; Ben-Zeev, A.; Márquez-Magaña, L.; Eroy-Reveles, A. The Influence of Microaffirmations on Undergraduate Persistence in Science Career Pathways. CBE—Life Sci. Educ. 2019, 18, ar40. [Google Scholar] [CrossRef]
  69. Sowell, R.; Allum, J.; Okahana, H. Doctoral Initiative on Minority Attrition and Completion; Council of Graduate Schools: Washington, DC, USA, 2015. [Google Scholar]
  70. Lorenzo-Seva, U. SOLOMON: A Method for Splitting a Sample into Equivalent Subsamples in Factor Analysis. Behav. Res. Methods 2022, 54, 2665–2677. [Google Scholar] [CrossRef]
  71. Fabrigar, L.R.; Wegener, D.T.; MacCallum, R.C.; Strahan, E.J. Evaluating the Use of Exploratory Factor Analysis in Psychological Research. Psychol. Methods 1999, 4, 272. [Google Scholar] [CrossRef]
  72. Costello, A.B.; Osborne, J. Best Practices in Exploratory Factor Analysis: Four Recommendations for Getting the Most from Your Analysis. Pract. Assess. Res. Eval. 2005, 10, 7. [Google Scholar] [CrossRef]
  73. Yong, A.G.; Pearce, S. A Beginner’s Guide to Factor Analysis: Focusing on Exploratory Factor Analysis. Tutor. Quant. Methods Psychol. 2013, 9, 79–94. [Google Scholar] [CrossRef] [Green Version]
  74. Ford, J.K.; MacCallum, R.C.; Tait, M. The Application of Exploratory Factor Analysis in Applied Psychology: A Critical Review and Analysis. Pers. Psychol. 1986, 39, 291–314. [Google Scholar] [CrossRef]
  75. DeVellis, R.F.; Thorpe, C.T. Scale Development: Theory and Applications, 5th ed.; Sage Publications: Washington, DC, USA, 2021; ISBN 10-154437934X. [Google Scholar]
  76. Child, D. The Essentials of Factor Analysis: Cassell Educational, 2nd ed.; Cassell Educational: New York, NY, USA, 1990; ISBN 0-304-32331-4. [Google Scholar]
  77. Suhr, D.D. Exploratory or Confirmatory Factor Analysis? University of Northern Colorado: Greeley, CO, USA, 2006. [Google Scholar]
  78. Kim, H.; Ku, B.; Kim, J.Y.; Park, Y.-J.; Park, Y.-B. Confirmatory and Exploratory Factor Analysis for Validating the Phlegm Pattern Questionnaire for Healthy Subjects. Evid. Based Complement. Alternat. Med. 2016, 2016, 2696019. [Google Scholar] [CrossRef] [Green Version]
  79. Brown, T.A. Confirmatory Factor Analysis for Applied Research, 2nd ed.; Guilford Publications: New York, NY, USA, 2015; ISBN 10-1462515363. [Google Scholar]
  80. McAlexander, S.L.; McCance, K.; Blanchard, M.R.; Venditti, R.A. Investigating the Experiences, Beliefs, and Career Intentions of Historically Underrepresented Science and Engineering Undergraduates Engaged in an Academic and Internship Program. Sustainability 2022, 14, 1486. [Google Scholar] [CrossRef]
  81. Hu, L.; Bentler, P.M. Cutoff Criteria for Fit Indexes in Covariance Structure Analysis: Conventional Criteria versus New Alternatives. Struct. Equ. Model. Multidiscip. J. 1999, 6, 1–55. [Google Scholar] [CrossRef]
  82. Havlik, S.; Pulliam, N.; Malott, K.; Steen, S. Strengths and Struggles: First-Generation College-Goers Persisting at One Predominantly White Institution. J. Coll. Stud. Retent. Res. Theory Pract. 2020, 22, 118–140. [Google Scholar] [CrossRef]
  83. Ren, J.; Hagedorn, L.S. International Graduate Students’ Academic Performance: What Are the Influencing Factors? J. Int. Stud. 2012, 2, 135–143. [Google Scholar] [CrossRef]
  84. Hughes, G.D. The Impact of Incorrect Responses to Reverse-Coded Survey Items. Res. Sch. 2009, 16, 76–88. [Google Scholar]
  85. Bettencourt, G.M.; Mansour, K.E.; Hedayet, M.; Feraud-King, P.T.; Stephens, K.J.; Tejada, M.M.; Kimball, E. Is First-Gen an Identity? How First-Generation College Students Make Meaning of Institutional and Familial Constructions of Self. J. Coll. Stud. Retent. Res. Theory Pract. 2022, 24, 271–289. [Google Scholar] [CrossRef]
  86. Walton, G.M.; Logel, C.; Peach, J.M.; Spencer, S.J.; Zanna, M.P. Two Brief Interventions to Mitigate a “Chilly Climate” Transform Women’s Experience, Relationships, and Achievement in Engineering. J. Educ. Psychol. 2015, 107, 468. [Google Scholar] [CrossRef] [Green Version]
  87. Gayles, J.G.; Ampaw, F. The Impact of College Experiences on Degree Completion in STEM Fields at Four-Year Institutions: Does Gender Matter? J. High. Educ. 2014, 85, 439–468. [Google Scholar] [CrossRef]
  88. Nguyen, H.M. Faculty Advisors’ Experiences with International Graduate Students. J. Int. Stud. 2013, 3, 102–116. [Google Scholar] [CrossRef]
  89. Ward, L.; Siegel, M.J.; Davenport, Z. First-Generation College Students: Understanding and Improving the Experience from Recruitment to Commencement; John Wiley & Sons: Hoboken, NJ, USA, 2012. [Google Scholar]
  90. Stebleton, M.J.; Soria, K.M.; Huesman, R.L., Jr. First-Generation Students’ Sense of Belonging, Mental Health, and Use of Counseling Services at Public Research Universities. J. Coll. Couns. 2014, 17, 6–20. [Google Scholar] [CrossRef]
  91. Johnson, M.D.; Sprowles, A.E.; Goldenberg, K.R.; Margell, S.T.; Castellino, L. Effect of a Place-Based Learning Community on Belonging, Persistence, and Equity Gaps for First-Year STEM Students. Innov. High. Educ. 2020, 45, 509–531. [Google Scholar] [CrossRef]
  92. Vasil, M.; McCall, J.M. The Perspectives of Two First-Generation College Students Pursuing Doctoral Degrees in Music Education. J. Music Teach. Educ. 2018, 27, 67–81. [Google Scholar] [CrossRef]
  93. Sullivan, T.; Repak, N. Financial Pressure for Graduate Students; Grad Resources: Richardson, TX, USA, 2018. [Google Scholar]
  94. Reber, S.; Smith, E. College Enrollment Gaps: How Academic Preparation Influences Opportunity; Brookings Institution: Washington, DC, USA, 2023. [Google Scholar]
  95. Want to Close Gaps in College Enrollment? Improve Academic Preparation, a New Study Says. Available online: https://www.chronicle.com/article/want-to-close-racial-gaps-in-college-enrollment-improve-academic-preparation-a-new-study-says (accessed on 1 June 2023).
Figure 1. Maslow’s Hierarchy of Needs with graduate student success factors (adapted from [58]).
Higheredu 02 00023 g001
Figure 2. Seven-factor pathway diagram.
Higheredu 02 00023 g002
Figure 3. Inhibiting and supporting factors for graduate student success by subgroup. Items with (−) denote an inhibiting relationship, and items with (+) represent a supportive relationship.
Higheredu 02 00023 g003
Table 1. Item distribution by factor with Cronbach’s alpha.
FactorOriginal ScalesCronbach’s Alpha Items
Faculty/Program Support and RespectMicroaffirmations (4), Sense of Belonging (5), Mentor Relationships (4), Thesis/Dissertation (1)0.92214
Financial Financial (6)0.8176
Access and OpportunitiesProfessional Development (4), Financial (1)0.7215
Imposter Syndrome Imposter Syndrome (3)0.8493
MicroaggressionsMicroaggressions—Race (1) and Gender (3)0.6934
Table 2. Confirmatory factor analysis mechanism.
StepSampleModelΧ2CFI RMSEA SRMR
1CFA5-factor, 32 items1064.84, p < 0.0000.8210.071 *
2CFA7-factor, 32 items896.759, p < 0.0000.8670.062 *
3CFA7-factor, 28 items620.919, p < 0.0000.907 *0.057 *0.0583 *
4EFA7-factor, 28 items620.081, p < 0.0000.911 *0.058 *
Note: * indicates an acceptable value for the fit indices, — indicates no value was provided.
Table 3. Factor loading matrix.
Micro-
affirmations
Q24: My work is valued in my program.0.88
Q23: People in my program value my ideas.0.87
Q22: I am treated with respect in my program.0.76
Q25: I am encouraged to complete my degree.0.72
Sense of
Belonging
Q33: I feel a sense of belonging in my program.0.83
Q35: I have received academic support from faculty members in my program.0.71
Q36R: I feel isolated in my program [63].0.68
Q34: I have received academic support from graduate students in my program.0.60
Q32: I feel my advisor cares about my well-being.0.59
Mentor
Relationships
Q48: I receive helpful feedback on my research from the faculty in my program.0.80
Q46: I have relationships with the faculty in my program that support my academic progress.0.71
Q47: My own goals and research interests are incorporated into my master’s/doctoral research.0.68
Financial
Support
Q41: Insufficient financial support from the Graduate Student Support Plan (GSSP) has slowed my progress toward a degree.0.75
Q40R: I worry about having financial support during the summer months.0.69
Q39: I receive enough financial support from the Graduate Student Support Plan (GSSP) to maintain an acceptable standard of living.0.69
Q42R: I am concerned about the amount of debt I have taken on for graduate studies.0.60
Q44R: I am concerned about affording the technology I need to support my graduate work.0.59
Q43R: I am unsure of whether I will have financial support next year.0.54
Access and Opportunity Q56: I have opportunities to write academic papers for publication.0.75
Q52: I have opportunities to participate in conferences.0.67
Q54: I have opportunities to help write grant proposals.0.66
Q53: I have opportunities to engage in extension activities beyond my program.0.55
Q38: I have had opportunities to receive assistantships for research.0.44
Imposter
Syndrome
Q30R: I often compare myself to those around me and think they may be more intelligent than I am.0.80
Q28R: I’m afraid people may find out that I’m not as capable as they think I am.0.77
Q29R: I’m often afraid that I may fail at a new assignment or undertaking even though I generally do well at what I attempt [65].0.76
Micro-aggressions Q19R: My opinions are overlooked in group discussions because of my gender.0.97
Q18R: Other people make assumptions about my abilities because of my gender.0.65
Note: Items in italics represent reverse-coded items.
Table 4. Mean scores for significant items by racial/ethnic subgroups.
African American/
Black
(n = 30)
Asian
(n = 76)
Hispanic/
Latino
(n = 28)
Middle-
Eastern
(n = 53)
Multiracial
(n = 16)
White/
Caucasian
(n = 310)
M (SD)M (SD)M (SD)M (SD)M (SD)M (SD)
Sense of
Belonging
Q333.82 (0.81)3.07 (1.30)3.19 (1.21)3.45 (1.09)
Q36R3.53 (1.15)3.00 (1.12)3.08 (1.30)2.75 (0.93)3.05 (1.14)
MentorQ483.97 (0.89)3.43 (0.96)3.62 (1.02)3.67 (0.96)
Financial
Support
Q43R2.67 (1.45)3.13 (1.24)2.39 (1.37)3.45 (1.23)3.32 (1.29)
Microaggressions—GenderQ18R3.00 (1.02)3.41 (1.19)2.86 (1.24)2.58 (1.22)2.06 (1.06)2.57 (1.05)
Q19R3.10 (1.13)3.86 (1.02)3.11 (1.13)3.47 (1.22)2.69 (1.08)3.28 (1.19)
Note: — denotes the relationship was not significant with other subgroups. Items in italics represent reverse-coded items for which lower scores represent strongly agree or the greater presence of an inhibiting factor. Bolded items represent groups reporting a greater perception of an inhibiting factor.
Table 5. Mean scores for significant items by gender and student subgroups.
Female
(n = 309)
Male
(n = 221)
U.S.
Citizens
(n = 419)
Inter-
National
(n = 117)
Full-Time
(n = 497)
Part-Time
(n = 36)
M (SD)M (SD)M (SD)M (SD)M (SD)M (SD)
MicroaffirmationsQ243.81 (0.82)4.00 (0.83)
Q233.84 (0.80)4.05 (0.74)
Q223.98 (0.88)4.26 (0.80)
Q254.14 (0.87)4.33 (0.82)
Sense of
Belonging
Q343.92 (0.94)3.73 (0.96)
Q353.87 (0.97)4.03 (0.95)
Q36R3.05 (1.18)3.32 (1.14)3.14 (1.16)2.61 (1.34)
Financial
Support
Q40R2.59 (1.33)2.87 (1.40)2.75 (1.40)2.44 (1.24)2.65 (1.36)3.28 (1.39)
Q43R3.30 (1.29)2.77 (1.33)
Q44R3.19 (1.25)3.67 (1.10)
Access and
Opportunity
Q383.80 (1.17)2.92 (1.34)
Q563.92 (0.97)4.12 (096)3.97 (0.99)4.17 (0.88)4.06 (0.93)3.44 (1.30)
Imposter
Syndrome
Q30R2.07 (1.08)2.48 (1.20)2.16 (1.14)2.48 (1.15)2.20 (1.12)2.72 (1.39)
Q28R2.37 (1.22)2.77 (1.31)2.41 (1.25)2.94 (1.29)2.48 (1.24)3.06 (1.55)
Q29R2.20 (1.11)2.57 (1.19)2.26 (1.14)2.63 (1.17)2.29 (1.11)3.00 (1.41)
Microaggressions—Gender Q19R2.81 (1.04)4.14 (0.89)3.24 (1.18)3.77 (1.04)3.39 (1.16)2.89 (1.28)
Q18R2.33 (0.93)3.30 (1.20)2.59 (1.08)3.28 (1.24)
Note: — denotes the relationship was not significant with other subgroups. Items in italics represent reverse-coded items for which lower scores represent strongly agree or the greater presence of an inhibiting factor. Bolded items represent groups reporting a greater perception of an inhibiting factor.
Disclaimer/Publisher’s Note: The statements, opinions and data contained in all publications are solely those of the individual author(s) and contributor(s) and not of MDPI and/or the editor(s). MDPI and/or the editor(s) disclaim responsibility for any injury to people or property resulting from any ideas, methods, instructions or products referred to in the content.

