Article

Beef Cattle Grazing Native Grasslands May Follow Three Different Supplement Response Patterns

1
Instituto Nacional de Investigación Agropecuaria (INIA), Área Pasturas y Forrajes, Estación Experimental INIA Tacuarembó, Ruta 5 km 386, Tacuarembó 45000, Uruguay
2
Instituto Nacional de Tecnología Agropecuaria (INTA), Estación Experimental Agropecuaria Concepción del Uruguay, Concepción del Uruguay 3260, Argentina
3
Instituto Nacional de Investigación Agropecuaria (INIA), Área Forestal, Estación Experimental INIA Tacuarembó, Ruta 5 km 386, Tacuarembó 45000, Uruguay
4
Department of Health Management, Atlantic Veterinary College, University of Prince Edward Island, 550 University Avenue, Charlottetown, PE C1A 4P3, Canada
5
Instituto Nacional de Investigación Agropecuaria (INIA), Área Carne y Lana, Estación Experimental INIA Treinta y Tres, Ruta 8 km 281, Treinta y Tres 33000, Uruguay
6
Animal Science Department, Universidad de la República, Ruta 3 km 363, Paysandú 60000, Uruguay
7
Instituto Nacional de Investigación Agropecuaria (INIA), Área Pasturas y Forrajes, Estación Experimental INIA Treinta y Tres, Ruta 8 km 281, Treinta y Tres 33000, Uruguay
8
School of Agriculture and Food Sciences, The University of Queensland, Gatton, QLD 4343, Australia
9
Instituto Nacional de Investigación Agropecuaria (INIA), Área Carne y Lana, Estación Experimental INIA Tacuarembó, Ruta 5 km 386, Tacuarembó 45000, Uruguay
10
Facultad de Ciencias Agrarias, Universidad de la Empresa, Luis Alberto de Herrera 2890, Montevideo 11300, Uruguay
11
Instituto Nacional de Investigación Agropecuaria (INIA), Área Pasturas y Forrajes, Estación Experimental INIA La Estanzuela, Ruta 50 km 11, Colonia 70000, Uruguay
12
Grazing Ecology Research Group, Federal University of Rio Grande do Sul, Porto Alegre 91540-000, Brazil
*
Author to whom correspondence should be addressed.
Grasses 2023, 2(3), 168-184; https://doi.org/10.3390/grasses2030014
Submission received: 3 May 2023 / Revised: 1 July 2023 / Accepted: 13 July 2023 / Published: 7 August 2023

Abstract

:
Previous studies on winter supplementation of growing cattle grazing stockpiled native Campos grasslands suggest that forage allowance (FA), herbage mass, and weather conditions before and during the supplementation period could all affect supplement feed efficiency (SFE)—that is, the difference or change in average daily gain (ADG) between supplemented (S) and control (C) animals (ADGchng, kg) per unit (kg) of supplement dry matter (DM) intake. In this study, we analyse data from fifteen collated winter supplementation trials carried out in Uruguay between 2004 and 2018. The working hypotheses of this research paper were: (i) that average substitution rates are positive, and (ii) that ADGchng is not constant throughout the supplementation period and that its variation may be attributed to sward, animal or weather variables. There were two main objectives: (i) to estimate the average supplement substitution rate (sSbR, kg forage, f, dry matter, DM intake reduction: kg supplement DM intake) and potential herbage intake substitution rate (hSbR, kg fDM intake reduction: kg fDM intake of control animals), and its association with SFE, and, (ii) to assess the existence of different phases and supplementation response patterns and its association with other relevant variables. Estimated substitution rates were always positive (sSbR = 0.3–1.1 kg/kg; hSbR = 0.1–0.3 kg/kg) and were negatively and moderately associated with SFE. Supplementation proved to be a dynamic process where three possible supplementation responses over the supplementation period were identified (linear, quadratic and Weibull). While linear patterns did not appear distinctly associated with any particular set of variables, quadratic models were mostly associated with herbage biomass and substitution rates, whereas Weibull models were the clearest in their association with frosts. Regardless of the response pattern, at the beginning of the trials it was the animals’ body weight and supplement quality that most influenced supplement response, whereas towards the end, supplementation intake, supplemented animals’ ADG and forage quality played a more relevant role. The estimated parameters and response patterns are expected to be used as inputs in decision support systems for livestock farmers in the future.

1. Introduction

The relevance of winter supplementation on extensive/semi-extensive beef production systems on native grasslands of the Pampa Biome has been largely documented [1,2,3]. When supplements are used to avoid food scarcity, beef production levels can be sustained even in years with low forage production, but with higher production costs [4]. Therefore, for this practice to be economically feasible, supplement response and supplement feed efficiency (SFE) must be controlled to some extent [5]. This SFE is defined as the difference or change in average daily gain (ADG) between supplemented (S) and control (C) animals (ADGchng, kg) per unit (kg) of supplement dry matter (DM) intake. In the preceding paper of this same series [6], the authors found an average SFE of 0.21 ± 0.1 ADGchng/kg supplement DM intake, from growing beef cattle grazing native grasslands in winter.
These same authors observed a greater variation in ADGchng than in the supplementation rate, which means that understanding how ADGchng varies throughout the supplementation period could shed some light on the supplementation process. Additionally, these authors found that ADG decreased linearly as the proportion of green herbage decreased, and that the ADG of unsupplemented animals was further reduced when winters were harsher. These two findings—the relevance of ADGchng and the incidence of sward traits influenced by the weather on SFE—pose new research questions as to how these variables behave within the supplementation period.
Initial sward conditions in terms of quantity and/or nutritive quality of the forage may differ from final conditions, as reported by Gekara et al. [7], especially on a continuously grazed pasture and fixed stocking rate, thus affecting SFE. This would imply that SFE could vary within the same supplementation period, due to altered sward conditions. Many studies have been carried out in which, either the influence of supplementation is analysed against the grazing behaviour of cattle [8,9], the study focuses on the efficiency of N utilisation and/or physiology-related variables [10,11,12], or the authors review its influence on herbage DM intake (HDMI), digestibility or ruminal pH [13]. However, these studies tend to focus more on the average result rather than on the SFE phases. According to Wang et al. [14], the minimum evaluation duration for estimating SFE is 35 days. This constrains any supplementation field experiment in a single season aiming to determine SFE phases directly, with no more than 2–3 SFE values per plot per period. Under this situation, an indirect study, such as analysing ADGchng throughout the supplementation period, may be more suitable.
To accurately assess dietary adequacy and predict performance of grazing livestock receiving supplements, it is necessary to identify the conditions under which substitution is likely to occur and to quantify its magnitude [15]. As defined by Grainger and Mathews [16], pasture substitution rate is the reduction in pasture intake per kg concentrate eaten on a DM basis. Specifically, the calculation of the forage by supplement substitution rate (sSbR) is the difference in control (c) animals’ herbage dry matter intake (HDMI) and supplemented (s) animals’ HMDI, as a proportion of supplement DM intake (sSbR = (cHDMI − sHDMI): supplement DM intake; difference in kg forage DM/kg supplement DM). Another way to analyse the substitution effect in supplementation schemes would be to assume that the maximum HDMI would be observed in C plots, and thus, the potential HDMI substitution rate is calculated as the difference between cHDMI and sHDMI, as a proportion of the theoretical potential maximum HDMI from C plots (hSbR = (cHDMI − sHDMI): cHDMI; difference in kg forage DM/kg forage DM from control).
In a review of the use of pasture and supplements for dairy cows in temperate zones, Rogers [17] concluded that both the amount of concentrate supplement DM offered and the basal pasture intake (i.e., control animals’ pasture intake) influenced the substitution rate. Beever and Doyle [18] analysed a theoretical scenario where dairy cows grazing temperate sown pastures were supplemented, and assuming a constant substitution rate of supplement between 0 and 1.0 kg DM pasture/kg DM supplement, they suggested that total diet DM intake is expected to increase, but the increase rate would decline at higher amounts of supplementation. Da Trindade et al. [19] suggested for beef cattle grazing a specific native grassland that both its structure (in terms of herbage mass and sward height) and forage allowance (FA) affect herbage intake. Forage allowance is defined as the kg of total bodyweight (BW) of animals grazing, for every kg of forage DM on offer in the pasture. These two variables must be operating to some degree in determining SFE. In fact, Cazzuli et al. [6] found that, in these native grasslands, a balance is needed between FA and herbage mass to optimise SFE. In addition, these authors suggested the existence of some magnitude of substitution, further supported by the fact that unsupplemented animals spent more time grazing then their supplemented counterparts. Still, the amount of this assumed substitution or its association with SFE remains unclear.
The working hypotheses of this research paper were: (i) that substitution rates are positive with growing cattle grazing on stockpiled native Campos grasslands during winter, at least on average, and (ii) that ADGchng is not constant throughout the supplementation period and that its variation may be attributed to certain sward, animal or weather variables. The aim of this study was to further understand the variability in SFE, specifically: (i) to estimate the average supplement substitution rate (sSbR) and potential herbage intake substitution rate (hSbR), and their association with SFE, and (ii) to assess the existence of different phases and ADGchng patterns over the supplementation period within each supplementation trial and its eventual association with other variables, such as sward and animal characteristics or weather variables.

2. Materials and Methods

2.1. Database Compilation

Data were gathered from 15 supplementation trials carried out between 2004 and 2018 in which growing beef cattle grazing native Campos grasslands in Uruguay were supplemented during late autumn and winter. More details of the database compilation and the response and auxiliary variables of the database can be found in Cazzuli et al. [6]. In this paper, only some of the trials (15) collated by these authors were used, because not all of the original 15 trials presented data in such detail that more than two phases were identifiable (i.e., only initial and final BW were available). Their descriptive statistics are presented in Table 1.
The trials in this paper correspond to trial IDs 1–8, 14, 16, 24–25 and 27–29 (see Appendix A).
Apart from all of the estimations and variables described by Cazzuli et al. [6], additional variables were created to explore the relationship between sward-related traits and the variables of interest (SFE, ADGchng), which were: ratio of supplement crude protein (CP) content (sCP) to supplement metabolisable energy (ME) content (sME) (“sCP:sME”); ratio of sCP to forage (f) CP content (fCP) (“sCP:fCP”); and ratios “sCP:fME” and “sME:fME”.

2.2. Herbage Dry Matter Intake and Estimations of Substitution Rate

To estimate HDMI, CSIRO’s Cattle Explorer [20] spreadsheet was used, with actual data from the trials, but assuming three possible forage dry matter digestibility values (DMD): 45, 55 and 65% for a theoretical modelling exercise. Even though a few trials presented laboratory DMD values, most of them were calculated as, DMD = 88.9 − (0.779 × ADF% [21]. Therefore, to be able to model more scenarios, three DMD values were chosen as extreme values from the calculated DMD from ADF data from our database.
With the three estimations of HDMI, the ME and CP intakes were estimated in turn, using the original dataset values for forage CP and estimated ME. Finally, substitution rates were estimated using the three DMD scenarios plus a fourth which assumed that S animals harvested higher quality forage compared with C animals (sDMD = 65%; cDMD = 55%). These substitution rates were calculated both considering the amount of forage dry matter (DM) substituted by supplement DM (sSbR) and considering the potential herbal intake, which is assumed to have been consumed by C animals (hSbR).
The sSbR was calculated as follows:
sSbR, kg DM of pasture/kg DM of supplement = (cHDMI − sHDMI)/sDMI
where cHDMI = average herbage DM intake (kg DM) of control animals consuming similar forage (within the same experiment); sHDMI = herbage DM intake of supplemented animals (kg DM); sDMI = supplement DM intake (kg DM).
Finally, the potential herbage intake substitution rate (hSbR) was calculated as follows:
hSbR, kg DM of pasture/kg DM of pasture = (cHDMI − sHDMI)/cHDMI
For further statistical description of these variables, see Appendix B.
The separate average BW of C and S against time for all of the experiments was plotted, and distinct phases were observed, where slopes (i.e., ADG) behaved differently at certain breakpoints in time.

2.3. Phase Identification and the Change in ADGchng vs. Growing Degree Days

The first step in the phases’ identification process was the plotting of the average BW of C and S values separately, against time for all the experiments. Once it was clear that phases were identifiable, dates were transformed into growing degree days (GDD, base temperature = 0 °C) to standardise all trials regardless of the year of their occurrence or the differences in dates within winter. Data extracted using the nasapower R package [22]—regarding minimum (min) and maximum (max) air temperatures (T, °C) estimated 2 m above the surface—were obtained for each experiment for all dates from the beginning of the experiment to the end (i.e., the whole supplementation period, excluding the adaptation phase).
Then, the average air temperature (T avg) for each date was calculated as:
T avg = (T min/T max)/2
To translate T avg into an accumulated thermal sum, T avg was added to the initial T avg of each experiment (iT avg), so that each subsequent day was added onto the previous one, thus:
T day n = iT avg + T avg (n)
In this way, the final value of each experiment was the accumulated growing thermal time, measured in GDD. Growing degree days, or heat units, are generally used to estimate the growth and development of certain crops during the growing season. In this way, it was possible to standardise both weather and pasture growth conditions throughout all trials.
To determine what attributes were associated with ADGchng according to the main phases observed for each trial, accumulated ADGchng was calculated for the beginning of the trials (at an arbitrary thermal sum of 300 GDD) and for the last stages of the trials (at an arbitrary thermal sum of 1000 GDD), generating the new variables “ADGcnhg300” and “ADGchng1000”. These two new variables were calculated separately for each trial, according to the best fitted model explained below. Thus, accumulated ADGchng was estimated by replacing GDD by 300 and 1000 in their best fitted equation. The arbitrary values of 300 °Cd and 1000 °Cd were chosen so as to include all trials in this analysis, since with less than 300 °C, some trials were excluded, and the minimum length of the trials was 1000 °Cd.

2.4. Statistical Analysis

Statistical analyses were performed with the R software (version 4.0.3) [23] in combination with Infostat [24]. The threshold for statistical significance was p < 0.05.
Spearman correlation coefficients were estimated between SFE and HDMI and between SFE and sSbR and hSbR, considering 5% of significance level (p < 0.05).
To formally prove the existence of different phases, the “segmented” R package was used to fit a regression model with broken-line relationships for each experiment. Segmented or broken-line models are regression models where the relationships between the response and one explanatory variable are piecewise linear, i.e., two or more straight lines connected at unknown values or breakpoints.
An analysis of variance was performed for accumulated ADGchng to test the interaction between experiment and thermal sum, and because this interaction was significant (p < 0.05), regression analyses were run separately for each experiment, in which linear and non-linear models were tested: linear (y = a + bx), quadratic (y = a + bx − cx2), square root (y = a + exp(b)x), logarithmic (y = a + log(b)x), asymptotic (y = Asym + (R0 − Asym) × exp(−exp(lrc)x)) and Weibull (y = Asym – Drop × exp(−exp(lrc)xpwr)), where: y was the response variable, x was the GDD, a was the intercept, b was the linear coefficient, c was the quadratic coefficient, Asym was the horizontal asymptote, R0 was the intercept, lrc was the constant rate, Drop was the change from Asym to the y intercept, and pwr was the power to which x was raised. Models were chosen by their Akaike (AIC) criterion for each trial (the smaller AIC value corresponded to the best fitted model). When different experiments were fitted to the same model pattern (e.g., linear), the models were compared by analysis of covariance and contrasts using the “lsmeans” R package, at a 5% significance level, to verify the possibility of using a single model for the experiments.
A principal component analysis (PCA) was performed considering all explanatory variables and their association with the trials and their best fitted models. After that, 20 variables were selected by their contributions to the PCA (cos > 0.7) to generate the final analysis. The package “factoextra” from R was used.
Pearson (for variables with normal distribution) or Spearman (for non-normal distribution variables) correlation coefficients were estimated between ADGcnhg300 and ADGcnhg1000 and all of the explanatory variables (p < 0.05). After that, the top 10 variables with the greatest correlation values were included in multiple linear regression models for ADGchng300 and ADGchng1000. The models were checked for collinearity (by Variance Inflation Factor < 5) and the final models were selected by the lowest AIC value, since the parameters were significant (p < 0.05).

3. Results

Herbage DM intake estimations were between 6.9 and 4.1 kg DM/animal/day for the lowest (45%) and highest (65%) assumed DMD, respectively, corresponding to 3.2–1.7 %BW intakes, for the lowest and highest assumed DMD, respectively. Herbage DM intake was positively correlated with SFE, presenting coefficients between 0.40 and 0.50 (Table 2). Additionally, the greater the assumed DMD, the greater was the observed coefficient.
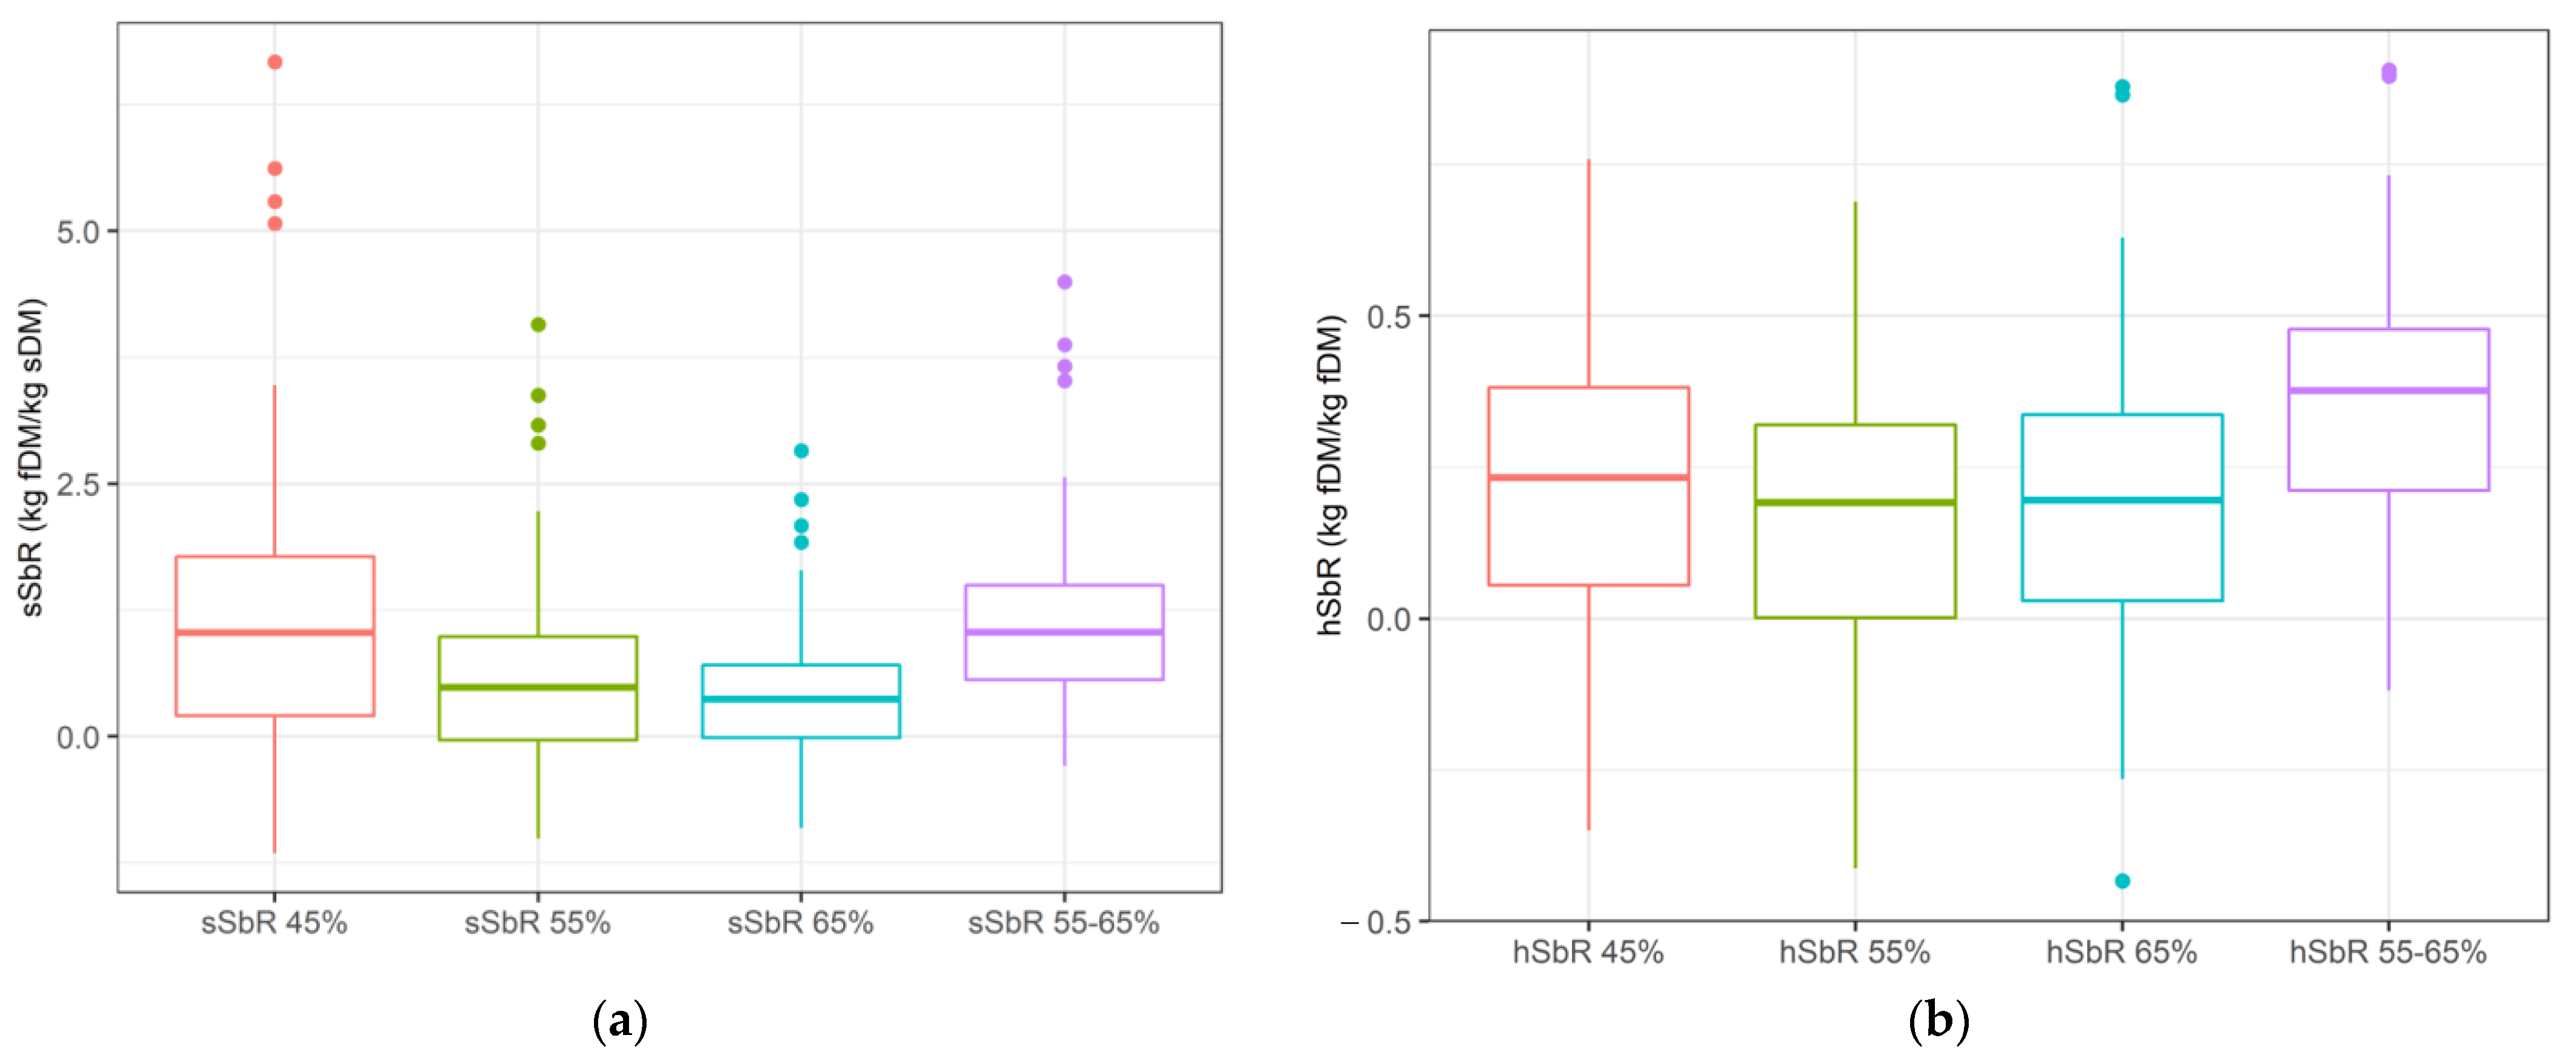
Substitution rates differed depending on their assumed DMD (Figure 1). Supplement sSbR assuming greater DMD for supplemented plots than their control counterparts (sSbR 55–65 DMD = 1.2 ± 0.8 kg/kg) presented similar average values than assuming minimum DMD (45%, sSbR = 1.2 ± 1.3 kg/kg), yet with less variability. Similarly, hSbR assuming greater DMD for supplemented plots (hSbR = 0.3 ± 0.2 kg/kg) presented the greatest value and the least variability.
All substitution rates, both as supplement (sSbR) and as potential herbage intake substitution rate (hSbR) substitutions, were strongly and negatively correlated with SFE (p < 0.01), regardless of the DMD assumed in their estimations (Table 3). Considering that sSbR and SFE are not independent variables (because supplement intake is used to calculate both), these correlations may be misleading. Nonetheless, because hSbR is a completely independent variable from SFE, these strong associations determine that the more supplemented animals decrease their HDMI, the less efficient they will be in converting the consumed supplement. This is particularly the case as the assumed forage DMD increases up to 65% for both supplemented and control plots.
Even though not all trials presented the same number of phases, almost all of them showed at least two phases where the slope of C and S BW changed over time (Figure 2). Furthermore, many showed similar BW changes between S and C plots during the first phase.
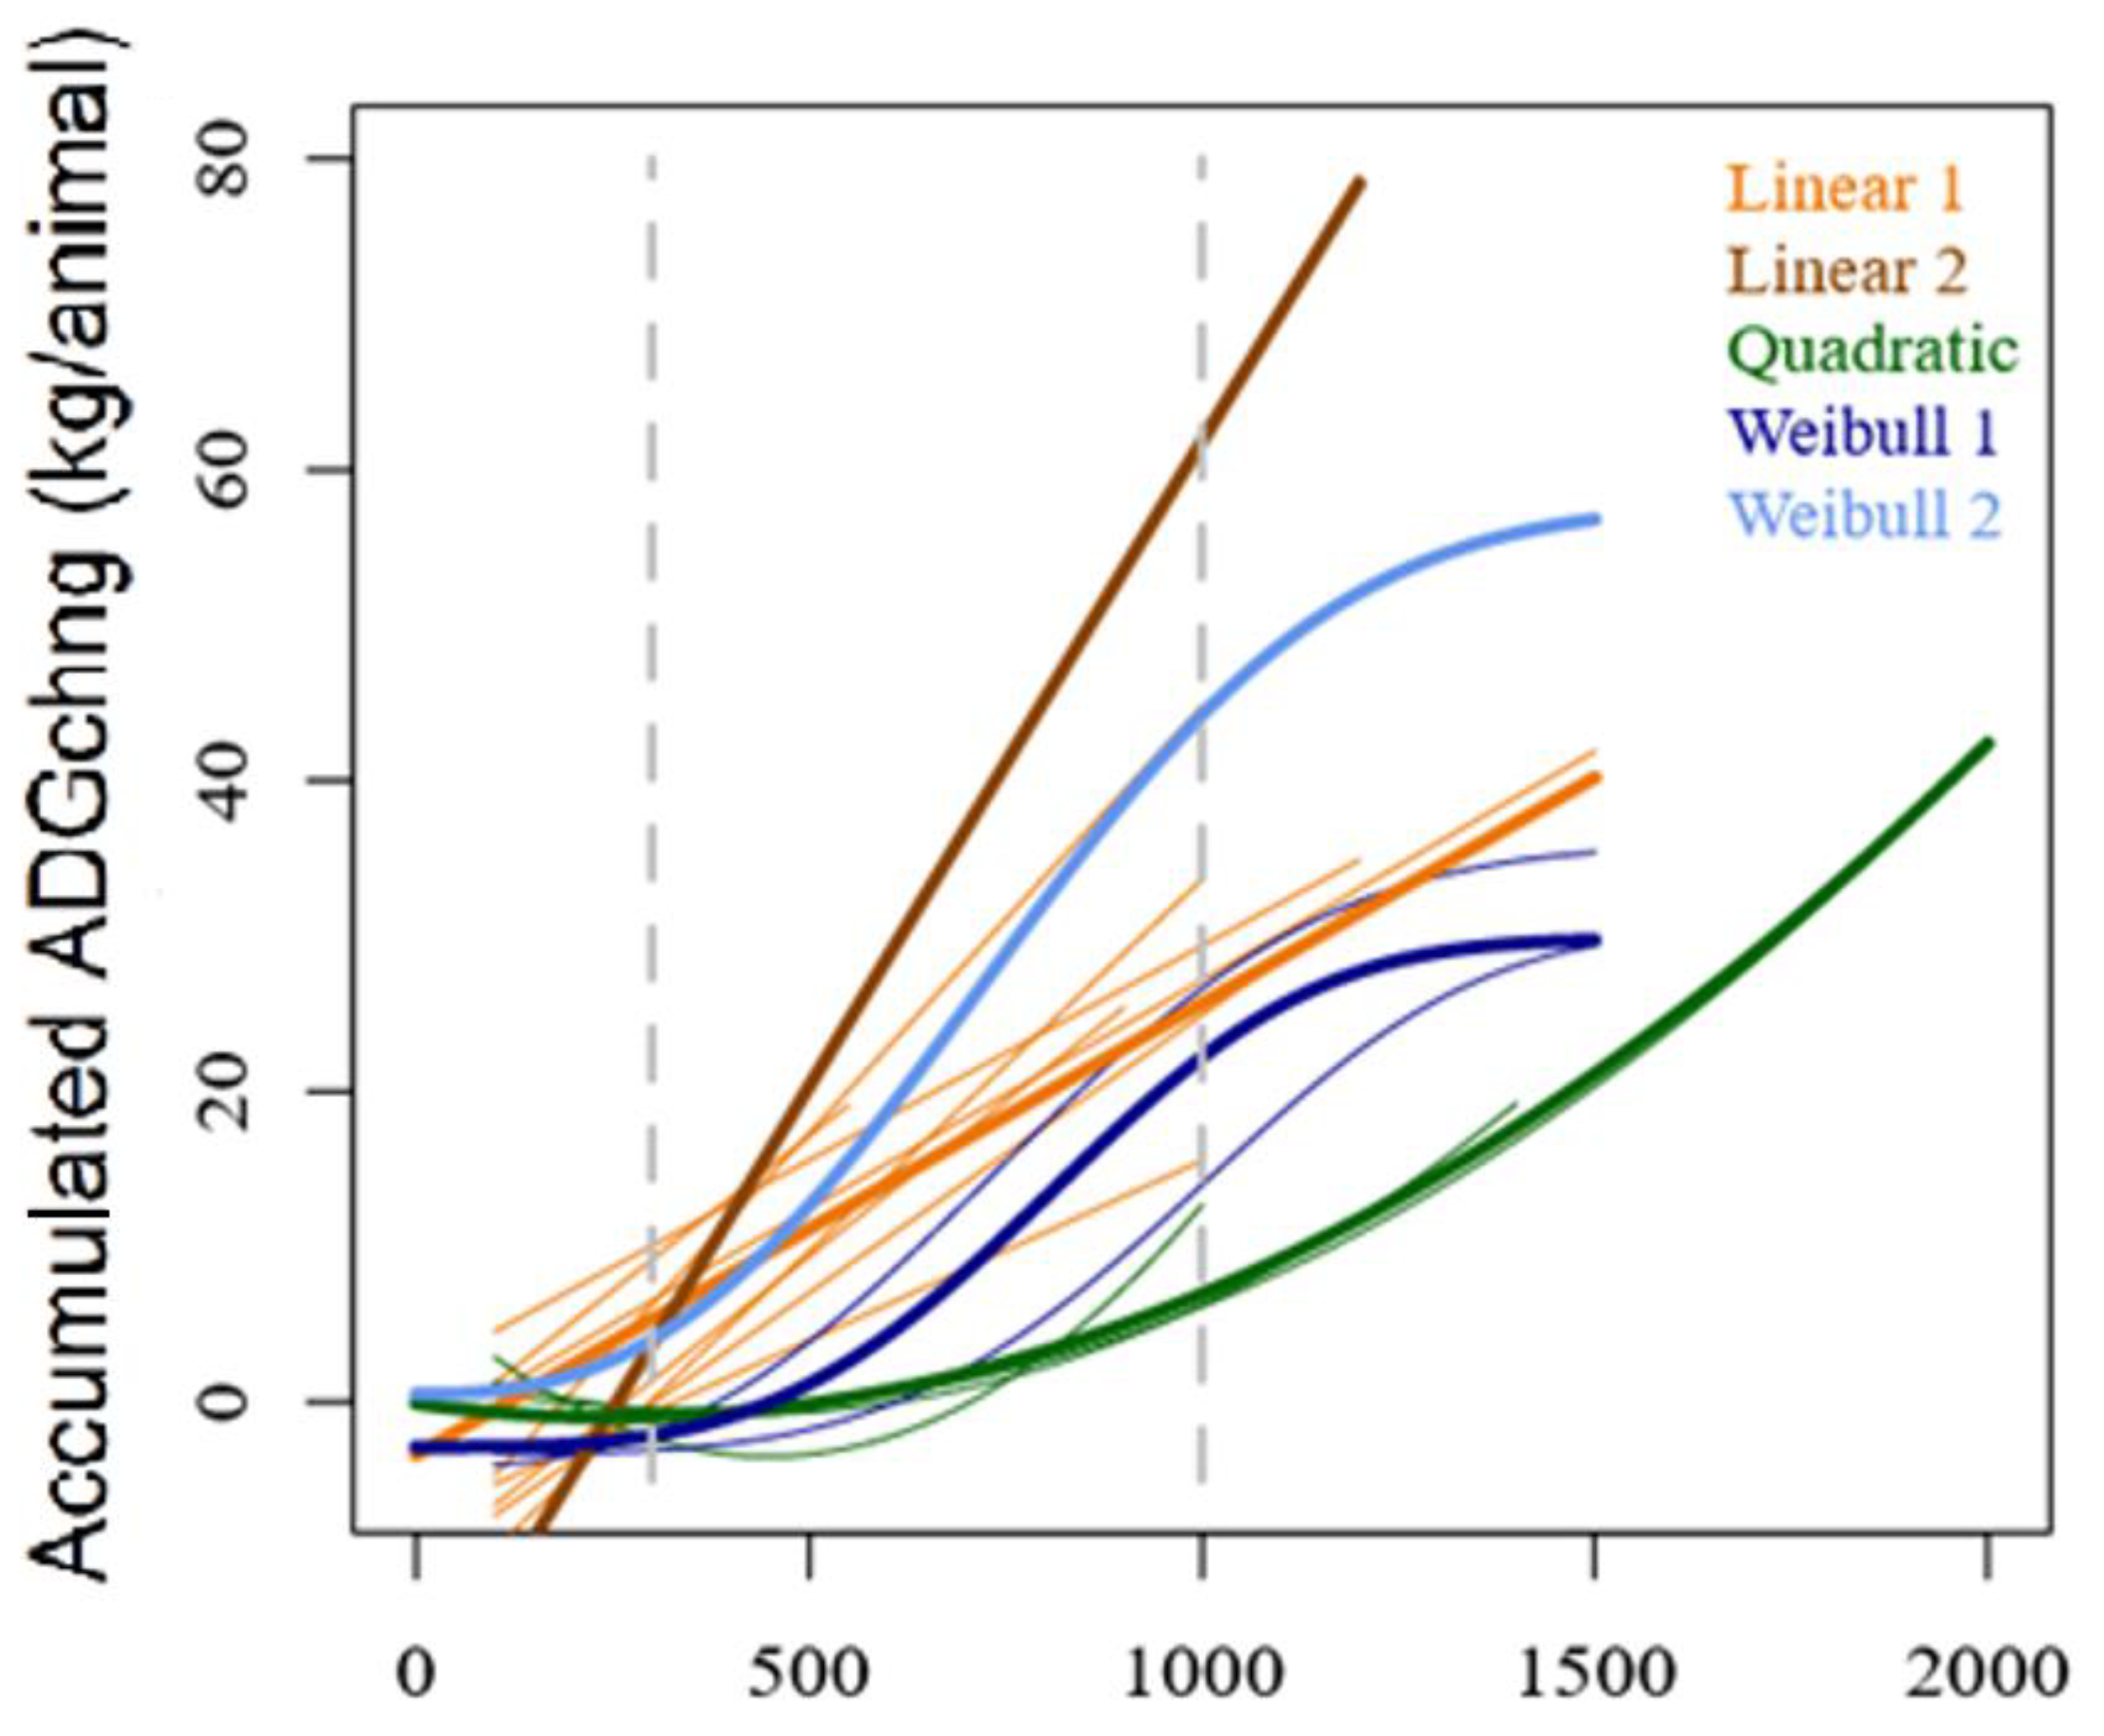
Three main supplementation responses (regression models) were identified (Figure 3). The response was either linear, quadratic or with a Weibull distribution, where ‘y’ represents the accumulated ADGchng (i.e., the total BW difference between S and C groups), and ‘x’ is GDD. In the first case (linear response), accumulated ADGchng increased at a regular rate. In the case of the quadratic and Weibull response, the response was slow at the beginning of the trials, and then it accelerated until the end of the period (quadratic) or slowed down towards the end (Weibull).
Components 1 and 2 of the PCA explained 77.9% of the total data variation. Linear models did not present a distinct association with any particular set of other relevant variables. It is important to highlight that trial 29 (Linear 2) had the highest accumulated ADGchng and was associated with sDMI, sADG, sCP, sPC:sEM, fME and fCP. On the other hand, quadratic models appeared more associated with herbage biomass and substitution rates (both sSbR and hSbR). Weibull models were more closely associated with frosts, yet very distant from all other variables (Figure 4).
Figure 5 presents the accumulated ADGchng for all trials, plotted against growing degree days and shows where 300 and 1000 GDD may be found for each of them. The animal’s body weight and the supplement CP:ME ratio positively affected the initial phases of the trials (ADGchng300). The last phases of the trials (ADGchng1000) were positively affected by supplement DM intake, supplemented animal’s ADG and forage CP:ME ratio, while being negatively affected by the CP content in the forage (Table 4).

4. Discussion

The estimated substitution rates were always positive, regardless of the assumed digestibility, which means that for supplementation schemes on native grasslands of the Pampa biome, some amount of forage will be substituted by supplement. Their values ranged between 0.3–1.1 kg/kg for supplement substitution and 0.1–0.3 kg/kg for potential herbage intake. In addition, substitution rates were negatively and moderately associated with SFE, or in other words, the more animals decreased their potential herbage intake, the less efficient they became in using the offered supplement. Considering that sSbR and SFE are not independent variables (because supplement intake is used to calculate both), these correlations may be misleading. Nonetheless, because hSbR is a completely independent variable from SFE, these strong associations determine that the more supplemented animals decrease their HDMI, the less efficient they will be in converting the consumed supplement, which is in line with Méndez et al. [25], who found that the main factor affecting pasture HDMI is sSbR, at least under no limiting grazing conditions. Using fixed stocking rates—as in all of the evaluated trials—supplementation proved to be a dynamic process, explained by the difference in the change in body weight of control and supplemented animals over time, suggesting the existence of differential response phases. This is in accordance with Palma et al. [10], who found differences in voluntary forage intake throughout the supplementation period. These responses could fit into one of three regression models: linear, quadratic or Weibull. While the linear models did not appear distinctly associated with any particular set of variables, quadratic models were mostly associated with herbage biomass and substitution rates, whereas Weibull models were the clearest in their association with frosts. Regardless of the response pattern, during the first phases of the trials, the supplementation response was positively associated with the animal’s body weight and supplement quality, whereas towards the end of the trials, the response was more associated with the supplementation intake, supplemented animals’ ADG and forage quality. This reflects the changing animal and pasture conditions—in terms of sward structure and chemical composition—as the trial progressed through the autumn/winter period.
Animal responses to concentrate feeding depend on both animal and feed factors, and among the major feed factors is the rate of substitution of concentrates for pasture [26]. While HDMI was found to be positively associated with SFE, both supplement DM and herbage estimated substitution rates proved to be negatively associated with SFE (Table 2 and Table 3), which means that supplemented animals consuming more forage and substituting less are obviously more efficient, as stated by Méndez et al. [25]. Since there is a positive relationship between substitution rate and FA [16], and the average FA of our dataset can be considered medium-low (5.5 ± 3.4 kg DM/kg BW) if we compare it with Pérez-Prieto and Delegarde [27] for ground-level clipping sown pasture estimations (6.1 ± 0.4 kg DM/kg BW), we may deduce that the observed values (Table 1) can be considered moderate-low. This moderate-low dry matter substitution rate in combination with the CP intake, both from pasture and supplement, allowed acceptable combinations of metabolisable CP and ME such that moderate ADGs were achieved with supplementation (0.52 ± 0.23 kg/animal/day). As Penno et al. [28] state, one of the key factors determining the intake response to supplementary foods is FA, in our case moderate-low. Additionally, Dixon and Stockdale [29] state that when ruminants are consuming low to medium digestibility forages, the substitution of grain for forage is generally lower than with diets based on high-quality forages (i.e., temperate sown pastures), and considering that our production systems present an intermediate forage nutritive value compared to temperate sown pastures on one hand, and on the other hand semiarid rangelands and dry-season tropical pastures [6], the sSbR of our database may be also expected to be somewhat in between these two environments, rendering SFE values in between these two situations.
The average hSbR results suggest that supplemented animals consuming more digestible pastures than their control counterparts through the exercise of their selectivity (hSbR 55–65%) eat considerably less forage than their theoretical maximum potential, compared to what happens when both control and supplemented DMD are the same (Figure 1). Given that among the multiple factors affecting substitution rate, one is the digestibility of the pasture [26], coincidently, the estimation of the actually consumed pasture in our database proved to be associated with the supplementation efficiency (Table 2) in some way through the differential digestibility between control and supplemented plots. In real production system situations, this would imply that, when animals are exposed to a highly heterogenous pasture in terms of digestibility—in such a way that supplemented animals may exert an important amount of selectivity—the first recommendation would be to reduce the forage allowance to control SFE through a lower forage on offer. Nonetheless, given that FA negatively affects SFE, while herbage mass positively affects it [6], an extra complexity emerges, in which we need to find an even finer balance between allowing animals to exert selectivity but at the same time controlling the FA, to prevent SFE from dropping.
In a fixed stocking rate supplementation scheme (heads/ha) as in our database, the sward is expected to change from initial to final conditions in terms of quantity, quality, and spatial arrangement. It was possible to observe different phases over time (Figure 2), in which all experiments presented at least one phase in which the BW change over time of C and S animals behaved oppositely, where S animals were actively gaining BW while C animals were maintaining or losing BW. In a grazing-down experiment, Cazzuli et al. [30] could not find any differences between S and C animals concerning change in green content over time of their swards nor on their plant functional types’ species preferences. This suggests that the differences in BW change between C and S animals in this work—especially of C animals’ BW change—may be only partially explained by herbage quality or species composition of the sward throughout the duration of the trials. In fact, Table 4 shows that BW explained accumulated ADGchng in the early phases of all trials, while supplementation intake and forage quality were more closely associated with the final phases of the supplementation schemes. It is possible that a lower forage quality condition (CP content at least) plays a greater role in explaining a greater supplementation response during the latest phases of the supplementation activity, compared to the beginning.
Since many variables were associated with the linear response models, it may be assumed that their response was more dependent on each trial’s characteristic, without a well-defined response pattern (Figure 4). Bonhert et al. [31], who worked with low-quality C3 and C4 species, found that the intake and digestion of these grasses differ and that the physiological response of ruminants to protein supplementation is dependent on forage type. In the case of native Campos grasslands, dominated by a highly heterogeneous mosaic of C3 and C4 species [32], multiple sward quality and structure may be expected, depending on the predominant weather trend of a particular year. Thus, at least in the case of linear models, which represented over 50% of the trials in our database and in which the supplement response was expected to increase at constant rates, a highly complex arrangement of sward, supplement quality and weather scenarios may explain greater or lower SFE values. Nevertheless, as a general principle, and as discussed above, the key issues probably will be associated with finding a certain balance between FA and forage biomass. In the case of both non-linear models (quadratic and Weibull), ADGchng might take longer to be observed at the beginning of the supplementing period (Figure 3). Quadratic response patterns were mostly associated with herbage biomass and substitution rates. If we consider the importance of sward structure affecting HDMI on Campos grasslands [19,33,34], and the fact that HDMI is positively associated with SFE (Table 2), we could state that, in these quadratic response cases, sward structure, for example, herbage biomass, plays a key role in determining high SFE, as opposed to forage quality or supplement intake. Should this be the case, this would be in agreement with Cunha et al. [35], who claim that forage nutrient content of several forage bases—from sown pastures to native grasslands—explains only a small fraction of HDMI, ADG and CH4 emissions. When analysing the Weibull response models (20% in our trials), the occurrence of frosts seems to be the most important explanatory variable for this response type. Considering that temperature usually has a considerable effect on grass digestibility, mainly through its effect on leaf-to-stem ratio [36], frosts could be indirectly affecting the Weibull-type responses through a lower overall digestibility of the pasture.
At the beginning of all of our trials (300 GDD), regardless of the response model type, the animals’ BW positively influenced ADGchng as well as the supplement’s CP:ME ratio. During a more advanced phase of the trials (1000 GDD), it was a greater supplement intake and sADG, as well as lower forage CP, yet a greater forage CP:ME ratio (Figure 5 and Table 4). In a meta-analysis performed by Detmann et al. [12], there was an average positive response of protein-based supplements on tropical pastures (fCP < 6%) with beef cattle, as the amount of offered supplement increased. Our results during an advanced phase of the trials (1000 GDD) matched the average reported by these authors, where the greater the supplement intake, the greater supplement response was expected. In our database, both energy and protein-based supplements can be found, yet according to the preceding paper of Cazzuli et al. [6], no differences were found between either of these types of supplements on ADGchng, nor between the supplementation rate and SFE. The top leafy stratum of pastures is expected to be preferred among all other pasture components [37], meaning that it would be consumed before the rest of the sward, and therefore, the green leaf content would be expected to decline throughout trials. Even though Cazzuli et al. [30] found an opposite trend—at least at the end of a long stockpiling period and before grazing activities began—Benvenutti et al. [37] found that the fCP content of a C4 species dominated sward was greater in the upper stratum of the sward. Should the latter be the case, during the final phases, the pastures would be offering lower quality forage in terms of fCP, which matches our results because, during this late stage, the lower the fCP, the greater the response. On the other hand, and matching our results, Detmann et al. [12] found that supplement response decreased as the fCP increased, but these results were observed with very low fCP contents, whereas in this collated analysis fCP was above 8% on average. An fCP threshold could exist under which no effect could be expected (early phases, 300 GDD) and above which (later phases, 1000 GDD) it could be observed.

5. Conclusions

As stated in our working hypothesis, a positive and low-moderate substitution rate occurred in our dataset, suggesting that there is still room for improvement of supplemental efficiency. Additionally, we concluded that the digestibility of the consumed pasture affects the supplement feed efficiency to some extent. Thus, efficiency is a multi-factorial issue, predominantly associated mostly with forage and supplement intake affecting the animal’s digestive physiology but without excluding the native pasture’s nutritive characteristics and array.
Also accordingly with our initial hypothesis, three different supplementation responses could be identified (one of them being linear, and two of them being non-linear), with a slow beginning and an accelerated phase afterwards. Quadratic response patterns were explained mostly by herbage biomass and substitution rates, while Weibull response patterns were mostly associated with frosts.
Regardless of the response pattern, at the beginning of the trials, it was the animals’ body weight and supplement quality that most influenced supplement response in a positive way, whereas towards the end, both lower supplementation intakes and CP forage contents played a more relevant role in explaining greater responses. This information may be used in commercial supplementation schemes to help predict what to expect in each phase and to introduce modifications accordingly, such as altering supplement type if possible, shifting paddocks, etc.
Studying supplementation phases in detail in future research, especially in terms of sward conditions throughout the supplementation period, could shed further light on the variability of supplement feed efficiency along the period in which supplementation takes place. The estimated parameters and their variability in forage intake and substitution rates could be useful if included in decision support systems for livestock farmers in the future.

Author Contributions

Conceptualization, F.C., F.A.L., C.B. and M.D.; methodology, F.C., F.A.L., C.B. and M.D.; software, F.C., F.A.L., C.B. and M.D.; validation, F.C., F.A.L., C.B. and M.D.; formal analysis, F.C., C.B., M.D., A.H. and J.S., investigation, F.C., A.H., J.S., P.R., V.B., A.S., M.J., M.D., J.V.S., D.P., F.M., X.L., S.L., G.B., J.I.V., F.A.L. and C.B.; resources, M.J. and F.A.L.; data curation, F.C., M.D. and C.B.; writing—original draft preparation, F.C., C.B. and M.D.; writing—review and editing, F.C., A.H., J.S., P.R., V.B., A.S., M.J., M.D., J.V.S., D.P., F.M., X.L., S.L., G.B., J.I.V. and C.B.; visualization, F.C., C.B., M.D. and F.A.L.; supervision, C.B. and M.D.; project administration, M.J.; funding acquisition, M.J., F.A.L. and F.C. All authors have read and agreed to the published version of the manuscript.

Funding

This research was funded by INIA Uruguay.

Institutional Review Board Statement

Not applicable.

Informed Consent Statement

Not applicable.

Data Availability Statement

The data that support the findings of this study are available from the corresponding author upon reasonable request.

Acknowledgments

We are grateful to Zully Ramos for her continuous support and advice, and to Georgett Banchero for her final comments and suggestions to improve the paper. We acknowledge the students and technicians that helped carry out the experiments. INIA Uruguay and the Agronomy School of the University of the Republic (FAgro/UdelaR) financed this research. F.C. is grateful to INIA for financial support via an Academic Excellence Scholarship for Ph.D. studies.

Conflicts of Interest

The authors declare no conflict of interest.

Appendix A

Table A1. Summary of collated trials on supplementation of cattle grazing native rangelands carried out in Uruguay between 1993 and 2018. All trials included one unsupplemented control treatment.
Trial IDLocation, YearSupplementation Treatments *Breed and CategoryDuration (Days)ReplicatesAnimals/TrialSource
1 *La Magnolia, 2013TMR with fibreBraford male calves97240[2]
2 *Glencoe, 2013TMR with fibreHereford male calves 120240[2]
3 *La Magnolia, 2014RB (ground and pelleted)Braford male calves68240[38]
4 *Glencoe, 2014RB (ground and pelleted)Hereford male calves 108250[38]
5 *Glencoe, 2015Various (maize, expellers and RB)Hereford male calves141250[38]
6 *Glencoe, 2009RB Hereford male and female calves 113248[39]
7 *Glencoe, 2010RB Hereford male calves 111248[39]
8 *Glencoe, 2011RB Hereford male calves 119248[39]
14 *Ptas del Chuy, 2011TMRBritish crossbred male calves81248[40]
16 *Glencoe, 2007RBBritish crossbred male calves 98224[39]
17Palo a Pique, 2012TMR with fibreBritish crossbred male calves77112[41]
24 *Glencoe, 2004Various (RB and expeller)British crossbred steers42270[42]
25 *Glencoe, 2004Various (RB and expeller)British crossbred steers78270[42]
27Palo a Pique, 2008TMRBritish crossbred male calves77156[43]
28 *Cañada del Pueblo, 2008DDGSHereford female calves89240[44]
29 *Tomás Gomensoro, 2008DDGSBritish crossbred male calves84240[44]
Total 1156
ID: identification number; TMR: total mixed ration; RB: rice bran; HMSGS: high-moisture sorghum grain silage (combined with protein supplements); * Trial with two replicates.

Appendix B

Table A2. Descriptive statistics of herbage matter intake (HDMI), supplement substitution rate (sSbR) and potential herbage intake substitution (hSbR): (mean), standard deviation (SD), coefficient of variation (CV), minimum (min), and maximum (max) of a dataset of supplementation of cattle grazing native rangelands carried out in Uruguay between 1993 and 2018.
VariableMinMeanMinSDCV
HDMI 45%DMD (kg/animal/d)2.476.4810.301.6926
HDMI 55%DMD (kg/animal/d)1.884.947.851.2124
HDMI 65%DMD (kg/animal/d)1.433.906.070.9424
HDMI 45%DMD (%BW)0.002.905.391.0436
HDMI 55%DMD (%BW)0.002.213.690.7534
HDMI 65%DMD (%BW)0.001.742.770.5834
sSbR 45%−1.161.065.621.26119
sSbR 55%−1.010.503.380.81162
sSbR 65%−0.900.322.350.59185
sSbR 55–65%−0.291.093.880.7670
hSbR 45%−0.350.200.670.21108
hSbR 55%−0.410.130.610.21160
hSbR 65%−0.430.120.600.22179
hSbR 55–65%−0.120.310.710.1856
%DMD: dry matter digestibility; BW: body weight; sSbR = (control HDMI − supplemented HDMI)/supplement dry matter intake; hSbR = (control HDMI − supplemented HDMI)/control HDMI. 45, 55 and 65%: assumed forage DMD to estimate HDMI using CSIRO’s spreadsheet model; 55−65%: assuming control animals consume a lower forage DMD (55%) than supplemented animals (65%) to estimate HDMI using CSIRO’s spreadsheet model.

References

  1. Simeone, A.; Beretta, V.; Blasina, M.; Piñeirúa, A.; Renau, M. Winter Response of Weaned Beef Calves to Self-fed Supplementation on Native Pastures. Proc. Aust. Soc. Anim. Prod. 2010, 28, 5. [Google Scholar]
  2. Cazzuli, F.; Lagomarsino, X.; Boggiano, P.; Saadoun, A.; Montossi, F. Self-feeding improved animal performance of calves grazing native grasslands during winter on extensive livestock production systems. Agro. Sur. 2018, 46, 29–39. [Google Scholar] [CrossRef] [Green Version]
  3. Cazzuli, F.; De Barbieri, I.; Jaurena, M.; Silveira, C.; Montossi, F. Restricted oats grazing and its frequency of allocation affects calves’ performance on native grasslands. Arch. Zootec. 2019, 68, 220–227. [Google Scholar] [CrossRef] [Green Version]
  4. Grigera, G.; Oesterheld, M.; Pacín, F. Monitoring forage production for farmers’ decision making. Agric. Syst. 2007, 94, 637–648. [Google Scholar] [CrossRef]
  5. De Figueiredo, D.M.; De Oliveira, A.S.; Sales, M.F.L.; Paulino, M.F.; Do Vale SM, L.R. Economic analysis of four supplementation strategies for growth and finish beef cattle in a pasture-supplement system. Rev. Bras. Zootec. 2007, 36, 1443–1453. [Google Scholar]
  6. Cazzuli, F.; Sánchez, J.; Hirigoyen, A.; Rovira, P.; Beretta, V.; Simeone, A.; Jaurena, M.; Durante, M.; Savian, J.V.; Poppi, D.; et al. Supplement feed efficiency of growing beef cattle grazing native Campos grasslands during winter: A collated analysis. Transl. Anim. Sci. 2023, 7, txad028. [Google Scholar] [CrossRef]
  7. Gekara, O.J.; Prigge, E.C.; Bryan, W.B.; Nestor, E.L.; Seidel, G. Influence of sward height, daily timing of concentrate supplementation, and restricted time for grazing on forage utilization by lactating beef cows. J. Anim. Sci. 2005, 83, 1435–1444. [Google Scholar] [CrossRef]
  8. Krysl, L.J.; Hess, B.W. Influence of Supplementation on Behaviour of Grazing Cattle. J. Anim. Sci. 1993, 71, 2546–2555. [Google Scholar] [CrossRef]
  9. Bailey, D.W.; Jensen, D. Method of Supplementation May Affect Cattle Grazing Patterns. Rangel. Ecol. Manag. 2008, 61, 131–135. [Google Scholar] [CrossRef]
  10. Palma, M.N.; Reis, W.L.; Rodrigues, J.P.; Silva, T.E.; Franco, M.O.; Rennó, L.N.; Detmann, E. Strategies of energy supplementation for cattle fed tropical forage and infrequently supplemented with protein. Anim. Feed. Sci. Technol. 2023, 297, 115599. [Google Scholar] [CrossRef]
  11. Costa, D.F.A.; Correia, P.S.; Dorea, J.R.R.; De Souza, J.; Congio, G.F.D.S.; Pires, A.V.; Malafaia, P.A.M.; Drouillard, J.; Dias, C.T.D.S.; Luchiari-Filho, A.; et al. Strategic supplementation of growing cattle on tropical pastures improves nutrient use and animal performance, with fewer days required on the finishing phase. Anim. Prod. Sci. 2021, 61, 480. [Google Scholar] [CrossRef]
  12. Detmann, E.; Valente, E.; Batista, E.D.; Huhtanen, P. An evaluation of the performance and efficiency of nitrogen utilization in cattle fed tropical grass pastures with supplementation. Livest. Sci. 2014, 162, 141–153. [Google Scholar] [CrossRef]
  13. Caton, J.S.; Dhuyvetter, D.V. Influence of energy supplementation on grazing ruminants: Requirements and responses. J. Anim. Sci. 1997, 75, 533–542. [Google Scholar] [CrossRef] [PubMed]
  14. Wang, Z.; Nkrumah, J.D.; Li, C.; Basarab, J.A.; Goonewardene, L.A.; Okine, E.K.; Crews, D.H.; Moore, S.S. Test duration for growth, feed intake, and feed efficiency in beef cattle using the GrowSafe System. J. Anim. Sci. 2006, 84, 2289–2298. [Google Scholar] [CrossRef]
  15. Stafford, S.D.; Cochran, R.C.; VanZant, E.S.; O Fritz, J. Evaluation of the potential of supplements to substitute for low-quality, tallgrass-prairie forage. J. Anim. Sci. 1996, 74, 639–647. [Google Scholar] [CrossRef]
  16. Grainger, C.; Mathews, G. Positive relation between substitution rate and pasture allowance for cows receiving concentrates. Aust. J. Exp. Agric. 1989, 29, 355–360. [Google Scholar] [CrossRef]
  17. Rogers, G.L. Pasture and supplements in the temperate zone. In The Challenge: Efficient Dairy Production; Australian Society of Animal Production: Toowong, Queensland, Australia, 1985; pp. 85–108. [Google Scholar]
  18. Beever, D.E.; Doyle, P.T. Feed conversion efficiency as a key determinant of dairy herd performance: A review. Aust. J. Exp. Agric. 2007, 47, 645–657. [Google Scholar] [CrossRef]
  19. Da Trindade, J.K.; Neves, F.P.; Pinto, C.E.; Bremm, C.; Mezzalira, J.C.; Nadin, L.B.; Genro, T.C.; Gonda, H.L.; Carvalho, P.C. Daily Forage Intake by Cattle on Natural Grassland: Response to Forage Allowance and Sward Structure. Rangel. Ecol. Manag. 2016, 69, 59–67. [Google Scholar] [CrossRef]
  20. CattleExplorer. CattleExplorer Spreadsheet. CSIRO GrazPlan. 2012. Available online: http://www.grazplan.csiro.au/ (accessed on 13 May 2023).
  21. Osítis, U.; Strikauska, S.; Grundmane, A. Lopbarības Analīžu Rezultātu Apkopojums. LLU SIA Jelgavas Tipogrāfija 2003, 62, 1. [Google Scholar]
  22. Sparks, A. Nasapower: NASA-POWER Data from R. 2023. Available online: https://cran.r-project.org/web/packages/nasapower/index.html (accessed on 13 May 2023).
  23. R Core Team. R: A Language and Environment for Statistical Computing; R Foundation for Statistical Computing: Vienna, Austria, 2017; Available online: https://www.r-project.org/ (accessed on 13 May 2023).
  24. Di Rienzo, J.A.; Casanoves, F.; Balzarini, M.G.; Gonzalez, L.; Tablada, M.; Robledo, C.W. InfoStat Versión 2015 [Computer Program] Grupo InfoStat, FCA; Universidad Nacional de Córdoba: Cordoba, Argentina, 2015. [Google Scholar]
  25. Méndez, M.N.; Chilibroste, P.; Aguerre, M. Pasture dry matter intake per cow in intensive dairy production systems: Effects of grazing and feeding management. Animal 2020, 14, 846–853. [Google Scholar] [CrossRef]
  26. Kellaway, R.; Harrington, T. Feeding Concentrates: Supplements for Dairy Cows. Sci. Access 2004, 1, 271. [Google Scholar]
  27. Pérez-Prieto, L.; Delagarde, R. Meta-analysis of the effect of pasture allowance on pasture intake, milk production, and grazing behavior of dairy cows grazing temperate grasslands. J. Dairy Sci. 2013, 96, 6671–6689. [Google Scholar] [CrossRef] [Green Version]
  28. Penno, J.W.; Macdonald, K.A.; Holmes, C.W.; Davis, S.R.; Wilson, G.F.; Brookes, I.M.; Thom, E.R. Responses to supplementation by dairy cows given low pasture allowances in different seasons 1. Pasture intake and substitution. Anim. Sci. 2006, 82, 661–670. [Google Scholar] [CrossRef] [Green Version]
  29. Dixon, R.M.; Stockdale, C.R. Associative effects between forages and grains: Consequences for feed utilisation. Aust. J. Agric. Res. 1999, 50, 757–774. [Google Scholar] [CrossRef] [Green Version]
  30. Cazzuli, F.; Bremm, C.; Jaurena, M.; Poppi, D.; Durante, M.; Benvenutti, M.A.; Savian, J.V.; Devincenzi, T.; Rovira, P.; Lagomarsino, X.; et al. The defoliation dynamics of a stockpiled native grassland pasture follow similar patterns between supplemented and unsupplemented beef calves. Grass Forage Sci. 2022, 78, 306–316. [Google Scholar] [CrossRef]
  31. Bohnert, D.W.; DelCurto, T.; Clark, A.A.; Merrill, M.L.; Falck, S.J.; Harmon, D.L. Protein supplementation of ruminants consuming low-quality cool- or warm-season forage: Differences in intake and digestibility. J. Anim. Sci. 2011, 89, 3707–3717. [Google Scholar] [CrossRef] [Green Version]
  32. Berretta, J.; Risso, D.; Montossi, F.; Pigurina, G. Campos in Uruguay. In Grassland Ecophysiology and Grazing Ecology; Lemaire, G.F., Hodgon, J., de Moraes, A., Nabinger, C., Carvalho, Eds.; CAB International: Wallingford, UK, 2000; pp. 377–394. [Google Scholar]
  33. Da Trindade, J.; Pinto, C.; Neves, F.; Mezzalira, J.; Bremm, C.; Genro, T.; Tischler, M.; Nabinger, C.; Gonda, H.; Paulo, C.; et al. Forage Allowance as a Target of Grazing Management: Implications on Grazing Time and Forage Searching. Rangel. Ecol. Manag. 2012, 65, 382–393. [Google Scholar] [CrossRef]
  34. Mezzalira, J.C.; Carvalho, P.C.D.F.; Da Trindade, J.K.; Bremm, C.; Fonseca, L.; Amaral, M.F.D.; Reffatti, M.V. Produção animal e vegetal em pastagem nativa manejada sob diferentes ofertas de forragem por bovinos. Ciência Rural. 2012, 42, 1264–1270. [Google Scholar] [CrossRef] [Green Version]
  35. da Cunha, L.L.; Bremm, C.; Savian, J.V.; Zubieta, Á.S.; Rossetto, J.; Carvalho, P.C.d.F. Relevance of sward structure and forage nutrient contents in explaining methane emissions from grazing beef cattle and sheep. Sci. Total Environ. 2023, 869, 161695. [Google Scholar] [CrossRef]
  36. Lascano, C.E.; Schmidt, A.; Barahona, R. Forage Quality and the Environment. International Grassland Congress, 19 October 2015. 2001, pp. 1–19. Available online: http://www.internationalgrasslands.org/papers/pdfs/tema9_1.pdf (accessed on 13 May 2023).
  37. Benvenutti, M.A.; Pavetti, D.R.; Poppi, D.P.; Gordon, I.J.; Cangiano, C.A. Defoliation patterns and their implications for the management of vegetative tropical pastures to control intake and diet quality by cattle. Grass Forage Sci. 2015, 71, 424–436. [Google Scholar] [CrossRef]
  38. Montossi, F. Sistemas de suplementación mediante auto-suministro para la mejora de la recría invernal de terneros sobre campo natural en el norte del Uruguay. In Auto-Suministro y Suplementación Sobre Campo Natural; Montossi, F., Ed.; Serie Técnica 234; INIA: Tacuarembó, Uruguay, 2017; p. 70. [Google Scholar]
  39. Luzardo, S.; Cuadro, R.; Lagomarsino, X.; Montossi, F.; Brito, G.; La Manna, A. Tecnologías para la intensificación de la recría en el basalto—Uso estratégico de suplementación sobre campo natural y pasturas mejoradas. In Alternativas Tecnológicas Para los Sistemas Ganaderos de Basalto; Berretta, E.J., Montossi, F., Brito, G., Eds.; Serie Técnica 217; INIA: Tacuarembó, Uruguay, 2014; pp. 71–91. [Google Scholar] [CrossRef]
  40. Esteves, M.; Laxalde, S.; Nario, M. Utilización de Nitrógeno no Proteico en Programas de Suplementación Invernal Basados en Autoconsumo Para Terneros Pastoreando Campo Nativo. Bachelor’s Thesis, FAgro/UdelaR, Montevideo, Uruguay, 2013; p. 119. [Google Scholar]
  41. Rovira, P.; Velazco, J.; Montossi, F. Desempeño productivo de terneros sobre campo natural suplementados con grano húmedo de sorgo y distintos niveles de nitrógeno de liberación lenta (rumenfeed). In Suplementación de Bovinos con Grano Húmedo de Sorgo y Fuentes Proteicas Sobre Campo Natural; Rovira, P., Ed.; INIA: Montevideo, Uruguay, 2014; pp. 47–58. [Google Scholar]
  42. Arrieta, G.; Lagomarsino, X.; Olivera, J.; Trindade, G. Incidencia de Diferentes Dietas Sobre el Crecimiento Animal, el Rendimiento Carnicero y la Calidad de Carne. Bachelor’s Thesis, FAgro/UdelaR, Montevideo, Uruguay, 2008; p. 218. [Google Scholar]
  43. Rovira, P.; Velazco, J.I. Evaluación de un sistema de autoconsumo restringido con distinto contenido de sal en la ración en terneros suplementados sobre campo natural. In Suplementación de Bovinos en Pastoreo: Autoconsumo; Rovira, P., Velazco, J., Eds.; Serie Técnica 199; INIA: Montevideo, Uruguay, 2012; pp. 23–31. [Google Scholar]
  44. Berretta, V.; Simeone, A.; Castro, G.; Ferrés, M.; Legorburu, G.; Victorica, M. DDGS, campo natural y comederos de autoconsumo: Una alianza estratégica para mejorar la recría en ganado de carne. In Jor- Nada Anual de la Unidad de Producción Intensiva de Carne: Pradera, Campo Natural, Suplementación y Corral: Un Medio Campo Para Ganar el Partido de la Rentabilidad; Simeone, A., Berretta, V., Eds.; UPIC/FAgro/UdelaR: Paysandú, Uruguay, 2019; pp. 32–43. [Google Scholar]
Figure 1. (a) Estimated substitution rates using three different digestibilities, substituting forage for supplement (sSbR) and, (b) potential herbage intake substitution rate (hSbR) related to animals and pastures in a database of 15 supplementation experiments for young beef cattle on native grasslands in Uruguay (2004–2018). DM: dry matter; fDM: forage DM; sDM: supplement DM; HDMI: herbage DM intake; sDMI: supplement DM intake; SbR: supplement substitution rate (control HDMI − supplemented HDMI)/sDMI); hSbR: potential forage intake substitution rate (control HDMI − supplemented HDMI)/control HDMI). 45, 55 and 65%: assumed forage dry matter digestibility (DMD) to estimate HDMI using CSIRO’s spreadsheet model; 55−65%: assuming control animals consume a lower forage DMD (55%) than supplemented animals (65%) to estimate HDMI using CSIRO’s spreadsheet model.
Grasses 02 00014 g001
Figure 2. Body weight (BW) against time, separated by control (C) or supplemented (S) animal groups and their different phases in a database of 15 supplementation experiments for young beef cattle on native grasslands in Uruguay (2004–2018). Control groups (C): red lines; supplemented groups (S): yellow lines; limits of phases according to the FindPick function (quantmod R®): black vertical lines.
Grasses 02 00014 g002
Figure 3. Accumulated average daily gain change (ADGchng) between supplemented and control plots, against growing degree days (GDD, base temperature = 0 °C) for all experiments in a database of 15 supplementation experiments for young beef cattle on native grasslands in Uruguay (2004–2018). (a) Trials 2, 4, 14, 16, 24, 25, 27, 28 (linear); (b) Trial 29 (linear); (c) Trials 3, 5, 7 (quadratic); (d) Trials 1, 8 (Weibull); (e) Trial 6 (Weibull). (a) y = −3.37 + 0.029x, R2 = 0.6872, RSE = 7.52, p < 0.0001; (b) y = −21.19 + 0.083x, R2 = 0.9944, RSE = 2.69, p < 0.0001; (c) y = −0.078 − 0.00716x + 0.0000142 × 2, R2 = 0.9531, RSE = 3.01, p < 0.0001; (d) y = 29.82 − 32.68 × exp(−exp(23.54) × 3.46), RSE = 5.1, p < 0.0001; (e) y = 57.72 − 57.19 × exp(−exp(17.59) × 2.60), RSE = 1.96, p < 0.0001.
Grasses 02 00014 g003
Figure 4. Principal component analysis separated into the five possible regression models explaining ADGchng (supplement response) vs. GDD (growing degree days, base temperature = 0 °C) of all experiments in a database of 15 supplementation experiments for young beef cattle on native grasslands in Uruguay (2004–2018).
Grasses 02 00014 g004
Figure 5. Accumulated average daily gain change (ADGchng) between supplemented and control plots, against GDD (growing degree days, base temperature = 0 °C), by best fitted models for all experiments in a database of 15 supplementation experiments for young beef cattle on native grasslands in Uruguay (2004–2018).
Grasses 02 00014 g005
Table 1. Descriptive statistics (mean), standard deviation (SD), coefficient of variation (CV), minimum (min), and maximum (max) related to animals and pastures in a database of 15 supplementation experiments for young beef cattle on native grasslands in Uruguay (2004–2018).
VariableMeanSDCVMinMax
cADG, kg/animal/day 0.190.1579−0.020.52
sADG, kg/animal/day0.520.23450.071.24
ADGchng, kg/animal/day 0.340.1852−0.101.02
Shrunk average BW, kg 1963618145282
Stocking rate, kg BW/ha4289522239630
Forage allowance (FA), kg DM/kg BW5.53.4631.119.1
Green forage allowance, kg green DM/kg BW 2.21.4630.686.5
Green FA/FA0.40.2420.20.9
Sward height, cm8.14.2522.519.0
Herbage biomass, kg DM/ha 21571062494616163
Herbage DM, % 55.18.71623.773.3
Green Herbage, % of DM43.017.44114.686.7
Herbage CP, % of DM 8.32.4294.316.6
Herbage ADF, % of DM43.48.21923.759.1
Herbage NDF, % of DM64.89.11430.781.1
Herbage energy, MJ ME/kg DM8.61.3156.512.1
Herbage DM digestibility, % 55.36.51242.970.5
Forage ME/CP, 100 MJ/kg CP 1.10.2190.71.6
Supplementation rate, %BW0.80.3350.42.0
Supplement DM intake, kg/animal/day 1.70.6341.13.9
SFE, ADGchng/kg DM of supplement 0.200.0840−0.060.35
SFE CP, ADGchng/kg CP of supplement 1.110.5550−0.262.40
SFE ME, ADGchng/MJ of supplement0.020.0140−0.000.03
Supplement ME content, MJ/kg of DM 11.50.7610.112.8
Supplement CP content, % of DM20.29.24612.143.9
Supplement ME/CP, 100 MJ/kg CP 0.50.2330.20.8
Stocking period, day96.027.12842.0141.0
cADG: control (C) animals’ average daily gain (ADG), sADG: supplemented (S) animals’ ADG; ADGchng: change in ADG between S and C animals; BW, body weight, DM: dry matter; Green: green DM proportion; CP: crude protein; ADF: acid detergent fibre; NDF: neutral detergent fibre; ME: metabolisable energy; SFE: supplement feed efficiency.
Table 2. Spearman’s correlation coefficients between supplemental feed efficiency (SFE) and estimated herbage dry matter intake (HDMI) in a database of 15 supplementation experiments for young beef cattle on native grasslands in Uruguay (2004–2018).
Correlation between SFE andSpearmanp-Value
HDMI 45%DMD (kg/animal/d) 0.44<0.001
HDMI 55%DMD (kg/animal/d) 0.46<0.001
HDMI 65%DMD (kg/animal/d) 0.48<0.001
HDMI 45%DMD (%BW)0.40<0.001
HDMI 55%DMD (%BW)0.46<0.001
HDMI 65%DMD (%BW)0.50<0.001
%DMD: dry matter digestibility; BW: body weight; SFE as kg BW change/kg supplement DM intake.
Table 3. Spearman’s correlation coefficients between supplement feed efficiency and three different digestibilities, substituting forage for supplement (sSbR) and potential herbage intake substitution (hSbR) related to animals and pastures in a database of 15 supplementation experiments for young beef cattle on native grasslands in Uruguay (2004–2018).
Correlation between SFE andSpearmanp-Value
sSbR 45%−0.72<0.001
sSbR 55%−0.76<0.001
sSbR 65%−0.79<0.001
sSbR 55–65%−0.72<0.001
hSbR 45%−0.76<0.001
hSbR 55%−0.78<0.001
hSbR 65%−0.79<0.001
hSbR 55–65%−0.78<0.001
sSbR: supplement substitution rate (control herbage dry matter intake, HDMI − supplemented HDMI)/supplement DM intake); hSbR: potential herbage intake substitution rate (control HDMI − supplemented HDMI)/control HDMI. 45, 55 and 65%: assumed forage dry matter digestibility (DMD) to estimate HDMI using CSIRO’s spreadsheet model; 55−65%: assuming control animals consume a lower forage DMD (55%) than supplemented animals (65%) to estimate HDMI using CSIRO’s spreadsheet model.
Table 4. Multiple linear regression model equations for ADGchng at 300 and 1000 °Cd GDD, in a database of 15 supplementation experiments for young beef cattle on native grasslands in Uruguay (2004–2018).
Multiple Linear Regression EquationR2Adjusted R2p-Value
ADGchng300 = −22.21 + 0.092 × BW + 3.66 × sCP:sME0.730.69<0.01
ADGchng1000 = 17.90 × sDMintake + 43.51 × sADG + 45.3 × fCP:fME − 7.01 × fCP0.850.79<0.05
ADGchng: average daily gain (ADG) change or supplementation response at either 300 growing degree days (GDD, °Cd, base temperature = 0 °C) or 1000 GDD, BW: body weight (kg), sCP: supplement crude protein (CP) content, sME: supplement metabolisable energy content, sDMintake: supplement DM intake, sADG: supplemented animals’ ADG, fCP: forage CP content; fME: forage ME.
Disclaimer/Publisher’s Note: The statements, opinions and data contained in all publications are solely those of the individual author(s) and contributor(s) and not of MDPI and/or the editor(s). MDPI and/or the editor(s) disclaim responsibility for any injury to people or property resulting from any ideas, methods, instructions or products referred to in the content.

