
An Activatable Nanoscintillator Probe for Detecting Telomerase Activity and Screening Inhibitors In Vivo

 and
and 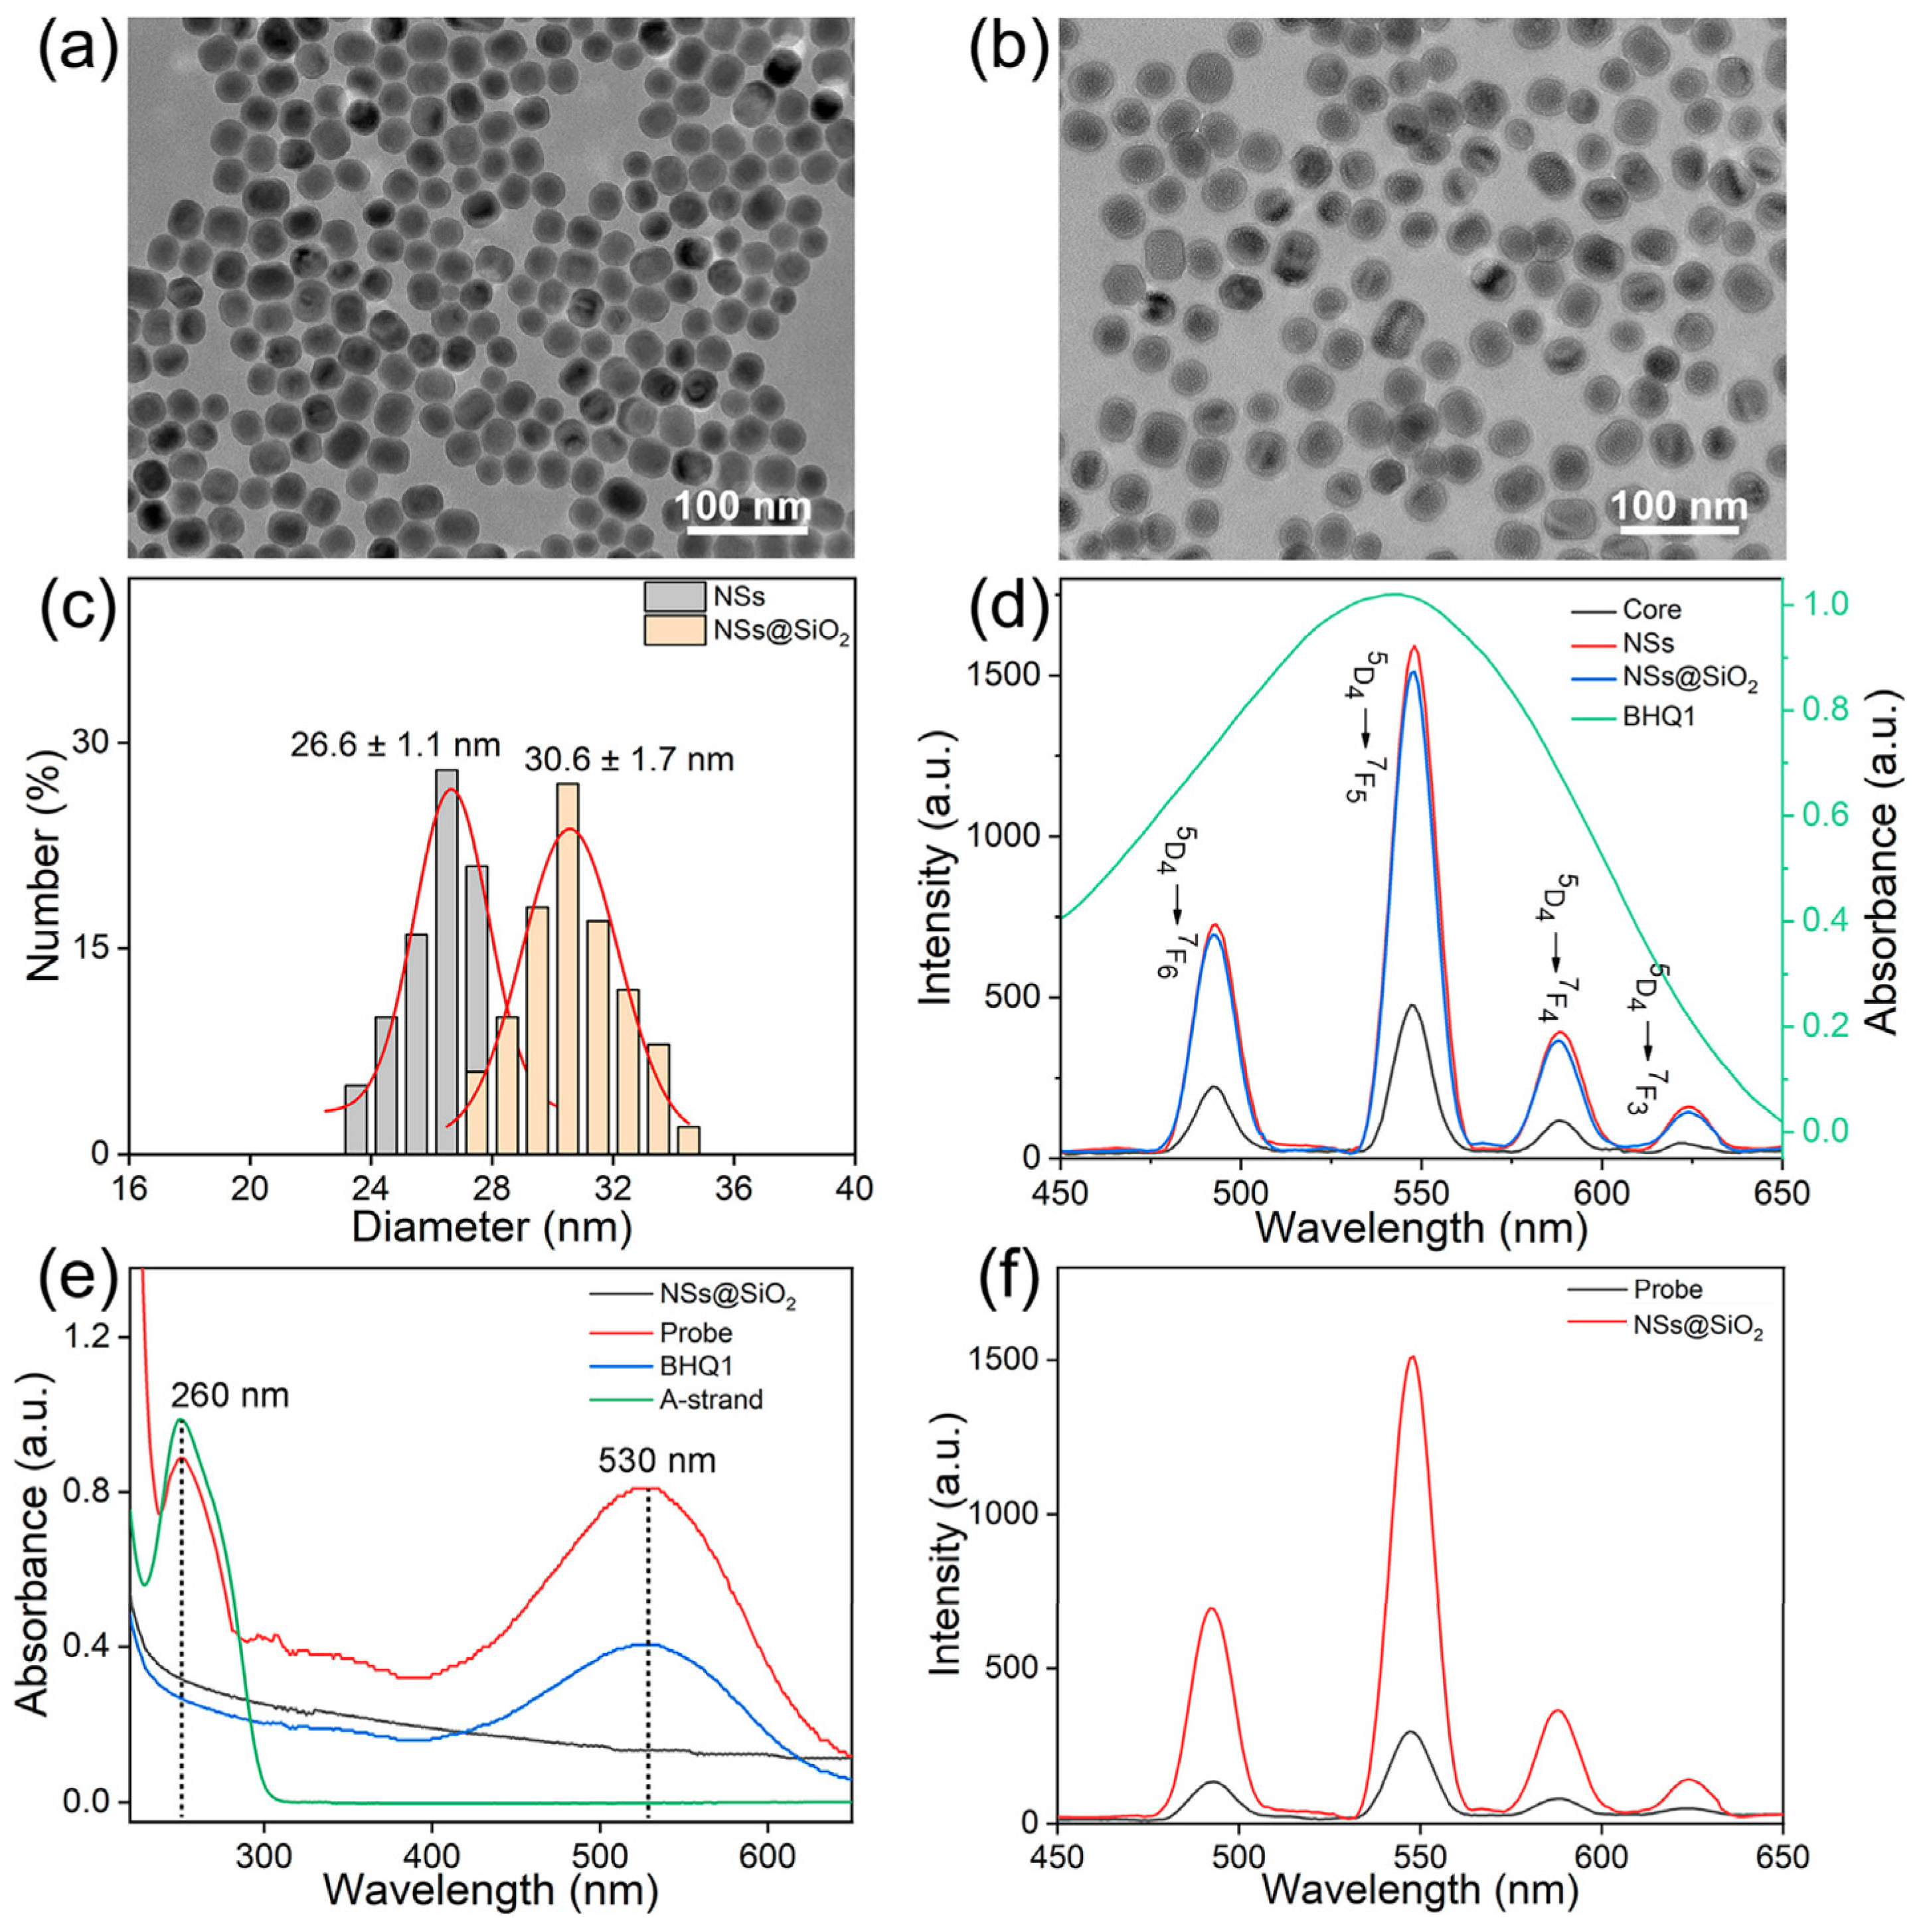
Abstract
:1. Introduction
2. Materials and Methods
3. Results and Discussion
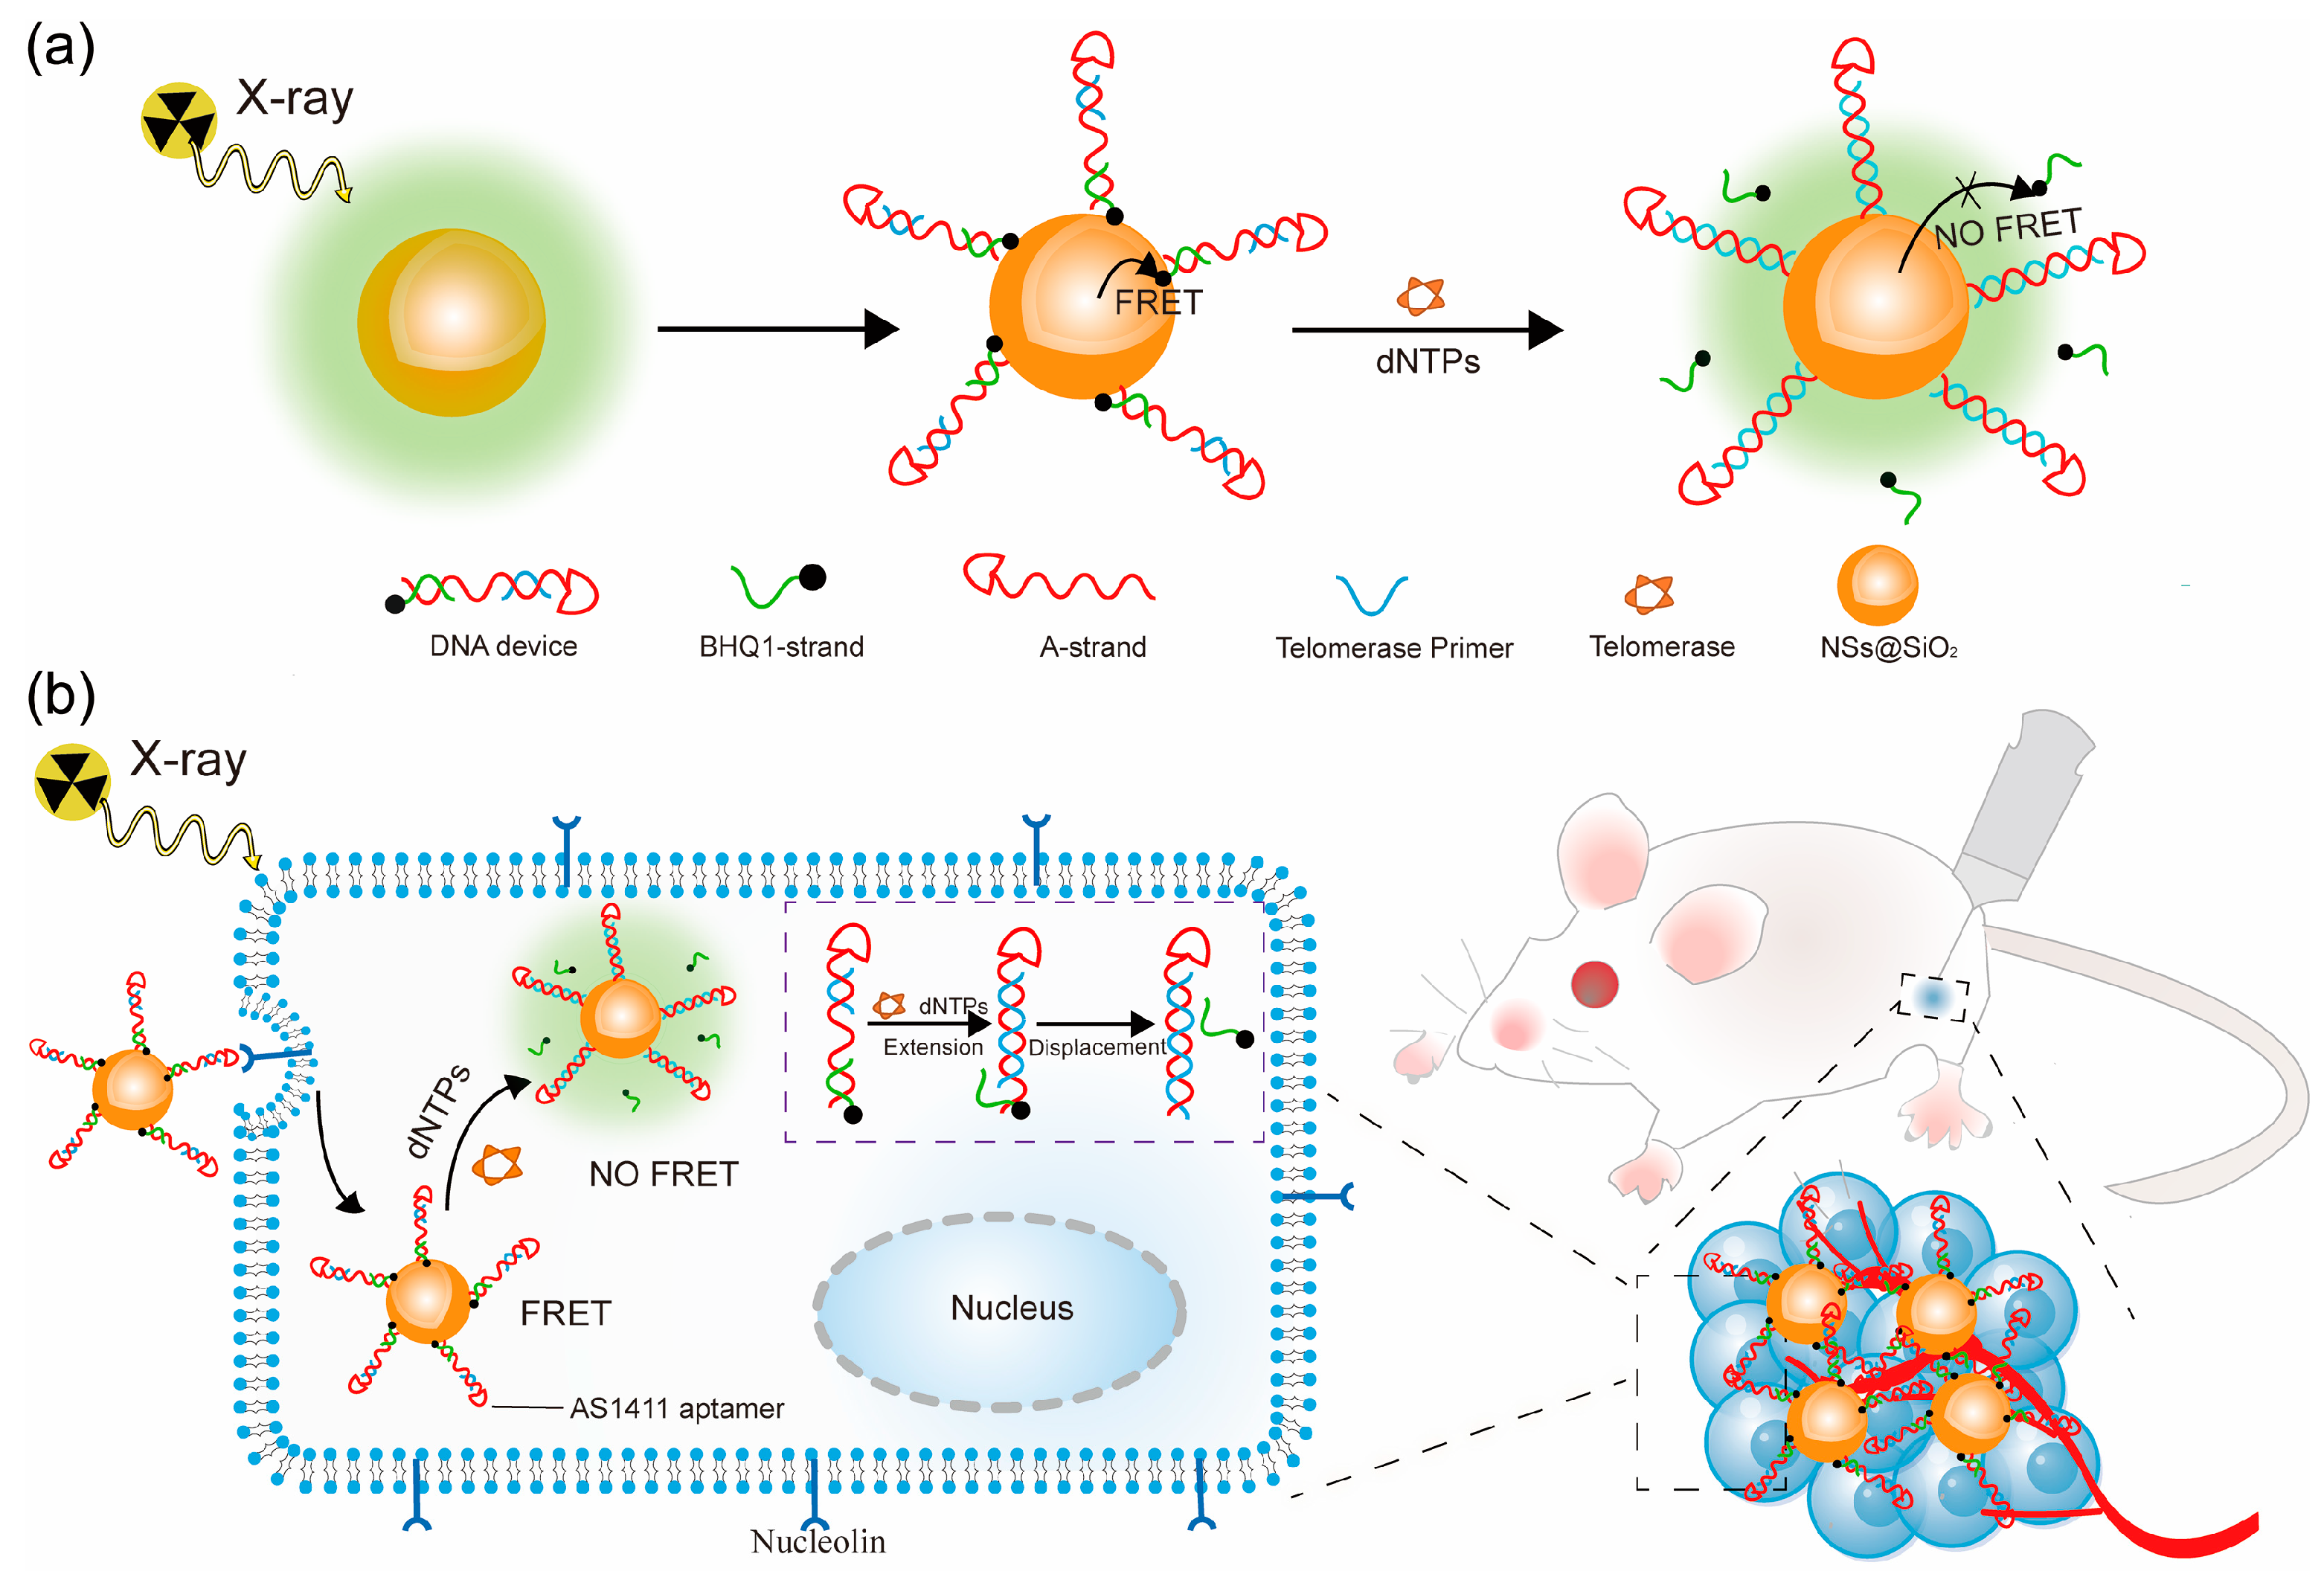
3.1. Synthesis and Characterization of the Probe
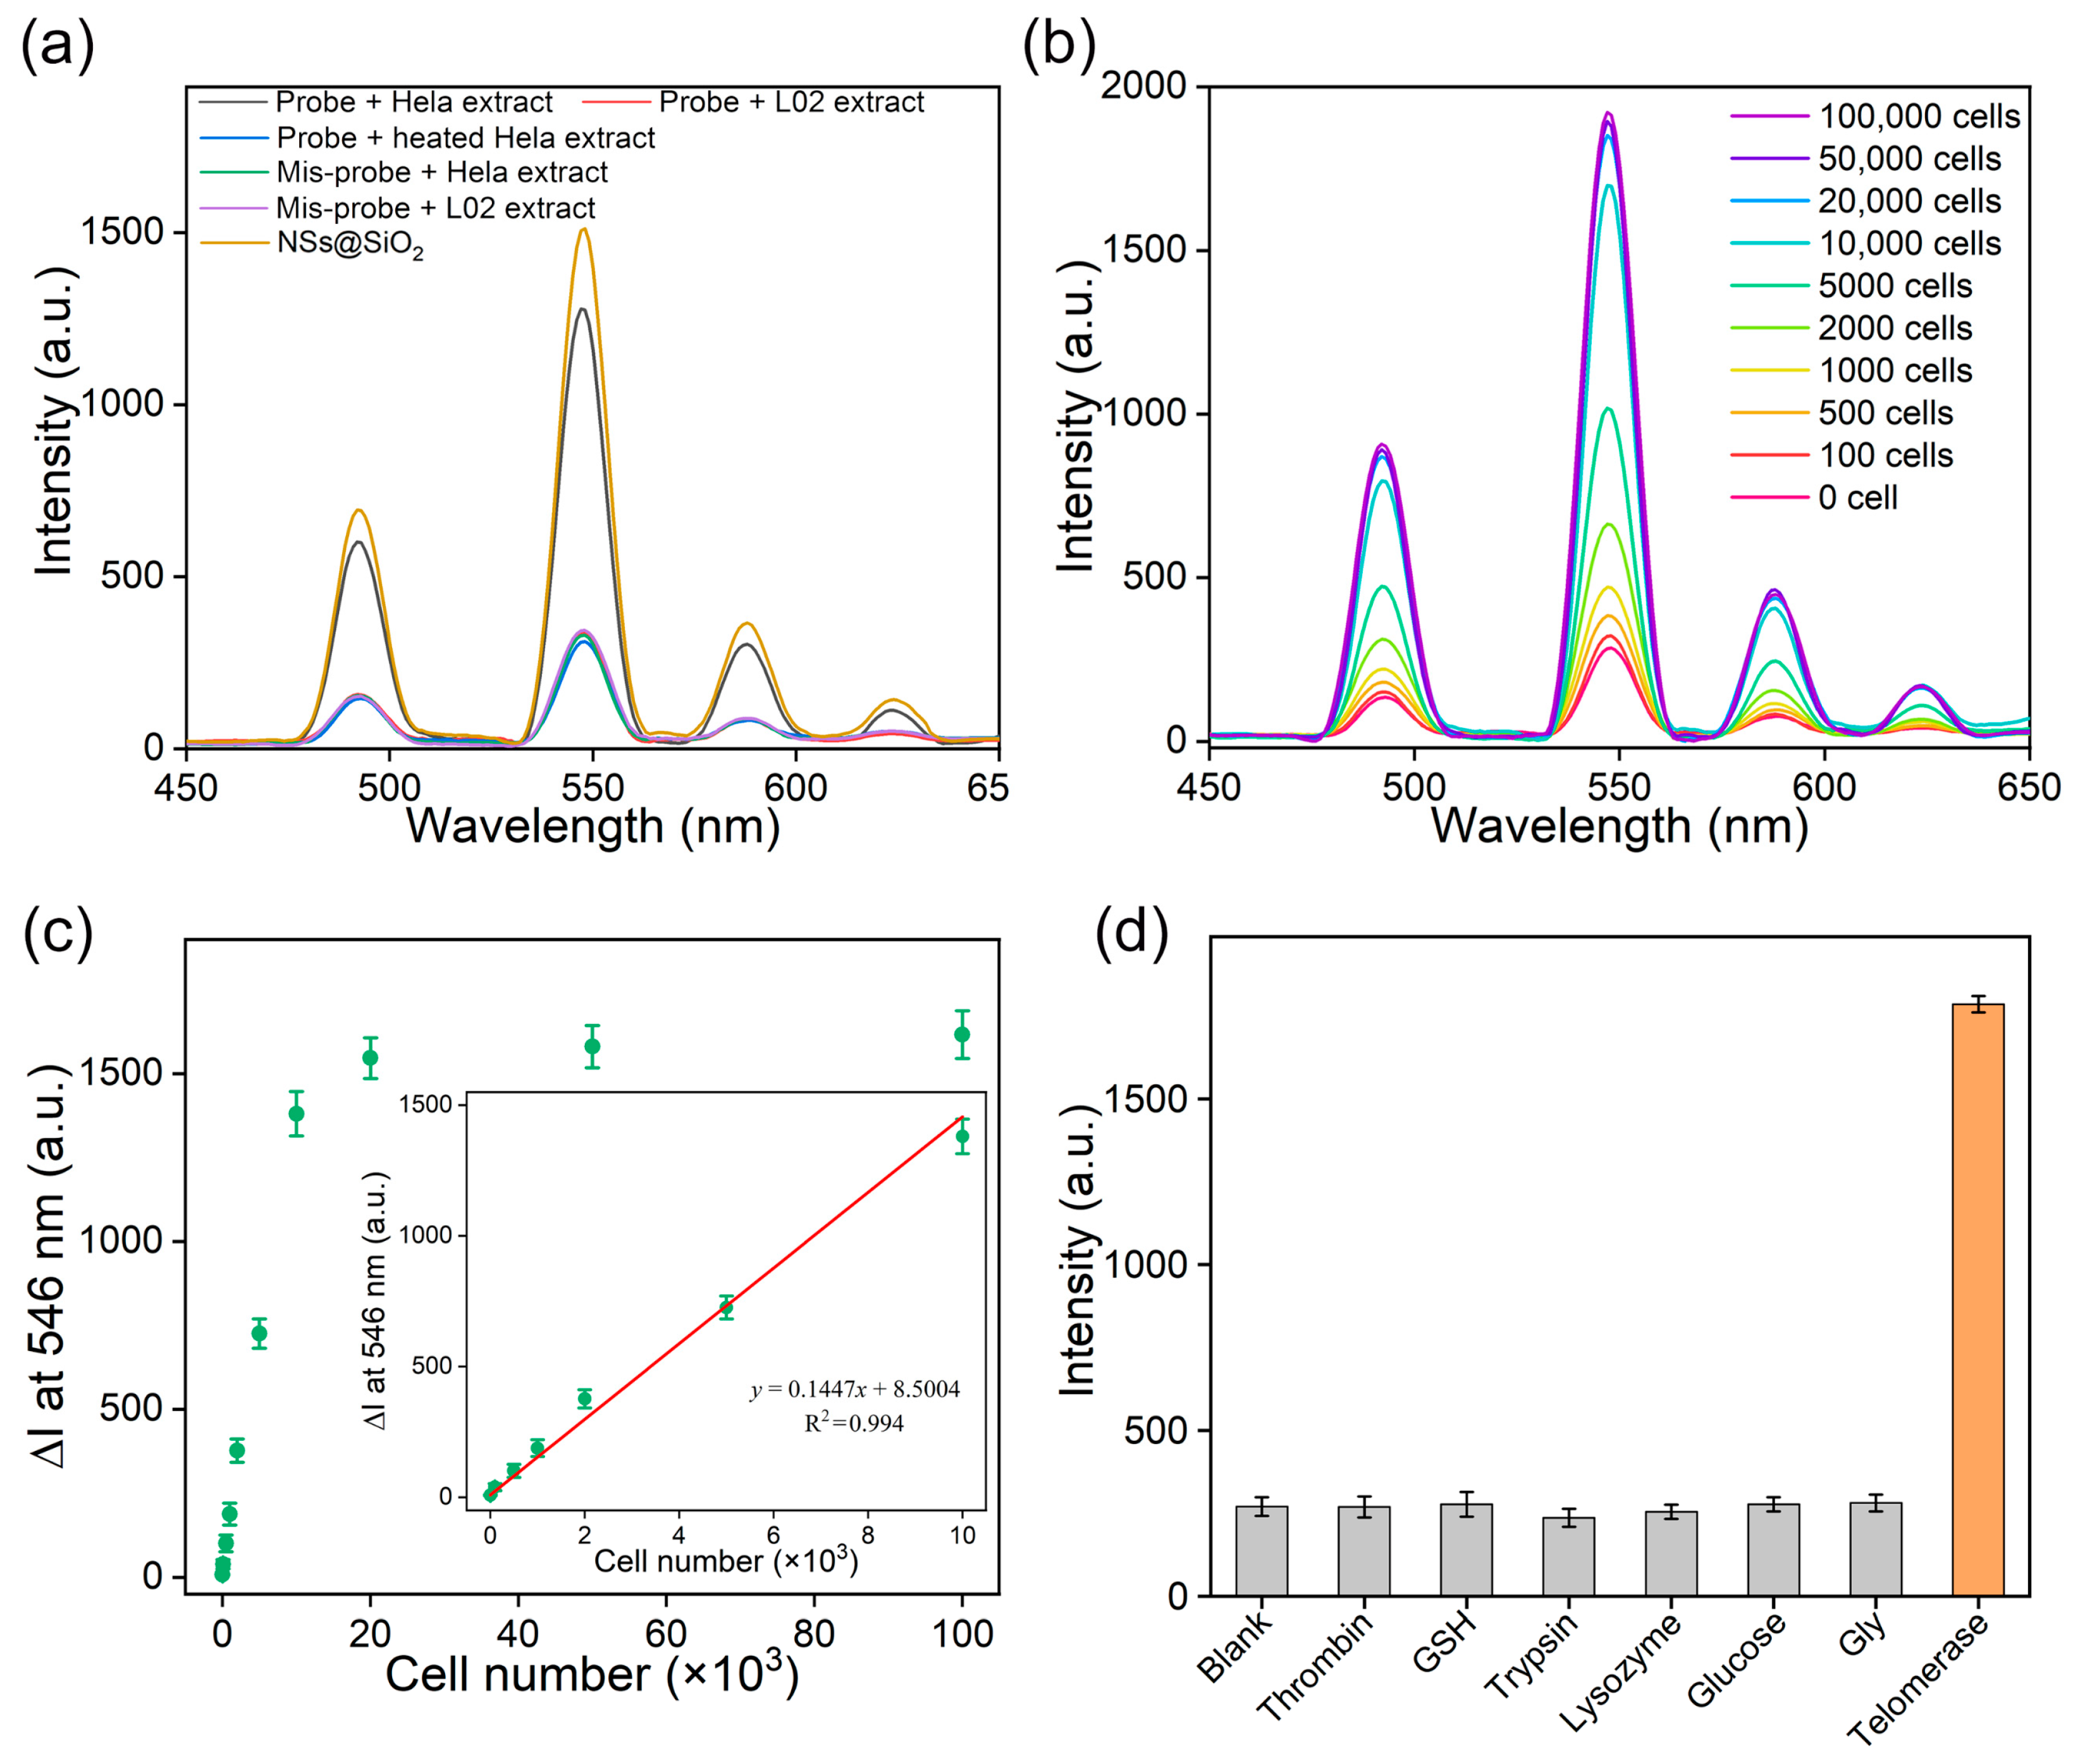
3.2. Telomerase Detection In Vitro
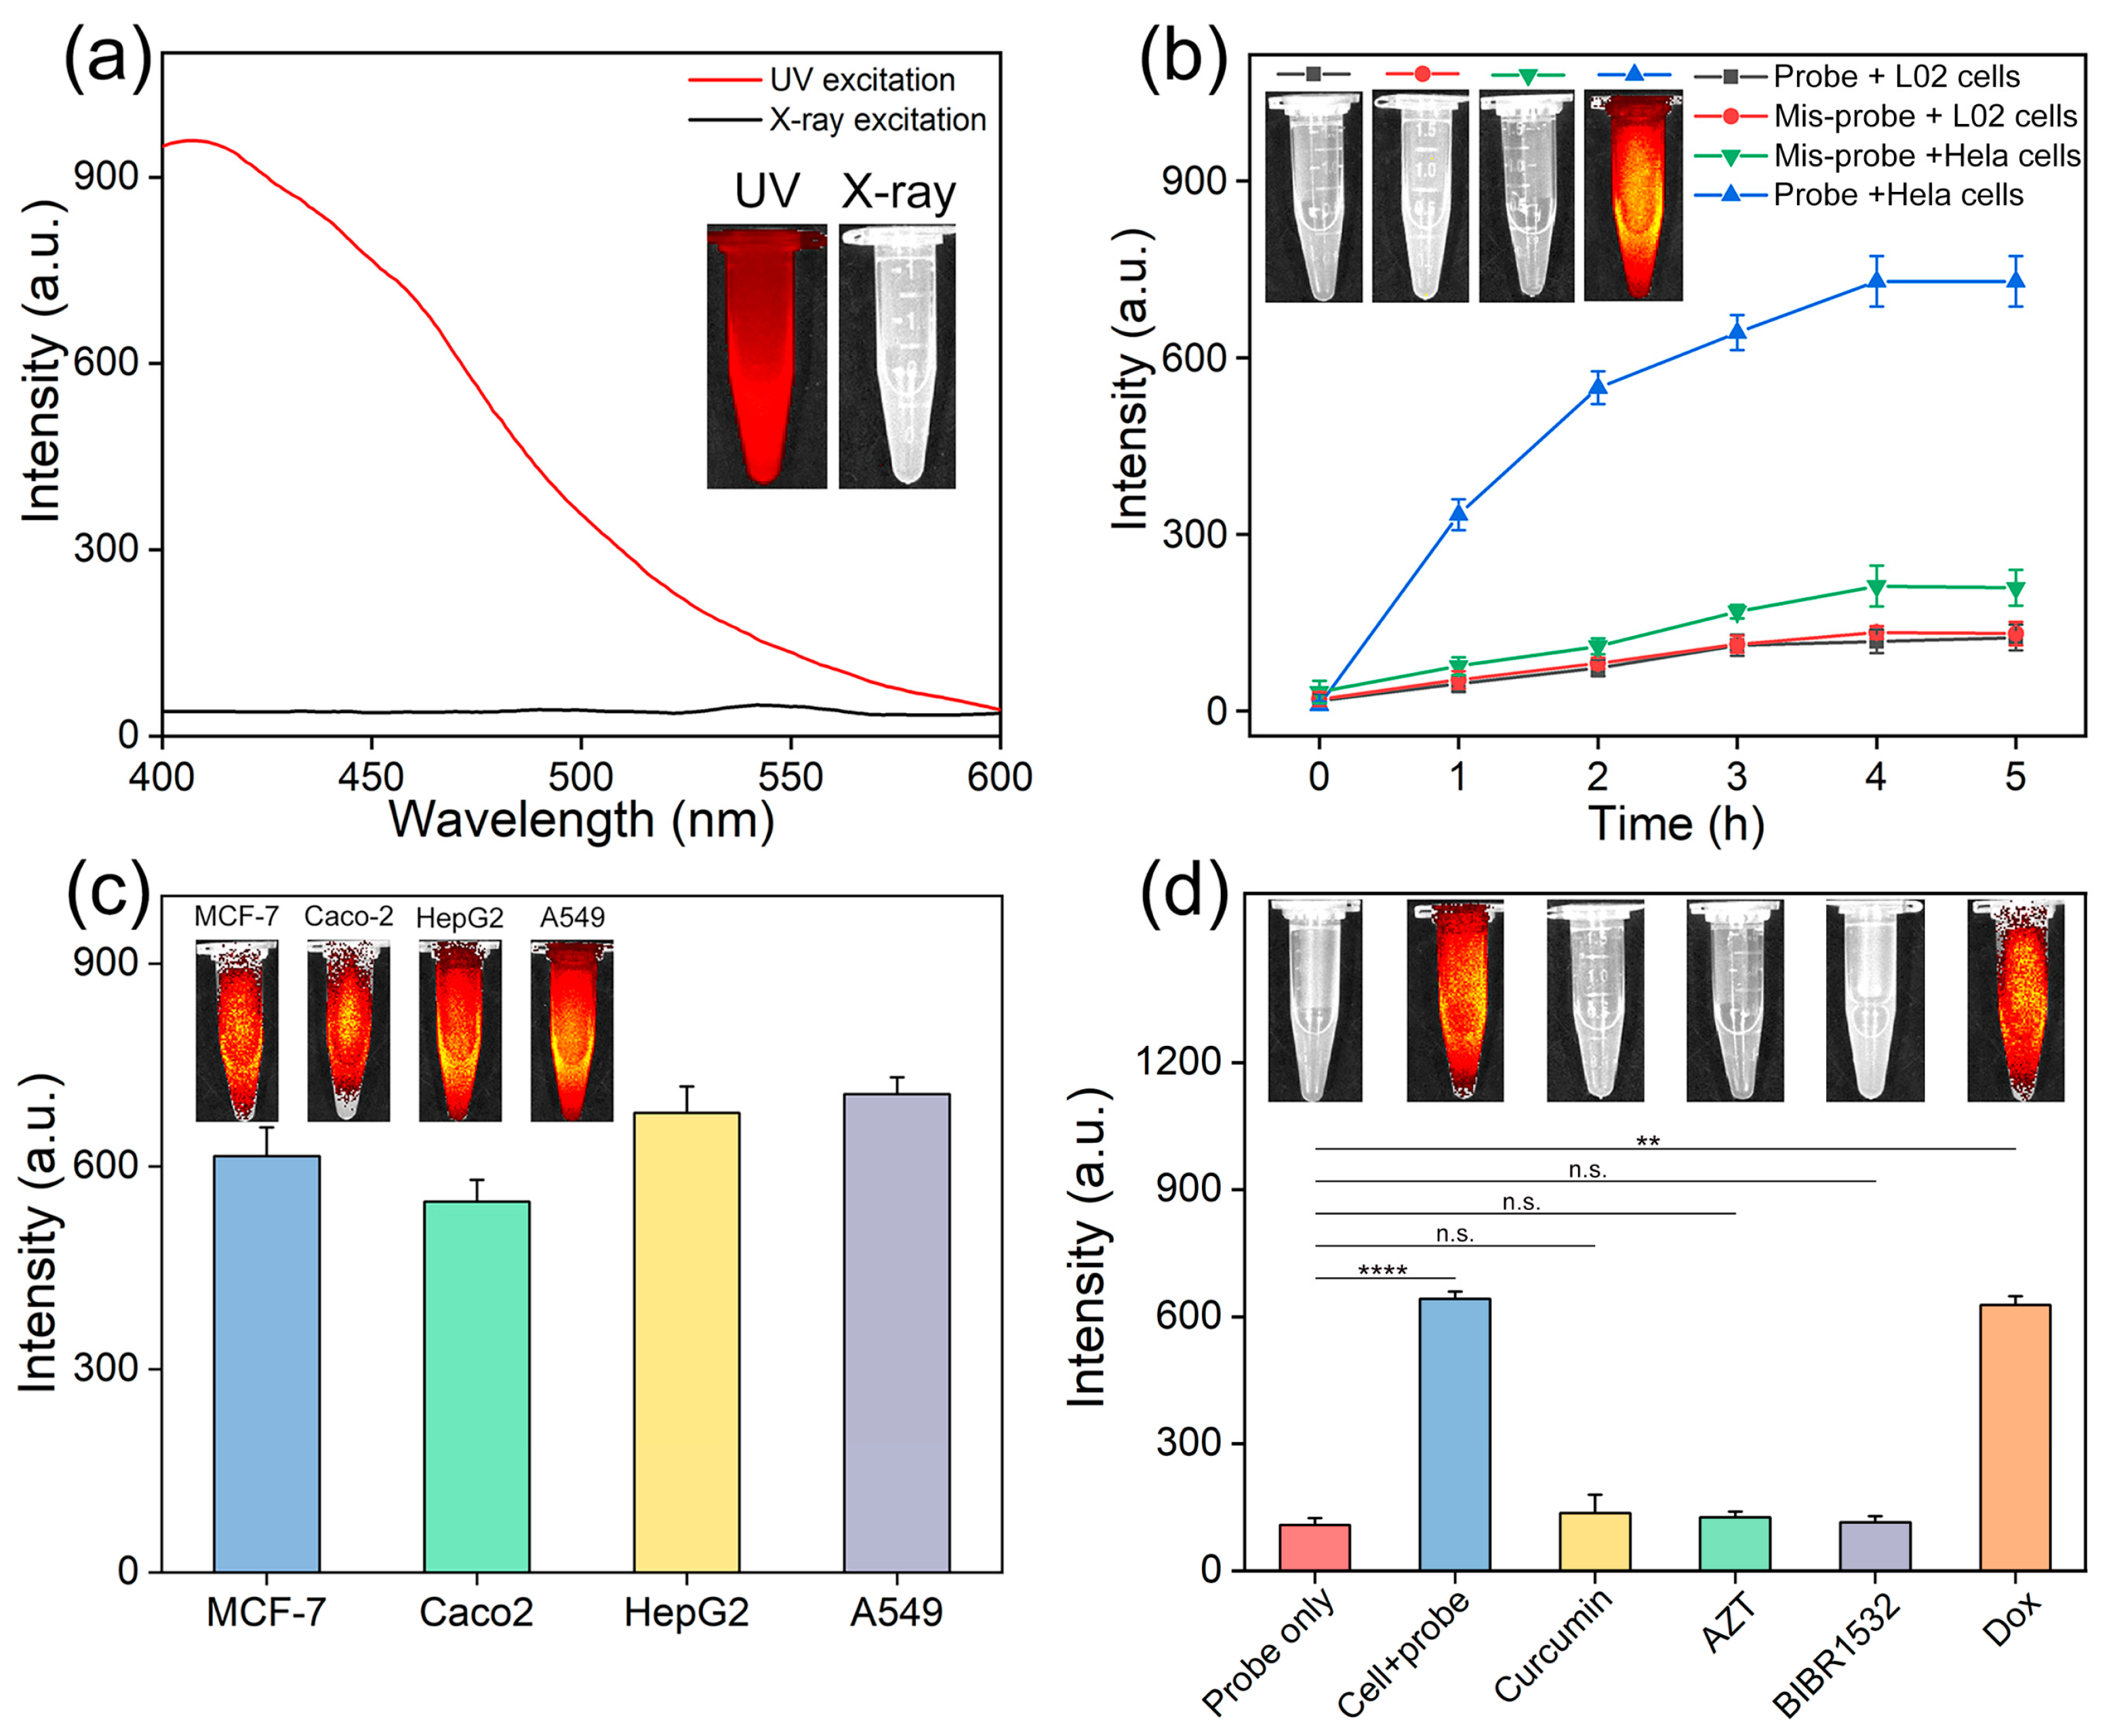
3.3. Analysis of Intracellular Telomerase Activity
3.4. Screening Telomerase Inhibitors in Living Cells
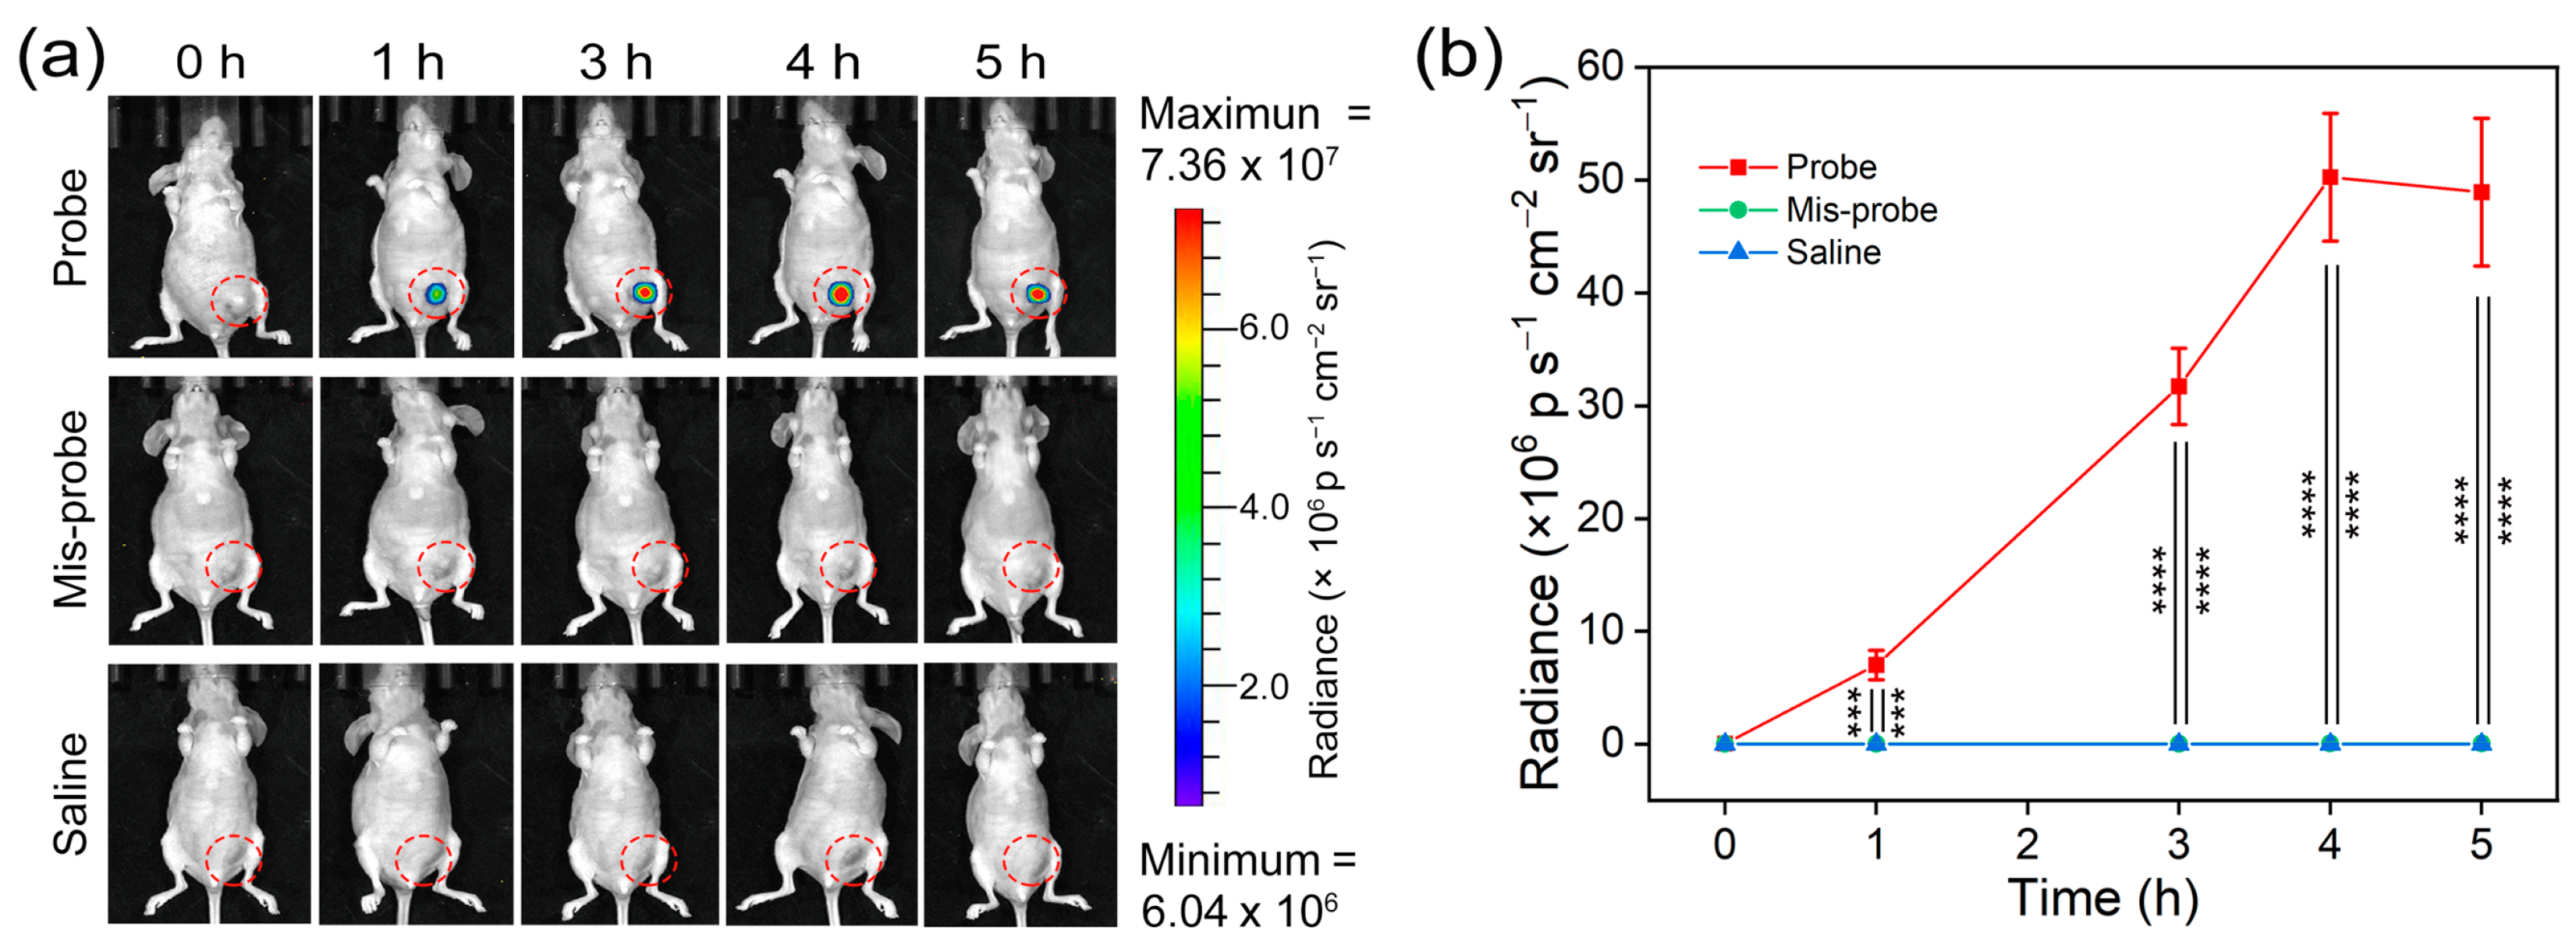
3.5. In Vivo Imaging of Telomerase Activity
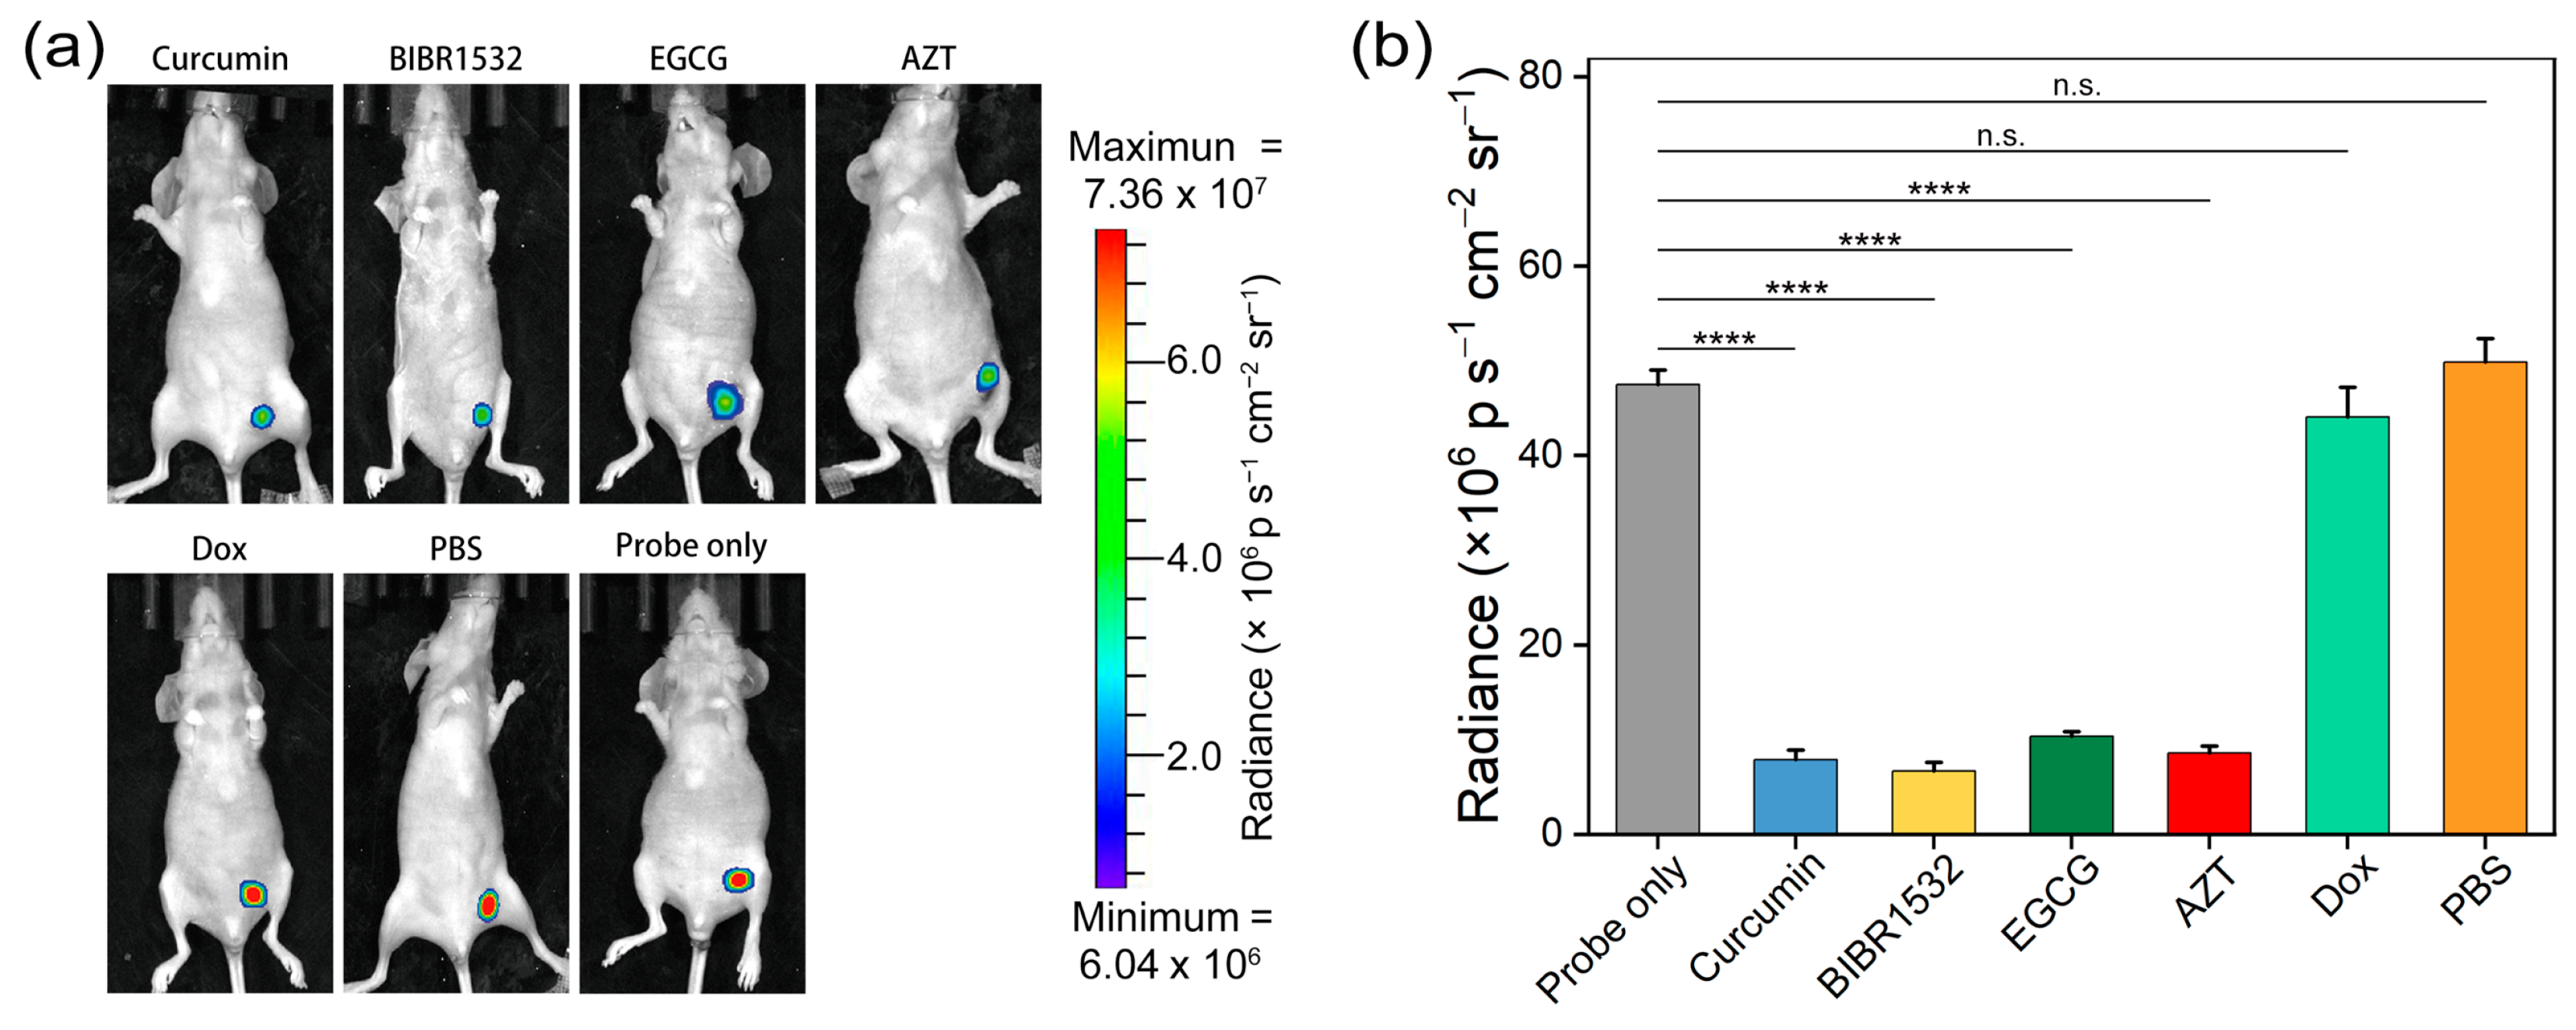
3.6. Telomerase Inhibitor Screening In Vivo
4. Conclusions
Supplementary Materials
Author Contributions
Funding
Institutional Review Board Statement
Informed Consent Statement
Data Availability Statement
Conflicts of Interest
References
- Ghanim, G.E.; Fountain, A.J.; van Roon, A.-M.M.; Rangan, R.; Das, R.; Collins, K.; Nguyen, T.H.D. Structure of human telomerase holoenzyme with bound telomeric DNA. Nature 2021, 593, 449–453. [Google Scholar] [CrossRef] [PubMed]
- Roake, C.M.; Artandi, S.E. Regulation of human telomerase in homeostasis and disease. Nat. Rev. Mol. Cell Biol. 2020, 21, 384–397. [Google Scholar] [CrossRef] [PubMed]
- Soria, J.-C.; Gauthier, L.R.; Raymond, E.; Granotier, C.; Morat, L.; Armand, J.-P.; Boussin, F.o.D.; Sabatier, L. Molecular Detection of Telomerase-positive Circulating Epithelial Cells in Metastatic Breast Cancer Patients. Clin. Cancer Res. 1999, 5, 971–975. [Google Scholar]
- Guterres, A.N.; Villanueva, J. Targeting telomerase for cancer therapy. Oncogene 2020, 39, 5811–5824. [Google Scholar] [CrossRef] [PubMed]
- Harley, C.B. Telomerase and cancer therapeutics. Nat. Rev. Cancer 2008, 8, 167–179. [Google Scholar] [CrossRef]
- Dai, J.; Liu, Z.; Wang, L.; Huang, G.; Song, S.; Chen, C.; Wu, T.; Xu, X.; Hao, C.; Bian, Y.; et al. A Telomerase-Activated Magnetic Resonance Imaging Probe for Consecutively Monitoring Tumor Growth Kinetics and In Situ Screening Inhibitors. J. Am. Chem. Soc. 2023, 145, 1108–1117. [Google Scholar] [CrossRef] [PubMed]
- Krupp, G.; Kühne, K.; Tamm, S.; Klapper, W.; Heidorn, K.; Rott, A.; Parwaresch, R. Molecular basis of artifacts in the detection of telomerase activity and a modified primer for a more robust ‘TRAP’ assay. Nucleic Acids Res. 1997, 25, 919–921. [Google Scholar] [CrossRef] [PubMed] [Green Version]
- Herbert, B.-S.; Hochreiter, A.E.; Wright, W.E.; Shay, J.W. Nonradioactive detection of telomerase activity using the telomeric repeat amplification protocol. Nat. Protoc. 2006, 1, 1583–1590. [Google Scholar] [CrossRef]
- Wu, L.; Wang, J.; Ren, J.; Qu, X. Ultrasensitive Telomerase Activity Detection in Circulating Tumor Cells Based on DNA Metallization and Sharp Solid-State Electrochemical Techniques. Adv. Funct. Mater. 2014, 24, 2727–2733. [Google Scholar] [CrossRef]
- Ling, P.; Lei, J.; Ju, H. Nanoscaled Porphyrinic Metal–Organic Frameworks for Electrochemical Detection of Telomerase Activity via Telomerase Triggered Conformation Switch. Anal. Chem. 2016, 88, 10680–10686. [Google Scholar] [CrossRef]
- Zheng, G.; Daniel, W.L.; Mirkin, C.A. A New Approach to Amplified Telomerase Detection with Polyvalent Oligonucleotide Nanoparticle Conjugates. J. Am. Chem. Soc. 2008, 130, 9644–9645. [Google Scholar] [CrossRef] [PubMed]
- Hong, M.; Xu, L.; Xue, Q.; Li, L.; Tang, B. Fluorescence Imaging of Intracellular Telomerase Activity Using Enzyme-Free Signal Amplification. Anal. Chem. 2016, 88, 12177–12182. [Google Scholar] [CrossRef]
- Ma, W.; Fu, P.; Sun, M.; Xu, L.; Kuang, H.; Xu, C. Dual Quantification of MicroRNAs and Telomerase in Living Cells. J. Am. Chem. Soc. 2017, 139, 11752–11759. [Google Scholar] [CrossRef] [PubMed]
- Wang, W.; Huang, S.; Li, J.; Rui, K.; Bi, S.; Zhang, J.-R.; Zhu, J.-J. Evaluation of intracellular telomerase activity through cascade DNA logic gates. Chem. Sci. 2017, 8, 174–180. [Google Scholar] [CrossRef] [PubMed] [Green Version]
- Liu, Z.; Zhao, J.; Zhang, R.; Han, G.; Zhang, C.; Liu, B.; Zhang, Z.; Han, M.-Y.; Gao, X. Cross-Platform Cancer Cell Identification Using Telomerase-Specific Spherical Nucleic Acids. ACS Nano 2018, 12, 3629–3637. [Google Scholar] [CrossRef] [PubMed]
- Ran, X.; Wang, Z.; Pu, F.; Ju, E.; Ren, J.; Qu, X. Nucleic acid-driven aggregation-induced emission of Au nanoclusters for visualizing telomerase activity in living cells and in vivo. Mater. Horiz. 2021, 8, 1769–1775. [Google Scholar] [CrossRef]
- Frangioni, J.V. In vivo near-infrared fluorescence imaging. Curr. Opin. Chem. Biol. 2003, 7, 626–634. [Google Scholar] [CrossRef]
- Liang, H.; Hong, Z.; Li, S.; Song, X.; Zhang, D.; Chen, Q.; Li, J.; Yang, H. An Activatable X-Ray Scintillating Luminescent Nanoprobe for Early Diagnosis and Progression Monitoring of Thrombosis in Live Rat. Adv. Funct. Mater. 2021, 31, 2006353. [Google Scholar] [CrossRef]
- Chen, X.; Song, J.; Chen, X.; Yang, H. X-ray-activated nanosystems for theranostic applications. Chem. Soc. Rev. 2019, 48, 3073–3101. [Google Scholar] [CrossRef]
- Pei, P.; Chen, Y.; Sun, C.; Fan, Y.; Yang, Y.; Liu, X.; Lu, L.; Zhao, M.; Zhang, H.; Zhao, D.; et al. X-ray-activated persistent luminescence nanomaterials for NIR-II imaging. Nat. Nanotechnol. 2021, 16, 1011–1018. [Google Scholar] [CrossRef] [PubMed]
- Hong, Z.; Chen, Z.; Chen, Q.; Yang, H. Advancing X-ray Luminescence for Imaging, Biosensing, and Theragnostics. Acc. Chem. Res. 2023, 56, 37–51. [Google Scholar] [CrossRef]
- Chen, Z.; Tsytsarev, V.; Finfrock, Y.Z.; Antipova, O.A.; Cai, Z.; Arakawa, H.; Lischka, F.W.; Hooks, B.M.; Wilton, R.; Wang, D.; et al. Wireless Optogenetic Modulation of Cortical Neurons Enabled by Radioluminescent Nanoparticles. ACS Nano 2021, 15, 5201–5208. [Google Scholar] [CrossRef]
- Ou, X.; Qin, X.; Huang, B.; Zan, J.; Wu, Q.; Hong, Z.; Xie, L.; Bian, H.; Yi, Z.; Chen, X.; et al. High-resolution X-ray luminescence extension imaging. Nature 2021, 590, 410–415. [Google Scholar] [CrossRef]
- Huang, J.; Zhu, L.; Ju, H.; Lei, J. Telomerase Triggered DNA Walker with a Superhairpin Structure for Human Telomerase Activity Sensing. Anal. Chem. 2019, 91, 6981–6985. [Google Scholar] [CrossRef] [PubMed] [Green Version]
- Wang, J.; Wu, L.; Ren, J.; Qu, X. Visual detection of telomerase activity with a tunable dynamic range by using a gold nanoparticle probe-based hybridization protection strategy. Nanoscale 2014, 6, 1661–1666. [Google Scholar] [CrossRef] [PubMed]
- Li, C.H.; Lv, W.Y.; Yan, Y.; Yang, F.F.; Zhen, S.J.; Huang, C.Z. Nucleolin-Targeted DNA Nanotube for Precise Cancer Therapy through Förster Resonance Energy Transfer-Indicated Telomerase Responsiveness. Anal. Chem. 2021, 93, 3526–3534. [Google Scholar] [CrossRef] [PubMed]
- Lin, Y.; Huang, Y.; Yang, Y.; Jiang, L.; Xing, C.; Li, J.; Lu, C.; Yang, H. Functional Self-Assembled DNA Nanohydrogels for Specific Telomerase Activity Imaging and Telomerase-Activated Antitumor Gene Therapy. Anal. Chem. 2020, 92, 15179–15186. [Google Scholar] [CrossRef]
- Verjans, E.-T.; Doijen, J.; Luyten, W.; Landuyt, B.; Schoofs, L. Three-dimensional cell culture models for anticancer drug screening: Worth the effort? J. Cell. Physiol. 2018, 233, 2993–3003. [Google Scholar] [CrossRef]
- Ruparel, S.B.; Siddiqa, A.; Marciniak, R.A. Targeting Telomerase for Cancer Therapy. Curr. Cancer Ther. Rev. 2011, 7, 215–226. [Google Scholar] [CrossRef]
- Negrini, S.; De Palma, R.; Filaci, G. Anti-Cancer Immunotherapies Targeting Telomerase. Cancers 2020, 12, 2260. [Google Scholar] [CrossRef]
- Rha, S.Y.; Izbicka, E.; Lawrence, R.; Davidson, K.; Sun, D.; Moyer, M.P.; Roodman, G.D.; Hurley, L.; Von Hoff, D. Effect of Telomere and Telomerase Interactive Agents on Human Tumor and Normal Cell Lines1. Clin. Cancer Res. 2000, 6, 987–993. [Google Scholar] [PubMed]
- Mittal, A.; Pate, M.S.; Wylie, R.C.; Tollefsbol, T.O.; Katiyar, S.K. EGCG down-regulates telomerase in human breast carcinoma MCF-7 cells, leading to suppression of cell viability and induction of apoptosis. Int. J. Oncol. 2004, 24, 703–710. [Google Scholar] [CrossRef] [PubMed]
- Ramachandran, C.; Fonseca, H.B.; Jhabvala, P.; Escalon, E.A.; Melnick, S.J. Curcumin inhibits telomerase activity through human telomerase reverse transcritpase in MCF-7 breast cancer cell line. Cancer Lett. 2002, 184, 1–6. [Google Scholar] [CrossRef] [PubMed]
- Pascolo, E.; Wenz, C.; Lingner, J.; Hauel, N.; Priepke, H.; Kauffmann, I.; Garin-Chesa, P.; Rettig, W.J.; Damm, K.; Schnapp, A. Mechanism of Human Telomerase Inhibition by BIBR1532, a Synthetic, Non-nucleosidic Drug Candidate*. J. Biol. Chem. 2002, 277, 15566–15572. [Google Scholar] [CrossRef] [PubMed] [Green Version]
- Barbosa, M.A.G.; Xavier, C.P.R.; Pereira, R.F.; Petrikaitė, V.; Vasconcelos, M.H. 3D Cell Culture Models as Recapitulators of the Tumor Microenvironment for the Screening of Anti-Cancer Drugs. Cancers 2022, 14, 190. [Google Scholar] [CrossRef]
- Giacomotto, J.; Ségalat, L. High-throughput screening and small animal models, where are we? Br. J. Pharmacol. 2010, 160, 204–216. [Google Scholar] [CrossRef] [Green Version]
- HogenEsch, H.; Nikitin, A.Y. Challenges in pre-clinical testing of anti-cancer drugs in cell culture and in animal models. J. Control. Release 2012, 164, 183–186. [Google Scholar] [CrossRef] [Green Version]
- Debnath, A. Drug discovery for primary amebic meningoencephalitis: From screen to identification of leads. Expert Rev. Anti. Infect. Ther. 2021, 19, 1099–1106. [Google Scholar] [CrossRef]


Disclaimer/Publisher’s Note: The statements, opinions and data contained in all publications are solely those of the individual author(s) and contributor(s) and not of MDPI and/or the editor(s). MDPI and/or the editor(s) disclaim responsibility for any injury to people or property resulting from any ideas, methods, instructions or products referred to in the content. |
© 2023 by the authors. Licensee MDPI, Basel, Switzerland. This article is an open access article distributed under the terms and conditions of the Creative Commons Attribution (CC BY) license (https://creativecommons.org/licenses/by/4.0/).
Share and Cite
Chen, B.; Dai, J.; Song, S.; Tang, X.; Guo, Y.; Wu, T.; Wu, M.; Hao, C.; Cheng, X.; Lin, X.; et al. An Activatable Nanoscintillator Probe for Detecting Telomerase Activity and Screening Inhibitors In Vivo. Targets 2023, 1, 34-47. https://doi.org/10.3390/targets1010004
Chen B, Dai J, Song S, Tang X, Guo Y, Wu T, Wu M, Hao C, Cheng X, Lin X, et al. An Activatable Nanoscintillator Probe for Detecting Telomerase Activity and Screening Inhibitors In Vivo. Targets. 2023; 1(1):34-47. https://doi.org/10.3390/targets1010004
Chicago/Turabian StyleChen, Baoliu, Junduan Dai, Sijie Song, Xianzhe Tang, Yuheng Guo, Ting Wu, Mengnan Wu, Chaojie Hao, Xiaofeng Cheng, Xucong Lin, and et al. 2023. "An Activatable Nanoscintillator Probe for Detecting Telomerase Activity and Screening Inhibitors In Vivo" Targets 1, no. 1: 34-47. https://doi.org/10.3390/targets1010004