Article

The Economic Value of Natural Resources and Its Implications for Pakistan’s Economic Growth

1
Department of Economics, The University of Haripur, Haripur 22063, Pakistan
2
Faculty of Business, The University of Wollongong in Dubai, Dubai 20183, United Arab Emirates
3
Department of Management Sciences, COMSATS University Islamabad, Abbottabad Campus, Abbottabad 22060, Pakistan
*
Author to whom correspondence should be addressed.
Commodities 2022, 1(2), 65-97; https://doi.org/10.3390/commodities1020006
Submission received: 13 September 2022 / Revised: 15 October 2022 / Accepted: 18 October 2022 / Published: 27 October 2022

Abstract

:
Natural resources and ecological services provide the foundation for manufactured capital, increasing public financing and decreasing inequality by diversifying the economy. The exploitation of natural resources is frequently the backbone of economic stability in developing and middle-income nations. As a result of their importance, natural resources need vigilant and long-term management. Recent research has tested two hypotheses, the natural resource blessing hypothesis and the natural resource curse hypothesis, on the impact of a country’s natural resources on its economy. This research is an essential contribution to the growing body of work that attempts to quantify natural resource endowments’ role in national economic growth. Investigations focus on Pakistan and span the years 1975 through 2020. Robust Least Square (RLS) estimations show that coal rents, energy use, inbound FDI, and oil rents contribute to a country’s economic growth. While consumption of renewable energy sources and industrial value-added have a detrimental effect. Natural resources, foreign direct investment, energy consumption, and industrial ecology are predicted to significantly impact economic growth during the next decade, according to the Impulse Response Function (IRF) and the Variance Decomposition Analysis (VDA). The findings may provide helpful information for academic and governmental institutions to develop natural resource management policies for sustainable development.

1. Introduction

The term “natural resources” refers to everything that assists humans in their daily lives and derives directly from the natural environment in which they find themselves. There is nothing that human beings need that cannot be derived from the planet itself [1]. Natural resources are whatever nature provides for human use. The Earth itself produces natural resources as a result of natural processes, and these resources may be beneficial to people in a variety of ways. Every object in its most basic form, such as soil or water, is considered a natural resource. In addition, all the elements that people use to produce energy, such as coal and gas, are also considered natural resources. Using these resources, in either their raw or processed forms, satisfies the fundamental prerequisites for human existence [2]. There are various types of natural resources, such as the food we consume to satiate our hunger, the fuel that we use for transportation and the creation of heat, and the raw materials that are further processed and changed into manufacturing a variety of goods. Everything that may be eaten originates from either plants or animals, regardless of whether it is vegan, non-vegan, or dairy. Coal, natural gas, and oils are all natural resources and are the sources of heat, light, and power used in our daily lives. We use heat to keep ourselves warm and to prepare the food that we eat. We use light to perform our daily activities at any time of the day. Moreover, the power we need to run various machinery comes from these resources [3]. The whole operation results in the creation of various goods for human consumption. Another possibility is using high-powered technology such as automobiles, televisions, computers, and freezers. Every raw element that goes into these goods originates from various natural resources [4].
Two primary classifications may be applied to natural resources. They may be renewable, or they may not be renewable at all. Renewable natural resources are, as their name implies, those resources that are generated on their own for a while. This process takes place over some time. No matter how much or how often they are utilized, non-renewable natural resources will never run out. There is no limit to their availability. After that, renewable resources may be classified further as either alive or non-living [5]. The forest is the most prominent example of a natural resource that may be renewed. Wind, water, and solar energy are non-living natural resources that may be replenished over time. Energy, which may come from various sources, is one of the fundamental requirements placed on humans today [6]. The continuing availability of energy resources is the most fundamental challenge that people confront since there are not enough of them to go around. Because the majority of the instruments required to ensure the life of the human race require energy to work, the demand for energy resources among humans is almost limitless. Therefore, we must acquire a supply that is almost limitless in order to satisfy our limitless needs. Energy cannot be avoided since it is required in daily activities such as cooking, heating, electricity, and driving a vehicle. Therefore, to have limitless utilization, we need an endless supply, which in turn would need resources that never run out, and there are resources like this that may never run out [7]. The term “renewable energy resources” refers to these different types of resources. Utilizing alternative or renewable sources of power comes with a few advantages. One of the key advantages of employing these energy resources is creating harmless energy. The generation of this kind of energy results in almost no pollution and a minimal amount of carbon emission. This would reduce the release of greenhouse gases, and the effects of climate change may not be as severe as they would be with coal or gasoline [8]. Some naturally occurring resources replenished throughout time are wood, animals, water, sunshine, and air currents. Trees can develop from seeds, and their growth is ongoing. If one tree were to pass away, another might be planted in its place; hence, there would never be a shortage of trees. In a similar vein, the death of one animal may result in the birth of a new newborn animal that can be raised and used for human purposes. Air, water, sunshine, and wind are the four gifts that will never run out, no matter how much we use them. This is true regardless of how much we utilize them. They are always being switched out for new ones. Additionally, they are accessible to all human beings in the same proportion; hence, using one individual will not reduce the availability of these resources for other individuals. It does not take an excessive amount of time to refill a renewable resource. Within the lifetime of a human person, it is possible to see a renewable resource being replenished with new growth. In addition to renewable natural resources, there is also a category of natural resources known as non-renewable natural resources [9]. The word “non-renewable natural resources” tells what we need to know about these resources. They are the resources that can only be utilized once before they are exhausted. As soon as we put them to use from a certain location, we would no longer be able to utilize them again from that location. The demand for non-renewable resources may be infinite, but supply may only meet demand up to a certain point because of their finite supply. Non-renewable resources do not have a continuous supply for an endless amount of time. It is possible to categorize non-renewable resources into four distinct groups further. The first is petroleum, the second is natural gas, the third is coal, and the fourth and most modern energy source is nuclear. The first three are referred to as fossil fuels, which is a broader word. Coal, oil, and natural gas are the three forms that fall within this category. The recovered and used components of dead plants and animals buried under the Earth’s surface for millions of years are energy resources [10]. The term “fossil fuel” is the one that is used to describe these dead parts of the Earth. A significant portion of the non-renewable resources comprises carbon material that has been heated and converted into various forms, such as oil or natural gases. Mining is another method that may be used to obtain non-renewable natural resources such as minerals and solids from deep below the planet’s surface. These minerals and solid metals are created using processes analogous to those used in forming fossil fuels. Gold, silver, copper, and iron are a few examples of metals that fall under this category [11]. In today’s society, it is of the utmost necessity to work toward discovering effective strategies for extracting and using natural resources that do not replenish themselves as quickly as they are used up. Our requirements remain unchanging, and in some situations, they are even growing, despite our resources running out. The transition to using renewable energy sources is essential since the global population is steadily growing, and a larger population equates to a less healthy environment, which, in turn, poses a greater risk of death to the people who inhabit the planet. It is essential not just for the current generation but also for all generations that will come after it to keep the environment clean and free of pollution [12].
On the surface, it can be said that countries with a large number of natural resources would show more economic growth when compared to countries with either no natural resources or very few natural resources; however, this is not always the case. Countries with few natural resources tend to have slower economic growth. Countries with a deficient number of natural resources typically have better economic performance than countries with a high number of natural resources. This may be due to the absence of specific adverse side effects, such as corruption, inefficient use of resources, or simply unequal distribution of resources. The term for this predicament is the natural resource curse [13]. Even if there is no factual basis for the data supporting the natural resource curse phenomenon, the phenomenon’s existence cannot be denied. The natural resource curse concept does have some basis in reality, as shown by the results of a cursory investigation of nations with high percentages of GDP and the percentages of natural resources held by such countries. Having a large number of natural resources does not automatically translate to rapid economic expansion; this can be shown by looking at nations that are abundant in natural resources. Countries such as Nigeria, Mexico, and Venezuela, as well as the oil states in the Gulf region, are abundant in natural resources; however, this wealth in natural resources has not been translated into economic growth in these countries. Even while natural resources are a valuable source of cash for nations, there are times when such resources are exploited for purposes other than the welfare and well-being of humans. Instead, some individuals use natural resources for their self-serving purposes [14].
Natural resources of every conceivable type are found in abundance throughout the whole of Pakistan. Pakistan has everything going for it, from the riches in the depths of the soil to the perfect location of the nation on the map of the globe. Because of its position, Pakistan has a geographical advantage that offers it the potential to become a regional hub for international commerce with the nations around it. The fact that Pakistan is endowed with enormous resources provides another reason for nations all over the world to cultivate diplomatic ties with Pakistan to obtainaccess to these riches. The growth and development of Pakistan’s economy primarily rely on the country’s natural resources. Both the raw materials and the finished products of the many transformations of these resources are put to use in various ways [15]. Pakistan’s geographic position places it between two significant parts of Asia and the Middle East. Pakistan may be considered to be a part of both Central Asia and South Asia. Pakistan, with its many ports, is not only geographically near to nations in the Middle East but also to the whole Gulf area. A natural advantage that Pakistan has is both its position and the ground that it sits on. In addition to its other natural resources, Pakistan has a sizable stockpile of natural gas that has been there since the beginning of time and is unaffected by human activity. Limestone, a handful of salt mines, iron ore, copper, and coal are among the few other natural resources available (which are not of high quality but have great importance) [16]. Pakistan’s salt mine is the second biggest globally, and its coal resources are also the second largest. Gold is one of the most precious resources in the entire world, and Pakistan ranks fifth in terms of the country’s greatest gold resources. Copper is one of Pakistan’s most abundant natural resources, and the country ranks seventh in the world in terms of its amount [17].
The world as we know it today needs to make the transition to the consumption of energy that comes from renewable sources so that the environment in which we live can improve. Pakistan also has a significant fraction of renewable energy resources. There are primarily four categories that may be used to classify Pakistan’s renewable resources. These four types of energy include wind energy, solar energy, hydro energy, and biomass energy. Since the country’s creation, Pakistan has been struggling with an energy problem, which, rather than getting better, is becoming worse as the country’s population continues to expand. Wind, sunshine, water, and biomass, which are all examples of renewable resources, have the potential to provide a solution to our energy challenges that will last forever [18]. Solar energy is the resource that has garnered the most attention and importance as of late, even though all of these other resources are significant in their own right. Over the most recent few years, Pakistan’s solar industry has seen significant growth. Various technologies that are powered by sunlight are now being made available for personal use in residential settings. Some of these gadgets include water heaters powered by the sun, water pumping machines that rely on sunlight as their primary energy source, and light bulbs and other electronic devices that can charge themselves using the sun’s rays. They are forced to create their arrangements since they cannot be provided with modern technology, and because they have no other option, they rely on biomass sources to live their life because they have no other choice [19]. The majority of the population of Pakistan lives in rural regions. Energy production from biomass is a relatively new technology; therefore, the nation employs old techniques of steam power plants for electricity generation. Both the technique of fermentation and the technology of gasifying biomass has not yet been implemented in the nation. Sugar production is the sector that makes the most use of biomass as a source of fuel for electricity generation. Each sugar factory is equipped with at least one biomass boiler that may be used to produce electrical power. The only option for the nation to get out of its power dilemma, which encompasses both the generation of electricity and the protection of power resources, is for the government to invest more and more in the power sector and to make fundamental changes in the way that things function in the power sector [20].
Even if a non-renewable resource is available in the natural world for human use, the most effective way to put such a resource to work is to make the most of its limited supply. After depleting a resource, it would not be possible to produce more of that resource for at least millions of years. It isdifficult for humans to keep up with the time required for a non-renewable resource to develop again. It could take many generations before a non-renewable resource is again suitable for human consumption. The most notable examples of resources that do not replenish themselves naturally are fossil fuels. Humans generate most of the world’s energy via the combustion of fossil fuels. Coal, oil, and natural gas are the primary forms of fossil fuels used to create electrical power [21]. Pakistan may have a lot of natural resources, but there is not a sufficient amount of oil, which is the resource that is often used for the production of energy. In order to meet the majority of its demand for oil, gasoline, and other petroleum products, Pakistan is forced to rely on imports from other nations. In absolute terms, Pakistan fulfils more than eighty percent of its annual oil demand via purchases made in foreign markets [22]. Natural gas is another vital non-renewable resource that is used in the generation of energy. However, even this resource does not exist in sufficient quantities in Pakistan. The one resource that Pakistan has an excess of is coal reserves; however, they are not given any priority to develop them further so that they may be utilized for power production. This is a miserable situation [23].
It is not enough for a country to have access to a wealth of natural resources for its economy to thrive. The authorities need to find a productive use for these resources and allocate them accordingly. If the resources that are already available in a nation are not being put to good use, then the economy of that country cannot possibly thrive. Any kind of natural resource, whether it is minerals, solar power, water, or forests, plays a significant part in developing a nation’s economy. This is true regardless of the type of natural resource [6]. A country’s natural resources are not the only factor in determining its level of development. Access to natural resources is precious, but that cannot be considered the only factor determining success. Natural resources that are found within a country’s borders are used effectively and efficiently. In that case, that nation will almost certainly be able to make social and economic progress. Natural resources, on the whole, have a favourable impact on the expansion and development of a nation, both on the economic and social fronts [24].
Based on this significant discussion, the study’s main research objective is to assess the impact of oil and coal resource rents on Pakistan’s economic development, which is helpful to substantiate either the resource curse hypothesis or the resource blessing hypothesis. Further, the study assessed the role of renewable and non-renewable energy demand on the country’s economic growth. Green energy sources remain needed to move towards sustainable development. The importance of inbound FDI and industrialization in the country’s economic development remains evident; hence, they are analysed in the study for financial development. Finally, the study forecasts the relationship between natural resource factors and economic growth over time.
The stated objectives would be accessed through sophisticated statistical techniques to reach some decisive solutions to manage natural resource market for sustainable economic development. The study is organized as follows: following an introduction, a review of the relevant literature is provided in Section 2. Methods and materials are detailed in Section 3. The findings and analysis are reported in Section 4 and Section 5, respectively. The final section concludes the study.

2. Literature Review

The literature is sub-divided into three different themes:
(i)
natural resources and economic growth,
(ii)
renewable energy and economic growth, and
(iii)
overseas investment, industrialization, and economic growth.
The segmentation of the literature study outlined here facilitates an in-depth analysis of the many elements that impacted resource commodity markets all over the globe.

2.1. The Role of Natural Resources in Fueling Economic Development

The market for natural resource commodities is regarded as a valuable resource market since it serves as a basis for the nation’s economic growth and industrial development. The commodities market supplies the industry with inputs from raw materials. With the assistance of technical innovation, these inputs are turned into a finished product, which contributes to obtaining revenue from exports. The abundance of research that has been conducted on the subject at hand needs to be constrained in its findings by determining how the role of resource commodities in combination with environmentally friendly energy sources, inbound FDI, and industrial value-added affects economic development. Iqbal et al. [25] researched the relationship between renewable energy production, the use of natural resources, economic growth, and carbon emissions in Pakistan. The results show that increasing the output of renewable energy positively affects carbon emissions, whilst limiting the amount of such energy negatively affects carbon emissions. The study concludes that Pakistan’s government must encourage domestic and international businesses to generate renewable energy. The study was conducted by Koondhar et al. [26,27] to evaluate the relationship between renewable energy, carbon emissions, forestry, and agriculture production in China by using data from 1998 to 2018. The results show that a decrease in carbon emissions leads to an increase in the area covered by forests and that the level of carbon emissions negatively correlates with the amount of renewable energy used. According to the research findings, decreasing our reliance on non-renewable sources of energy and transitioning from those sources to renewable ones are both necessary steps toward achieving a climate free of carbon emissions. Through mathematical estimation, Muhammad et al. [27] were able to determine the relationship between inbound FDI, natural resources, consumption of renewable energy, and economic growth, as well as the effect that this relationship has on the deterioration of the environment. The generalized method of moments (GMM) was the mathematical methodology used in Russia, Brazil, India, China, and South Africa between 1991 and 2018. The findings indicate that the use of natural resources and the accompanying growth in GDP are the primary causes of environmental deterioration in the previously stated nations. The findings of this study conclude that the decision-makers in these nations promote the use of natural resources and green energy sources to improve ecological quality. From 1991 to 2018, Muhammad and Khan [28] investigated the existence of the pollution halo/haven hypothesis in various industrialized and developing nations. The research findings indicate that economic and social development are to blame for the phenomenon known as the pollution haven hypothesis existing in many nations. In the end, several policies are offered for maintaining a stable ecosystem and deriving one’s energy needs from renewable resources. The role that green development plays in promoting a sustainable environment was examined by Hao et al. [29], with a particular emphasis on carbon emissions. The period covered by the data is from 1991 to 2017 in the G7 nations. The employment of skilled and educated labour, taxes on environmental protection, and using renewable energy sources all contribute to a reduction in air pollution. According to the research findings, which are based on empirical data and theoretical considerations, green development may improve the quality of the environment in developing nations. Ali et al. [30] examined the link between the usage of renewable energy and the depletion of natural resources, as well as the effect that this has on the deterioration of the environment. This research takes a look at both developed and developing nations throughout the world. The years 1990 through 2014 are used to compile the data for this study. The findings of this research indicate that the use of energy derived from fossil fuels has a beneficial effect on the rate of environmental deterioration in emerging nations. On the other side, industrialized nations’ high usage of renewable energy sources has a detrimental effect on the deterioration of the natural environment. Both emerging and established nations are experiencing environmental deterioration due to economic expansion. The use of fossil fuels needs to be decreased, while consumption of renewable energy sources ought to be increased, which help to attain green developmental agenda worldwide. Ayobamiji et al. [31] focused on globalization, renewable energy, the rent of natural resources, economic growth, and CO2 emissions. Colombia is the focus of this investigation, and the years 1970 through 2017 serve as the time for the data collection. The results show that using renewable sources of energy makes a contribution that is beneficial to the quality of the environment. Carbon dioxide emissions are caused by natural resource rent, economic expansion, and, as a last factor, globalization, which improves knowledge about environmental harm while simultaneously increasing carbon dioxide emissions. The Colombian economy needs to prioritize renewable energy development and make related investments for sustained growth. Altinoz and Dogan [32] investigated how using renewable energy sources, and the availability of natural resources influenced the amount of carbon emissions produced. The information comes from research conducted in 82 different nations. Quantile regression is the approach that was used in this investigation. According to the findings, using renewable energy sources brings about a reduction in carbon emissions. In contrast, abundant natural resources negatively impact carbon emissions at lower quantiles but have a beneficial impact at medium and higher quantiles. In conclusion, the study examines several potential courses of action to resolve this outcome’s consequences. Aziz et al. [33] examined the effect that globalization, natural resources, and alternative forms of energy had on testing the Environment Kuznets Curve (EKC) in MINT nations from 1995 to 2018. The findings show that natural resources directly influence carbon emission at the lowest quantile; however, this influence shifts at the middle and higher quantiles when the resources are used to their fullest potential. Because fossil fuels are the primary energy production source, using renewable resources may reduce carbon emissions at lower quantiles but has no impact on emissions at higher quantiles. The standard of the environment is being degraded as a direct result of globalization. Policymakers make recommendations on how they may formulate policies that enhance the sustainable use of natural resources to produce clean energy. A relationship between financial development, industrial development, and the total reserve was shown by Dagar et al. [34,35], along with an explanation of the relevance this link has to the deterioration of the environment. The research uses data from 38 OECD nations between 1995 and 2019. The findings indicate that all of the factors chosen for the investigation, except for green energy, are detrimental to the environment. There are suggestions on the implications of policy for the betterment of the quality of the environment.
Based on the cited studies, the first hypothesis of the study is as follows:
Hypothesis 1 (H1):
Natural resource rents will likely improve a country’s economic development and verify the resource blessing hypothesis.

2.2. Economic Development and Alternative Energy Sources

Mehmood [35] provided an estimate of renewable energy’s impact on carbon emissions. This estimate considers various factors, including education, income, natural resources, and inbound FDI. This research used G11 economies for analysis from 1990 to 2019. The results show that carbon emissions are reduced by 0.49% with renewable energy and by 0.11% through education. Inbound FDI is responsible for 0.15% of the growth in carbon emissions, whereas natural resources are responsible for 0.09% of the increase. The study concludes that along with green energy sources, the human capital formation would be another policy option for the policymakers to improve environmental quality. Shao et al. [36] researched to evaluate the connection between advances in environmentally friendly technologies, renewable energy, and reduced carbon emissions in the N-11 countries from 1980 through 2018. According to the study’s findings, carbon emissions are affected negatively and significantly by the development of green technology and renewable energy sources. In the medium run, the development of environmentally friendly technologies does not have a significant impact on carbon emissions. In conclusion, actions are offered for the improvement of environmental conditions in order to stimulate green technology innovation and renewable energy. Khan et al. [37] investigated the relationship between economic development, access to energy, and carbon emissions, in addition to the impact of natural resources and the population growth in Pakistan from 1990 to 2015. The results show that rising carbon emissions are caused by various factors, including economic development, population expansion, and access to electricity; however, the influence of natural resources on carbon emissions is minor. The stringent ecological policies are desirable to move forward toward sustainability principles. Yu-Ke et al. [38] researched to explore the factors that lead to energy consumption, fluctuations in natural resource availability, and changes in the amount of carbon emissions. The G-20 nations are the source of information acquired; these statistics cover 1995 through 2018. The findings indicate that the consumption of natural resources and CO2 emissions have a complex relationship. Conventional energy sources increase carbon emissions in construction areas. The G-20 nations are recommended to coordinate with economic resource policies to manage environmental difficulties. Zhang et al. [15] investigated how natural resources, human capital, and economic development affected the amount of carbon emissions released into the atmosphere. The country of Pakistan is the focus of this investigation, and the data were gathered between 1985 and 2018. According to the results, economic growth positively correlates with carbon emissions, whereas human capital and natural resources negatively link with carbon emissions over the long term. The short-term association between carbon emissions, human capital and economic development is positive, but the relationship between carbon emissions and natural resources is negative. On the other hand, human capital and economic development positively link with ecological footprint both in the long and short term. However, natural resources have a negative link with the ecological footprint. The study argued that increasing people’s environmental consciousness helps minimize ecological footprints for sustainable production. Shen et al. [39] investigated the interconnected roles that natural resources rent, green investment, financial development, and energy consumption worked in lowering carbon emissions and achieving the objective of a clean environment. The information was collected from thirty provinces in China between 1995 and 2017. The results show a correlation between green investment and carbon emissions, whereas consumption of energy, rent of natural resources, and financial development positively influence carbon emissions. The proposals focus on the enactment of a national natural tax code, the encouragement of green investment, and the promotion of policies that are favourable to the environment. Ling et al. [40] determined the nature of the connection that exists between carbon emissions, globalization, financial development, and natural resources in China from 1980 to 2017. According to the results, both globalization and financial expansion have a favourable influence on carbon emissions, and the same can be said for the depletion of natural resources; these factors also positively impact carbon emissions. In conclusion, environmental scientists are strongly encouraged to devise long-term and sustainable strategies. Huang et al. [41] look at the long-term and short-term connections between urbanization, financial development, and the rent of natural resources in the USA from 1995 through 2015. The results show that long-term environmental damage is proportional to the degree of financial development, urbanization, and the rent extracted from natural resources. Immediate action is to be taken to protect the environment from excessive carbon emissions from climate financing, natural resource management, and controlled urbanization. Hussain et al. [42] investigated the relationship between urbanization and the use of non-renewable sources of energy in 54 African nations from the period of 1996 to 2019. The findings indicate a positive correlation between urbanization and carbon emissions. Further, the consumption of non-renewable energy sources contributes to increased pollution in the environment in countries. The EKC demonstrates that economic growth contributes to an increase in pollution for a brief period but does not contribute to an increase in pollution throughout a more extended period. Using renewable resources, practising sustainable urbanism, and producing and efficiently consuming energy would likely move towards sustainable paths. Ibrahim and Ajide [43] examined the effects of coal, gas, fuel, and exports on G-20 countries’ environments from 1990 to 2018. The results show that non-renewable energy sources and imports increase carbon emissions while exports lower them. The policy is developed to encourage sustainable exportable commodities and use green energy demands that help to mitigate carbon emissions. Fatima et al. [44] researched to evaluate how a higher income and renewable energy use affect the environment’s quality. The research also investigates whether or not there is a correlation between the two types of energy—renewable and non-renewable—and growing levels of carbon emissions. The study is centred on the top five emitting nations: China, the United States of America, India, and Russia. The findings show that having a higher income and non-renewable energy use increases environmental pollution while using renewable energy sources contributes to reducing environmental pollution. The research concludes that laws that prevent an increase in wealth from impacting the connection between renewable energy and carbon emission need to be enacted.
The importance of renewable and non-renewable energy use in economic production has some positive and negative outcomes associated with energy production. Thus, the study’s second and third research hypotheses are as follows:
Hypothesis 2 (H2):
High use of energy will likely negatively affect the country’s economic development.
Hypothesis 3 (H3):
A more significant increase in the share of renewable energy demand in the national energy grids will likely improve the country’s sustainable development agenda.

2.3. Foreign Investment, Industrialization, and Economic Development

Mahalik et al. [45] looked into primary and secondary education’s role in reducing carbon emissions in BRICS nations from 1990 to 2015. They also took into account several other factors, including the utilization of renewable and non-renewable energy sources, economic growth, urbanization, and globalization. The results show that primary education, non-renewable energy sources, economic progress, and globalization contribute to increased carbon emissions. On the other side, secondary education, urbanization, and the use of renewable energy all contribute to a reduction in carbon emissions, which in turn enhances the quality of the environment. The research findings suggest that policies should be enacted that encourage higher education, greener city-driven urbanization, and laws that help transition from non-renewable to renewable energy sources. All of these different activities have the potential to contribute to an improvement in the quality of the environment. Pata [46] researched how economic complexity, globalization, use of non-renewable energy, and consumption of renewable energy all influence the amount of carbon emissions and ecological footprint produced in the US from 1980 to 2016. The results indicate an inverted U-shaped EKC relationship between economic complexity and pollution, with globalization and the use of renewable energy to improve environmental quality and non-renewable energy to worsen it. The implementation of globalization and the use of alternative forms of energy may provide the United States with the opportunity to improve its environment. In order to study the linkages between energy, income, and the environment, Anwar et al. [47] determined the relationship between the usage of renewable and non-renewable sources of energy in ASEAN nations. The results reveal that using non-renewable sources increases carbon emissions, whilst utilizing renewable sources of energy results in a decrease in carbon emissions. Governments should encourage the production of renewable energy sources and include them in a national energy grid to minimize ecological harm. Adebayo et al. [48] examined how different types of energy and the COVID-19 scenario affect carbon emissions in the UK. The results show that an increase in renewable energy production may result in a reduction in carbon emissions. The shift toward non-renewable energy sources is the root cause of the rise in carbon emissions. COVID instances with a negative variation have lower levels of carbon emissions. Green energy sources help to attain healthcare sustainability in a country. Sahoo and Sahoo [49] investigated the relationship between the use of renewable and non-renewable sources of energy and the amount of carbon emissions in India from 1965 to 2018. The findings indicate that using renewable energy sources such as hydropower has a marginally positive impact on carbon emissions. In contrast, using nuclear power has a marginally negative impact on carbon emissions. The consumption of non-renewable sources has a sizeable effect on the amount of carbon emissions produced; hence, its need to culminate through stringent environmental policies. Usman et al. [10] investigated the impact of economic growth, various types of energy generation, and financial development on the ecological footprint in the top 15 emitting nations from 1970 to 2017. According to the findings, economic growth and using energy sources that do not replenish themselves hurt the environment, in contrast to the positive impact of renewable energy and open trade. Financial development and the use of both renewable and non-renewable energy sources benefit the economy’s expansion. In conclusion, several strategies for sustainable economic growth and reduced environmental impact are needed to be explored in future. Usman et al. [50] investigated the interplay between financial development, economic growth, the consumption of non-renewable and renewable energy sources, the openness of trade, and an organization’s environmental footprint. Twenty Asian countries contributed to the overall data set from 1990 to 2014. The findings show that economic growth and the use of non-renewable sources of energy both speed up the process of environmental deterioration. However, the consumption of renewable energy sources slows down the process. The recommendations to Asia come towards using green energy sources for sustained living. Zhang et al. [51] investigated the impact of remittances and inbound FDI on the environment, considering both the economy’s expansion and the development of renewable and non-renewable energy sources. The research is centred on the top 10 countries in terms of the amount of money sent there, and the data were collected from several sources between 1990 and 2018. According to the findings, remittance inflows, inbound FDI, and non-renewable energy all positively influence ecological footprint. In contrast, the consumption of renewable energy decreases the ecological footprint. The study concludes with several key sustainable policy recommendations for the countries that receive the most remittances. Khan et al. [52] examined the short and long-term implications that technical innovation, financing, and inbound FDI have on renewable energy, non-renewable energy, and carbon emissions. The “Belt and Road Initiative (BRI)” nations, all 69 of them, are the focal point of this study’s investigation. The data were collected between the years 2000 and 2014, inclusively. The results show that technological progress, economic growth, and direct investment from other countries negatively affect renewable energy. On the other hand, financial development has a positive and significant impact. The study’s findings culminate in a recommendation to invest money into developing new technologies.
A large body of knowledge is available on inbound FDI, industrial value added, and economic growth. However, mixed results were found; some favoured financial deepening and greater industrialization support economic growth, while few led this phenomenon to the pollution haven hypothesis [53,54,55]. Thus, based on conflicting results, the study’s final hypothesis was formed for investigation, i.e.
Hypothesis 4 (H4):
A more significant increase in inbound FDI and industrialization will likely support the country’s economic development in the wake of green energy infrastructure.
The novel contribution of the study is multifold: First, the study used oil and coal rents as consider a substitute factors of natural resource commodity market, which helps to improve economic development of the country. However, its adverse effects in the form of air pollution are largely visible in the earlier literature [56,57,58,59]. Hence, the study includes renewable energy demand in growth modelling to subside its adverse effect from economic growth. Second, the greater use of energy in industrial production increases the country’ economic growth, which helps them utilize natural resources as raw material in industrial production and would enable to obtain foreign reserves for the country. However, the earlier literature shows the concerns of ecological footprints and biowaste, leading the economic growth towards worsening due to compromising healthcare sustainability agenda [60,61,62,63]. In this regard, the study attracted more inbound FDI in cleaner production technologies to offset the adverse effects of industrial pollution, leading to improved economic development. Finally, an adjustment has to be made to the issue of outliers within the dataset in order to produce reliable and consistent estimates. As a result, the problem was solved by using the robust least squares regression method, which accommodates outliers via leverage modification and minimizing residual.
Considering the severity of the problems posed by resource depletion, environmental degradation, pollution havens, and unsustainable production and consumption, this study is crucial for accurately gauging the impact of natural resources, energy use, inbound FDI, and industrialization on Pakistan’s economic growth. The steps that will assist Pakistan in becoming a clean nation will be implemented.

3. Materials and Methods

The study used GDP per capita for Pakistan as a dependent variable of the study. At the same time, oil and coal rents are taken as substitute factors of natural resource commodity markets as independent variables. Moreover, energy use, renewable energy demand, inbound FDI, and industry value added also served as explanatory variables of the study. The variables selection based on the earlier studies worked on the stated area in different economic settings. For instance, Kanat et al. [3] used natural resources, including oil and gas rents, while Strielkowsk et al. [9] used renewable energy demand in economic and environmental modelling. Hassan et al. [17] used natural resources and economic growth to evaluate sustainable development, while Muhammad et al. [27] used inbound FDI, green energy, and natural capital in resource-constraint environments. The data are taken from World Bank [64] database from 1975 to 2020, and Table 1 shows the list of variables.
Any nation’s natural resources may be directly attributed to its rising standard of living and prosperity. The value of oil is an example of a natural resource that may significantly impact a country’s economic progress [65]. Increasing oil prices aid increases in energy price inflation in Pakistan on the global market. Oil was crucial for many early 2000s development projects. Coal and oil extraction has played a significant part in Pakistan’s efforts to reduce unemployment. The part measures the importance of energy to a nation it plays in its prosperity. In the current global economic system, the electricity industry is one of the essential pillars for a country’s overall development. Pakistan is in a severe crisis as it tries to meet its energy needs, which is the most critical factor in its economic decline [66]. Energy is one of the most critical indicators of a country’s level of development because of its direct impact on economic growth. There are two basic categories of energy generation: renewable and non-renewable. There are no adverse effects on human health or the environment from using renewable energy. Hence, the world is shifting toward them. Considering the global impacts of producing and using non-renewable energy, the Pakistani government must adopt stringent policies to encourage renewable energy and enforce laws to ensure their implementation. Investing in renewable energy generation is the only solution to the persistent lack of available energy. Consumption of non-renewable energy sources and GDP growth has a negative and statistically significant correlation. The need to switch to renewable energy sources is brought into sharp focus by this connection. This correlation may serve as a reference point for future policymakers and the government of Pakistan as they consider the importance of renewable energy and shape energy policy in the country [67]. Recently, wealthy nations have placed a premium on FDI. Slowly but surely, the organization has grown, and today both emerging and underdeveloped nations seek investment for their economies. Economies that do not engage in international trade put a premium on FDI since they have no other means of generating revenue. The nations receive foreign direct investment (FDI) gain in several ways. Some examples include improvements in technology, increases in human capital, and the spread of skills that increase the productivity of local workers. Pakistan must take action to boost incoming funds since history reveals a deteriorating trend that is bad for the economy. Foreign direct investment (FDI) relies on economic development, but the converse is invalid. FDI is a critical factor in national economic growth. Foreign Direct Investment, Human Capital, and Exports Are the Three Key Elements in Economic Growth. Since the start of the industrial age, nations have transitioned from agriculture to industry. Humans have significantly benefited from this change, as their standard of living has risen dramatically in a concise amount of time. However, this progress has come at the expense of the environment, and the repercussions of this deterioration seem permanent [68]. Pakistan’s economy pales in contrast to that of nations that have already completed the industrial revolution. Industrialization is the backbone of economic growth in countries such as the United Kingdom, the United States, Germany, France, Italy, Sweden, and Japan, as well as the relatively recent entrants South Korea and Taiwan. These nations are examples of how crucial industrialization is to economic development. Compared to other countries, Pakistan’s GDP per capita and industrial capacity are much lower than average. Pakistan is so far behind the world’s developed countries because of its lack of industrialization that it is hardly even noticeable. There have been no improvements to the industrial sector since 2006, and technology remains woefully behind that of competing countries. Prompt and effective action is required to improve the situation in the nation, encourage economic development, and bring about necessary structural improvements [69]. Some of the criteria for picking these variables are discussed above. This research seeks to assess the relative impact of the independent variables oil rent, coal rent, energy usage, renewable energy consumption, FDI, and the industrial sector in boosting GDP per capita in Pakistan. Predictions help us plan for the future.

3.1. Theory of Green Resources

Ecology looks at nature as its whole, not only at how people affect it. Ecological thinking is one of the most researched philosophies today because its adherents want to understand better how the natural world functions and how it might be improved. When people are preoccupied with meeting their demands, they often fail to consider the consequences for the natural world. This issue is addressed in ecological theories. By developing this line of thinking further, we arrive at the beginnings of what is now known as “green theory”. The idea that nature should be given the same rights as humans is essential to the principles of green philosophy. The green theory provides explanations for several issues, including what needs to be prioritized, who should priorities it, and how we might benefit from the natural world around us. Climate change, commonly known as global warming, is a subject that has captured the attention of almost everyone. The green theory is also necessary in international relations, the study of the globe, its politics, and the global order [70]. Green theory may be seen as a subfield of international relations. Green theory in international relations encompasses studying how different policies adopted by nations influence the environment and what various countries are doing to improve the environment. Sustainable or green growth is economic expansion with little or no adverse effects on the natural environment. If the goods produced can be readily substituted without harming the environment, if the technology chosen is pollution-free, and if the consumption of natural resources makes up a significant portion of a country’s GDP, then green development is possible [71].

3.1.1. Natural Resource Curse Theory

One would expect a nation with a greater abundance of natural resources to be more economically successful. While it would seem reasonable to assume that an increase in available natural resources would lead to an increase in the rate at which things might be manufactured, the reality is very different. In virtually every case, nations rich in natural resources also have the slowest economic development. The “Natural Resource Curse Hypothesis” is another term for this occurrence. The overwhelming body of evidence officially establishes the natural resource curse theory gathered from nations all over the globe [72]. The most significant number of people are without access to primary health care in the nations with the most God-given resources; the number of people living below the poverty line is staggering, and these individuals have no voice in the political climate of their country. There is an apparent irony in these people’s plights. Many factors, including the ruling class’s policies and governments, contribute to this occurrence. Many factors contribute to the natural resource curse theory, including the government’s incapacity to establish a reliable system of accountability, the lack of checks and balances for the government and the people, and the prevalence of corruption. The benefits of this newfound worldwide connectivity are not without cost; however, since the result is a process known as globalization. The natural resource curse concept has received support from globalization. The sub national resource curse theory looks at the unfavourable and favourable effects of natural resource wealth on the economy, government, and environment [73]. This is not an intractable issue, after all. Although getting there may be tedious and time-consuming, it is possible. What is needed are severe attempts and careful government and major corporations’ preparation. However, if resource-rich nations persist in their efforts, they will eventually be able to climb out of their rut. The paradox of abundance is another term for the natural resource curse concept, and its meaning is evident from the name [74].

3.1.2. Natural Resource Abundant Theory

The question of natural resource wealth and its effect on economic development is gaining traction globally. The participants, now split into two groups, continue their continuing debate. At first glance, an abundance of natural resources might be seen as a boon, but for others, it can be seen as a burden. A wealth of natural resources is frequently seen as a tool for fostering economic development. If a nation has abundant natural resources, its GDP may rise, and the economy may prosper. Observations made over many years lend credence to this theory [75]. Considering the previous 200 years of economic advancement, the anticipated outcomes are not wholly favourable to one side: natural resource abundance as a curse or gift. Natural resource-rich nations thrived economically before the industrial revolution because their economies were founded on agriculture and other natural resources, proving the blessing hypothesis. However, the second half of the twentieth century paints a pretty different image, one in which nations rich in natural resources struggle to thrive economically. The depletion of natural resources is sometimes blamed for the economy’s poor performance. A wealth of natural resources in a country with a weak economy is a paradox, as is the natural resource curse theory [76]. Although it may be difficult for the human mind to get its head around, research conducted over many years, notably since the 1980s, has shown that access to natural resources is just one of several drivers of economic growth. Since the story of natural resources and their effects on economic development is too complex to be quantified in simple and straight terms, estimates of their value to countries always provide a wide range of outcomes. The economy could or might not benefit from the discovery of natural resources. Because of the inherent unpredictability and uncertainty of natural resource availability, no definitive solution can ever be discovered, and nations can only guess what works for them [77].

3.2. Econometric Framework

3.2.1. Ordinary Least Squares (OLS) Regression to Detect Possible Outliers

A regression model may be severely skewed by outliers, which are extreme values that deviate from the mean or median of the data set. The data becameunusable due to outliers, which might be either extraordinarily high or extremely low in value. Outlier-tainted data are useless for drawing judgments. Using stability diagnostics, we search for anomalies in the data. In order to find any anomalies in the data, we execute stability diagnostics using influence statistics.

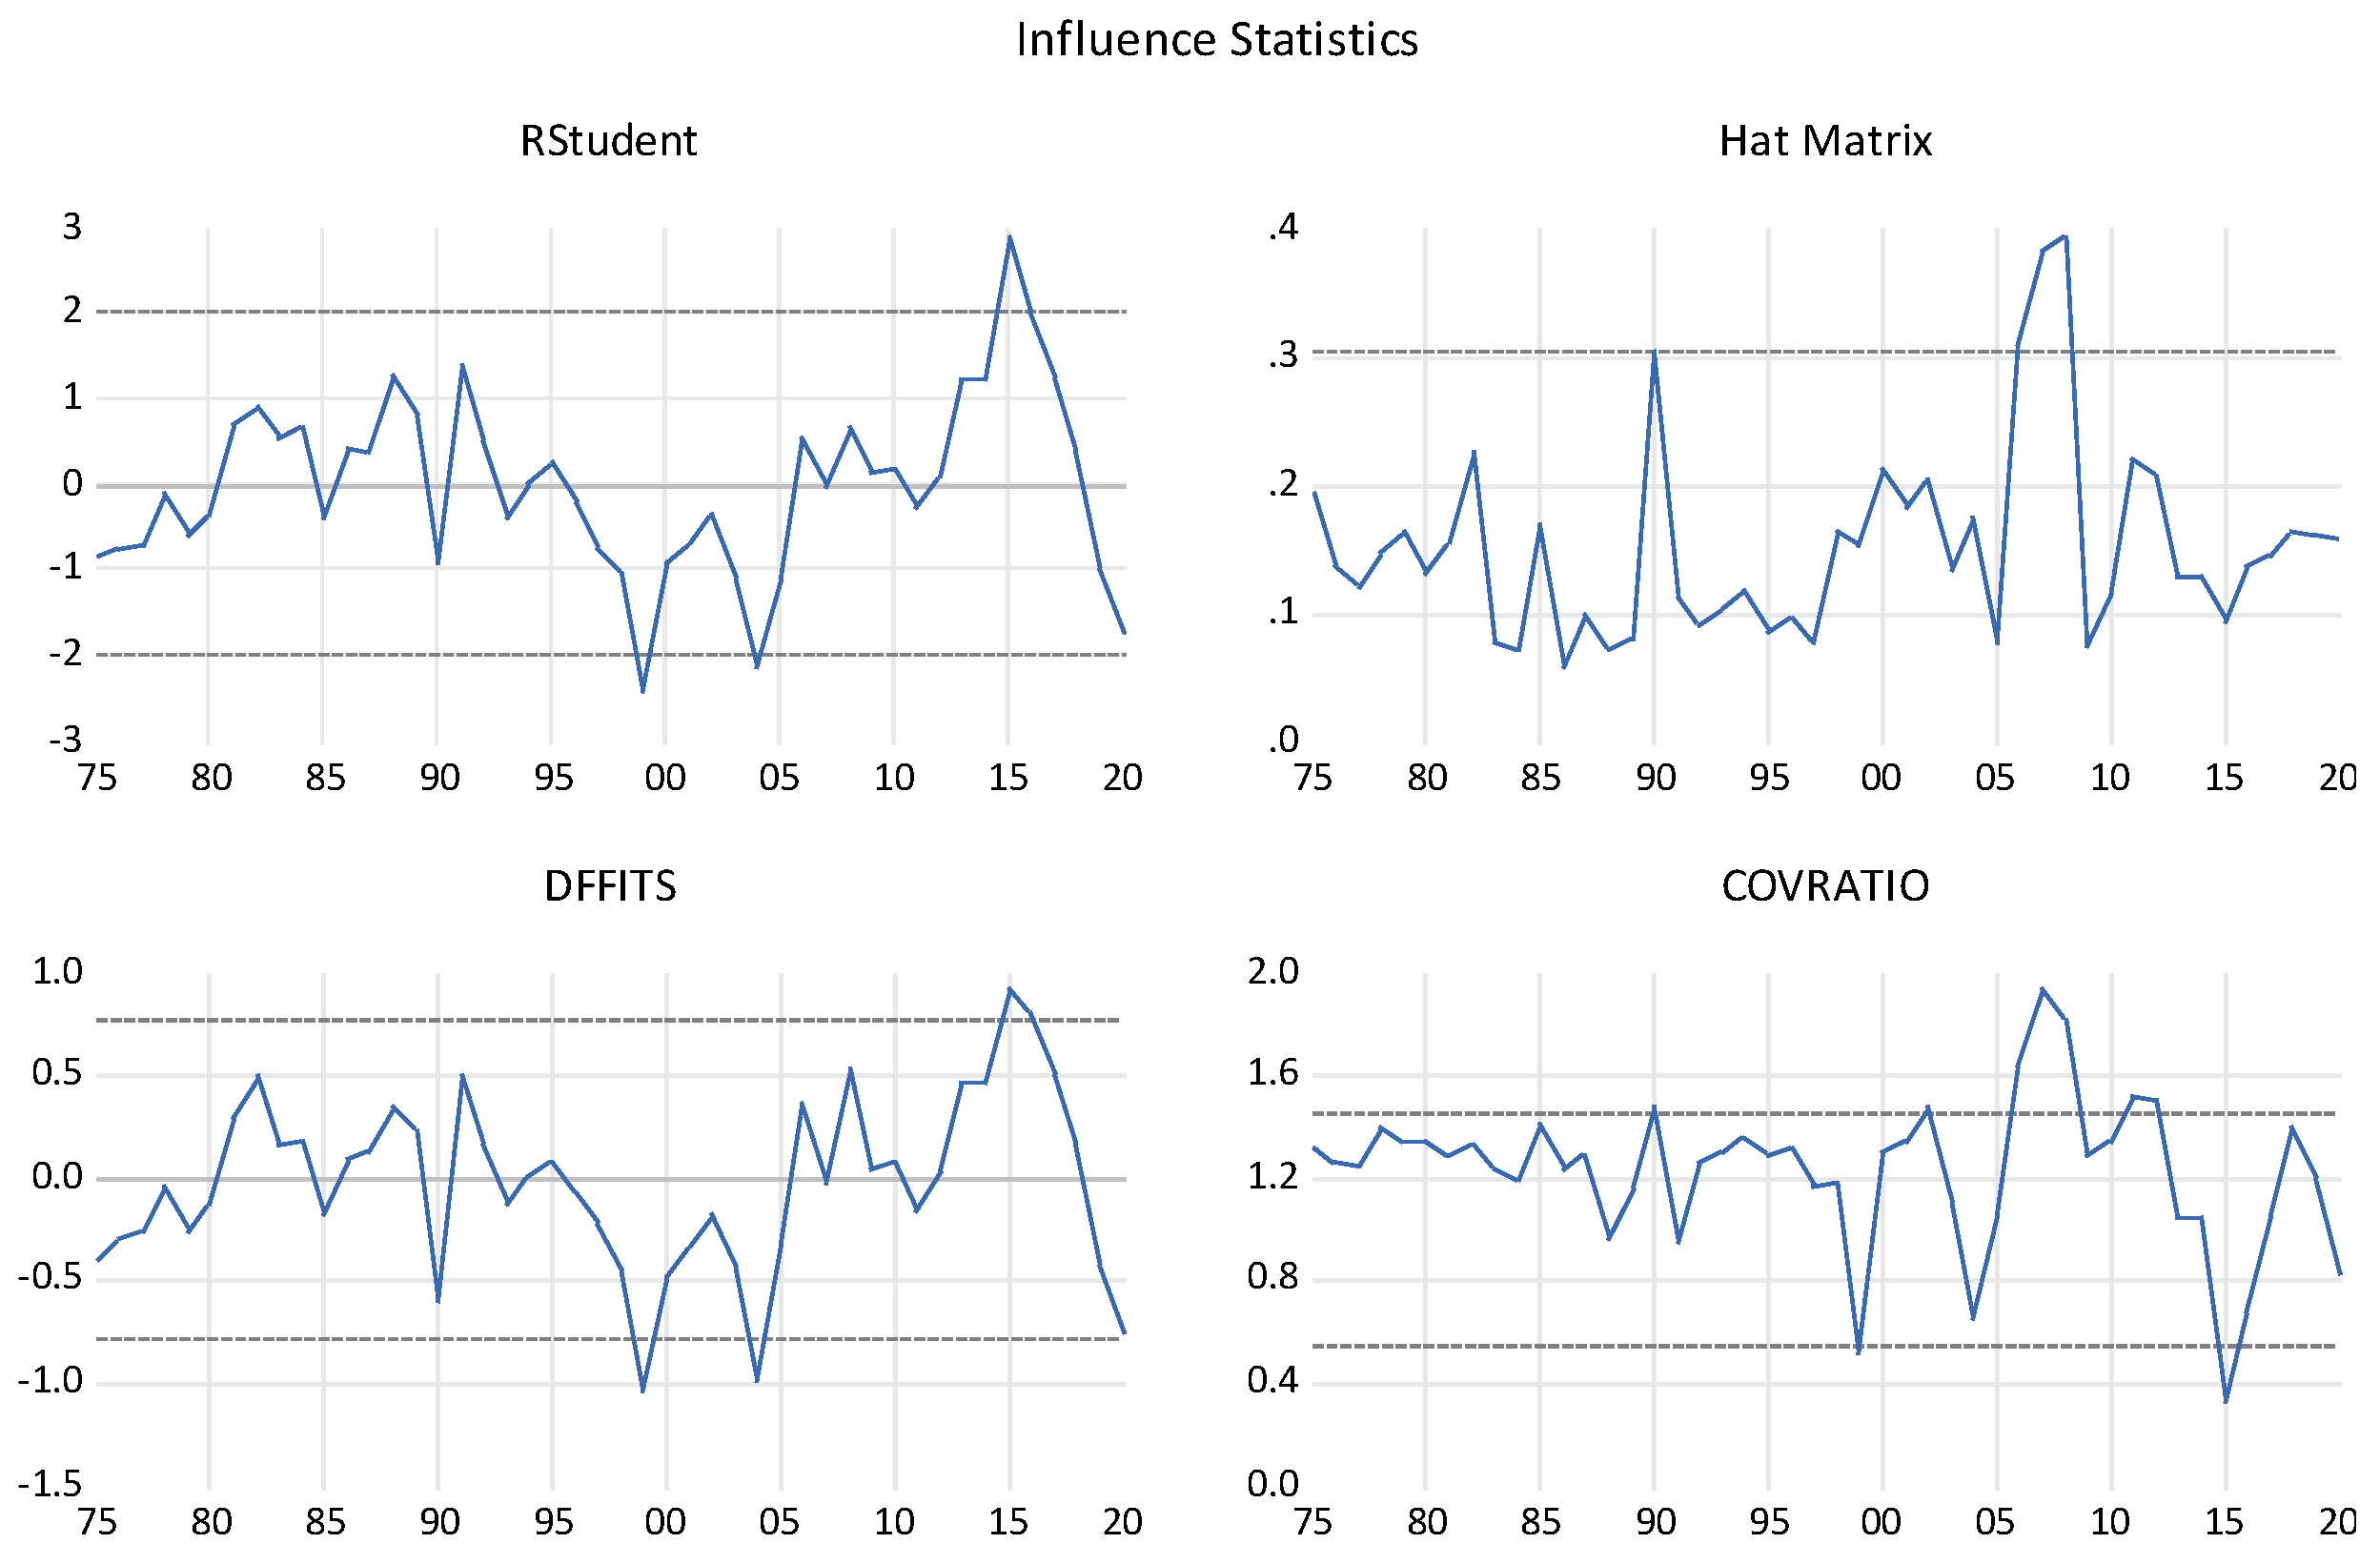
3.2.2. Influence Statistics

One of the few ways to identify any outlier or aberrant number in the data is via influence statistics. Eliminating an outlier is essential because it restores trust in the results. The first step in the process of eliminating outliers is identifying them. There is a data set that can be analysed using influence statistics, and four distinct analyses may be derived by running impact statistics on any data set. The RStudent, DFFITS, COVRATIO, and Hat Matrix diagrams are used to identify anomalies.

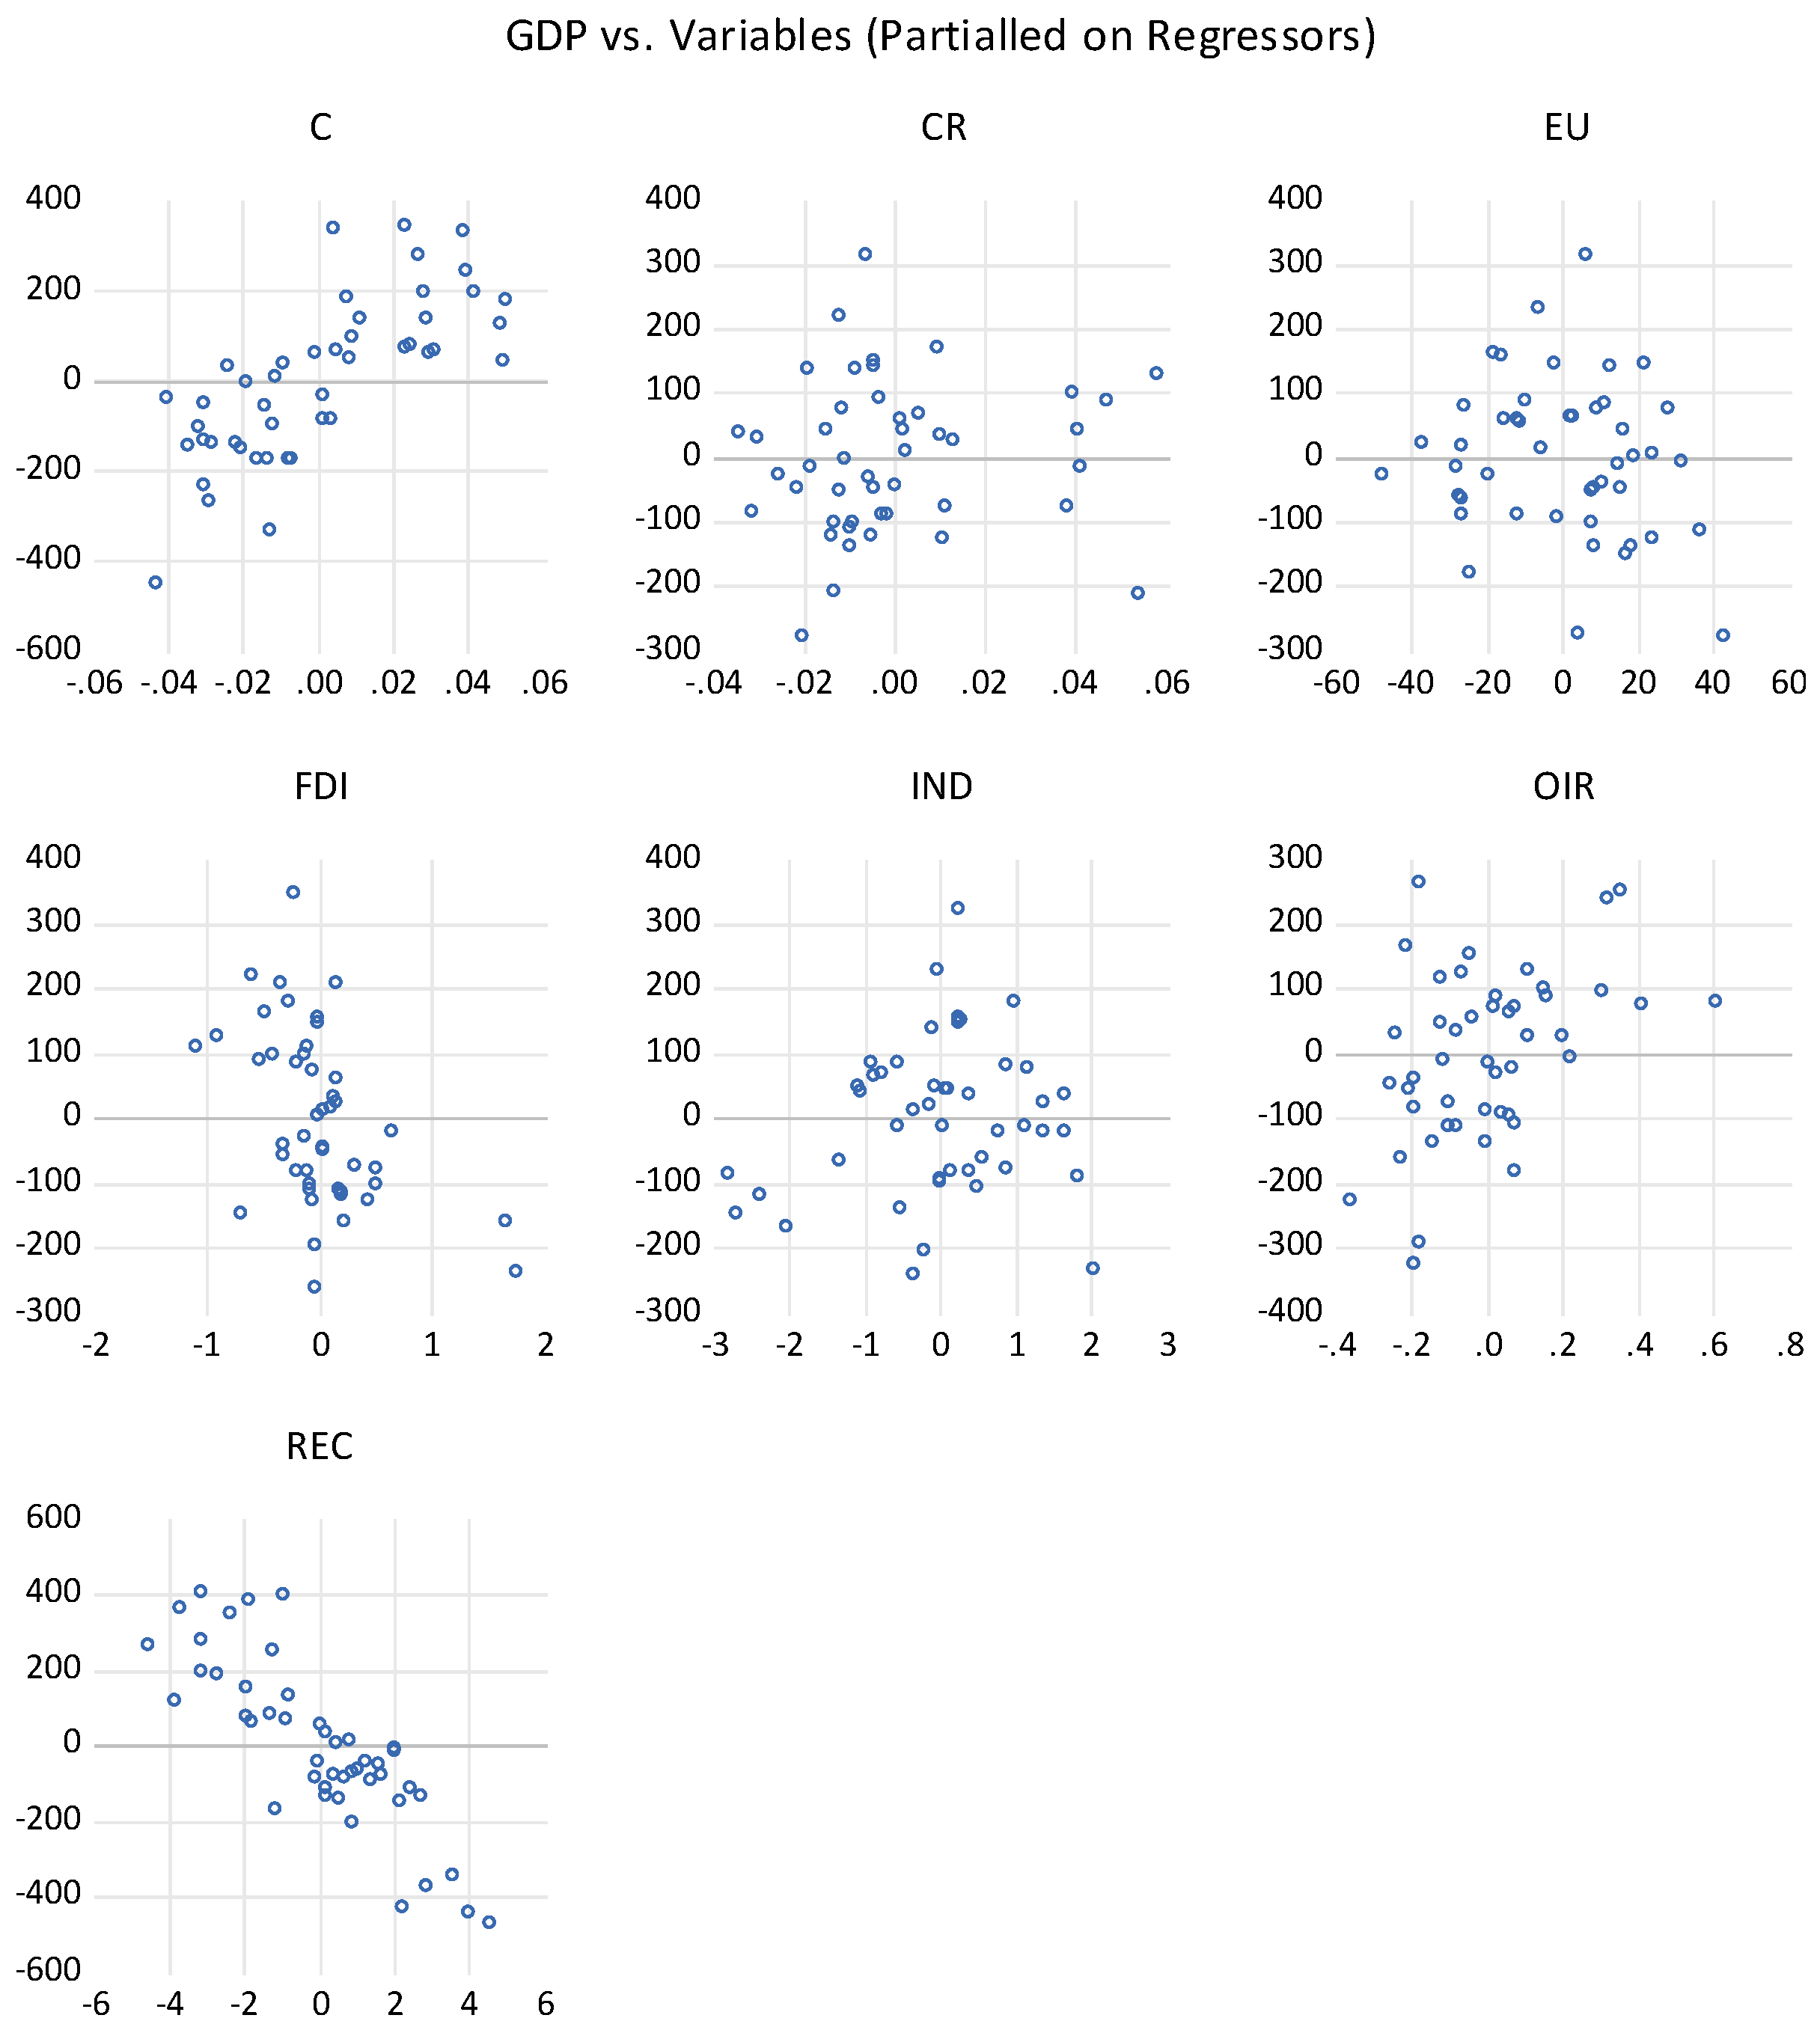
3.2.3. Leverage Plots by RLS Estimation

In the same way that influence statistics do, leverage plots may identify unusual patterns in the data. When we put the leverage plot function to work, we obtaina side perspective that is wholly annotated with all our data points. Outliers may be found quickly and easily among the labelled observations. High leverage points (HLPs) are the points that cause disruptions in the data of independent variables alone. At the same time, y-outliers are the aberrant values in the set of dependent variables. In order to better understand the data they affect, High Leverage points are further classified into two distinct groups. Good leverage points (GLPs) and bad leverage points (BLPs) are the two categories of HLPs (BLPs). Bad leverage points are a source of worry in any data set, since they significantly influence the estimated values of various variables. In contrast, excellent leverage points have no such effect.

3.2.4. Robust Least Squares (RLS) Estimation

RLS is not affected by outliers and can readily adjust for any disturbances the model throws off. RLS Estimation not only identifies but also resolves outliers in the data. RLS uses three different estimators to deal with outliers generated by the regression model:
  • The M-estimator deals with outliers in the dependent variable. An outlier is defined as a value in the dependent variable that deviates significantly from the regression norm and produces a “high residual” [78].
  • The S-estimator considers outliers in the independent variables that produce significant leverages. It brings down the “large residual” level and reduces the number of high leverage points [79].
  • It begins by carrying out an S-estimation, after which it employs the estimates as a point of reference to carry out an M-estimation. In the end, the S and M estimates are combined to form what is known as the MM estimator. It simultaneously considers outliers from both the independent and dependent variables [80].
The following RLS equation is applied on the given data set:
G D P P C = β 0 + β 1 O R + β 2 C R + β 3 E U + β 4 R E C + β 5 F D I + β 6 I N D + ε ( G D P P C ) ( O R ) > 0 , ( G D P P C ) ( C R ) > 0 , ( G D P P C ) ( E U ) > 0 , ( G D P P C ) ( R E C ) > 0 , ( G D P P C ) ( F D I ) > 0 , ( G D P P C ) ( I N D ) > 0
where GDPPC is GDP per capita, OR is oil rents, CR is coal rents, EU is energy use, FDI is inbound FDI, IND is industry value-added, and ε is error term.

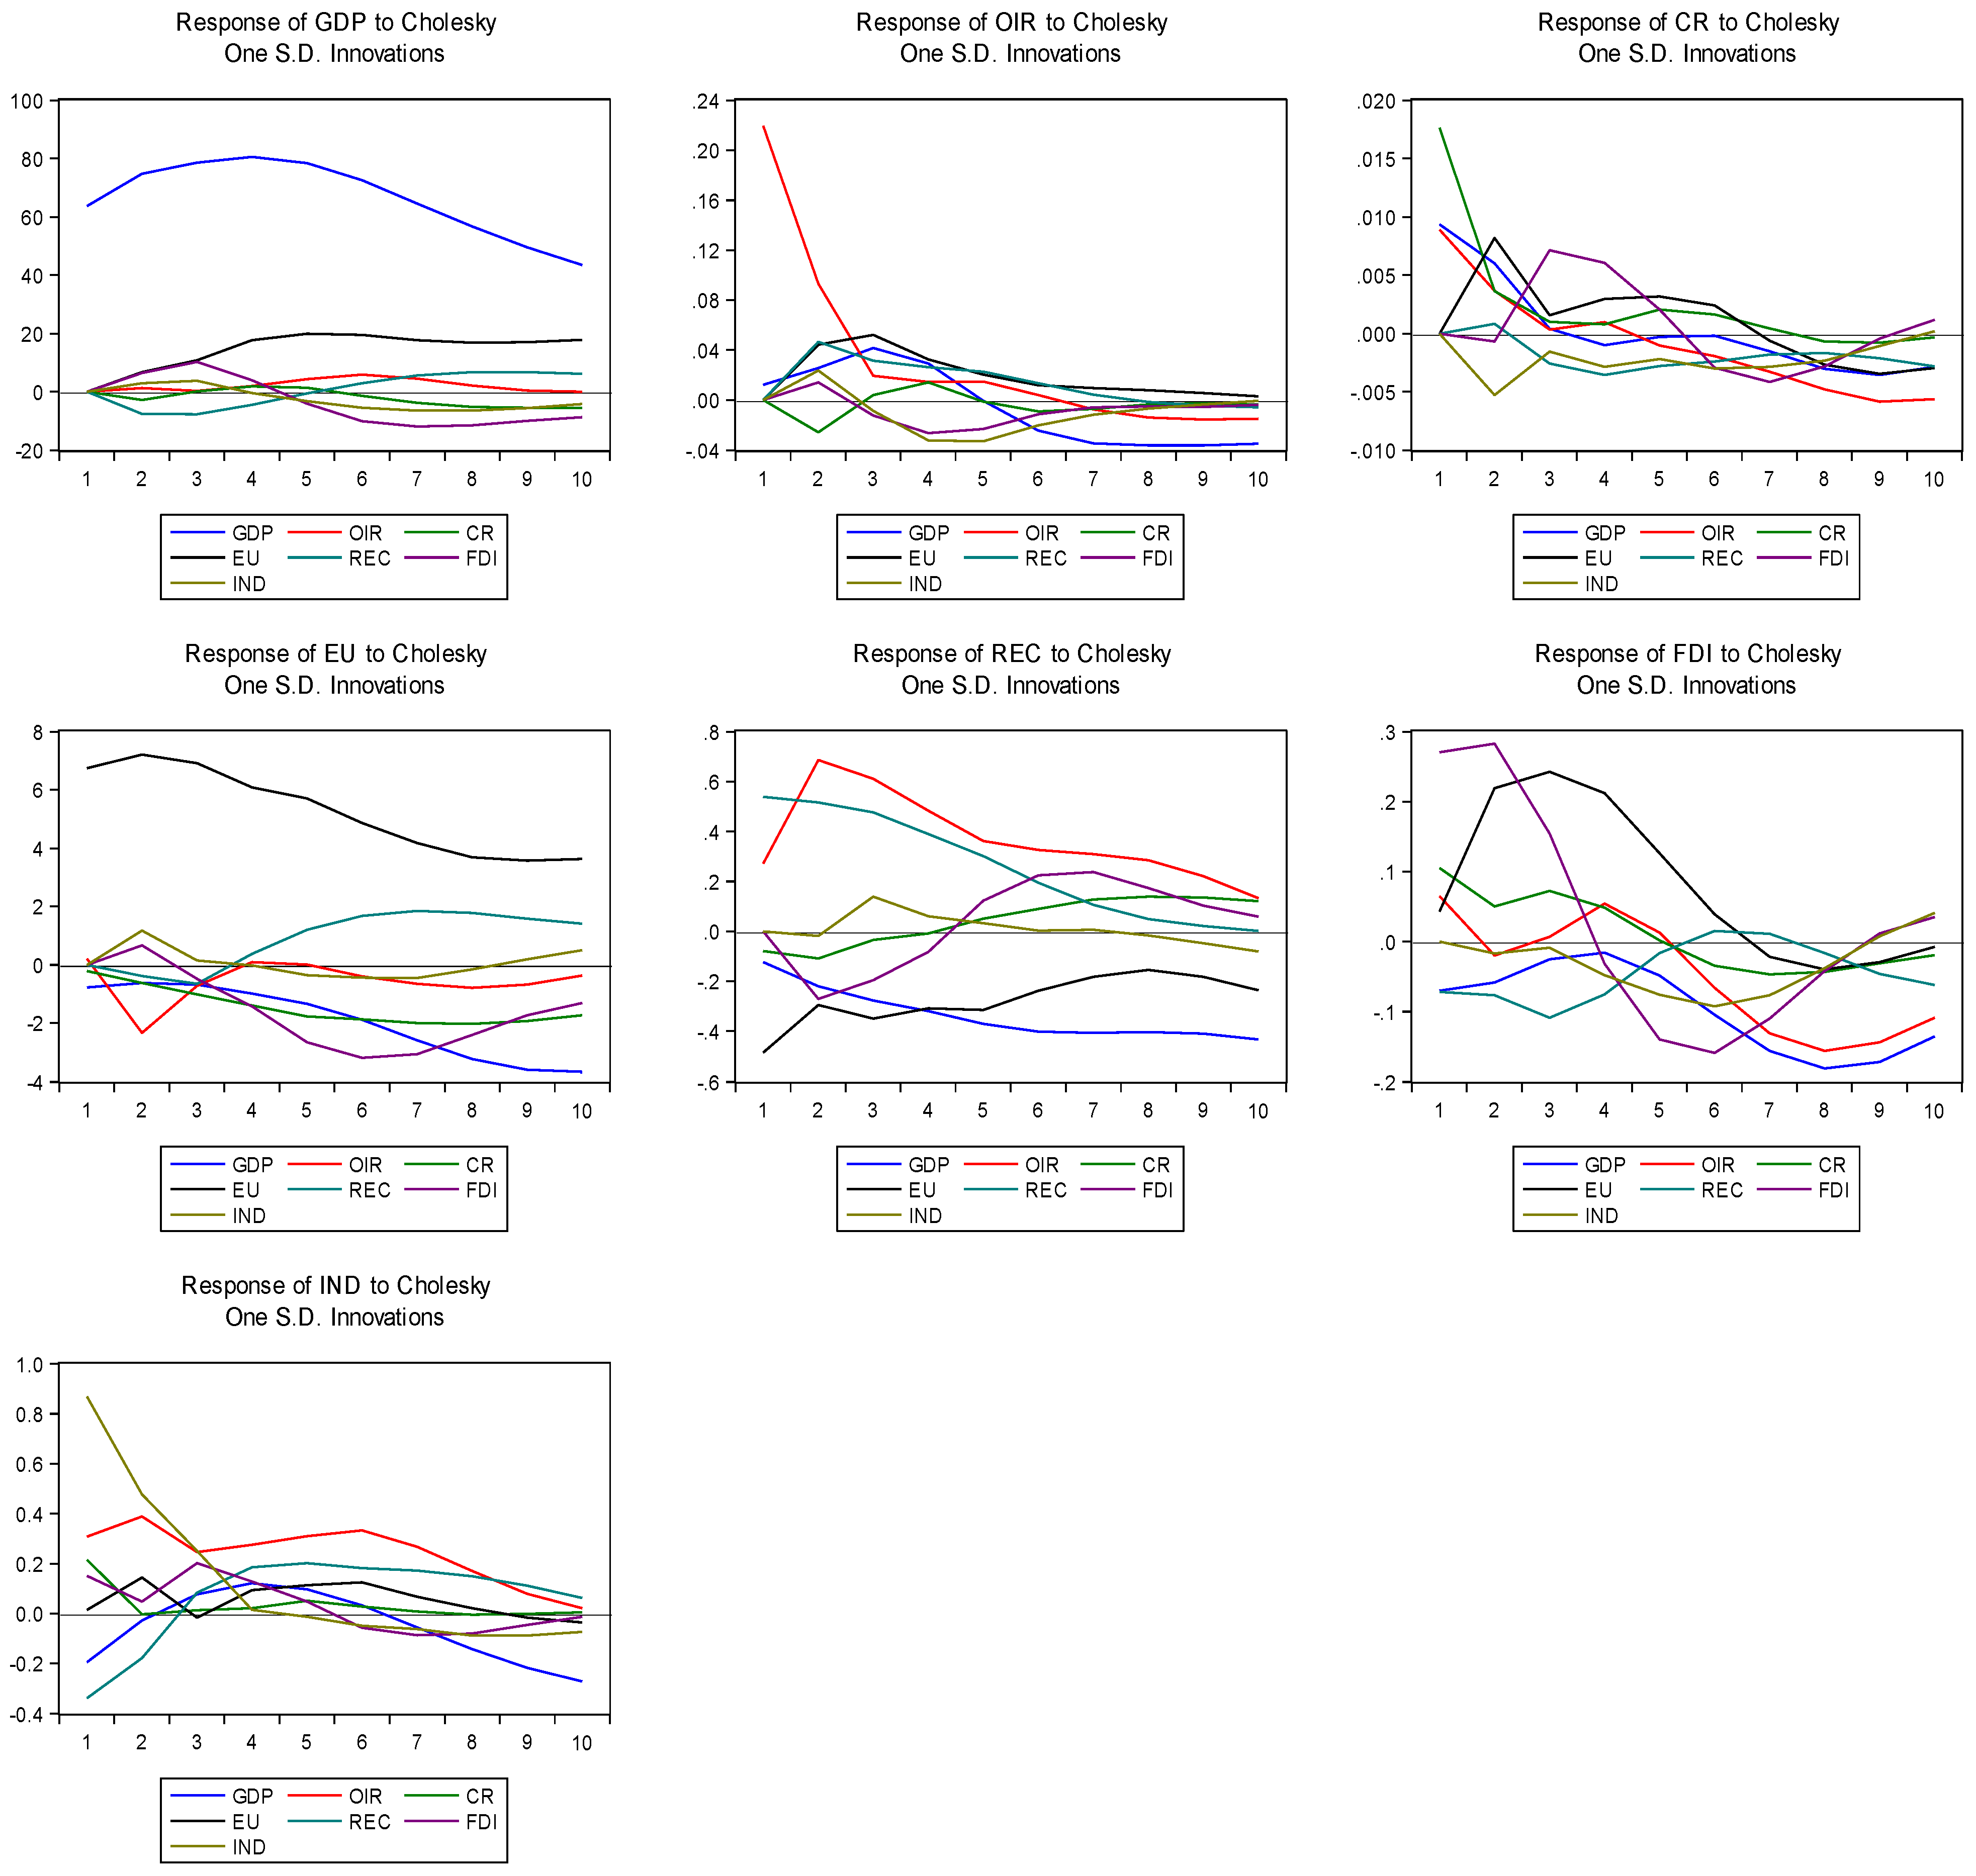
3.2.5. Impulse Response Function (IRF)

Analysis of the impulse response function in a VAR model from a theoretical point of view is discussed. The significance level of the impulse response was set at 95% confidence. Shocks to the explanatory variables may affect the dependent variable, thus the term “impulse reaction”. Utilizing IRF, one may foresee the trajectory of the dependent variable.

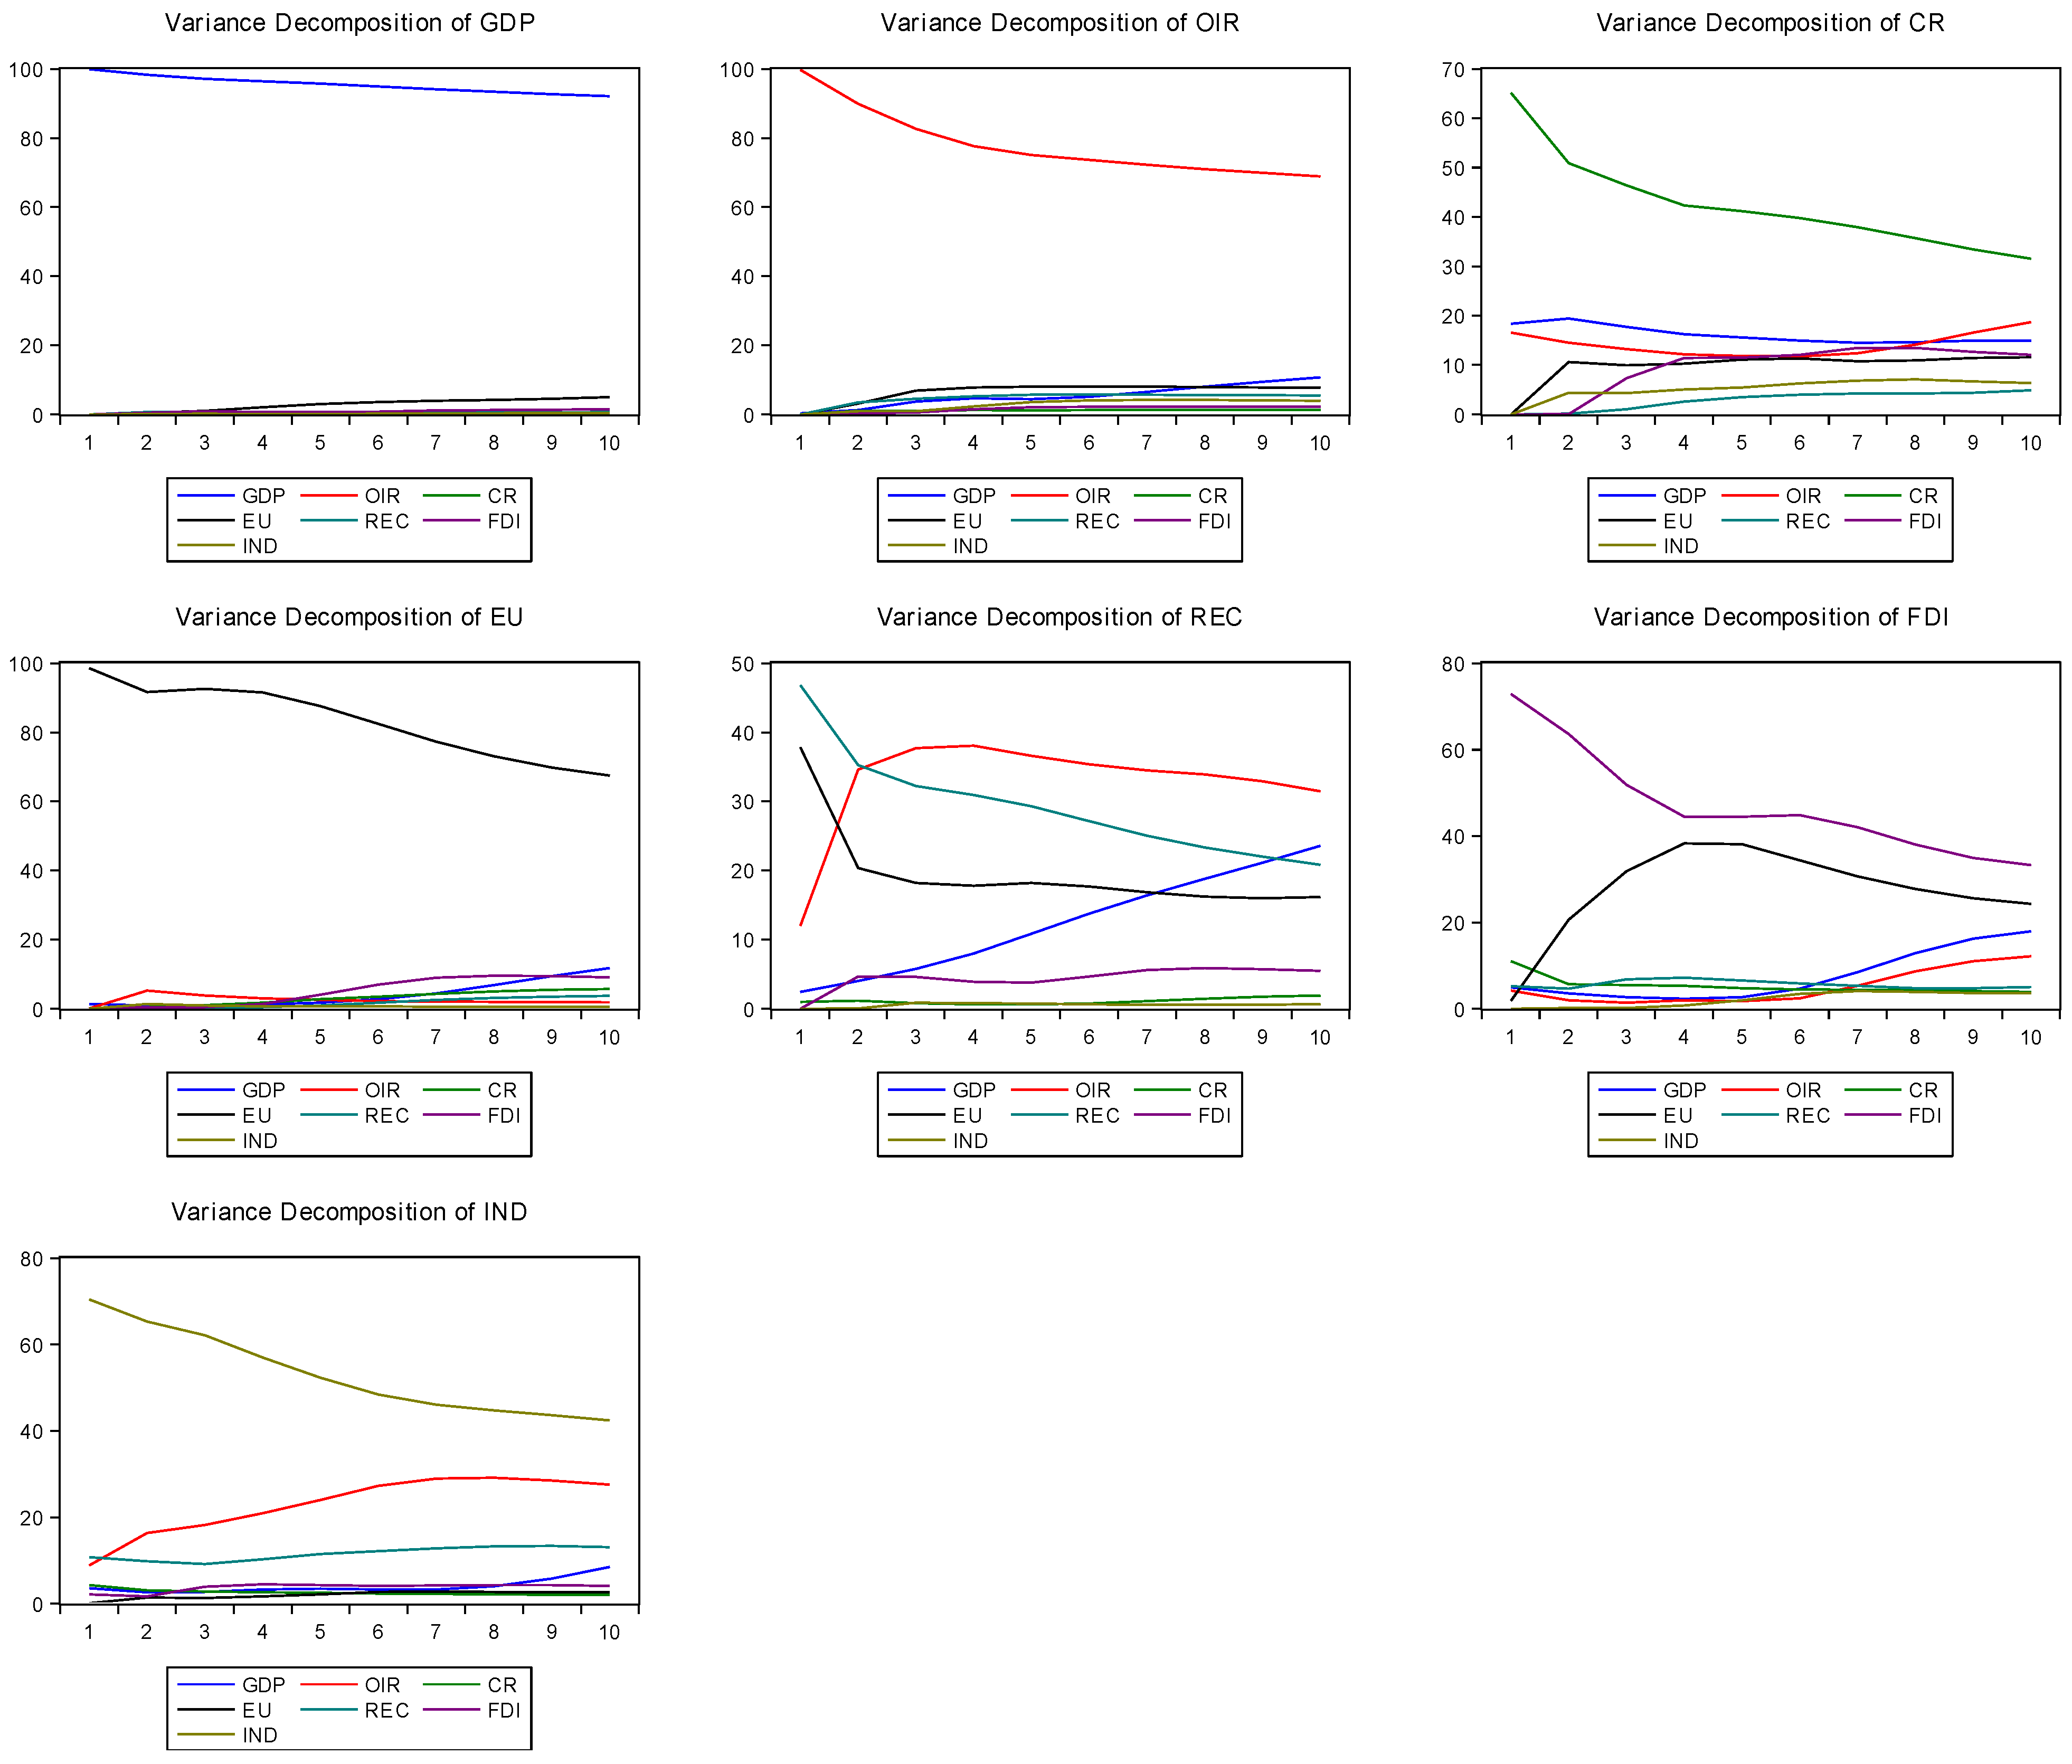
3.2.6. Variance Decomposition Analysis (VDA)

The function determines which variable has the most influence on the future values of another variable by estimating which variable has the most significant influence. The VDA illustrate not only the influence that a variable might have on itself but also the influence that other variables can have on it in the years to come.

4. Results

The first thing that needs to be done to get the ball rolling on the estimation process is to think of some particular metrics to help understand the data. The most important aspects of these metrics are the mean value, the highest and lowest possible values, the standard deviation, the skewness, and the kurtosis. The mean of a data set provides us with the average value of the set, and the maximum and minimum values provide us with the highest and lowest points that the given data can reach. The standard deviation illustrates the difference between any given value of a data set, and the presence of skewness in any data indicates that the data are not normally distributed. The kurtosis determines whether or not the data set contains any considered extreme values. The descriptive statistics for selected variables are shown in Table 2.
The mean value of GDP per capita is USD660.164. The mean values of coal rent, energy use, FDI, industry, oil rent, and renewable energy consumption are 0.069% of GDP, 414.711 kg per capita, 0.818% of GDP, 20.372% of GDP, 0.562% of GDP, and 51.739% of total energy consumption. GDP per capita reached USD1482.213. Coal rent is 0.156% of GDP, energy usage is 500.432 kg per capita, FDI is 3.668% of GDP, industry value-added is 22.930% of GDP, oil rent is 1.312% of GDP, and the renewable energy consumption is 58.091% of total energy consumption. Minimum GDP per capita, coal rent, energy usage, FDI, industry, oil rent, and renewable energy consumption are USD168.080, 0.028% of GDP, 299.104 kg per capita, 0.062% of GDP, 17.548% of GDP, 0.141% of GDP, and 41.741% of total energy consumption. Positively skewed variables include GDP, coal rent, FDI, and oil rent, whereas energy usage, industry, and renewable energy consumption are negatively skewed. GDP per capita is platykurtic since its kurtosis value is smaller than 3. Coal rent and FDI have kurtosis levels over 3. Only oil rent is mesokurtic since it has an exact value of 3, indicating normal distribution.
We may see the specific nature of the relationship between two variables via correlation. A correlation might be negative, positive, or just neutral. Displaying these associations in tabular format results in a correlation matrix. The range of correlation is from +1 to −1, with a correlation value of 0 indicating no relationship between the two variables. Correlation values near +1 indicate a strong positive relationship between the variables, whereas values close to −1 indicate a strong negative relationship between the variables. Table 3 displays the relationships between the specified variables.
Coal rent is discovered to have an inverse relationship with GDP. A rise in coal rent would negatively affect GDP, with a correlation value of −0.203, suggesting that the economy would suffer with increased coal rents. Coal rent correlates with GDP, crediting the resource curse theory. A substantial positive connection exists between energy use and GDP (i.e., r = 0.747). Increasing energy use has a positive effect on GDP. Inbound FDI correlates positively with GDP growth. More money invested in the nation means more people can find work that pays well, boosting the GDP. Increases in industry value added have been shown to affect GDP negatively. The finding supports the natural resource blessing theory that oil rent correlates positively with GDP, but only marginally. The value of the correlation is 0.277. Finally, there is a strong inverse relationship between renewable energy sources and economic growth. Even a little increase in the usage of renewable energy sources might have a profoundly detrimental effect on GDP. The findings provide credence to the theory of conservation. The high cost of producing renewable energy is one possible explanation. The government may be spending more than it is bringing in.
Stability diagnostics are used to identify anomalies in the data. We can then perform influence statistics on the results of stability diagnostics to identify any anomalies in the data. The data influence statistics are shown in Figure 1.
The first outlier is shown in RStudent’s in 1999, the second and third are in 2004, and the fourth and fifth are in 2015. A Hat Matrix reveals a single 2008 outlier. The years1999, 2004, and 2015 stand out as anomalies on the DFFITS. The COVRATIO is the last to check for statistical outliers in the influence. First, in 1990, then in 1999, 2002, 2007, 2012, and 2015, we see an anomaly. Leverage points serve the same purpose that influence statistics do; hence, the two terms are interchangeable. It helps identify oddities and outliers. Figure 2 makes it easy to see the data points that deviate significantly from the norm.
There are a few irregularities in the data when looking at the correlation between coal rent and GDP in 1991, 1999, 2004, 2015, 2016, and 2020. Outlier years in terms of energy use and its connection to GDP include 1999, 2004, 2015, 2016, and 2020. The years 1999, 2004, 2015, and 2020 stand out as oddities in the graph that depicts the relationship between GDP and FDI. There are extreme values for the value added to industries and the GDP in 1999, 2004, 2015, and 2020. Additionally, there are a few anomalies in the link between oil rent and GDP in 1999, 2004, 2013, 2014, and 2015. The years 1999, 2015, 2016, and 2020 stand out as exceptional when it comes to the amount of renewable energy used and its effect on GDP. The following diagnostic Table 4 explains all measurement errors, including normality issues, autocorrelation, heteroskedasticity, and misspecification error. The Jarque–Bera test is used to assess if there is a problem with normality, the heteroskedasticity test is used to check whether there is autocorrelation in the data, and the Ramsey Reset test is used to determine whether the data include any misspecification errors.
The unbiased estimate of the data is impacted by the presence of outliers discovered in the influence statistics and leverage plots. The only way to obtainfindings that can be further utilized to understand the impacts of independent variables on the selected dependent variable and to use that knowledge to determine the future course of action is to remove the outliers. Only by doing this will we be able to produce the results that can be further used. Robust Least Square Regression Estimation is one method that may be used to remove outliers. The RLS Regression estimate process is carried out in Table 5.
Outliers disappeared from the data when Robust Least Squares regression was applied. By excluding FDI from the RLS-1 model and examining the resulting R squared value of 0.447527, we may infer that FDI accounts for about 55% of the total variance. With an adjusted R2 of 0.378468, it is clear that FDI is a critical factor of the model. Coal rent is a positive contributor to Pakistan’s economic growth, as the coefficient for coal rent was 1518.174, then a one-unit shift in coal rent might result in a 1518-unit shift in GDP per capita. The result implies that increases in coal rent boost the country’s economic growth. It was determined by Asiedu et al. [81] that FDI has a significant impact on the relationship between the peak in coal rent and GDP growth. The correlation between natural resource rent (such as natural gas and coal rent) and economic expansion was calculated by Inuwa et al. [82]. Investment in coal rent increases GDP considerably, and banking sector investment increases GDP even more. Coal rent significantly impacts GDP, which Zhou et al. [83] discovered that this effect may be amplified by encouraging a more favourable environment for natural resources. Energy consumption has a positive relationship with GDP per capita, with a coefficient value of 1.463, which implies that an increase in energy consumption would lead to a rise in per capita income; when seen through the lens of a 0.002 probability value, energy use stands out as a very influential factor. Using carbon emissions as a proxy for energy use, Abbasi and Adedoyin [84] calculated an estimated link between the two. The findings indicated that a rise in energy use might boost GDP, raising carbon emissions. Haldar and Sharma [85] studied that energy consumption favours the country’s economic growth (while keeping population, urbanization, and carbon emission into consideration). A larger population means the use ofmore energy, which raises the country’s overall income and adds to income. Adebayo et al. [86] concluded that energy usage stimulates economic development, and the creation and use of energy from nonrenewable resources are essential to fill the economic needs of a nation. The oil rent positively and significantly correlates with the country’s economic growth. Since oil rent has a coefficient value of 116.797, a shift of just one unit could result in a shift of 116.797 units in GDP per capita. Because of their close correlation, oil rent and GDP would grow simultaneously. According to Yang et al. [59], the large quantities of oil reservoirs and oil rent benefit GDP. Using empirical data, oil rent-based economic growth is substantial compared to non-oil countries, as shown by Alabdulwahab [87]. An increase in oil rent would increase GDP in a nation. By connecting FDI, GDP, and oil rent, Haque [88] uncovered some interesting economic dynamics. More oil reserves in a nation might entice foreign investors, raising the GDP. There is a favourable correlation between these three factors. Higher oil profits would increase foreign direct investment, which would boost GDP. Renewable energy use has a negative coefficient value, indicating a negative relationship with the per capita income, i.e., a one-unit increase in renewable energy usage would result in a 24.241-unit decline in GDP. The detrimental effects of using inadequate renewable energy sources on GDP were studied by Sharma et al. [89]. Renewable energy generation is costly; hence, its use may temporarily lower a country’s GDP. Zafar et al. [90] developed a model in which economic growth, carbon emissions, and usage of renewable energy all have a peculiar relationship. Increasing GDP tends to increase carbon emissions; after then, there is an inverse relationship between carbon emissions and renewable energy sources. Reduced carbon emissions are one benefit of switching to renewable energy sources. By correlating these findings, we may deduce that growth in renewable energy sources will hurt the country’s economic growth. According to Hasanov et al. [91], using renewable energy sources would lead to a drop in GDP and a corresponding reduction in carbon emissions. The share of GDP generated by renewable energy sources has a negative and inverse relationship. This unfavourable correlation exists partly because renewable energy generation necessitates the use of increasingly sophisticated and costly equipment. It is possible that if the government spends more, it might bring in less money.
After excluding the effect of renewable energy usage in the RLS-2 estimator, the R-squared value of this model drops to 0.456, with an adjusted R2 of 0.388. Using the statistic known as “R-squared”, we can calculate that 54% of the model’s variance is attributable to the usage of renewable energy sources. In the RLS-2 estimate, the independent variable coal rent is positively and significantly related to the country per capita income. By examining the coefficient value of 1199.825, we can determine the positive relationship. If coal rent was increased by one unit, the effect on GDP per capita was 11,998,25 units. Pasaribu and Lahiri-Dutt [92] looked at how much people’s incomes depended on their use of coal. If coal were used more efficiently, it would help to alleviate gender and wealth disparities, raise health standards, and ultimately enhance a country’s gross domestic product. It was anticipated by Norouzi and Fani [93] that using coal may boost economic development but at the expense of the environment. Coal rent, industrialization, and economic expansion were all linked by Nkemgha et al. [94]. A high GDP per capita is correlated with fast industrialization, which is positively impacted by coal rent. One further factor that has a significant and beneficial effect on GDP per capita is energy use. There is a positive and direct relationship between energy consumption and GDP growth; a one-unit increase in energy consumption would result in a two-unit expansion in GDP, and vice versa. According to Saidi and Rahman [95], environmental deterioration is a major issue stemming from the correlation between energy use and GDP. In their study, Ahmad et al. [96] found that locations with a higher concentration of urban dwellers had a significantly higher energy consumption rate. Meeting this need for energy would lead to a significant increase in GDP. Less energy use would lead to a lower GDP; therefore, the converse is also true. Energy consumption has a detrimental effect on the environment, yet it is essential for economic progress, according to a study by Wada et al. [97]. Energy is a fundamental requirement, and people are prepared to pay any price to ensure its availability. These payments boost income, creating a positive relationship between the two. The positive coefficient value between FDI and per capita GDP suggests a favourable relationship between the two variables. An increase of 1 unit in FDI might lead to a rise of 78.845 dollars in GDP. The relationship between GDP expansion, trade, and foreign direct investment was established by Sabra [98]. Inbound FDI has a multiplier effect on a country’s GDP by increasing its exports. Using data, Hasan et al. [99] argued that although FDI increases a country’s GDP, environmental damage is a necessary consequence. According to Tanoe [100], a country’s GDP benefits significantly from an increase in the foreign direct investment it receives. Excluding the renewable energy consumption variable from RLS-2 allowed the independent variable of industry value added to become statistically significant. The negative coefficient value of −21.818 for industrial value added suggests that this variable has an inverse relationship with GDP. Udemba and Keles [101] established the relationship between industrialization, GDP, and carbon emission. There is an inverse relationship between GDP and carbon emissions, but there is a positive relationship between industrialization and carbon emissions. More sophisticated industrialization often results in skyrocketing carbon emissions, which negatively affects GDP due to the inverse relationship between the two variables. If we look at GDP and industrialization together, we see they have a corrosive relationship. Elfaki et al. [102] predicted that industrialization might harm GDP in the short term.
The Variance Inflation Factor (VIF) test may be used to find multicollinearity in any model. The independent variables are considered multicollinear when the VIF value is more than 10. The VIF estimate is provided in Table 6.
Because none of the variables has centred VIF values higher than 10, multicollinearity is not a problem that has to be addressed with this model. It may be inferred from the lack of multicollinearity that the independent variables in the data do not have a linear connection with one another. Figure 3 shows the changes that occur in one variable due to a shift in another. The impulse response function always lies between 95% confidence interval lines.
An EU shock of one standard deviation would increase CR in the first two periods, decrease it in the third, and hold it steady in the fourth and fifth before causing a significant shift in the seventh. In the seventh quarter, CR starts to drop. The impact of FDI on CR follows a wavy pattern, rising through the fourth period, levelling out through the ninth, and rising again by the tenth. The first period has the greatest CR while the second period has the lowest. Negative values appear in the fifth period owing to GDP shocks and stick around until the tenth year. Negative effects of CR due to IND begin in the first period and continue until the tenth. CR begins to rise in the first period, and this pattern persists during the second. Afterwards, it drops in the third period, rises somewhat in the fourth, and then drops below zero in the fifth. Negative values for CR continue to be seen into the tenth quarter. This development in CR is a direct result of OIR. Negative effects of CR may be seen as early as the first period due to REC shocks. Negative CR numbers may be seen every period from the first to the sixth. As of the seventh period, CR has been rising and has stayed that way through the tenth. As early as the first period, a CR shock of one standard deviation would have a detrimental effect on the EU. In the second phase, the EU would decrease, and in the third, it would increase again. The EU gradually decreased from period four to nine as time progressed. EU shows a little uptick in performance during the tenth quarter. EU is a negative sum game. Changes in FDI do not affect the EU in the first two periods. The downward trend starts in the third period, stays at low levels through the sixth, and worsens through the tenth. GDP causes a gain in the EU until the second period, which begins to drop until the tenth period. Positive values characterise the EU movement during the fourth stage, after which negative values take over. Due to IND, the EU rises until the second period, but then it begins to drop until the seventh period. Once again, the EU rises from the eighth to the tenth era. As of the fifth period forward, EU values have been decreasing, and by the ninth period, they had become negative. Decreases in EU performance may be seen in both the first and second quarters. The rise begins in the third quarter and continues until the eighth. There has been a continuous tendency in the EU throughout the ninth and tenth centuries. Fluctuations in OIR cause the shift in the EU. From the first through the second period, the EU is relatively stable; in the third period, it drops before beginning an increasing trend that continues until the ninth period. EU values go negative in the third phase. REC shocks have caused this pattern.
There is a drop in FDI in the first period because of CR but an increase in FDI in the third and fourth. Beginning in the fourth year, it steadily declines; beginning in the fifth year, FDI values become negative. There is an increase in FDI in the first three periods (periods 1, 2, and 3) because of the European Union, followed by a decline in FDI in periods 4 through 8. It starts going up again in the eighth period and going down in the seventh period when FDI numbers start to become negative. Foreign direct investment (FDI) peaks in the first period and then begins to fall in the second. Negative values appear in the fourth period due to GDP shocks and stay there until the tenth year. FDI sees a modest uptick between the ninth and tenth periods. It drops until the second period, rises steadily through the third, dips again from the fourth to the seventh, and then rises steadily from the eighth to the tenth. For the remainder of the period (until the ninth), FDI is negative. As soon as the first period begins, FDI is negatively impacted by OIR. It drops until the third quarter when it begins to rise toward positive levels before falling again in the fifth and remaining flat through the tenth. FDI is stable at first, then declines in the second phase. It drops dramatically during the fourth quarter and then slowly rises again, although the values still end up red. The rise of FDI may be attributed to REC. The first four quarters see a GDP gain because of CR, while the fifth through ninth quarters see a decline. The GDP sees a slight uptick in the tenth period. In the first period, GDP is negative, but in the second period, it begins to grow and continues to grow until the seventh period. GDP drops somewhat in the eighth and ninth periods before picking up again in the tenth. Positive figures for GDP may be seen beginning in the second period as a result of shocks in the EU. Negative values of GDP result from FDI shocks. An outsized one-standard-deviation swing in FDI would begin to weigh on GDP in the first quarter. The GDP would increase in the second period, and it would increase once again in the third quarter. GDP would continue to fall from the fourth period through the seventh. After a sluggish start to the term, GDP shows nominal growth until the end of the quarter. The GDP rises until the third period because of IND, but then it begins to fall until the eighth. The expansion in GDP is repeated between the eighth and tenth years. From the fifth to the tenth quarter, GDP values go down. The GDP stays flat through the second quarter, drops in the third, and then starts climbing again in the middle of the third and continues until the seventh. It drops gradually in the seventh period, stabilising by the ninth and tenth. GDP falls in the third quarter. This development may be attributed to OIR shocks. REC shocks have little effect on GDP. Throughout all ten time intervals, GDP is very close to zero. The GDP begins to fall in the second period and continues to do so until the sixth. There is a decline in the first six periods, but it remains pretty consistent.
The effects of CR reduce IND during the second period, but the third period shows a gradual increase that continues until the fifth. The decline in IND may be seen from the sixth to the tenth. By the eighth period, IND’s values had already begun to decline. A rising IND trend emerges in the first period and persists into the second. After a minor rise in the fourth period and a downward trend in the third and fifth periods, it resumes its increasing trend in the sixth. Gradually reducing until tenth grade, the scale shifts downwards beginning in seventh. This pattern in IND occurs due to the EU. As a result of FDI, IND falls in the first period but rises in the second and third. This downward trend begins in the third period and continues until the seventh. IND values go higher from the seventh to the tenth period, whereas from the fifth to the eighth period, they go down. Negative IND values may be attributed to GDP shocks. In the first phase, an adverse effect on IND would be initiated by a one standard deviation shock in GDP. In the second period, IND would climb, and in the third quarter, it would rise again. Starting in the fourth quarter and continuing until the tenth, IND would steadily fall. IND becomes negative after the fifth period. Initially, IND goes upward as a result of unexpected increases in OIR. There is a dip in the second period, but things look up in the third and stay into the seventh. Starting in the seventh quarter and continuing until the finale, IND will continuously decline. Increasing IND is the result of outside-in radiation (OIR) impulses. The IND response is unchanged from zero in the first two years after REC shocks. From the second year forward, IND increases; this rise persists until the fourth period, following which it starts a steady decline that lasts through the tenth year. In the first year, OIR drops sharply; in years two and three, it levels off; in year four, it drops sharply; in year five, it drops sharply and becomes negative. It is impulses in CR that are responsible for these variations in OIR. In the first three time periods, an EU shock of one standard deviation would increase OIR, but OIR would decrease until the very end. As FDI shocks hit, OIR begins the term on a declining trend. OIR has consistently negative numbers from the first to the fourth quarter. Increases in OIR are first seen in the fourth period and continue until the tenth. After the sixth period, OIR values begin to rise. OIR has a negative effect in the first term because of GDP impulses. OIR increases from the first to the third period. The OIR has been going down since the third period, and it seems like it will keep going down until the tenth period. After the fourth period, OIR begins to decrease. Due to shocks in IND, OIR begins the first period on a downward trend that continues until the fourth quarter. Beginning in the fourth year and continuing through the tenth, OIR shows a steady increase. From the third period on, OIR has seen negative readings. Due to REC, OIR rises until the second period, which begins to fall and continues until the tenth. In the first eight periods, OIR has positive values, but they reverse and become negative.
The second and third periods have the greatest REC, whereas the fifth period has the lowest. After the fifth year, REC increases again until the ninth year. Shocks in CR are the cause of fluctuating REC. The EU will have a detrimental effect on REC for the foreseeable future. The first year of REC response is the weakest in the last decade. A minor improvement in REC is shown in the second year, but by midyear, it begins to deteriorate again. REC then begins to rise in the fourth year and remains high for the next four years until dropping slightly at the end of the tenth year. In the first year, REC harms the economy because of FDI shocks. The REC consistently increases from the second to the seventh period. REC has been going down since the eighth period, and it seems like it will continue until the 10th. The GDP shocks cause REC to have negative values. Negative effects on REC would emerge as early as the first period of GDP experienced a shock of only one standard deviation. The decline in REC would begin in the second quarter and continue into the third. By the end of the game, REC would have increased. It lasted from period four until period seven. There would be more and further expansion of REC. Since the eighth period, REC has gradually decreased and maintained that trend until the tenth. Because of fluctuations in IND, REC would be negative at the beginning and the period’s conclusion. REC would increase from the first to the third period, decrease from the third to the fourth, and stay relatively consistent, with a slight decrease in the tenth year. The peak in REC occurs in the second period and gradually decreases until the tenth. The unexpected increases in REC during the following decade directly result from OIR shocks. Figure 4 shows the VDA illustrations for ready reference.
Figure 4 demonstrates that, over the next decade, coal rents will vary mainly due to coal rents themselves, with just a little effect coming from FDI and energy usage. Coal rents would not be significantly impacted by changes in energy consumption, FDI, GDP, industry, oil rents, and renewable energy usage. The aforementioned graphs also illustrate that future energy usage variance will mostly be attributable to energy consumption. In contrast, coal rents will have little effect on energy use over the next decade, and FDI and GDP have similar effects on electricity consumption. Despite the potential for some effect on the industry, oil rents, and renewable energy usage, this would not significantly affect overall energy consumption. Based on the data in the table, we conclude that energy consumption is a critical factor in determining the flow of foreign direct investment. Following coal rents and GDP in terms of significance, FDI is affected by several other factors. FDI also has a vital role in forecasting, albeit this effect weakens with time. The aforementioned figure also demonstrate that the future GDP fluctuation will be primarily attributable to GDP itself, despite the direction it follows being random over the next ten years. Following FDI, coal rents are the next major factor influencing GDP, although FDI is expected to have only a minor effect in the future. Changes in energy consumption, manufacturing, oil revenues, or renewable energy usage would not majorly affect GDP. The industry will be the most influential variable in the coming decade. In addition, oil rents are having a slow but noticeable effect on the economy. Aside from coal rent, FDI, and REC are three other vital factors that have a moderate effect on the business sector. Coal rents are somewhat predictive of the future trend of oil rents. However, oil rents are the most influential factor in the ability to anticipate oil prices, and oil rents have less of an effect on oil rents over time. Energy consumption plays a crucial role in forecasting the initial consumption pattern of renewable energy. As a close second, oil rents have a small initial influence on renewable energy use that grows with time. Economic growth is modest at first, but by the tenth year, it has considerably affected the share of renewable energy in total energy consumption. While fossil fuel usage is highly predictive in the early years, renewable energy consumption is less so beyond the first few years.

5. Discussion

The total estimate is an RLS-3, which does not exclude any variables. With an R-square value of 0.704, this model has a goodness of fit of almost 71%. The probabilities of FDI, oil rent, and renewable energy usage all significantly affect GDP. FDI is negatively correlated with the country’s per capita income. The coefficient value is −131.161, which suggests that a one-unit increase in FDI would result in a 131.161-unit decrease in GDP. Sarode [103] projected a negative link between FDI and GDP, suggesting that an increase in FDI might harm the country’s income. The advent of global commerce is a contributing factor to this connection. Many businesses successfully export their wares to international markets without establishing local operations abroad. FDI also helps export-oriented economies. It has been projected by Chowdhury and Mavrotas [104] that due to political instability, inbound FDI decreases in particular nations. According to Rahman [105], an increase in FDI might cause the economy’s output to fall even more. Sometimes FDI is not profitable because of factors such as an unwelcoming economic climate or too stringent regulations. Growth in income per capita is positively correlated with the oil rent. Oil rent has a coefficient value of 307.997, which means that a one-unit increase in oil rent would lead to a 307.997 percent increase in GDP. Since a statistical estimate by Ozturk [106] shows that oil rent contributes positively to GDP growth, a rise in oil rent will eventually accelerate GDP. Poor and volatile economies fit this situation. According to the estimates provided by Sweidan and Elbargathi [107], oil rent has a positive influence on GDP growth, with a rise in one leading to an increase in the other. This positive association may be the result of globalization. It was projected by Okoye et al. [108] that oil rent has a favourable and considerable effect on GDP because of the abundance of natural resources. There is a clear correlation between these two factors, so an increase in one would cause a corresponding increase in the other. There is a negative correlation between GDP per capita and the use of renewable energy. Renewable energy consumption has a coefficient of −82.696; as the share of renewable energy in total energy consumption were to increase by one unit, the GDP per capita would fall by USD82.696. According to Ocal and Asla’s [109] examination of the relationship between renewable energy consumption and GDP growth, increasing GDP will require reducing energy use. The high cost of generating electricity from renewable sources may be to blame for this association. Inversely, Dogan et al. [110] predicted that increasing the share of renewable energy in total energy consumption will improve economic growth. The cost of electricity would rise significantly if a sizable portion of the nation’s power came from renewable sources. Since Magazzino [111] found a negative link between renewable energy consumption and economic growth, it stands to reason that individuals’ aggregate income remained the same. Policymakers should support ecologically responsible activities, a diverse fuel mix, and FDI concentrated on the services sector for conserving economic and environmental resources. Liu et al. [112] suggested that policymakers should support ecologically responsible activities, a diverse fuel mix, and FDI concentrated on the services sector for conserving economic and environmental resources. Anton and Nucu [113] suggested that renewable energy businesses may best expand their operations and give more value to customers if they can provide lower-priced goods and services to those customers. When evaluating economic growth, Saygin and Iskenderoglu [114] suggested that growth in stock market capitalization alone overestimates the impact on renewable energy use.

6. Conclusions

Although studies conducted until the late 19th century supported the natural resource blessing idea, studies conducted after that time have offered an opposing perspective based on the natural resource curse hypothesis. The impact of natural resources on the economy of different nations has been the subject of a great deal of research. This research aims to evaluate the impact of natural resource factors on Pakistan’s economic growth, considering that the findings for natural resources and their involvement in economic development vary from nation to country. The results show that industry and renewable energy use significantly negatively influence GDP, whereas coal rents, energy usage, FDI, and oil rents all have favourable effects. It is clear that the natural resource blessing idea holds true and that the pollution haven hypothesis may be plausible for foreign firms when coal rents, energy demand, and oil rents all increase with GDP. The subsequent connection between FDI and GDP is also genuine, and this is all down to the pollution haven theory. FDI and economic growth are intertwined. Businesses see Pakistan as a secure investment destination because of the country’s favourable economic regulations. Renewable energy consumption negatively correlates with economic growth because of the high cost of the necessary technology and the inability to produce enough revenue to cover all production costs. Costs associated with generating renewable energy have raised concerns about the feasibility of its use in the economy. Increases in economic growth reassure investors that consumers in a nation have the financial wherewithal to support the local economy by purchasing goods and services. The astronomical margins of profit would attract foreign investors. Foreign companies with advanced technology can introduce renewable ways to produce energy. As a consequence of the oil-driven energy resource economy, the energy hypothesis was developed, which has implications for both oil rents and renewable energy usage. Using IRF and VDA, the study found that coal rents and FDI would likely influence the country’s economic growth over time.
The following policies are recommended to sustained natural resources and move forward towards the use of green and clean energy:
I
The process of achieving economic growth is not something that can be completed in a matter of years; instead, it takes place across many generations. The only way to ensure that the economy will continue to expand not just today but also tens of years or generations from now is to make sure that the economy is dependent on forces that will not disappear at some point in the future. In this scenario, it is of the utmost importance to push the nation toward renewable resources instead of the non-renewable ones that humanity relies on today.
II
Using renewable energy sources might result in financial help and loans from other countries. Countries that engage in and encourage the generation of clean energy from renewable resources are eligible for funding and loans from international agencies such as the International Monetary Fund and the World Bank, which come with lenient terms and conditions. These types of funding have the potential to hasten the process of the nation’s economy expanding.
III
Using renewable energy sources makes it feasible to avoid disruptions in electricity supply. The limited resources accessible to satisfy all of the nation’s electrical requirements are to blame for the collapse of power plants and the lack of energy available in the country. Sunlight, water, air, and biomass are examples of abundant renewable resources in Pakistan. Suppose these resources are put to productive use. In that case, it will be possible to put an end to the country’s chronic power shortages, which will, in turn, ensure that the nation’s economic activities continue unabated.
IV
Using renewable sources may help the nation lessen its reliance on imported goods. It is estimated that around 70 percent of the energy that is generated in the world today comes from non-renewable resources. Since not all nations have been endowed with such resources, it is inescapable that these nations will need to import them. Now, imports impose significant financial strain on a nation such as Pakistan. Suppose the nation’s energy is produced using renewable resources already located there. In that case, the money that would have been spent on importing energy may be saved instead and used toward the country’s economic growth.
V
A steady flow of energy makes it possible to prevent various health problems, whether mental or physical. Shortages of energy may negatively impact the population’s physical and emotional health, which, in turn, can have a chilling effect on the country’s overall economic development. To put it another way, one method for ensuring a constant supply of energy is to create it from sources that may never run out or, succinctly, produce energy using renewable resources.
VI
The use of energy sources that do not replenish themselves negatively impacts the country’s infrastructure. The emissions and waste products that factories and automobiles expel combine to produce a layer that surrounds buildings and gradually but indeed deteriorates the materials utilized in their construction. To begin, the government will have to spend its income on rebuilding the structures, and this revenue might otherwise be used toward other activities that contribute to economic growth. Second, the decline in the condition of the buildings may have a detrimental effect on tourism, which is a significant source of income for an organization. The government will need to make up for the loss caused by both of these factors, which will eventually have the effect of slowing the development of the economy. By switching to renewable energy sources, all of this may be prevented.
VII
Consumption of renewable sources of energy leads to an increase in job opportunities. Because renewable resources are almost limitless in supply, the manufacturing facilities and businesses that rely on them are in a solid position to continue operating efficiently far into the foreseeable future and maintain healthy profit margins. This can become a rationale for domestic and international businesses to increase their level of investment in the country. When there are more investments, there are more industries, meaning there are increasing job possibilities. A nearly employed population may make an incredible contribution to economic progress.
VIII
Energy produced from renewable resources may lead to an economy reliant on exports. Suppose a nation can accomplish economic growth by the use of renewable resources. In that case, this indicates that that country’s economy is wholly reliant on the resources that are native to that country. Due to no resources from outside the nation being employed, any delay in imports, whether because of transportation issues, some global crisis, or some lack of raw materials worldwide, would affect the level of output inside the country. A nation that uses renewable resources has the potential to build an economy built on exports, and it does not need to be dependent on imports.
IX
The production of energy using non-renewable sources such as fossil fuels has direct and severe effects on people’s health, which may be seen in various ways. A population that is either ill or weak is not a resource in and of itself; instead, it is a liability. People who are struggling with their health cannot contribute to the economy’s stability, and the money spent on the health sector is an additional strain on the economy. Producing clean and green energy from renewable resources such as sunshine, air, or water is one approach that may be used to address this issue. This would be an environmentally friendly option. The harm to people’s health and the slowing of economic progress may be accomplished using this method.
X
Using renewable resources drives increasing FDI. A nation that prioritizes using clean and renewable energy sources is more likely to entice businesses from other countries to relocate there, bringing cutting-edge technology and increased chances for research. This foreign investment can boost the Gross Domestic Product of the nation in question, eventually contributing to economic development.
XI
The country of Pakistan is endowed with vast water resources, which, if these resources are not managed well, might result in catastrophic flooding. If a flood were to occur, not only would it result in the loss of human life, but it would also impact the infrastructure and agriculture. These three elements pose a threat to the whole economy since they affect all areas of the market. Building dams that not only have the capacity to hold water but can also be utilized to generate energy is one approach that might be taken to address this issue. The energy extracted from moving water is referred to as hydropower. It would not only save the government money that it would otherwise have to pay to the people in the event of floods, but it would also create energy that could be utilized for future manufacturing. Renewable energy that is produced from water has the potential to enhance economic development in a domino effect.
In so far as Pakistan’s climate is concerned, it is conducive to the continued existence of any form of life. One primary illustration is provided by flora and fauna. The country of Pakistan is quite fortunate in terms of resource wildlife. One usage that may be accomplished with the help of plants and animals is energy production by utilizing their waste products. The term for this kind of energy is the energy created from biomass. Natural resources for this manufacture are not only easy to obtainby but also an endless supply. This form of energy is virtually being created from elements that are free of cost, contributing to the expansion of the economy throughout the nation.
The limitation of the study is that it uses few natural resources in economic modelling. Future studies can expand it by adding mineral resources, energy resources, and natural gas in resource modelling that help us to obtainmore robust inferences. Further, the study is limited to a single country, while future studies can expand to the panel of Asian countries for more concrete results. Finally, the study used robust least square regression for detecting possible outliers. Future studies can use more sophisticated econometric techniques, including the breakeven regression approach and threshold regression, to obtainsound results.

Author Contributions

Conceptualization, Z.S., H.u.R.K., A.R. and K.Z.; methodology, Z.S. and K.Z.; software, Z.S. and K.Z.; validation, Z.S., H.u.R.K., A.R. and K.Z.; formal analysis, Z.S.; investigation, Z.S.; resources, H.u.R.K., A.R. and K.Z.; data curation, Z.S.; writing—original draft preparation, Z.S.; writing—review and editing, Z.S., H.u.R.K., A.R. and K.Z.; visualization, H.u.R.K., A.R. and K.Z.; supervision, K.Z.; project administration, H.u.R.K., A.R. and K.Z.; funding acquisition, K.Z. All authors have read and agreed to the published version of the manuscript.

Funding

This research received no external funding.

Institutional Review Board Statement

Not applicable.

Informed Consent Statement

Not applicable.

Data Availability Statement

The data are freely available at World Development Indicators published by World Bank (2021) at https://databank.worldbank.org/source/world-development-indicators (accessed on 29 June 2022).

Conflicts of Interest

The authors declare no conflict of interest.

References

  1. Booth, A.L.; Kessler, W.B. Understanding linkages of people, natural resources and ecosystem health. In Natural Resource Management; Routledge: London, UK, 2021; pp. 231–248. [Google Scholar]
  2. Wang, R.; Tan, J.; Yao, S. Are natural resources a blessing or a curse for economic development? The importance of energy innovations. Resour. Policy 2021, 72, 102042. [Google Scholar] [CrossRef]
  3. Kanat, O.; Yan, Z.; Asghar, M.M.; Ahmed, Z.; Mahmood, H.; Kirikkaleli, D.; Murshed, M. Do natural gas, oil, and coal consumption ameliorate environmental quality? Empirical evidence from Russia. Env. Sci. Pollut. Res. 2022, 29, 4540–4556. [Google Scholar] [CrossRef] [PubMed]
  4. McNulty, B.A.; Jowitt, S.M. Barriers to and uncertainties in understanding and quantifying global critical mineral and element supply. IScience 2021, 24, 102809. [Google Scholar] [CrossRef] [PubMed]
  5. Simaremare, S.P.; Noho, M.D. Disharmonized the regulation of biological resources and its ecosystem in Indonesia. Int. J. Crim. Socio. 2021, 10, 332–340. [Google Scholar] [CrossRef]
  6. Yadav, P.; Yadav, S.K. Natural Resources Management Towards Sustainability: An Economic Outlook. In Advances in Sustainable Development and Management of Environmental and Natural Resources; Apple Academic Press: New York, NY, USA, 2021; Volume 2, p. 377. [Google Scholar]
  7. Hasselqvist, H.; Renström, S.; Strömberg, H.; Håkansson, M. Household energy resilience: Shifting perspectives to reveal opportunities for renewable energy futures in affluent contexts. Energy Res. Soc. Sci. 2022, 88, 102498. [Google Scholar] [CrossRef]
  8. Mostafaeipour, A.; Alvandimanesh, M.; Najafi, F.; Issakhov, A. Identifying challenges and barriers for development of solar energy by using fuzzy best-worst method: A case study. Energy 2021, 226, 120355. [Google Scholar] [CrossRef]
  9. Strielkowski, W.; Civín, L.; Tarkhanova, E.; Tvaronavičienė, M.; Petrenko, Y. Renewable energy in the sustainable development of electrical power sector: A review. Energies 2021, 14, 8240. [Google Scholar] [CrossRef]
  10. Usman, M.; Khalid, K.; Mehdi, M.A. What determines environmental deficit in Asia? Embossing the role of renewable and non-renewable energy utilization. Renew. Energy 2021, 168, 1165–1176. [Google Scholar] [CrossRef]
  11. Tabelin, C.B.; Park, I.; Phengsaart, T.; Jeon, S.; Villacorte-Tabelin, M.; Alonzo, D.; Yoo, K.; Ito, M.; Hiroyoshi, N. Copper and critical metals production from porphyry ores and E-wastes: A review of resource availability, processing/recycling challenges, socio-environmental aspects, and sustainability issues. Resour. Conserv. Recyc. 2021, 170, 105610. [Google Scholar] [CrossRef]
  12. Awosusi, A.A.; Xulu, N.G.; Ahmadi, M.; Rjoub, H.; Altuntaş, M.; Uhunamure, S.E.; Akadiri, S.S.; Kirikkaleli, D. The sustainable environment in Uruguay: The roles of financial development, natural resources, and trade globalization. Front. Env. Sci. 2022, 10, 875577. [Google Scholar] [CrossRef]
  13. Tang, C.; Irfan, M.; Razzaq, A.; Dagar, V. Natural resources and financial development: Role of business regulations in testing the resource-curse hypothesis in ASEAN countries. Resour. Policy 2022, 76, 102612. [Google Scholar] [CrossRef]
  14. Bribena, K. The Dynamics and Complexities of Natural Resources and Conflicts in Angola. In Political Economy of Resource, Human Security and Environmental Conflicts in Africa; Palgrave Macmillan: Singapore, 2021; pp. 67–91. [Google Scholar]
  15. Zhang, L.; Godil, D.I.; Bibi, M.; Khan, M.K.; Sarwat, S.; Anser, M.K. Caring for the environment: How human capital, natural resources, and economic growth interact with environmental degradation in Pakistan? A dynamic ARDL approach. Sci. Total Env. 2021, 774, 145553. [Google Scholar] [CrossRef] [PubMed]
  16. Malkani, M.S.; Mahmood, Z.; Usmani, N.A.; Siraj, M. Mineral Resources of Azad Kashmir and Gilgit Baltistan, Pakistan. Geological Survey of Pakistan, Information Release. Open J. Geol. 2017, 997, 661–702. [Google Scholar]
  17. Hassan, S.T.; Xia, E.; Huang, J.; Khan, N.H.; Iqbal, K. Natural resources, globalization, and economic growth: Evidence from Pakistan. Env. Sci. Pollut. Res. 2019, 26, 15527–15534. [Google Scholar] [CrossRef] [PubMed]
  18. Asif, M. Sustainable energy options for Pakistan. Renew. Sustain. Energy Rev. 2009, 13, 903–909. [Google Scholar] [CrossRef]
  19. Ali, S.; Yan, Q.; Hussain, M.S.; Irfan, M.; Ahmad, M.; Razzaq, A.; Dagar, V.; Işık, C. Evaluating green technology strategies for the sustainable development of solar power projects: Evidence from Pakistan. Sustainability 2021, 13, 12997. [Google Scholar] [CrossRef]
  20. Yaqoob, H.; Teoh, Y.H.; Din, Z.U.; Sabah, N.U.; Jamil, M.A.; Mujtaba, M.A.; Abid, A. The potential of sustainable biogas production from biomass waste for power generation in Pakistan. J. Clean Prod. 2021, 307, 127250. [Google Scholar] [CrossRef]
  21. Kanwal, S.; Mehran, M.T.; Hassan, M.; Anwar, M.; Naqvi, S.R.; Khoja, A.H. An integrated future approach for the energy security of Pakistan: Replacement of fossil fuels with syngas for better environment and socio-economic development. Renew. Sustain. Energy Rev. 2022, 156, 111978. [Google Scholar] [CrossRef]
  22. Raza, M.Y.; Lin, B. Oil for Pakistan: What are the main factors affecting the oil import? Energy 2021, 237, 121535. [Google Scholar] [CrossRef]
  23. Sibtain, M.; Li, X.; Bashir, H.; Azam, M.I. Hydropower exploitation for Pakistan’s sustainable development: A SWOT analysis considering current situation, challenges, and prospects. Energy Strat. Rev. 2021, 38, 100728. [Google Scholar] [CrossRef]
  24. Onifade, S.T.; Gyamfi, B.A.; Haouas, I.; Bekun, F.V. Re-examining the roles of economic globalization and natural resources consequences on environmental degradation in E7 economies: Are human capital and urbanization essential components? Resour. Policy 2021, 74, 102435. [Google Scholar] [CrossRef]
  25. Iqbal, S.; Wang, Y.; Shaikh, P.A.; Maqbool, A.; Hayat, K. Exploring the asymmetric effects of renewable energy production, natural resources, and economic progress on CO2 emissions: Fresh evidence from Pakistan. Env. Pollut. Res. 2022, 29, 7067–7078. [Google Scholar] [CrossRef] [PubMed]
  26. Koondhar, M.A.; Shahbaz, M.; Ozturk, I.; Randhawa, A.A.; Kong, R. Revisiting the relationship between carbon emission, renewable energy consumption, forestry, and agricultural financial development for China. Env. Pollut. Res. 2021, 28, 45459–45473. [Google Scholar] [CrossRef] [PubMed]
  27. Muhammad, B.; Khan, M.K.; Khan, M.I.; Khan, S. Impact of foreign direct investment, natural resources, renewable energy consumption, and economic growth on environmental degradation: Evidence from BRICS, developing, developed and global countries. Env. Pollut. Res. 2021, 28, 21789–21798. [Google Scholar] [CrossRef]
  28. Muhammad, B.; Khan, S. Understanding the relationship between natural resources, renewable energy consumption, economic factors, globalization and CO2 emissions in developed and developing countries. In Natural Resources Forum; Blackwell Publishing Ltd.: Oxford, UK, 2021; Volume 45, pp. 138–156. [Google Scholar]
  29. Hao, L.N.; Umar, M.; Khan, Z.; Ali, W. Green growth and low carbon emission in G7 countries: How critical the network of environmental taxes, renewable energy and human capital is? Sci. Total Env. 2021, 752, 141853. [Google Scholar] [CrossRef]
  30. Ali, A. Natural resources depletion, renewable energy consumption and environmental degradation: A comparative analysis of developed and developing world. Int. J. Energy Econ. Policy 2021, 11, 251–260. [Google Scholar] [CrossRef]
  31. Ayobamiji, A.A.; Mata, M.N.; Ahmed, Z.; Coelho, M.F.; Altuntaş, M.; Moleiro Martins, J.; Martins, J.N.; Taiwo, O.N. How do renewable energy, economic growth and natural resources rent affect environmental sustainability in a globalized economy? Evidence from Colombia based on the gradual shift causality approach. Front. Energy Res. 2022, 9, 739721. [Google Scholar]
  32. Altinoz, B.; Dogan, E. How renewable energy consumption and natural resource abundance impact environmental degradation? New findings and policy implications from quantile approach. Energy Sources B Econ. Plan. Policy 2021, 16, 345–356. [Google Scholar] [CrossRef]
  33. Aziz, N.; Sharif, A.; Raza, A.; Jermsittiparsert, K. The role of natural resources, globalization, and renewable energy in testing the EKC hypothesis in MINT countries: New evidence from Method of Moments Quantile Regression approach. Env. Sci. Pollut. Res. 2021, 28, 13454–13468. [Google Scholar] [CrossRef]
  34. Dagar, V.; Khan, M.K.; Alvarado, R.; Rehman, A.; Irfan, M.; Adekoya, O.B.; Fahad, S. Impact of renewable energy consumption, financial development and natural resources on environmental degradation in OECD countries with dynamic panel data. Env. Sci. Pollut. Res. 2022, 29, 18202–18212. [Google Scholar] [CrossRef]
  35. Mehmood, U. Contribution of renewable energy towards environmental quality: The role of education to achieve sustainable development goals in G11 countries. Renew. Energy 2021, 178, 600–607. [Google Scholar] [CrossRef]
  36. Shao, X.; Zhong, Y.; Liu, W.; Li, R.Y. Modeling the effect of green technology innovation and renewable energy on carbon neutrality in N-11 countries? Evidence from advance panel estimations. J. Env. Manag. 2021, 296, 113189. [Google Scholar] [CrossRef] [PubMed]
  37. Khan, N.H.; Ju, Y.; Latif, Z.; Khan, K. Nexus between carbon emission, financial development, and access to electricity: Incorporating the role of natural resources and population growth. J. Pub. Aff. 2021, 21, e2131. [Google Scholar] [CrossRef]
  38. Yu-Ke, C.; Awan, R.U.; Aziz, B.; Ahmad, I.; Waseem, S. The relationship between energy consumption, natural resources, and carbon dioxide emission volatility: Empirics from G-20 economies. Env. Sci. Pollut. Res. 2022, 29, 25408–25416. [Google Scholar] [CrossRef]
  39. Shen, Y.; Su, Z.W.; Malik, M.Y.; Umar, M.; Khan, Z.; Khan, M. Does green investment, financial development and natural resources rent limit carbon emissions? A provincial panel analysis of China. Sci. Total Env. 2021, 755, 142538. [Google Scholar] [CrossRef]
  40. Ling, G.; Razzaq, A.; Guo, Y.; Fatima, T.; Shahzad, F. Asymmetric and time-varying linkages between carbon emissions, globalization, natural resources and financial development in China. Env. Dev. Sustain. 2022, 24, 6702–6730. [Google Scholar] [CrossRef]
  41. Huang, S.Z.; Sadiq, M.; Chien, F. The impact of natural resource rent, financial development, and urbanization on carbon emission. Env. Sci. Pollut. Res. 2021. [Google Scholar] [CrossRef]
  42. Hussain, M.N.; Li, Z.; Sattar, A. Effects of urbanization and nonrenewable energy on carbon emission in Africa. Env. Sci. Pollut. Res. 2022, 29, 25078–25092. [Google Scholar] [CrossRef]
  43. Ibrahim, R.L.; Ajide, K.B. Disaggregated environmental impacts of non-renewable energy and trade openness in selected G-20 countries: The conditioning role of technological innovation. Env. Sci. Pollut. Res. 2021, 28, 67496–67510. [Google Scholar] [CrossRef]
  44. Fatima, T.; Shahzad, U.; Cui, L. Renewable and nonrenewable energy consumption, trade and CO2 emissions in high emitter countries: Does the income level matter? J. Env. Plan. Manag. 2021, 64, 1227–12251. [Google Scholar] [CrossRef]
  45. Mahalik, M.K.; Mallick, H.; Padhan, H. Do educational levels influence the environmental quality? The role of renewable and non-renewable energy demand in selected BRICS countries with a new policy perspective. Renew. Energy 2021, 164, 419–432. [Google Scholar] [CrossRef]
  46. Pata, U.K. Renewable and non-renewable energy consumption, economic complexity, CO2 emissions, and ecological footprint in the USA: Testing the EKC hypothesis with a structural break. Env. Sci. Pollut. Res. 2021, 28, 846–861. [Google Scholar] [CrossRef]
  47. Anwar, A.; Siddique, M.; Dogan, E.; Sharif, A. The moderating role of renewable and non-renewable energy in environment-income nexus for ASEAN countries: Evidence from Method of Moments Quantile Regression. Renew. Energy 2021, 164, 956–967. [Google Scholar] [CrossRef]
  48. Adebayo, T.S.; AbdulKareem, H.K.; Kirikkaleli, D.; Shah, M.I.; Abbas, S. CO2 behavior amidst the COVID-19 pandemic in the United Kingdom: The role of renewable and non-renewable energy development. Renew. Energy 2022, 189, 492–501. [Google Scholar] [CrossRef]
  49. Sahoo, M.; Sahoo, J. Effects of renewable and non-renewable energy consumption on CO2 emissions in India: Empirical evidence from disaggregated data analysis. J. Pub. Aff. 2022, 22, e2307. [Google Scholar]
  50. Usman, M.; Makhdum, M.S.; Kousar, R. Does financial inclusion, renewable and non-renewable energy utilization accelerate ecological footprints and economic growth? Fresh evidence from 15 highest emitting countries. Sustain. Cities Soc. 2021, 65, 102590. [Google Scholar] [CrossRef]
  51. Zhang, L.; Yang, B.; Jahanger, A. The role of remittance inflow and renewable and non-renewable energy consumption in the environment: Accounting ecological footprint indicator for top remittance-receiving countries. Env. Sci. Pollut. Res. 2022, 29, 15915–15930. [Google Scholar] [CrossRef]
  52. Khan, A.; Chenggang, Y.; Hussain, J.; Kui, Z. Impact of technological innovation, financial development and foreign direct investment on renewable energy, non-renewable energy and the environment in belt & Road Initiative countries. Renew. Energy 2021, 171, 479–491. [Google Scholar]
  53. Sadiqa, B.A.; Zaman, K.; Rehman, F.U.; Nassani, A.A.; Haffar, M.; Abro, M.M. Evaluating race-to-the-top/bottom hypothesis in high-income countries: Controlling emissions cap trading, inbound FDI, renewable energy demand, and trade openness. Env. Sci. Pollut. Res. 2022, 29, 50552–50565. [Google Scholar] [CrossRef]
  54. Hanif, S.; Lateef, M.; Hussain, K.; Hyder, S.; Usman, B.; Zaman, K.; Asif, M. Controlling air pollution by lowering methane emissions, conserving natural resources, and slowing urbanization in a panel of selected Asian economies. PLoS ONE 2022, 17, e0271387. [Google Scholar] [CrossRef]
  55. Abbass, K.; Song, H.; Mushtaq, Z.; Khan, F. Does technology innovation matter for environmental pollution? Testing the pollution halo/haven hypothesis for Asian countries. Env. Sci. Pollut. Res. 2022. [Google Scholar] [CrossRef] [PubMed]
  56. Shaheen, F.; Lodhi, M.S.; Rosak-Szyrocka, J.; Zaman, K.; Awan, U.; Asif, M.; Ahmed, W.; Siddique, M. Cleaner Technology and Natural Resource Management: An Environmental Sustainability Perspective from China. Clean Technol. 2022, 4, 584–606. [Google Scholar] [CrossRef]
  57. Shaheen, F.; Zaman, K.; Lodhi, M.S.; Nassani, A.A.; Haffar, M.; Abro, M.M. Do affluent nations value a clean environment and preserve it? Evaluating the N-shaped environmental Kuznets curve. Env. Sci. Pollut. Res. 2022, 29, 47267–47285. [Google Scholar] [CrossRef] [PubMed]
  58. Anser, M.K.; Nassani, A.A.; Zaman, K.; Abro, M.M. Environmental and natural resource degradation in the wake of COVID-19 pandemic: A wake-up call. Env. Sci. Pollut. Res. 2022, 29, 10456–10466. [Google Scholar] [CrossRef]
  59. Yang, X.; Anser, M.K.; Yusop, Z.; Abbas, S.; Khan, M.A.; Zaman, K. Volatility in mineral resource pricing causes ecological footprints: A cloud on the horizon. Resour. Policy 2022, 77, 102673. [Google Scholar] [CrossRef]
  60. Khalil, L.; Abbas, S.; Hussain, K.; Zaman, K.; Salamun, H.; Hassan, Z.B.; Anser, M.K. Sanitation, water, energy use, and traffic volume affect environmental quality: Go-for-green developmental policies. PLoS ONE 2022, 17, e0271017. [Google Scholar] [CrossRef]
  61. Zaman, K.; Malik, M.; Awan, U.; Handayani, W.; Jabor, M.K.; Asif, M. Environmental Effects of Bio-Waste Recycling on Industrial Circular Economy and Eco-Sustainability. Recycling 2022, 7, 60. [Google Scholar]
  62. Ardiwinata, J.S.; Zaman, K.; Nassani, A.A.; Haffar, M.; Pasani, C.F.; Sriyanto, S. What is Right and What is Wrong in the Environmental Governance Model? Environmental Regulations for Improving Environmental Sustainability Ratings. Probl. Ekorozw. 2022, 17, 123–139. [Google Scholar] [CrossRef]
  63. Katz, C. The ethical duty to reduce the ecological footprint of industrialized healthcare services and facilities. In The Journal of Medicine and Philosophy: A Forum for Bioethics and Philosophy of Medicine; Oxford University Press: Oxford, UK, 2022; Volume 47, pp. 32–53. [Google Scholar]
  64. World Bank. World Development Indicators; World Bank: Washington, DC, USA, 2022. [Google Scholar]
  65. Atil, A.; Nawaz, K.; Lahiani, A.; Roubaud, D. Are natural resources a blessing or a curse for financial development in Pakistan? The importance of oil prices, economic growth and economic globalization. Resour. Policy 2020, 67, 101683. [Google Scholar] [CrossRef]
  66. Qasim, M.; Kotani, K. An empirical analysis of energy shortage in Pakistan. Asia-Pac. Dev. J. 2014, 21, 137–166. [Google Scholar] [CrossRef]
  67. Abbasi, K.; Jiao, Z.; Shahbaz, M.; Khan, A. Asymmetric impact of renewable and non-renewable energy on economic growth in Pakistan: New evidence from a nonlinear analysis. Energy Explor. Exploit 2020, 38, 1946–1967. [Google Scholar] [CrossRef]
  68. Ahmed, N.; Ahmad, M.; Ahmed, M. Combined role of industrialization and urbanization in determining carbon neutrality: Empirical story of Pakistan. Env. Sci. Pollut. Res. 2022, 29, 15551–15563. [Google Scholar]
  69. Rasiah, R.; Nazeer, N. Comparing Industrialization in Pakistan and the East Asian Economies. Lahore J. Econ. 2016, 21, 167–192. [Google Scholar] [CrossRef]
  70. Svartzman, R.; Althouse, J. Greening the international monetary system? Not without addressing the political ecology of global imbalances. Rev. Int. Politic. Econ. 2022, 29, 844–869. [Google Scholar] [CrossRef]
  71. Majeed, A.; Ye, C.; Chenyun, Y.; Wei, X. Roles of natural resources, globalization, and technological innovations in mitigation of environmental degradation in BRI economies. PLoS ONE 2022, 17, e0265755. [Google Scholar] [CrossRef]
  72. Guan, J.; Kirikkaleli, D.; Bibi, A.; Zhang, W. Natural resources rents nexus with financial development in the presence of globalization: Is the “resource curse” exist or myth? Resour. Policy 2020, 66, 101641. [Google Scholar] [CrossRef]
  73. Adams, D.; Adams, K.; Ullah, S.; Ullah, F. Globalisation, governance, accountability and the natural resource ‘curse’: Implications for socio-economic growth of oil-rich developing countries. Resour. Policy 2019, 61, 128–140. [Google Scholar] [CrossRef]
  74. Dong, B.; Zhang, Y.; Song, H. Corruption as a natural resource curse: Evidence from the Chinese coal mining. China Econ. Rev. 2019, 57, 101314. [Google Scholar] [CrossRef]
  75. Vatsa, P.; Hu, B. Intra-federal effects of oil prices: Evidence from Canada. Resour. Policy 2021, 74, 102366. [Google Scholar] [CrossRef]
  76. Oduyemi, G.O.; Owoeye, T.; Adekoya, O.B. Health outcomes and the resource curse paradox: The experience of African oil-rich countries. Resour. Policy 2021, 73, 102201. [Google Scholar] [CrossRef]
  77. Thompson, M.; Warburton, M. Decision making under contradictory certainties: How to save the Himalayas when you can’t find out what’s wrong with them. In Risk Management; Routledge: London, UK, 2019; pp. 447–478. [Google Scholar]
  78. Huber, P.J. Robust regression: Asymptotics, conjectures and Monte Carlo. Ann. Stat. 1973, 1, 799–821. [Google Scholar] [CrossRef]
  79. Rousseeuw, P.; Yohai, V. Robust regression by means of S-estimators. In Robust and Nonlinear Time Series Analysis; Springer: New York, NY, USA, 1984; pp. 256–272. [Google Scholar]
  80. Yohai, V.J. High breakdown-point and high efficiency robust estimates for regression. Ann. Stat. 1987, 15, 642–656. [Google Scholar] [CrossRef]
  81. Asiedu, M.; Yeboah, E.N.; Boakye, D.O. Natural Resources and the Economic Growth of West Africa Economies. Appl. Econ. Financ 2021, 8, 20–32. [Google Scholar] [CrossRef]
  82. Inuwa, N.; Adamu, S.; Sani, M.B.; Modibbo, H.U. Natural resource and economic growth nexus in Nigeria: A disaggregated approach. Lett. Spat. Resour. Sci. 2022, 15, 17–37. [Google Scholar] [CrossRef]
  83. Zhou, H.; Li, D.; Mustafa, F.; Altuntaş, M. Natural resources volatility and South Asian economies: Evaluating the role of COVID-19. Resour. Policy 2022, 75, 102524. [Google Scholar] [CrossRef]
  84. Abbasi, K.R.; Adedoyin, F.F. Do energy use and economic policy uncertainty affect CO2 emissions in China? Empirical evidence from the dynamic ARDL simulation approach. Env. Sci. Pollut. Res. 2021, 28, 23323–23335. [Google Scholar] [CrossRef]
  85. Haldar, S.; Sharma, G. Impact of urbanization on per capita energy use and emissions in India. Int. J. Energy Sect. Manag. 2021, 16, 191–207. [Google Scholar] [CrossRef]
  86. Adebayo, T.S.; Awosusi, A.A.; Kirikkaleli, D.; Akinsola, G.D.; Mwamba, M.N. Can CO2 emissions and energy consumption determine the economic performance of South Korea? A time series analysis. Env. Sci. Pollut. Res. 2021, 28, 38969–38984. [Google Scholar] [CrossRef]
  87. Alabdulwahab, S. The Linkage between Oil and Non-Oil GDP in Saudi Arabia. Economies 2021, 9, 202. [Google Scholar] [CrossRef]
  88. Haque, M.I. Do oil rents deter foreign direct investment? The case of Saudi Arabia. Int. J. Energy Econ. Policy 2021, 11, 212–218. [Google Scholar] [CrossRef]
  89. Sharma, G.D.; Tiwari, A.K.; Erkut, B.; Mundi, H.S. Exploring the nexus between non-renewable and renewable energy consumptions and economic development: Evidence from panel estimations. Renew. Sustain. Energy Rev. 2021, 146, 111152. [Google Scholar] [CrossRef]
  90. Zafar, M.W.; Saleem, M.M.; Destek, M.A.; Caglar, A.E. The dynamic linkage between remittances, export diversification, education, renewable energy consumption, economic growth, and CO2 emissions in top remittance-receiving countries. Sustain. Dev. 2022, 30, 165–175. [Google Scholar] [CrossRef]
  91. Hasanov, F.J.; Khan, Z.; Hussain, M.; Tufail, M. Theoretical framework for the carbon emissions effects of technological progress and renewable energy consumption. Sustain. Dev. 2021, 29, 810–822. [Google Scholar] [CrossRef]
  92. Pasaribu, D.; Lahiri-Dutt, K. Coal Reliance and Gender Equality: Is There a Connection. 2021. Available online: https://papers.ssrn.com/sol3/papers.cfm?abstract_id=3990048 (accessed on 13 September 2022).
  93. Norouzi, N.; Fani, M. Environmental sustainability and coal: The role of financial development and globalization in South Africa. Iran. J. Energy Env. 2021, 12, 68–80. [Google Scholar]
  94. Nkemgha, G.; Engone Mve, S.; Mikala, H.B.; Tékam, H. Linking natural resource dependence and industrialization in sub-Saharan African countries. Int. Rev. Appl. Econ. 2022, 36, 245–263. [Google Scholar] [CrossRef]
  95. Saidi, K.; Rahman, M.M. The link between environmental quality, economic growth, and energy use: New evidence from five OPEC countries. Env. Sys Dec. 2021, 41, 3–20. [Google Scholar] [CrossRef]
  96. Ahmad, M.; Işık, C.; Jabeen, G.; Ali, T.; Ozturk, I.; Atchike, D.W. Heterogeneous links among urban concentration, non-renewable energy use intensity, economic development, and environmental emissions across regional development levels. Sci. Total Env. 2021, 765, 144527. [Google Scholar] [CrossRef]
  97. Wada, I.; Faizulayev, A.; Bekun, F.V. Exploring the role of conventional energy consumption on environmental quality in Brazil: Evidence from cointegration and conditional causality. Gondwana Res. 2021, 98, 244–256. [Google Scholar] [CrossRef]
  98. Sabra, M.M. Does Inward FDI Promote Exports and GDP: Dynamic Panel Evidence from Selected MENA Countries. J. Appl. Econ. Bus Res. 2021, 11, 12–24. [Google Scholar]
  99. Hasan, M.A.; Nahiduzzaman, K.M.; Aldosary, A.S.; Hewage, K.; Sadiq, R. Nexus of economic growth, energy consumption, FDI and emissions: A tale of Bangladesh. Env. Dev. Sustain. 2022, 24, 6327–6348. [Google Scholar] [CrossRef]
  100. Tanoe, V. Analysis of Net Trade, FDI and GDP Growth Using Cointegration, VECM, Granger Causality and a Regression Approach: A Case Study of Sub Saharan African Region. Int. J. Afr. Stud. 2021, 1, 10–20. [Google Scholar] [CrossRef]
  101. Udemba, E.N.; Keleş, N.İ. Interactions among urbanization, industrialization and foreign direct investment (FDI) in determining the environment and sustainable development: New insight from Turkey. Asia-Pac. J. Reg. Sci. 2022, 6, 191–212. [Google Scholar] [CrossRef]
  102. Elfaki, K.E.; Handoyo, R.D.; Ibrahim, K.H. The impact of industrialization, trade openness, financial development, and energy consumption on economic growth in Indonesia. Economies 2021, 9, 174. [Google Scholar] [CrossRef]
  103. Sarode, S. Effects of FDI on capital account and GDP: Empirical evidence from India. Int. J. Bus Manag. 2012, 7, 102–107. [Google Scholar] [CrossRef] [Green Version]
  104. Chowdhury, A.; Mavrotas, G. FDI and growth: What causes what? World Econ. 2006, 29, 9–19. [Google Scholar] [CrossRef]
  105. Rahman, A. Impact of foreign direct investment on economic growth: Empirical evidence from Bangladesh. Int. J. Econ. Financ 2015, 7, 178–185. [Google Scholar] [CrossRef] [Green Version]
  106. Ozturk, I. Measuring the impact of alternative and nuclear energy consumption, carbon dioxide emissions and oil rents on specific growth factors in the panel of Latin American countries. Prog. Nucl. Energy 2017, 100, 71–81. [Google Scholar] [CrossRef]
  107. Sweidan, O.D.; Elbargathi, K. The effect of oil rent on economic development in Saudi Arabia: Comparing the role of globalization and the international geopolitical risk. Resour. Policy 2022, 75, 102469. [Google Scholar] [CrossRef]
  108. Okoye, L.U.; Adeleye, B.N.; Okoro, E.E.; Okoh, J.I.; Ezu, G.K.; Anyanwu, F.A. Effect of gas flaring, oil rent and fossil fuel on economic performance: The case of Nigeria. Resour. Policy 2022, 77, 102677. [Google Scholar] [CrossRef]
  109. Ocal, O.; Aslan, A. Renewable energy consumption–economic growth nexus in Turkey. Renew. Sustain. Energy Rev. 2013, 28, 494–499. [Google Scholar] [CrossRef]
  110. Dogan, E.; Altinoz, B.; Madaleno, M.; Taskin, D. The impact of renewable energy consumption to economic growth: A replication and extension of. Energy Econ. 2020, 90, 104866. [Google Scholar] [CrossRef]
  111. Magazzino, C. Renewable energy consumption-economic growth nexus in Italy. Int. J. Energy Econ. Policy 2017, 7, 119–127. [Google Scholar]
  112. Liu, Y.; Sadiq, F.; Ali, W.; Kumail, T. Does tourism development, energy consumption, trade openness and economic growth matters for ecological footprint: Testing the Environmental Kuznets Curve and pollution haven hypothesis for Pakistan. Energy 2022, 245, 123208. [Google Scholar] [CrossRef]
  113. Anton, S.G.; Nucu, A.E. The effect of financial development on renewable energy consumption. A Panel Data Approach. Renew. Energy 2020, 147, 330–338. [Google Scholar] [CrossRef]
  114. Saygin, O.; Iskenderoglu, O. The nexus between financial development and renewable energy consumption: A review for emerging countries. Env. Sci. Pollut. Res. 2022, 29, 14522–14533. [Google Scholar] [CrossRef] [PubMed]
Figure 1. Influence statistics. Source: Author’s estimation.
Commodities 01 00006 g001
Figure 2. Leverage plots. Source: Author’s estimate. Note: Dependent variable: GDPPC. GDPPC is GDP per capita, OIR is oil rents, CR is coal rents, EU is energy use, FDI is inbound FDI, REC is renewable energy consumption, and IND is industry value-added.
Commodities 01 00006 g002
Figure 3. IRF estimates. Source: Author’s estimation. Note: GDPPC is GDP per capita, OIR is oil rents, CR is coal rents, EU is energy use, FDI is inbound FDI, REC is renewable energy consumption, and IND is industry value-added.
Commodities 01 00006 g003
Figure 4. VDA illustrations. Source: Author’s estimation. Note: GDPPC is GDP per capita, OIR is oil rents, CR is coal rents, EU is energy use, FDI is inbound FDI, REC is renewable energy consumption, and IND is industry value-added.
Commodities 01 00006 g004
Table 1. List of variables.
VariablesSymbolsUnitDefinitionA Priori
Expectation
GDP per capita (current USD)GDPCurrent USDGDP per capita calculates GDP divided by the population.
Oil rents OIR% of GDPOil rent is the gap between the value of crude oil output in distinct places and total production costs.Positive
Coal rents CR% of GDPCoal rent is calculated by subtracting the combined value of soft and hard coal output at the global price level from the overall production cost.Positive
Energy use EUkg of oil equivalent per capitaEnergy usage is fundamental energy use. Energy used to create and transport exports is not energy utilization.Positive
Renewable energy consumption REC% of total final energy consumptionRenewable energy consumption is the quantity of energy generated and consumed from renewable resources.Positive
Foreign direct investment, net inflows FDI% of GDPTotal country inflows and outflows determine FDI.Positive
Industry
(Including construction), value added
IND% of GDPThe industrial sector’s success is measured by a country’s capacity to produce commodities, machinery, and other necessities.Positive
Table 2. Descriptive statistics.
VariablesGDPPCCREUFDIINDOIRREC
Mean660.16450.069758414.71160.81894020.372110.56294551.73952
Maximum1482.2130.156228500.43203.66832322.930921.31215058.09129
Minimum168.08040.028444299.10490.06242817.548460.14121341.74180
Standard
Deviation
396.37800.02983060.754780.7726761.5521750.2632655.479918
Skewness0.7479751.005470−0.658842.296042−0.318010.721494−0.33640
Kurtosis2.1354483.5861612.0177408.2144332.0747083.0384451.770297
Note: GDPPC is GDP per capita, OIR is oil rents, CR is coal rents, EU is energy use, FDI is inbound FDI, and IND is industry value-added.
Table 3. Correlation matrix.
VariablesGDPOIRCREURECFDIIND
GDP1
-----
OIR0.2771
(0.062)-----
CR−0.2030.0621
(0.174)(0.681)-----
EU0.7470.476−0.3621
(0.000)(0.000)(0.013)-----
REC−0.925−0.2170.238−0.8431
(0.000)(0.146)(0.109)(0.000)-----
FDI0.3240.4630.1330.627−0.4891
(0.027)(0.001)(0.376)(0.000)(0.000)-----
IND−0.5370.1530.179−0.3410.592−0.0351
(0.000)(0.309)(0.233)(0.020)(0.000)(0.815)-----
Note: GDPPC is GDP per capita, OR is oil rents, CR is coal rents, EU is energy use, FDI is inbound FDI, and IND is industry value-added. Small bracket shows probability value.
Table 4. Diagnostic testing.
TestsValueProb. ValueDecision
Jarque–Bera Test0.2940.863No normality issue in error term
Heteroskedasticity Test2.0510.087Residual is Homoscedastic
Ramsey Reset Test3.7090.061No misspecification
error in the data
Note: Test specifications checked at 5% level of significance.
Table 5. RLS estimates.
VariablesRLS-1RLS-2RLS-3
CR1518.174
(0.000)
1199.825
(0.000)
716.8206
(0.405)
EU1.463
(0.002)
2.007
(0.000)
−0.755
(0.417)
FDI-----78.845
(0.000)
−131.161
(0.000)
IND−8.712
(0.373)
−21.818
(0.000)
17.907
(0.301)
OIR116.797
(0.039)
30.56255
(0.430)
307.997
(0.001)
REC−24.241
(0.000)
-----−82.696
(0.000)
Statistical Test
R20.4470.4560.704
Adjusted R20.3780.3880.659
Note: Dependent variable: GDP. GDP is GDP per capita, OIR is oil rents, CR is coal rents, EU is energy use, FDI is inbound FDI, and IND is industry value-added.
Table 6. Variance Inflation Factor (VIF) estimates.
VariablesCoefficient
Variance
Uncentred
VIF
Centred
VIF
OIR9368.38110.266941.809457
CR71,2970.211.651281.767948
EU0.832999416.68218.568490
REC75.14324579.32056.288354
FDI1404.9375.0216352.337496
IND288.0514342.48811.933972
C51,0912.31455.428NA
Note: Dependent variable: GDP. GDPPC is GDP per capita, OIR is oil rents, CR is coal rents, EU is energy use, FDI is inbound FDI, and IND is industry value-added.
Publisher’s Note: MDPI stays neutral with regard to jurisdictional claims in published maps and institutional affiliations.

