
Can Brain–Computer Interfaces Replace Virtual Reality Controllers? A Machine Learning Movement Prediction Model during Virtual Reality Simulation Using EEG Recordings

 , ,
, ,
Abstract
:1. Introduction
2. Materials and Methods
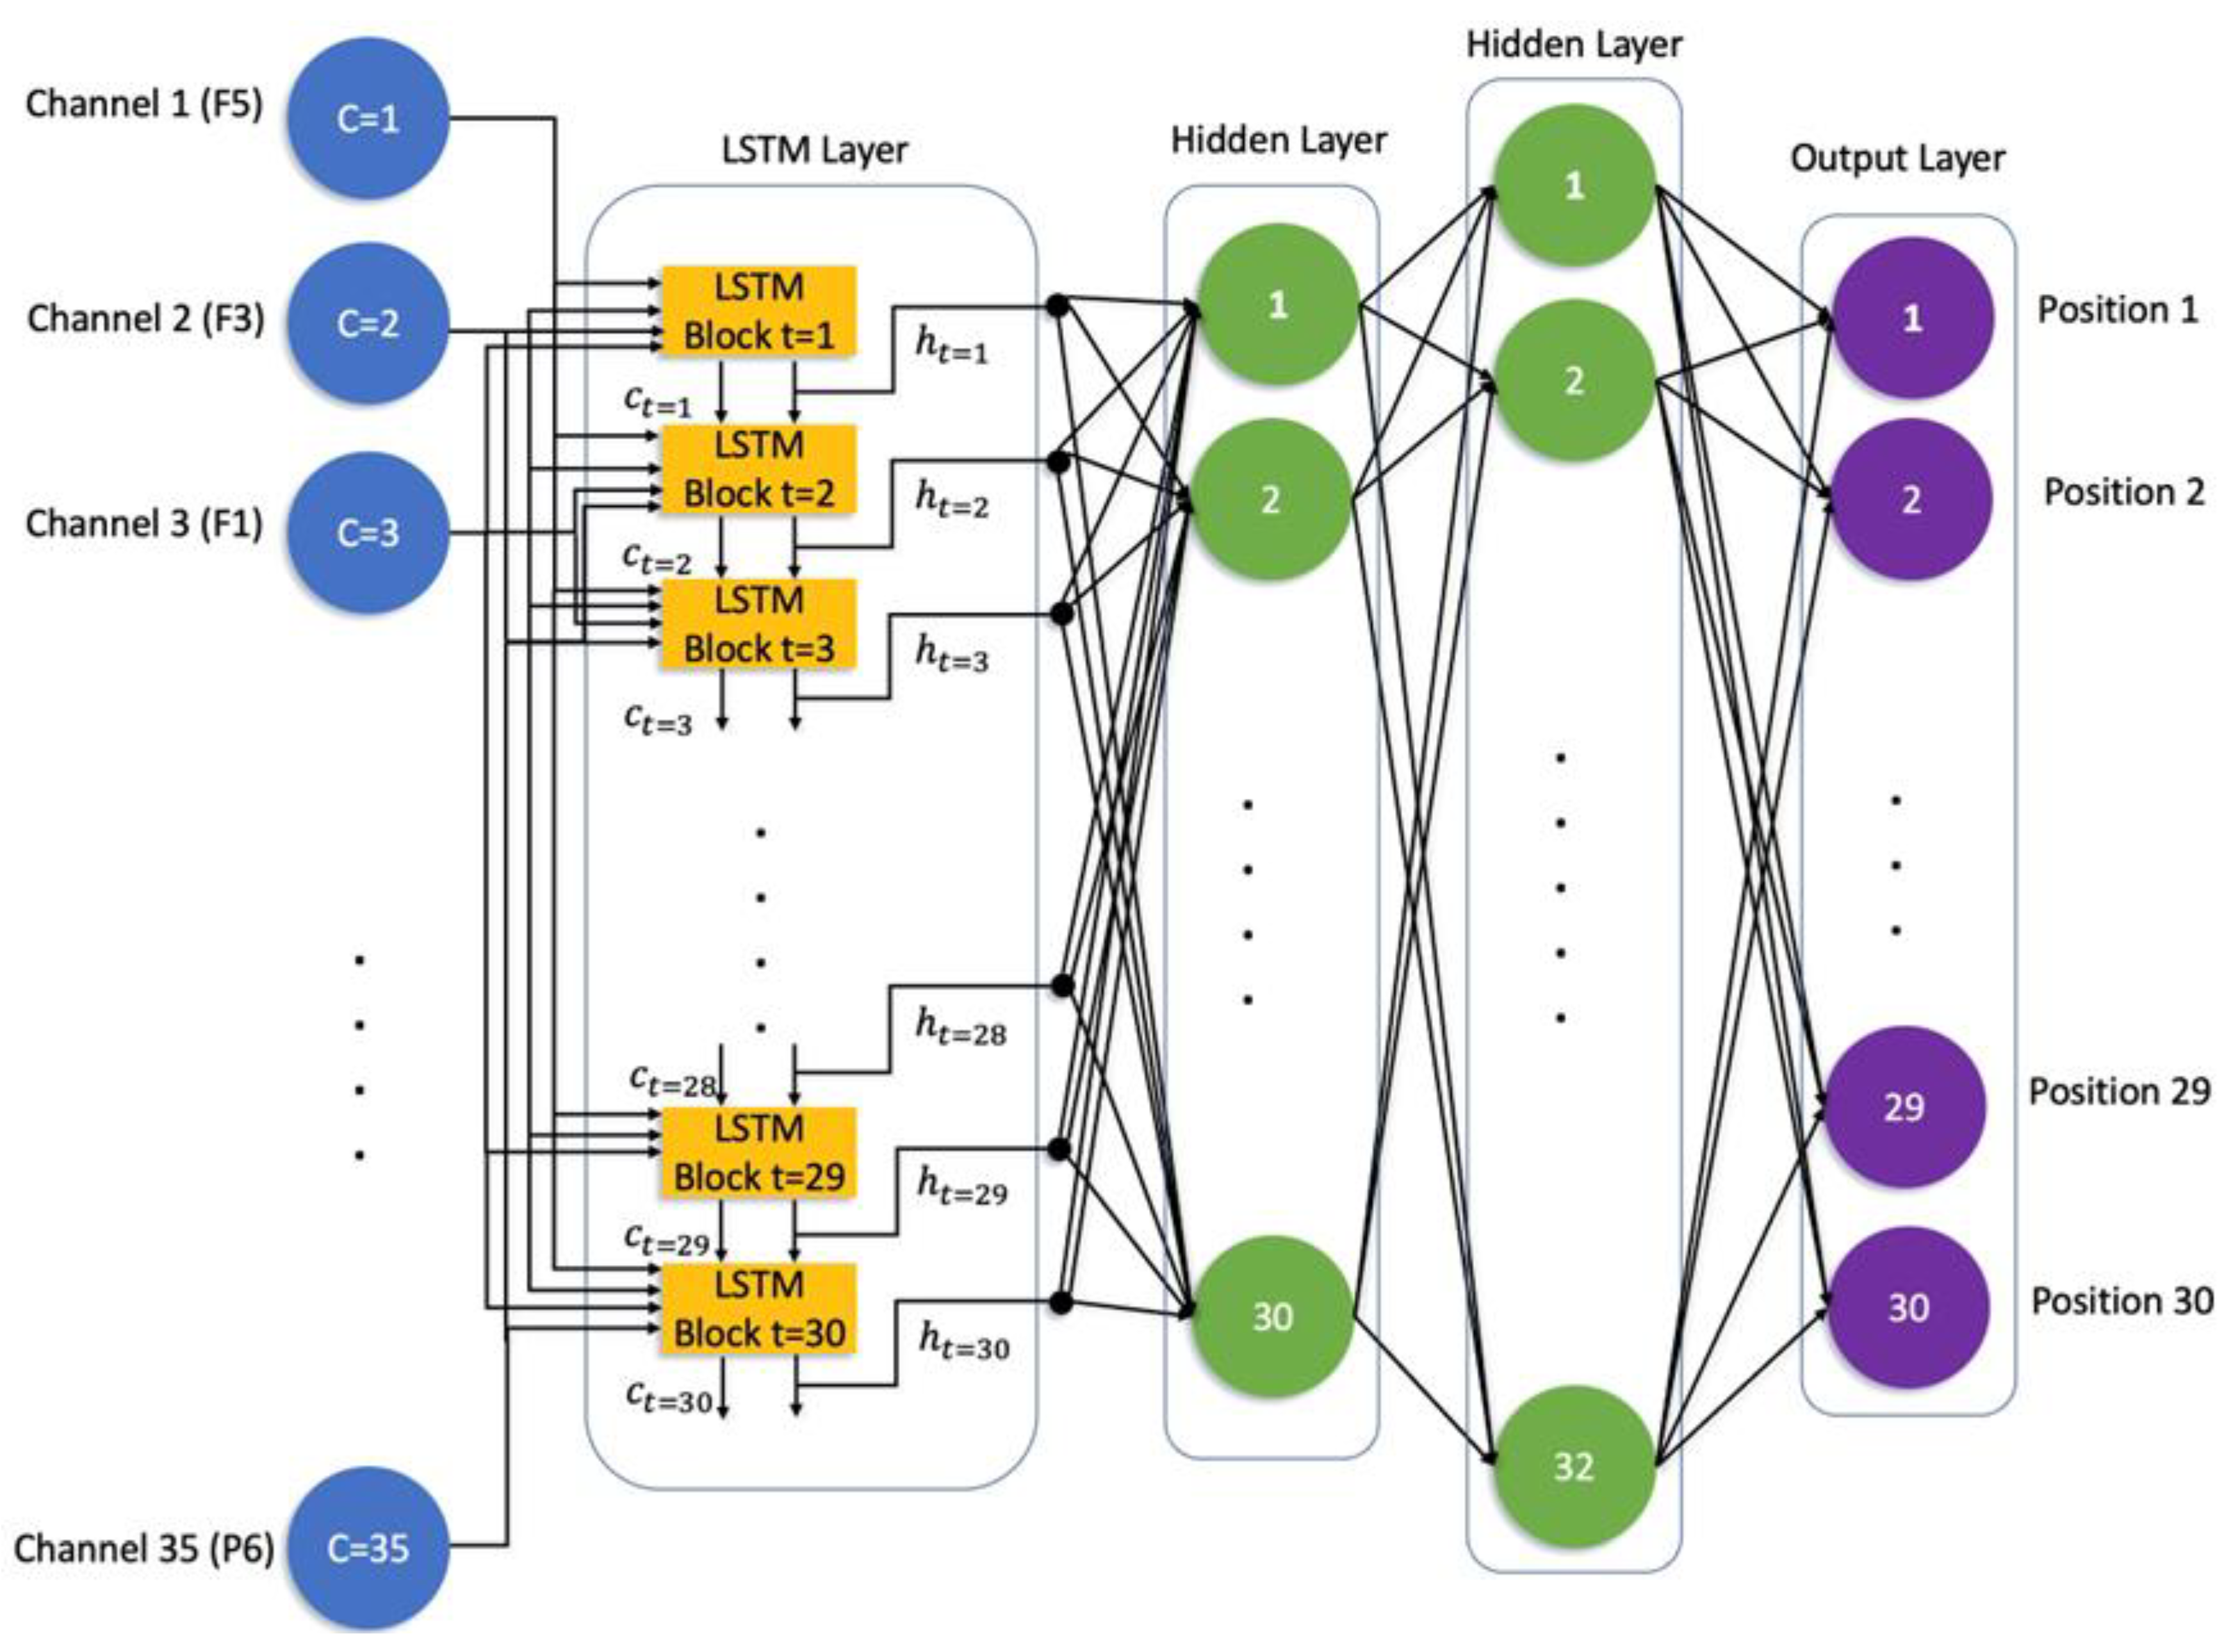
- : hyperbolic tangent function; : sigmoid function;
- W: input weights; R: recurrent weights, b: Bias.
3. Results
- True Positive refers to a sample that is correctly classified as positive, meaning that it was accurately predicted to belong to the actual class (i.e., the correct angle).
- False Positive refers to a sample that is incorrectly classified as positive, meaning that it was predicted to belong to this class while it does not belong to this class (i.e., incorrect angle).
- False Negative refers to a sample that is incorrectly classified as negative, meaning that it accurately belongs to the class, while it was predicted to belong to a different class (i.e., the correct angle).
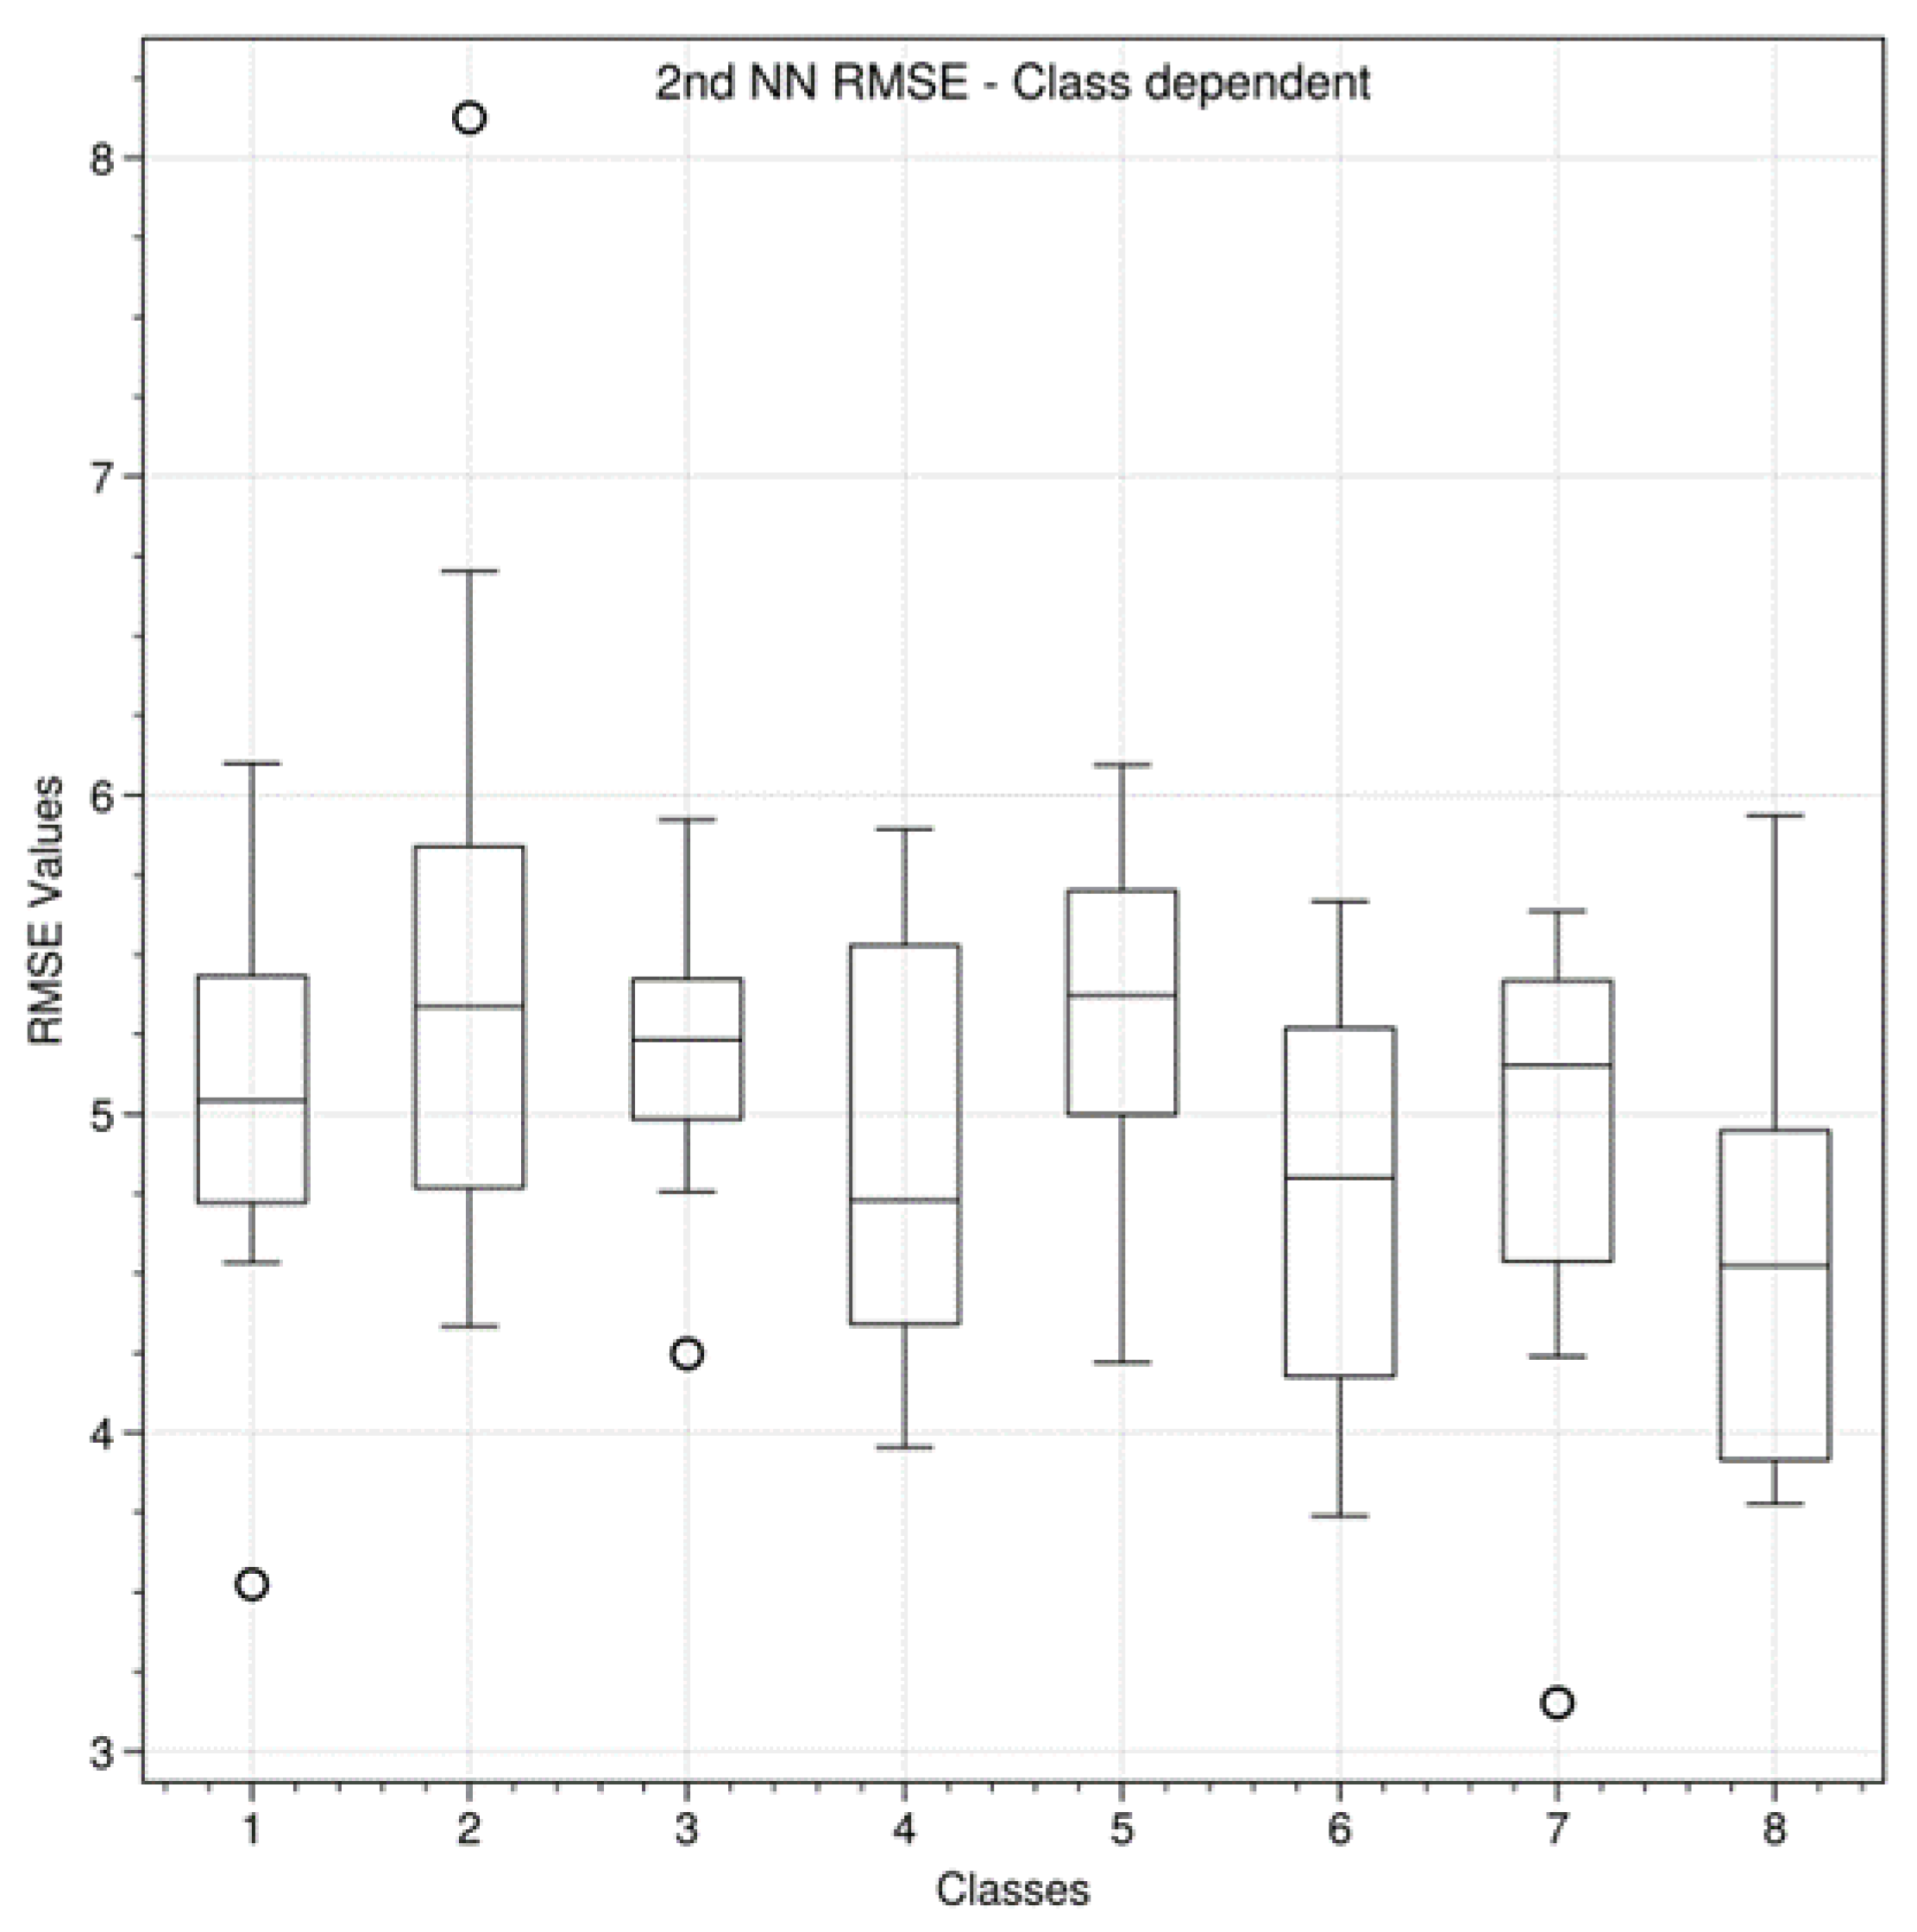
- = root mean square deviation of each test data point (i, j);
- = {1, 2, …, 8} the class/angle number;
- = {1, 2, …,100} testing data number for each class/angle;
- = variable;
- = number of data points (30 bins/points);
- = actual (x, y, z) position;
- = estimated (x, y, z) position.
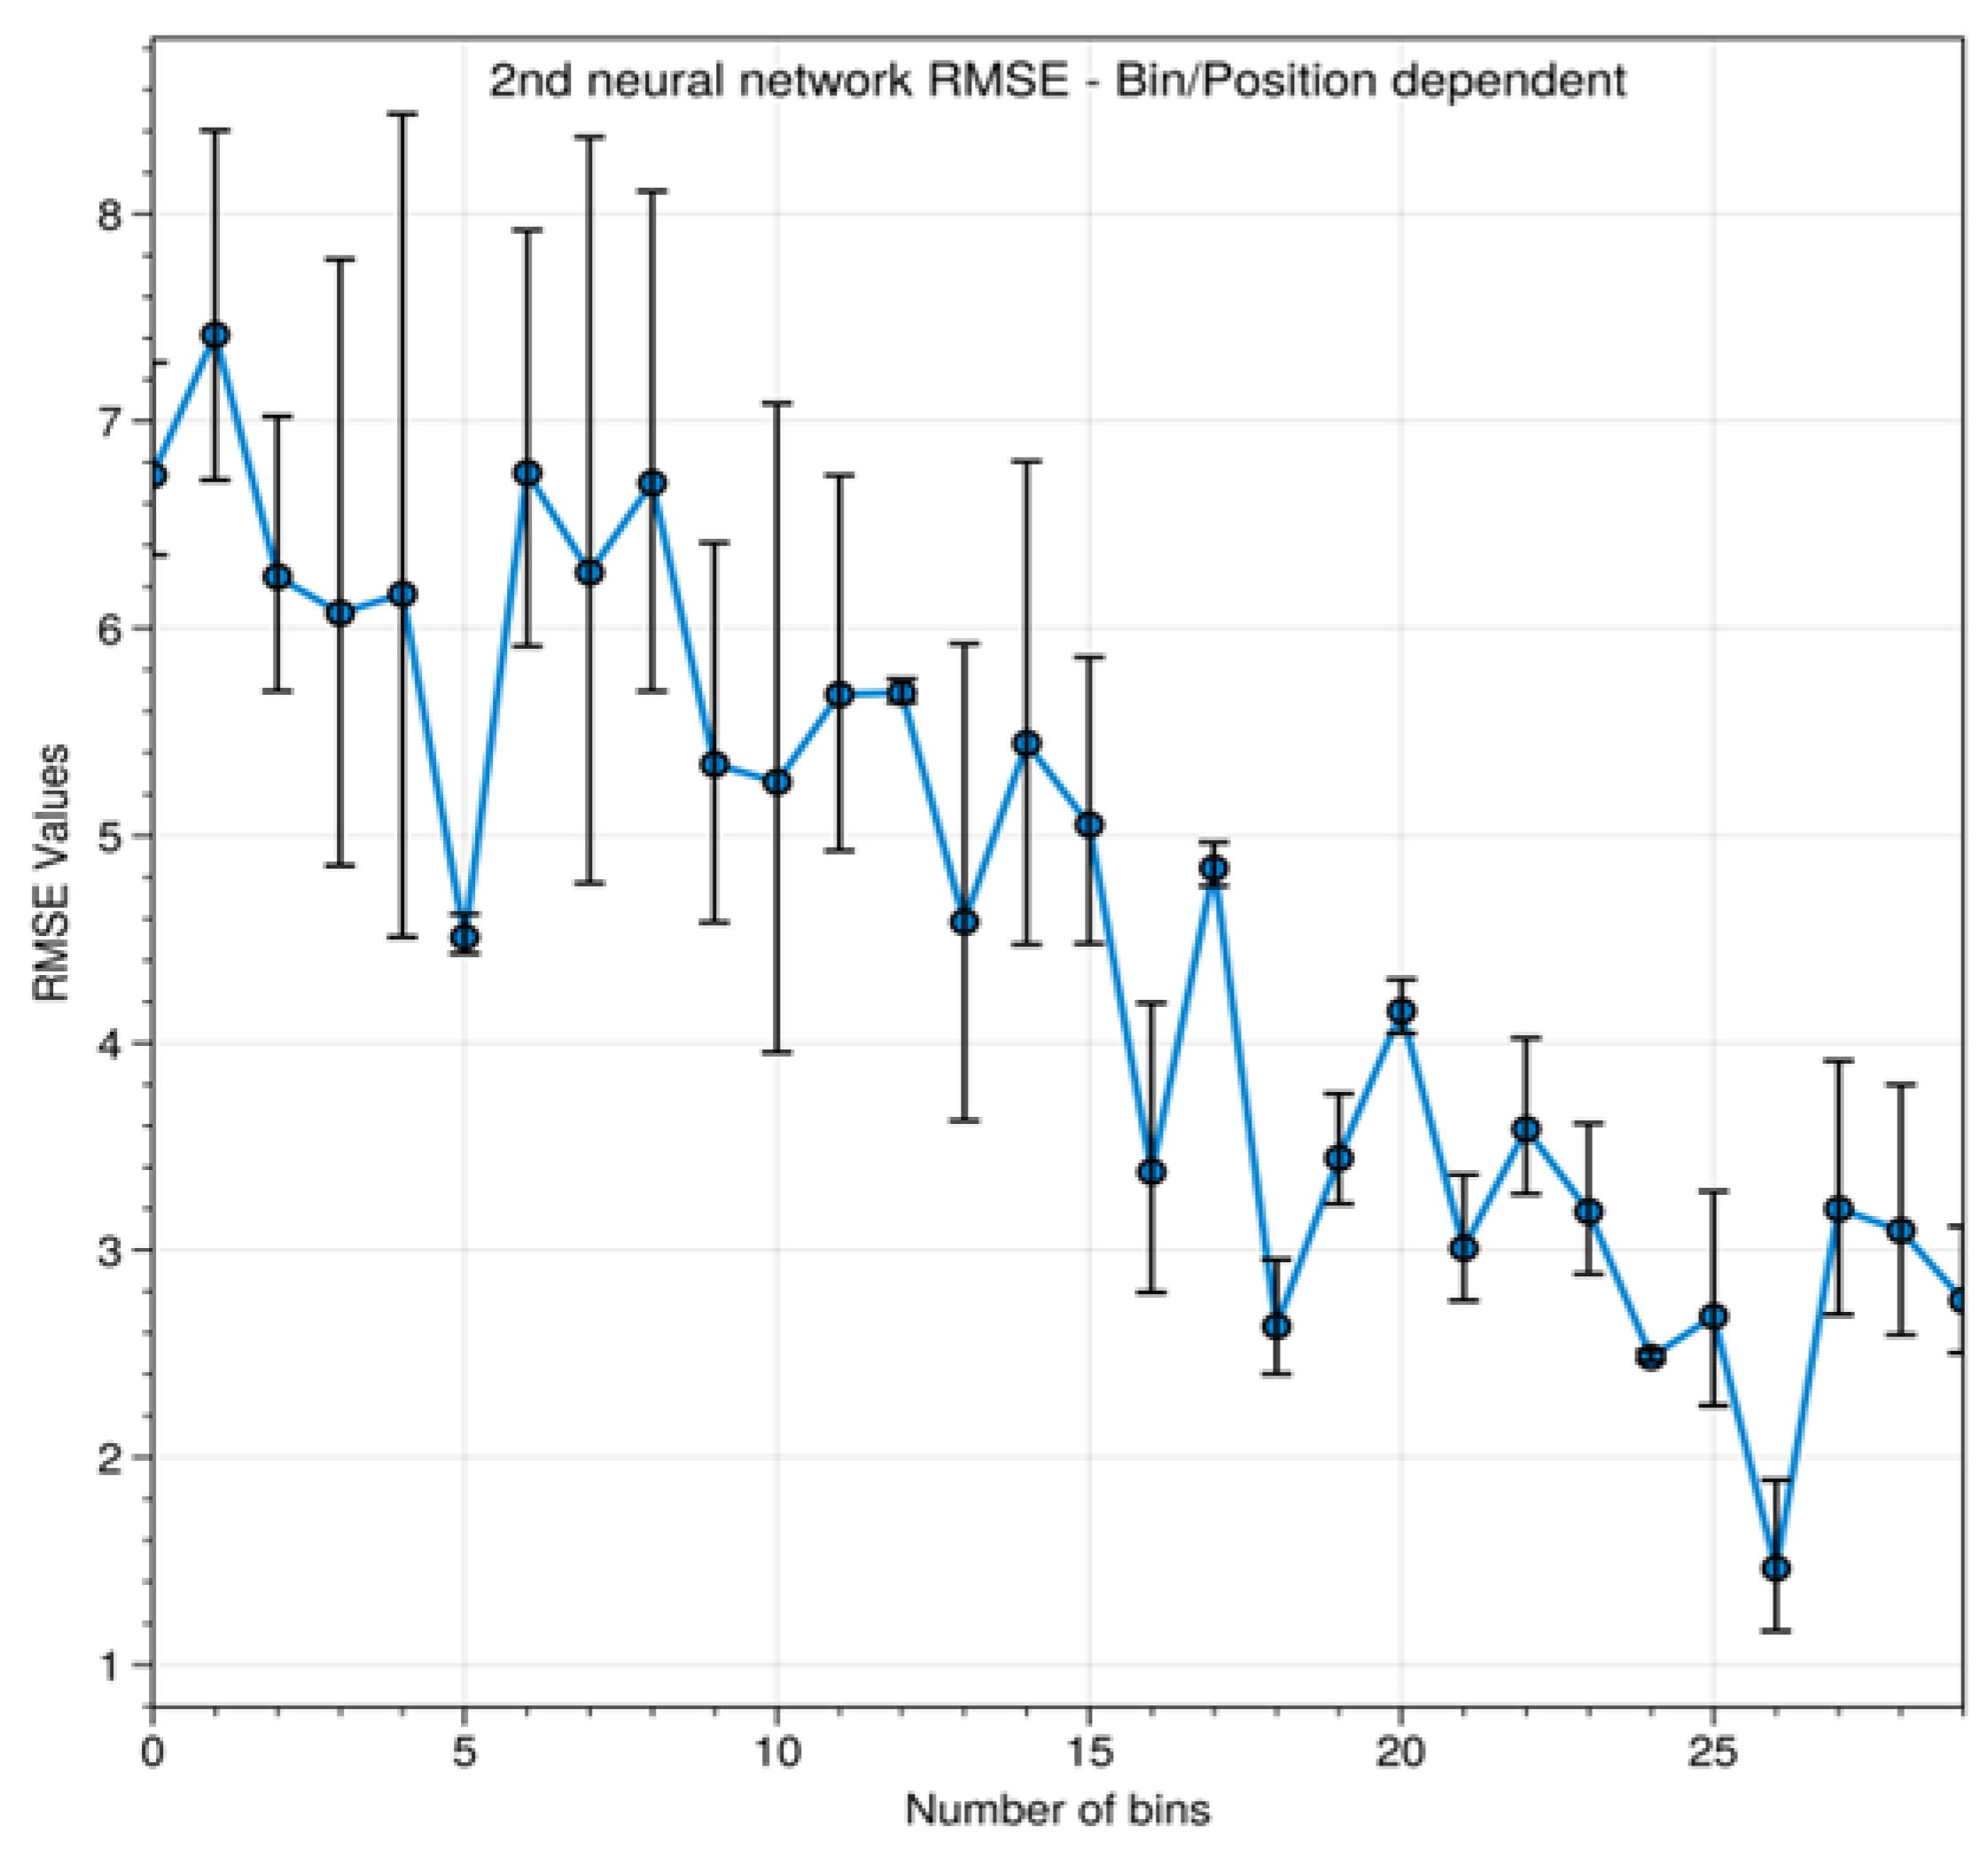
- = root mean square deviation of each test data point (i, j);
- = {1, 2, …,30} number of bins;
- = {1, 2, …, 100} testing data number of each class/angle;
- = variable;
- = 800; the number of testing data points in this bin);
- = actual (x, y, z) position;
- = estimated (x, y, z) position.
4. Discussion
4.1. Long Short-Term Memory (LSTM) Advantages
4.2. Artifacts and Noise Minimization
4.3. Participant Limitations
4.4. Virtual Reality Task Limitations
4.5. Motor Cortex Activeness
5. Conclusions
Author Contributions
Funding
Institutional Review Board Statement
Informed Consent Statement
Data Availability Statement
Conflicts of Interest
References
- Krus, M.; Hansen, K.K.; Künzel, H.M. Principles of Neural Science; McGraw-Hill: New York, NY, USA, 2000. [Google Scholar] [CrossRef]
- Bear, M.F.; Connors, B.W.; Paradiso, M.A. Neuroscience: Exploring the Brain, 4th ed.; Jones & Bartlett Learning: Burlington, MA, USA, 2015. [Google Scholar]
- Donoghue, J.P. Connecting cortex to machines: Recent advances in brain interfaces. Nat. Neurosci. 2002, 5, 1085–1088. [Google Scholar] [CrossRef] [PubMed]
- Krusienski, D.J.; McFarland, D.J.; Principe, J.C.; Wolpaw, J.; Wolpaw, E.W. BCI Signal Processing: Feature Extraction. In Brain-Computer Interfaces: Principles and Practice; Oxford University Press: New York, NY, USA, 2012. [Google Scholar] [CrossRef]
- Schwartz, A.B. Cortical Neural Prosthetics. Annu. Rev. Neurosci. 2004, 27, 487–507. [Google Scholar] [CrossRef] [PubMed] [Green Version]
- Handbook of Clinical Neurology 3RD Series. In Handbook of Clinical Neurology; Elsevier: Amsterdam, The Netherlands, 2012. [CrossRef]
- Zhao, X.; Chu, Y.; Han, J.; Zhang, Z. SSVEP-Based Brain–Computer Interface Controlled Functional Electrical Stimulation System for Upper Extremity Rehabilitation. IEEE Trans. Syst. Man Cybern. Syst. 2016, 46, 947–956. [Google Scholar] [CrossRef]
- Thorp, E.B.; Abdollahi, F.; Chen, D.; Farshchiansadegh, A.; Lee, M.-H.; Pedersen, J.P.; Pierella, C.; Roth, E.J.; Gonzalez, I.S.; Mussa-Ivaldi, F.A. Upper Body-Based Power Wheelchair Control Interface for Individuals With Tetraplegia. IEEE Trans. Neural Syst. Rehabil. Eng. 2015, 24, 249–260. [Google Scholar] [CrossRef] [PubMed] [Green Version]
- Muller, S.M.T.; Bastos-Filho, T.F.; Sarcinelli-Filho, M. Using a SSVEP-BCI to command a robotic wheelchair. In Proceedings of the ISIE 2011: 2011 IEEE International Symposium on Industrial Electronics, Gdansk, Poland, 27–30 June 2011. [Google Scholar] [CrossRef]
- Penaloza, C.I.; Nishio, S. BMI control of a third arm for multitasking. Sci. Robot. 2018, 3, eaat1228. [Google Scholar] [CrossRef] [Green Version]
- Peterson, V.; Galván, C.; Hernández, H.; Spies, R. A feasibility study of a complete low-cost consumer-grade brain-computer interface system. Heliyon 2020, 6, e03425. [Google Scholar] [CrossRef]
- Negoita, S.; Boone, C.; Anderson, W.S. Long-term Training with a Brain-Machine Interface-Based Gait Protocol Induces Partial Neurological Recovery in Paraplegic Patients. Neurosurgery 2016, 79, N22–N24. [Google Scholar] [CrossRef] [PubMed] [Green Version]
- Chase, S.M.; Kass, R.E.; Schwartz, A.B.; Lebedev, M.A.; Nicolelis, M.A.L.; Boulay, C.B.; Pieper, F.; Leavitt, M.; Martinez-Trujillo, J.; Sachs, A.J.; et al. Behavioral and neural correlates of visuomotor adaptation observed through a brain-computer interface in primary motor cortex. J. Neurophysiol. 2012, 108, 624–644. [Google Scholar] [CrossRef] [PubMed] [Green Version]
- Mirabella, G.; Lebedev, M. Interfacing to the brain’s motor decisions. J. Neurophysiol. 2017, 117, 1305–1319. [Google Scholar] [CrossRef]
- Horikawa, T.; Aoki, S.C.; Tsukamoto, M.; Kamitani, Y. Characterization of deep neural network features by decodability from human brain activity. Sci. Data 2019, 6, 190012. [Google Scholar] [CrossRef] [PubMed] [Green Version]
- Ye, H.; Liang, L.; Li, G.Y.; Juang, B.-H. Deep Learning-Based End-to-End Wireless Communication Systems With Conditional GANs as Unknown Channels. IEEE Trans. Wirel. Commun. 2020, 19, 3133–3143. [Google Scholar] [CrossRef] [Green Version]
- Wang, X.; Liang, X.; Jiang, Z.; Nguchu, B.A.; Zhou, Y.; Wang, Y.; Wang, H.; Li, Y.; Zhu, Y.; Wu, F.; et al. Decoding and mapping task states of the human brain via deep learning. Hum. Brain Mapp. 2019, 41, 1505–1519. [Google Scholar] [CrossRef] [PubMed]
- Hussain, I.; Park, S.J. Big-ECG: Cardiographic Predictive Cyber-Physical System for Stroke Management. IEEE Access 2021, 9, 123146–123164. [Google Scholar] [CrossRef]
- Park, S.J.; Hussain, I.; Hong, S.; Kim, D.; Park, H.; Benjamin, H.C.M. Real-time Gait Monitoring System for Consumer Stroke Prediction Service. In Proceedings of the 2020 IEEE International Conference on Consumer Electronics (ICCE), Las Vegas, NV, USA, 4–6 January 2020. [Google Scholar] [CrossRef]
- Hussain, I.; Young, S.; Kim, C.H.; Benjamin, H.C.M.; Park, S.J. Quantifying Physiological Biomarkers of a Microwave Brain Stimulation Device. Sensors 2021, 21, 1896. [Google Scholar] [CrossRef]
- Hussain, I.; Park, S.-J. Prediction of Myoelectric Biomarkers in Post-Stroke Gait. Sensors 2021, 21, 5334. [Google Scholar] [CrossRef]
- Hussain, I.; Park, S.-J. Quantitative Evaluation of Task-Induced Neurological Outcome after Stroke. Brain Sci. 2021, 11, 900. [Google Scholar] [CrossRef]
- Hussain, I.; Park, S.J. HealthSOS: Real-Time Health Monitoring System for Stroke Prognostics. IEEE Access 2020, 8, 213574–213586. [Google Scholar] [CrossRef]
- Blakey, S.M.; Abramowitz, J.S. The effects of safety behaviors during exposure therapy for anxiety: Critical analysis from an inhibitory learning perspective. Clin. Psychol. Rev. 2016, 49, 1–15. [Google Scholar] [CrossRef]
- Bun, P.; Gorski, F.; Grajewski, D.; Wichniarek, R.; Zawadzki, P. Low—Cost Devices Used in Virtual Reality Exposure Therapy. Procedia Comput. Sci. 2017, 104, 445–451. [Google Scholar] [CrossRef]
- Gainsford, K.; Fitzgibbon, B.; Fitzgerald, P.B.; E Hoy, K. Transforming treatments for schizophrenia: Virtual reality, brain stimulation and social cognition. Psychiatry Res. 2020, 288, 112974. [Google Scholar] [CrossRef]
- Kritikos, J.; Alevizopoulos, G.; Koutsouris, D. Personalized Virtual Reality Human-Computer Interaction for Psychiatric and Neurological Illnesses: A Dynamically Adaptive Virtual Reality Environment that Changes According to Real-Time Feedback from Electrophysiological Signal Responses. Front. Hum. Neurosci. 2021, 15, 596980. [Google Scholar] [CrossRef] [PubMed]
- Caravas, P.; Kritikos, J.; Alevizopoulos, G.; Koutsouris, D. Participant Modeling: The Use of a Guided Master in the Modern World of Virtual Reality Exposure Therapy Targeting Fear of Heights. In Proceedings of the Wearables in Healthcare: Second EAI International Conference, HealthWear 2020, Virtual Event, 10–11 December 2020; Springer: Berlin/Heidelberg, Germany, 2021; Volume 376, pp. 161–174. [Google Scholar] [CrossRef]
- Song, F. 3D Virtual Reality Implementation of Tourist Attractions Based on the Deep Belief Neural Network. Comput. Intell. Neurosci. 2021, 2021, 9004797. [Google Scholar] [CrossRef] [PubMed]
- Jeong, D.; Yoo, S.; Jang, Y. Motion Sickness Measurement and Analysis in Virtual Reality using Deep Neural Networks Algorithm. J. Korea Comput. Graph. Soc. 2019, 25, 23–32. [Google Scholar] [CrossRef] [Green Version]
- Xu, S.; Wang, Z.; Sun, J.; Zhang, Z.; Wu, Z.; Yang, T.; Xue, G.; Cheng, C. Retraction to using a deep recurrent neural network with EEG signal to detect Parkinson’s disease. Ann. Transl. Med. 2021, 9, 1396. [Google Scholar] [CrossRef]
- Ma, Q.; Wang, M.; Hu, L.; Zhang, L.; Hua, Z. A Novel Recurrent Neural Network to Classify EEG Signals for Customers’ Decision-Making Behavior Prediction in Brand Extension Scenario. Front. Hum. Neurosci. 2021, 15, 610890. [Google Scholar] [CrossRef]
- Brantley, J.A.; Luu, T.P.; Ozdemir, R.; Zhu, F.; Winslow, A.T.; Huang, H.; Contreras-Vidal, J.L. Noninvasive EEG correlates of overground and stair walking. In Proceedings of the 2016 38th Annual International Conference of the IEEE Engineering in Medicine and Biology Society (EMBC), Orlando, FL, USA, 16–20 August 2016. [Google Scholar] [CrossRef]
- Naufel, S.; Glaser, J.I.; Kording, K.P.; Perreault, E.; Miller, L.E. A muscle-activity-dependent gain between motor cortex and EMG. J. Neurophysiol. 2019, 121, 61–73. [Google Scholar] [CrossRef] [Green Version]
- Hofmann, S.M.; Klotzsche, F.; Mariola, A.; Nikulin, V.; Villringer, A.; Gaebler, M. Decoding subjective emotional arousal from EEG during an immersive virtual reality experience. eLife 2021, 10, e64812. [Google Scholar] [CrossRef]
- Nakagome, S.; Luu, T.P.; He, Y.; Ravindran, A.S.; Contreras-Vidal, J.L. An empirical comparison of neural networks and machine learning algorithms for EEG gait decoding. Sci. Rep. 2020, 10, 4372. [Google Scholar] [CrossRef] [PubMed] [Green Version]
- Jeong, J.-H.; Shim, K.-H.; Kim, D.-J.; Lee, S.-W. Brain-Controlled Robotic Arm System Based on Multi-Directional CNN-BiLSTM Network Using EEG Signals. IEEE Trans. Neural Syst. Rehabil. Eng. 2020, 28, 1226–1238. [Google Scholar] [CrossRef]
- Tortora, S.; Ghidoni, S.; Chisari, C.; Micera, S.; Artoni, F. Deep learning-based BCI for gait decoding from EEG with LSTM recurrent neural network. J. Neural Eng. 2020, 17, 046011. [Google Scholar] [CrossRef]
- Wu, J.; Ma, Y.; Ren, Z. Rehabilitative Effects of Virtual Reality Technology for Mild Cognitive Impairment: A Systematic Review with Meta-Analysis. Front. Psychol. 2020, 11, 1811. [Google Scholar] [CrossRef]
- Repovš, G. Dealing with Noise in EEG Recording and Data Analysis. Inform. Med. Slov. 2010, 15, 18–25. [Google Scholar]
- Leske, S.; Dalal, S. Reducing power line noise in EEG and MEG data via spectrum interpolation. Neuroimage 2019, 189, 763–776. [Google Scholar] [CrossRef]
- Shad, E.H.T.; Molinas, M.; Ytterdal, T. Impedance and Noise of Passive and Active Dry EEG Electrodes: A Review. IEEE Sensors J. 2020, 20, 14565–14577. [Google Scholar] [CrossRef]
- Che, Z.; Purushotham, S.; Cho, K.; Sontag, D.; Liu, Y. Recurrent Neural Networks for Multivariate Time Series with Missing Values. Sci. Rep. 2018, 8, 6085. [Google Scholar] [CrossRef] [Green Version]
- Borovkova, S.; Tsiamas, I. An ensemble of LSTM neural networks for high-frequency stock market classification. J. Forecast. 2019, 38, 600–619. [Google Scholar] [CrossRef] [Green Version]
- Chen, D.; Zhang, J.; Jiang, S. Forecasting the Short-Term Metro Ridership With Seasonal and Trend Decomposition Using Loess and LSTM Neural Networks. IEEE Access 2020, 8, 91181–91187. [Google Scholar] [CrossRef]
- Pooja; Pahuja, S.; Veer, K. Recent Approaches on Classification and Feature Extraction of EEG Signal: A Review. Robotica 2021, 40, 77–101. [Google Scholar] [CrossRef]
- Mohseni, M.; Shalchyan, V.; Jochumsen, M.; Niazi, I.K. Upper limb complex movements decoding from pre-movement EEG signals using wavelet common spatial patterns. Comput. Methods Programs Biomed. 2020, 183, 105076. [Google Scholar] [CrossRef] [PubMed]
- Sburlea, A.I.; Montesano, L.; de la Cuerda, R.C.; Diego, I.M.A.; Miangolarra-Page, J.C.; Minguez, J. Detecting intention to walk in stroke patients from pre-movement EEG correlates. J. Neuroeng. Rehabil. 2015, 12, 113. [Google Scholar] [CrossRef] [Green Version]
- Hasan, S.M.S.; Siddiquee, M.R.; Atri, R.; Ramon, R.; Marquez, J.S.; Bai, O. Prediction of gait intention from pre-movement EEG signals: A feasibility study. J. Neuroeng. Rehabil. 2020, 17, 50. [Google Scholar] [CrossRef] [PubMed] [Green Version]
- Özmen, N.G. Eeg Analysis of Real and Imaginary Arm Movements by Spectral Coherence. Uludağ Univ. J. Fac. Eng. 2021, 26, 109–126. [Google Scholar] [CrossRef]
- Filimon, F. Human Cortical Control of Hand Movements: Parietofrontal Networks for Reaching, Grasping, and Pointing. Neurosci. 2010, 16, 388–407. [Google Scholar] [CrossRef] [PubMed]
- Ball, T.; Demandt, E.; Mutschler, I.; Neitzel, E.; Mehring, C.; Vogt, K.; Aertsen, A.; Schulze-Bonhage, A. Movement related activity in the high gamma range of the human EEG. Neuroimage 2008, 41, 302–310. [Google Scholar] [CrossRef]
- Kim, J.-H.; Biessmann, F.; Lee, S.-W. Decoding Three-Dimensional Trajectory of Executed and Imagined Arm Movements from Electroencephalogram Signals. IEEE Trans. Neural Syst. Rehabil. Eng. 2015, 23, 867–876. [Google Scholar] [CrossRef]
- Schellekens, W.; Bakker, C.; Ramsey, N.F.; Petridou, N. Moving in on human motor cortex. Characterizing the relationship between body parts with non-rigid population response fields. PLOS Comput. Biol. 2022, 18, e1009955. [Google Scholar] [CrossRef]
- Planelles, D.; Hortal, E.; Costa, Á.; Úbeda, A.; Iáez, E.; Azorín, J.M. Evaluating Classifiers to Detect Arm Movement Intention from EEG Signals. Sensors 2014, 14, 18172–18186. [Google Scholar] [CrossRef] [Green Version]
- Kritikos, J.; Zoitaki, C.; Tzannetos, G.; Mehmeti, A.; Douloudi, M.; Nikolaou, G.; Alevizopoulos, G.; Koutsouris, D. Comparison between Full Body Motion Recognition Camera Interaction and Hand Controllers Interaction used in Virtual Reality Exposure Therapy for Acrophobia. Sensors 2020, 20, 1244. [Google Scholar] [CrossRef] [Green Version]
- Kritikos, J.; Mehmeti, A.; Nikolaou, G.; Koutsouris, D. Fully portable low-cost motion capture system with real-time feedback for rehabilitation treatment. In Proceedings of the International Conference on Virtual Rehabilitation, ICVR, Tel Aviv, Israel, 21–24 July 2019. [Google Scholar] [CrossRef]
- Kritikos, J.; Poulopoulou, S.; Zoitaki, C.; Douloudi, M.; Koutsouris, D. Full Body Immersive Virtual Reality System with Motion Recognition Camera Targeting the Treatment of Spider Phobia. In Pervasive Computing Paradigms for Mental Health; Cipresso, P., Serino, S., Villani, D., Eds.; Springer International Publishing: Berlin/Heidelberg, Germany, 2019; Volume 288, pp. 216–230. [Google Scholar] [CrossRef]
- Alevizopoulos, A.; Kritikos, J.; Alevizopoulos, G. Intelligent machines and mental health in the era of COVID-19. Psychiatriki 2021, 32, 99–102. [Google Scholar] [CrossRef]
- Kritikos, J.; Caravas, P.; Tzannetos, G.; Douloudi, M.; Koutsouris, D. Emotional stimulation during motor exercise: An integration to the holistic rehabilitation framework. In Proceedings of the 2019 41st Annual International Conference of the IEEE Engineering in Medicine and Biology Society (EMBC), Berlin, Germany, 23–27 July 2019; Volume 2019, pp. 4604–4610. [Google Scholar] [CrossRef]
- Kritikos, J.; Tzannetos, G.; Zoitaki, C.; Poulopoulou, S.; Koutsouris, D. Anxiety detection from Electrodermal Activity Sensor with movement & interaction during Virtual Reality Simulation. In Proceedings of the International IEEE/EMBS Conference on Neural Engineering, NER, San Francisco, CA, USA, 20–23 March 2019. [Google Scholar] [CrossRef]
- Tromp, J.; Peeters, D.; Meyer, A.S.; Hagoort, P. The combined use of virtual reality and EEG to study language processing in naturalistic environments. Behav. Res. Methods 2017, 50, 862–869. [Google Scholar] [CrossRef] [Green Version]
- Baumgartner, T.; Valko, L.; Esslen, M.; Jäncke, L. Neural Correlate of Spatial Presence in an Arousing and Noninteractive Virtual Reality: An EEG and Psychophysiology Study. CyberPsychology Behav. 2006, 9, 30–45. [Google Scholar] [CrossRef] [Green Version]
- Bayliss, J.D.; Ballard, D.H. Single trial P3 epoch recognition in a virtual environment. Neurocomputing 2000, 32–33, 637–642. [Google Scholar] [CrossRef]
- Vortmann, L.-M.; Kroll, F.; Putze, F. EEG-Based Classification of Internally- and Externally-Directed Attention in an Augmented Reality Paradigm. Front. Hum. Neurosci. 2019, 13, 348. [Google Scholar] [CrossRef] [PubMed] [Green Version]
- Tremmel, C.; Herff, C.; Sato, T.; Rechowicz, K.; Yamani, Y.; Krusienski, D.J. Estimating Cognitive Workload in an Interactive Virtual Reality Environment Using EEG. Front. Hum. Neurosci. 2019, 13, 401. [Google Scholar] [CrossRef] [PubMed]


| Expected Class/Angles | |||||||||
|---|---|---|---|---|---|---|---|---|---|
| 1 | 2 | 3 | 4 | 5 | 6 | 7 | 8 | ||
| Predicted Class/Angles | 1 | 88 | 7 | 3 | 0 | 0 | 2 | 0 | 0 |
| 2 | 2 | 86 | 4 | 0 | 3 | 1 | 4 | 0 | |
| 3 | 0 | 2 | 82 | 14 | 0 | 2 | 0 | 0 | |
| 4 | 0 | 0 | 16 | 76 | 2 | 4 | 2 | 0 | |
| 5 | 0 | 0 | 1 | 9 | 81 | 5 | 4 | 0 | |
| 6 | 4 | 0 | 0 | 0 | 5 | 91 | 0 | 0 | |
| 7 | 0 | 8 | 1 | 0 | 0 | 0 | 91 | 0 | |
| 8 | 2 | 0 | 5 | 0 | 0 | 5 | 0 | 88 | |
| Class | Precision | Recall/Sensitivity | F1-Score | Specificity | Negative Predictive Value |
|---|---|---|---|---|---|
| 1 | 0.88 | 0.92 | 0.90 | 0.98 | 0.99 |
| 2 | 0.86 | 0.83 | 0.85 | 0.98 | 0.98 |
| 3 | 0.82 | 0.73 | 0.77 | 0.97 | 0.96 |
| 4 | 0.76 | 0.76 | 0.76 | 0.97 | 0.97 |
| 5 | 0.80 | 0.89 | 0.84 | 0.97 | 0.99 |
| 6 | 0.91 | 0.83 | 0.87 | 0.99 | 0.97 |
| 7 | 0.91 | 0.90 | 0.91 | 0.99 | 0.99 |
| 8 | 0.88 | 1.00 | 0.94 | 0.98 | 1.00 |
Disclaimer/Publisher’s Note: The statements, opinions and data contained in all publications are solely those of the individual author(s) and contributor(s) and not of MDPI and/or the editor(s). MDPI and/or the editor(s) disclaim responsibility for any injury to people or property resulting from any ideas, methods, instructions or products referred to in the content. |
© 2023 by the authors. Licensee MDPI, Basel, Switzerland. This article is an open access article distributed under the terms and conditions of the Creative Commons Attribution (CC BY) license (https://creativecommons.org/licenses/by/4.0/).
Share and Cite
Kritikos, J.; Makrypidis, A.; Alevizopoulos, A.; Alevizopoulos, G.; Koutsouris, D. Can Brain–Computer Interfaces Replace Virtual Reality Controllers? A Machine Learning Movement Prediction Model during Virtual Reality Simulation Using EEG Recordings. Virtual Worlds 2023, 2, 182-202. https://doi.org/10.3390/virtualworlds2020011
Kritikos J, Makrypidis A, Alevizopoulos A, Alevizopoulos G, Koutsouris D. Can Brain–Computer Interfaces Replace Virtual Reality Controllers? A Machine Learning Movement Prediction Model during Virtual Reality Simulation Using EEG Recordings. Virtual Worlds. 2023; 2(2):182-202. https://doi.org/10.3390/virtualworlds2020011
Chicago/Turabian StyleKritikos, Jacob, Alexandros Makrypidis, Aristomenis Alevizopoulos, Georgios Alevizopoulos, and Dimitris Koutsouris. 2023. "Can Brain–Computer Interfaces Replace Virtual Reality Controllers? A Machine Learning Movement Prediction Model during Virtual Reality Simulation Using EEG Recordings" Virtual Worlds 2, no. 2: 182-202. https://doi.org/10.3390/virtualworlds2020011