Article

Amount of Fill Product Residues in Plastic Packagings for Recycling

1
Department for Technical Systems, Processes and Communication, Munich University of Applied Sciences HM, Lothstraße 38, 80335 Munich, Germany
2
STADLER® Anlagenbau GmbH, 88361 Altshausen, Germany
3
PreZero Recycling Süd GmbH, 75248 Ölbronn-Dürrn, Germany
4
Faculty of Mechanical Engineering, University of Applied Science Kempten, Bahnhofstraße 61, 87435 Kempten, Germany
5
Fraunhofer Institute for Process Engineering and Packaging IVV, Giggenhauser Straße 35, 85354 Freising, Germany
*
Author to whom correspondence should be addressed.
Waste 2023, 1(4), 901-918; https://doi.org/10.3390/waste1040052
Submission received: 4 August 2023 / Revised: 13 September 2023 / Accepted: 15 September 2023 / Published: 9 October 2023

Abstract

:
Fill product residues in packagings are equivalent to product losses. They are washed out after sorting and before commencing recycling processes. Not much data have been published about how much fill product is still present in packagings dedicated for recycling. Results are often from laboratory trials. Therefore, several hundred packagings from a sorting plant of a dual system in Germany were analysed to determine the amount of fill product residues. Approximately 10 wt. % of highly viscous fill products in tubes were lost as residue. In the case of packagings that were easy to empty, such as cups, and in the case of low-viscosity fill products, such as water, less than 1 wt. % of the fill products remained in the packagings. The mean amount of residue in relation to clean packaging was 0.9 g residue in 1 g of packaging material (without residue) in tubes and 0.07 g in PET bottles. These values were significantly lower for low-viscosity fill products compared to high-viscosity fill products, as expected.

1. Introduction

1.1. Recycling of Disposable Packaging in Germany

Single-use consumer plastic packaging waste is collected in Germany through dual systems [1,2,3,4,5]. Collected plastic waste is sorted and then either recycled or incinerated [2,4,5,6,7,8,9,10].
The structure of waste separation plants for lightweight packaging (LWP) waste and the sequence of the installed units are usually similar. At the beginning of the system, there is a sack-opener unit that is responsible for tearing open tied sacks and shredding or separating very large or agglomerated materials. This is usually followed by several screens, which usually consist of screen drums. The screening drums have holes of different sizes, usually ≥ 40 mm, through which the waste is “screened”. In the process, the materials are divided according to different size groups depending on the hole size through which the individual materials fall. Afterwards, devices separate 2D materials from 3D ones. This is performed by means of air classification. Air classifiers separate the light two-dimensional materials from the heavier three-dimensional materials by means of an air current, which causes the lighter materials to fly upwards and the heavier materials to fall downwards. There are different types of air classifiers, e.g., “zig-zag classifiers”. Some plants also use ballistic separators, which also separate 2D from 3D materials through the use of vibrating inclined screens. In the process, any small grains that are still present fall through the screen openings. The light two-dimensional materials are transported upwards due to the vibration. The heavy three-dimensional materials, on the other hand, roll down to the lower end. In individual material streams, magnetic separators come next, which separate iron from the rest of the materials through magnetic force. Nonferrous metals are taken out in the next unit, the eddy current separator. The way an eddy current separator works is based on induction. Eddy currents are generated in the conductive nonferrous metals through “a rapidly rotating magnetic pole system”. This creates “magnetic fields with the same polarity as the magnetic rotor, which cause the nonferrous parts to be repelled”. Sensor-supported sorters are then installed in the plants. These emit radiation in the NIR range, which is selectively reflected by the materials depending on which wavelengths are absorbed and reflected by the materials. The differences in the absorption or reflection of NIR radiation depend on the materials of which the objects are composed of. The reflected radiation is picked up again using a detector and converted into an electrical signal. This signal is evaluated with the help of software and the materials are sorted according to the material type. The sorting of the materials on the belt is achieved by means of compressed air blasts, which target the individual objects and transport them to a different belt than the rest of the materials. The plants have several NIR sorters, each filtering out different materials and, thus, forming the individual fractions [5,7,9,11,12,13,14,15,16,17].
In LWP sorting plants, mainly waste from the “yellow bag” (German: “gelber Sack”) or the “yellow bin” (German: “gelbe Tonne”) is sorted. Some materials cause problems in sorting plants because they are materials that should not be thrown into the yellow bin. For example, textiles often end up in the yellow bins. According to the regulations, paper packaging should be disposed of in the wastepaper bin and all other packaging in the yellow bin. The emphasis should be on “packaging”, because quite different items are often thrown into the yellow bin, such as bicycle tires, shower heads, traffic cones or textiles, as was observed during facility visits. Things such as shampoo bottles, pasta bags, beverage cartons or plastic washing-up liquid bottles belong in the yellow bin. What may not be disposed of in the yellow bag are old clothes or textiles, glass, transparent sleeves, paper, CDs, video cassettes, food leftovers, nappies or packaging that has not been emptied. However, all these things are still seen in LWP sorting facilities [7,16]. Worth mentioning is that biomass waste sorted out during recycling may be relevant for other products, such as biochar [18].
In Germany, plastic packaging waste is usually mechanically recycled after sorting when the recycling infrastructure is available. The plastic waste is washed after sorting and before recycling to remove residues [5,9,19,20,21], such as from foods and other fill products. However, impurities, such as odorous substances and other impurities, are still present in recyclates [20,22,23,24,25]. Some sources of contamination are impurities of polymers other than the sorting fraction, the migration and the adhesion of components from the fill products, diverse decomposition products from chemical reactions, such as fat oxidation, and microbial growth [25,26]. Contamination and possible degradation may cause virgin polymers to have different mechanical properties compared to recycled polymers [27].

1.2. Relevance of Impurities and Residues for Sorting

Near-infrared radiation (NIR) is used for sorting to identify and initiate the separation of plastic parts [9,12]. Typical applied wavelengths are between 990 nm and 1500 nm and between 930 and 1700 nm [12,28]. Parts and particles need to be detected on the surface [13,15]. Surface moisture and dirty surfaces, e.g., oil, can absorb and attenuate some radiation and reduce the sorting efficiency [13]. However, the influence of surface moisture and oil is low [12,28]. Regardless, NIR has a certain penetration depth and with thin outer layers, inner layers can influence the absorption spectrum [11,14]. Residues inside packagings might, therefore, influence NIR identification results.

1.3. Emptying Behaviour of Packagings

Food and other fill product residues cause the undesired pollution of plastic packaging waste for recycling [29]. The insufficient emptying behaviour of packagings is a reason for this occurrence [29,30,31,32,33,34,35]. Food residues adhere to packaging surfaces [29,31,32,34,35,36,37,38,39]. Cragnell et al. reported that “Approximately 5–10% of the fermented milk remains in the packages upon pouring […], […] due to adhesion to the inner package surface” [32]. Meurer et al. found that in 1 L milk packaging, milk residue amounted to between 0.43 and 14.7 mL [40]. According to Wohner et al., 5 to 29% of ketchup remained in PP bottles after emptying and 3 to 4% in glass bottles [34,41]. Furthermore, he reported 0.3 to 5.8% residue (“technical emptiability”) of dairy products in diverse packagings [34,42]. Go reported 0.1 to 0.3 wt. % diary product residues in PS cups and up to 0.8 wt. % beverage residues in PET bottles, with most values being lower for PET bottles [33].
Several surface modifications and coatings have been developed to improve the emptying behaviour of packaging [29,35,43,44,45,46,47]. However, Müller et al. claimed that “[…] easy emptying packaging is not a widely used option nowadays, due to the higher costs of the packages compared to traditional materials [39]”. It is, therefore, to be expected that, in many cases, packagings cannot be emptied well.

1.4. Intention of the Study

The aim of this study was to determine fill product residue amounts in packagings dedicated for recycling. Such data could help to identify packaging formats and fill products where emptying behaviour could be improved. Furthermore, such data may be relevant to understand better how much unavoidable losses occur during recycling due to undesired residues.

2. Materials and Methods
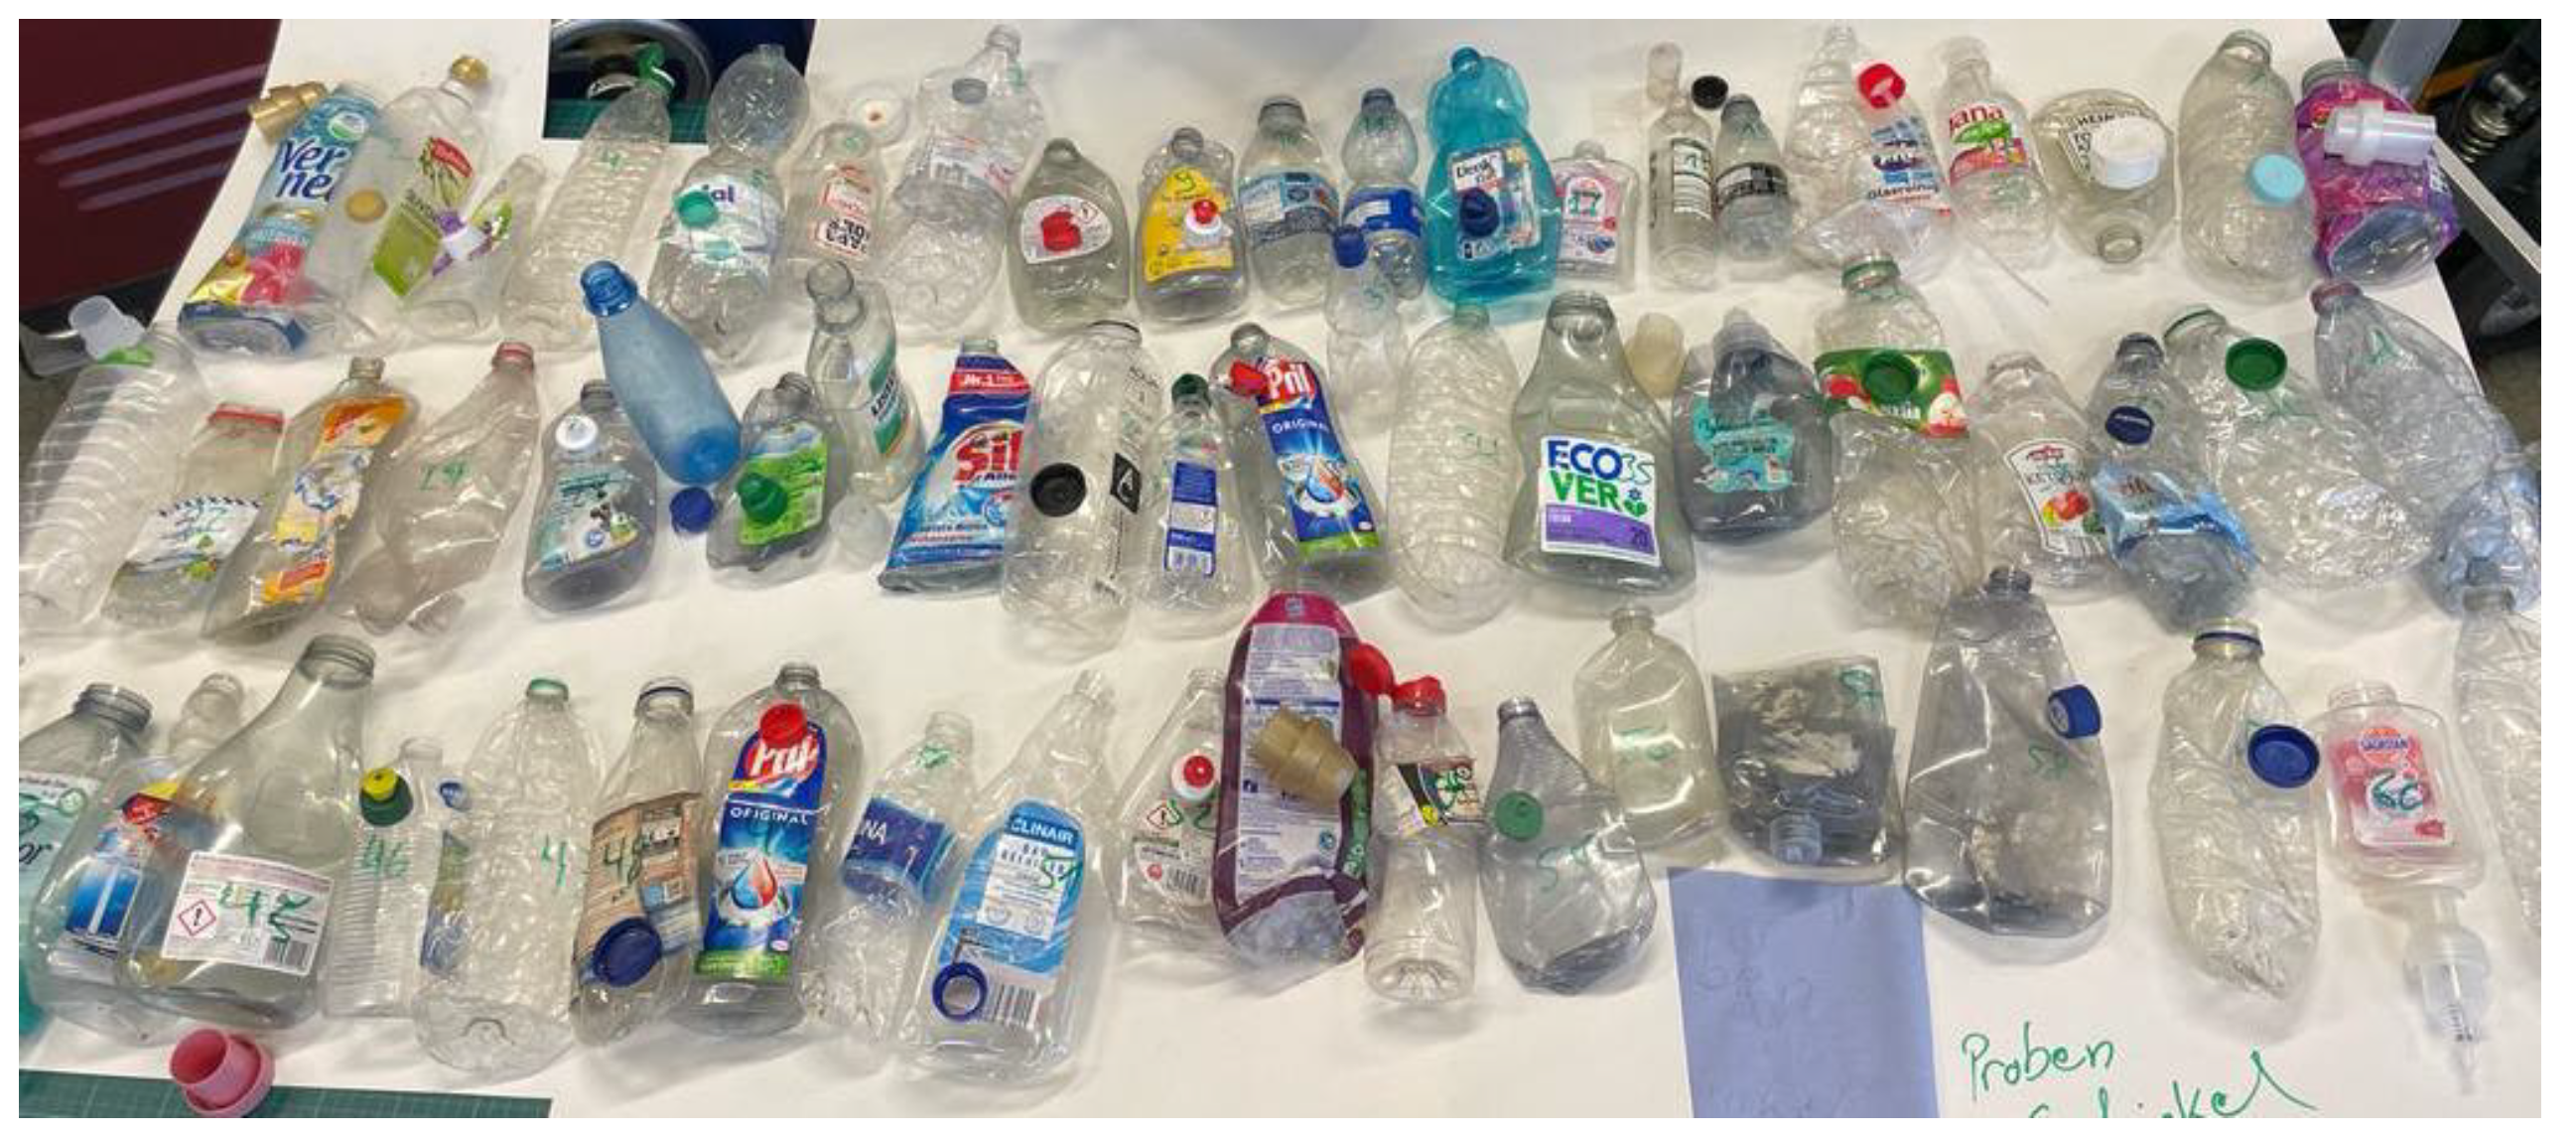
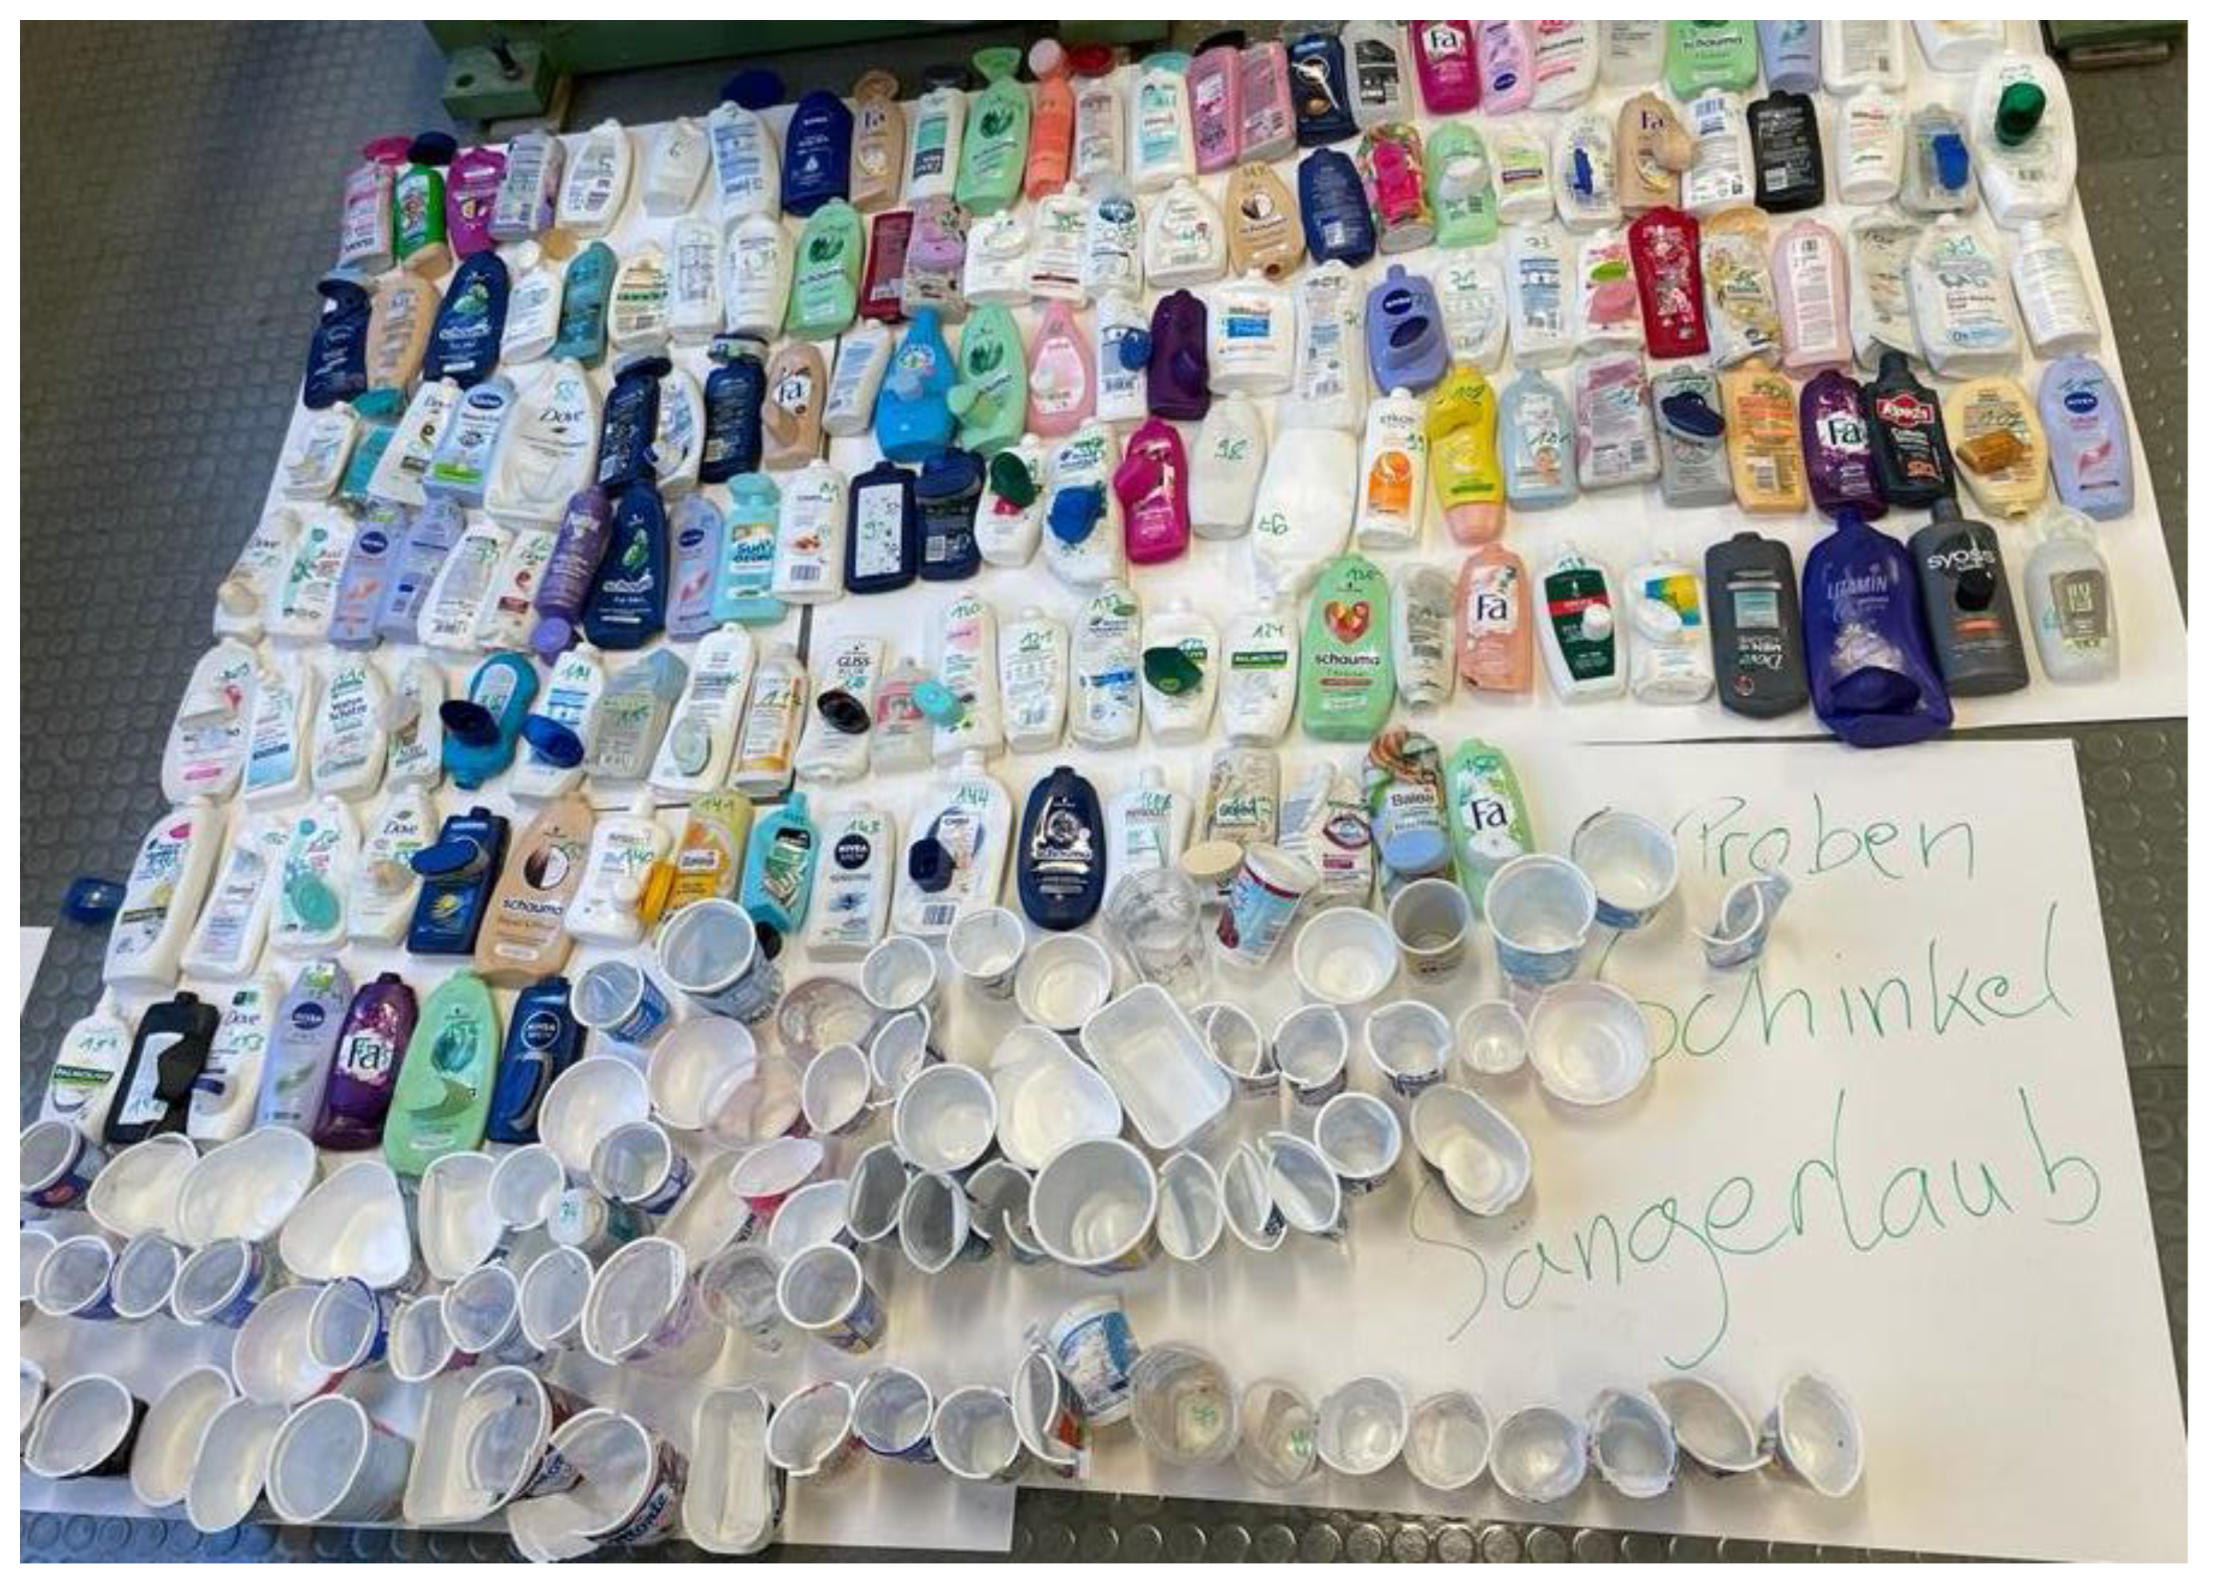
2.1. Sampling

Samples were taken in January 2023 from sorted disposable packaging waste in a packaging waste-sorting plant managed by the dual system PreZero (Ölbronn, Germany). The catchment area was southern Germany. The throughput of the plant was approximately 20 t/h. The sorted samples belonged to the sorting categories of rigid PP (poly(1-methylethylene)), rigid PE-HD (polyethene high density) and rigid PET (poly(ethylene terephthalate)). The samples were classified as PE tubes (n = 180, Figure A1), PET bottles (n = 112, Figure A1 and Figure A2), PE-HD bottles (n = 157, Figure A3), PP cups (n = 100, Figure A3) and PP bottles (n = 109, Figure A4). Information about the filling quantities was taken from the labels. For 30 PET bottles, the fill product quantity was not visible, because the labels had been removed.
Due to the regionally large catchment area of the samples, the mixing of the samples in the sorting process, the random composition of the samples, the larger number of samples compared to similar studies and reproducible sorting in the facilities, the results of this study could be considered randomised and the results for the sampling be considered reproducible. Advice on sampling, such as from Dahlen and Lagerkvist, was taken into account [48].

2.2. Measurement of Weights

The sample weights (packagings with residues) were measured with an analytical balance (model BP 221 S, Sartorius, Göttingen, Germany). The samples were then washed with water containing detergent. Tubes were cut before this to remove residues more easily (Figure A5). Afterwards, the samples were dried for some days at approx. 23 °C and 50% r.h. After drying, the weight was measured again.

2.3. Data Processing

All data were processed with Microsoft Excel 2019.

3. Results

3.1. Tubes Composed of PE

In the tubes, various products, such as skin crème, hair gel, shampoo and toothpaste, were filled by producers. For 125 samples, the closures were left on the packages, and for 55 samples, the closures were no longer on the package. The closures could have been removed by the consumers or through mechanical action during processing. The mean residual amount related to the filling quantity was 0.09 g/g (Figure 1). Therefore, almost 10 wt. % of the fill product remained as residue in the tubes. No correlations between residual quantities and fill product quantities were identified. A mean of 0.89 g of residue (fill product) remained and adhered to 1 g of clean packaging material. For the tubes with closures, the value was 0.85 g/g. When the value was calculated for the tubes without closures, the value was higher, reaching 0.99 g/g.
The results of Figure 1 were classified into skin cream, hair gel, shampoo and toothpaste, because different fill products might have behaved differently (Figure 2). A mean of 3 wt. % of shampoo, 7 wt. % of hair gel and 11 wt. % of skin crème and of toothpaste remained in the packagings. For the calculations, the product density was assumed to be 1 g/cm3. The mean values for the ratio of residue related to the clean packaging material was calculated to be 0.36 g for shampoo, 0.55 g for hair gel, 0.75 g for skin crème and 1.26 g for toothpaste per 1 g of cleaned packaging material.

3.2. Cups Composed of PP

The analysed PP cups were mainly used for dairy products, such as yogurt and desserts, as Kostic et al. already reported [49]. For 25 cups, the lid was left on the packaging, and for 75 of the cups, the lids were no longer on the packaging. The cups had a filling quantity of 50 to 500 g. The cups composed of PP contained a mean of 0.38 wt. % of residue related to the fill product (Figure 3). The residual quantity did not correlate with the filling quantity. A mean of 0.117 g of fill product remained in 1 g of clean packaging material (cups with and without lids).

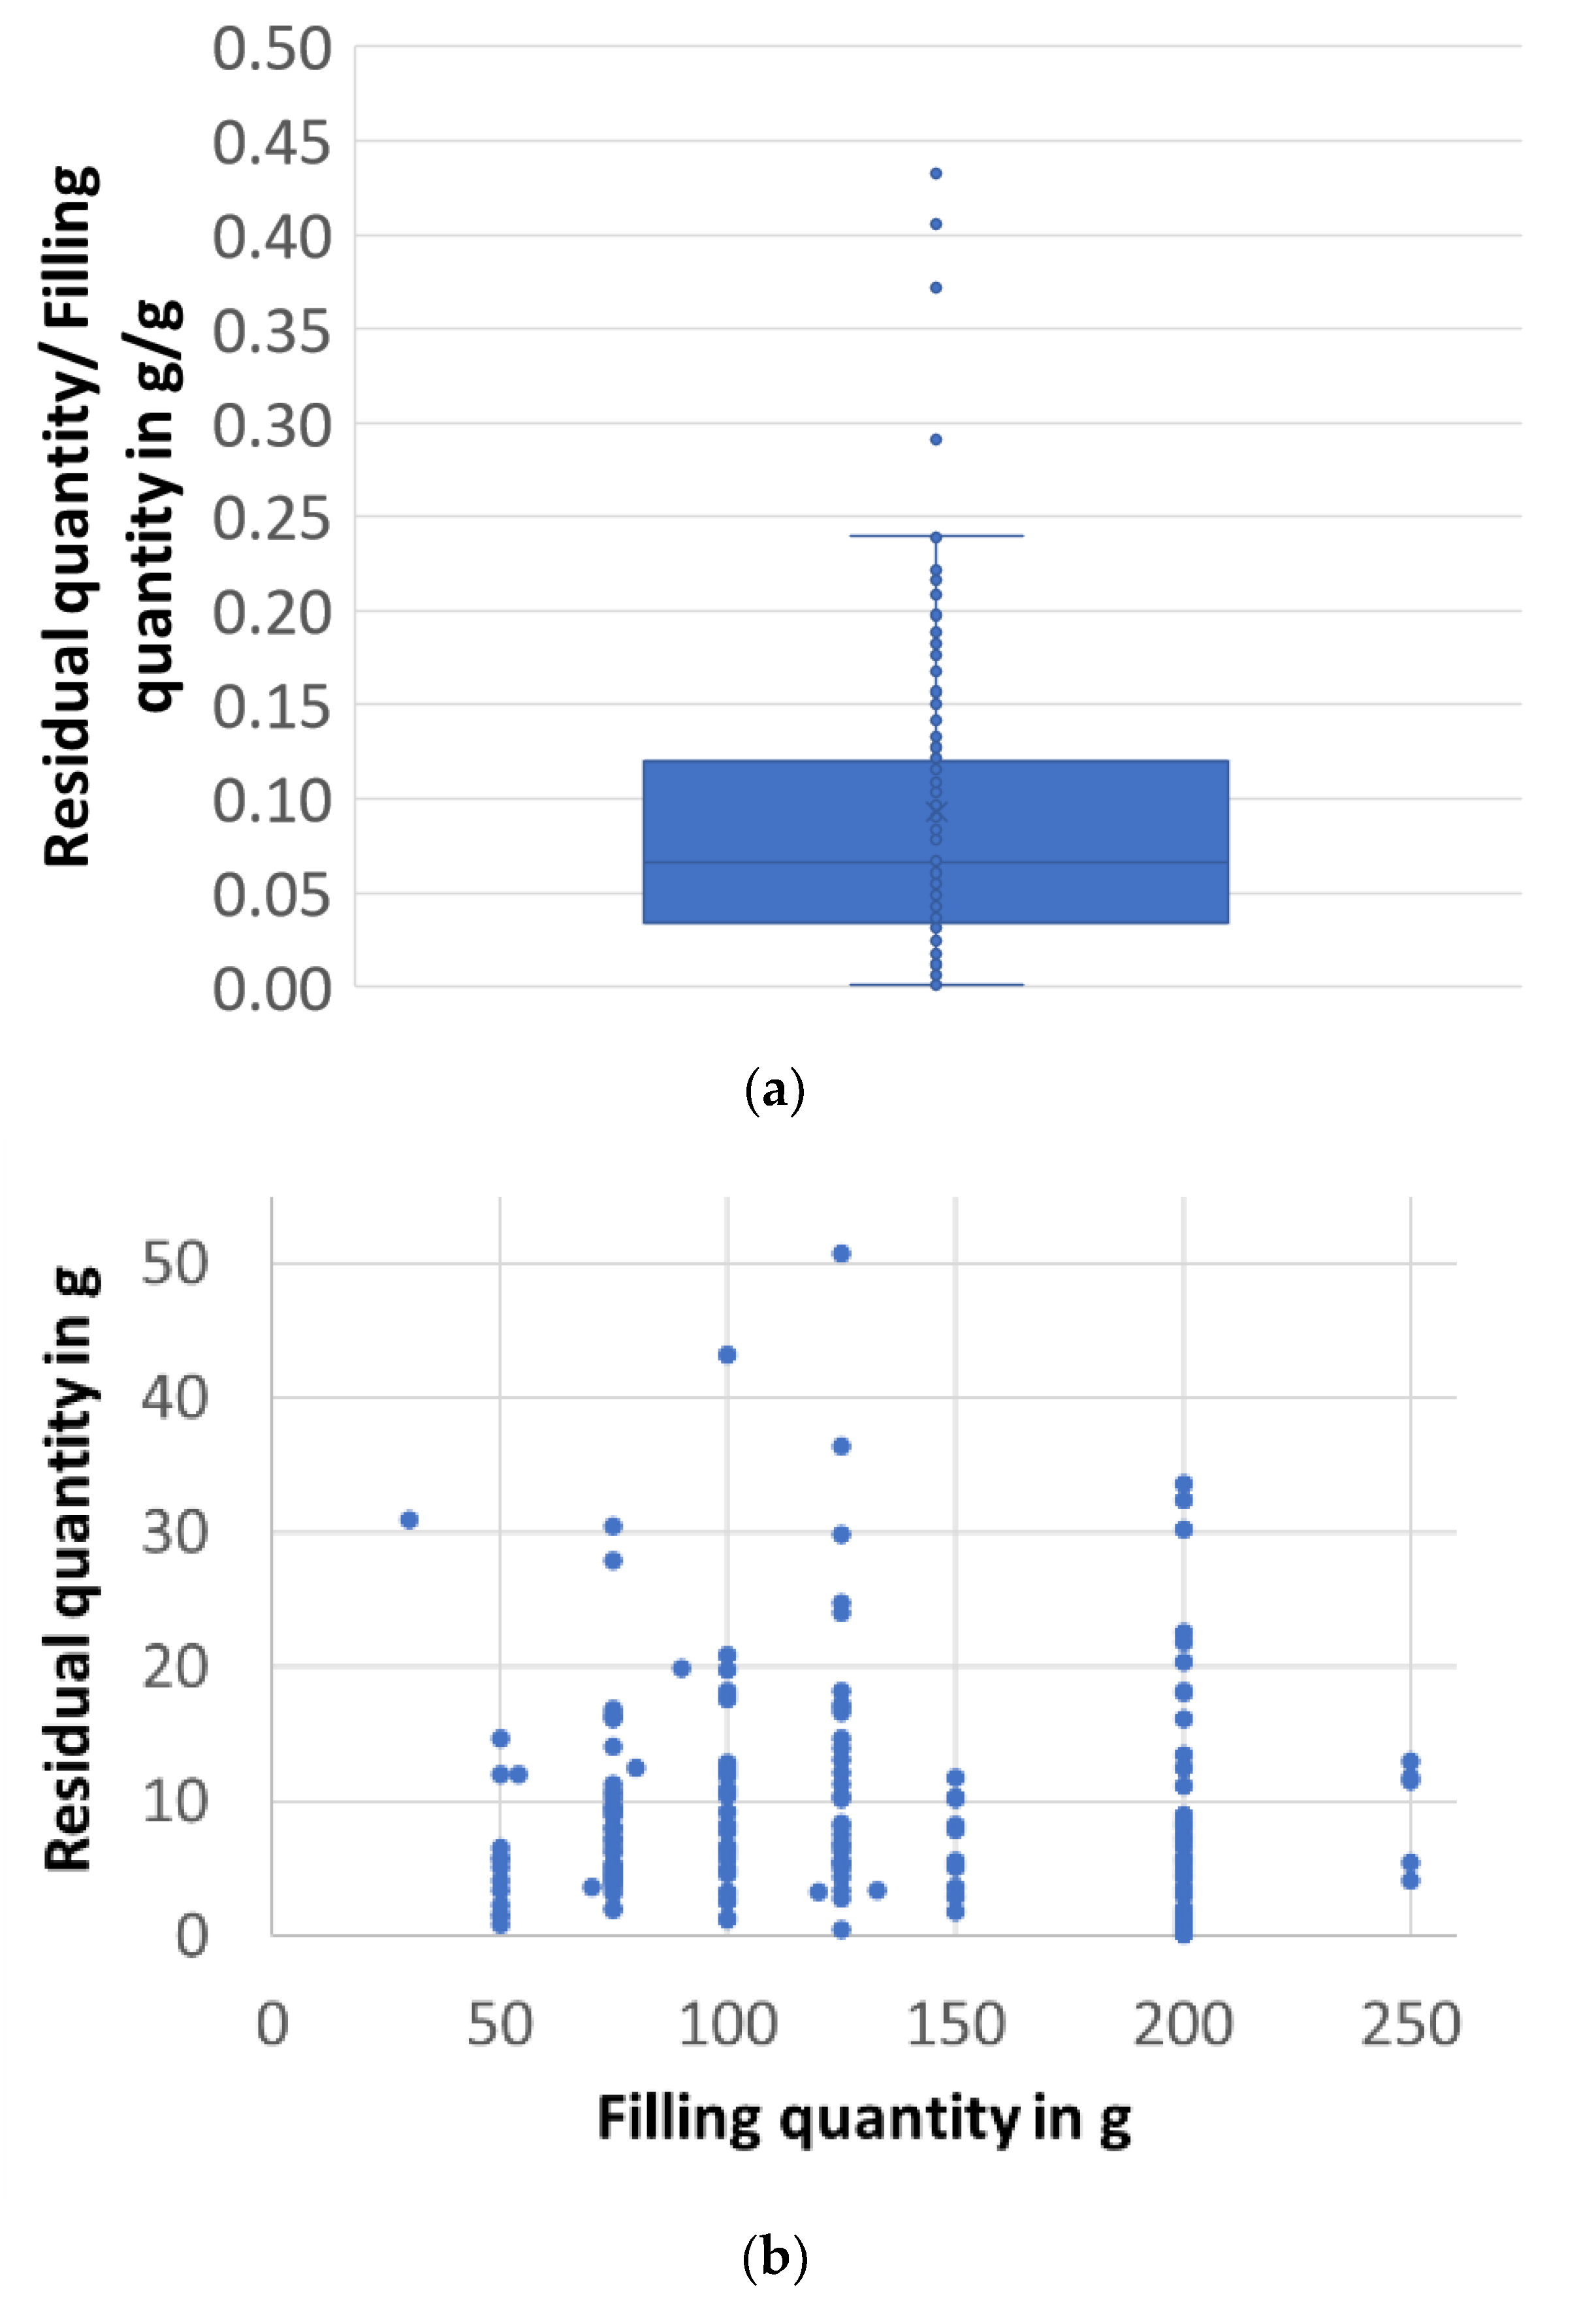
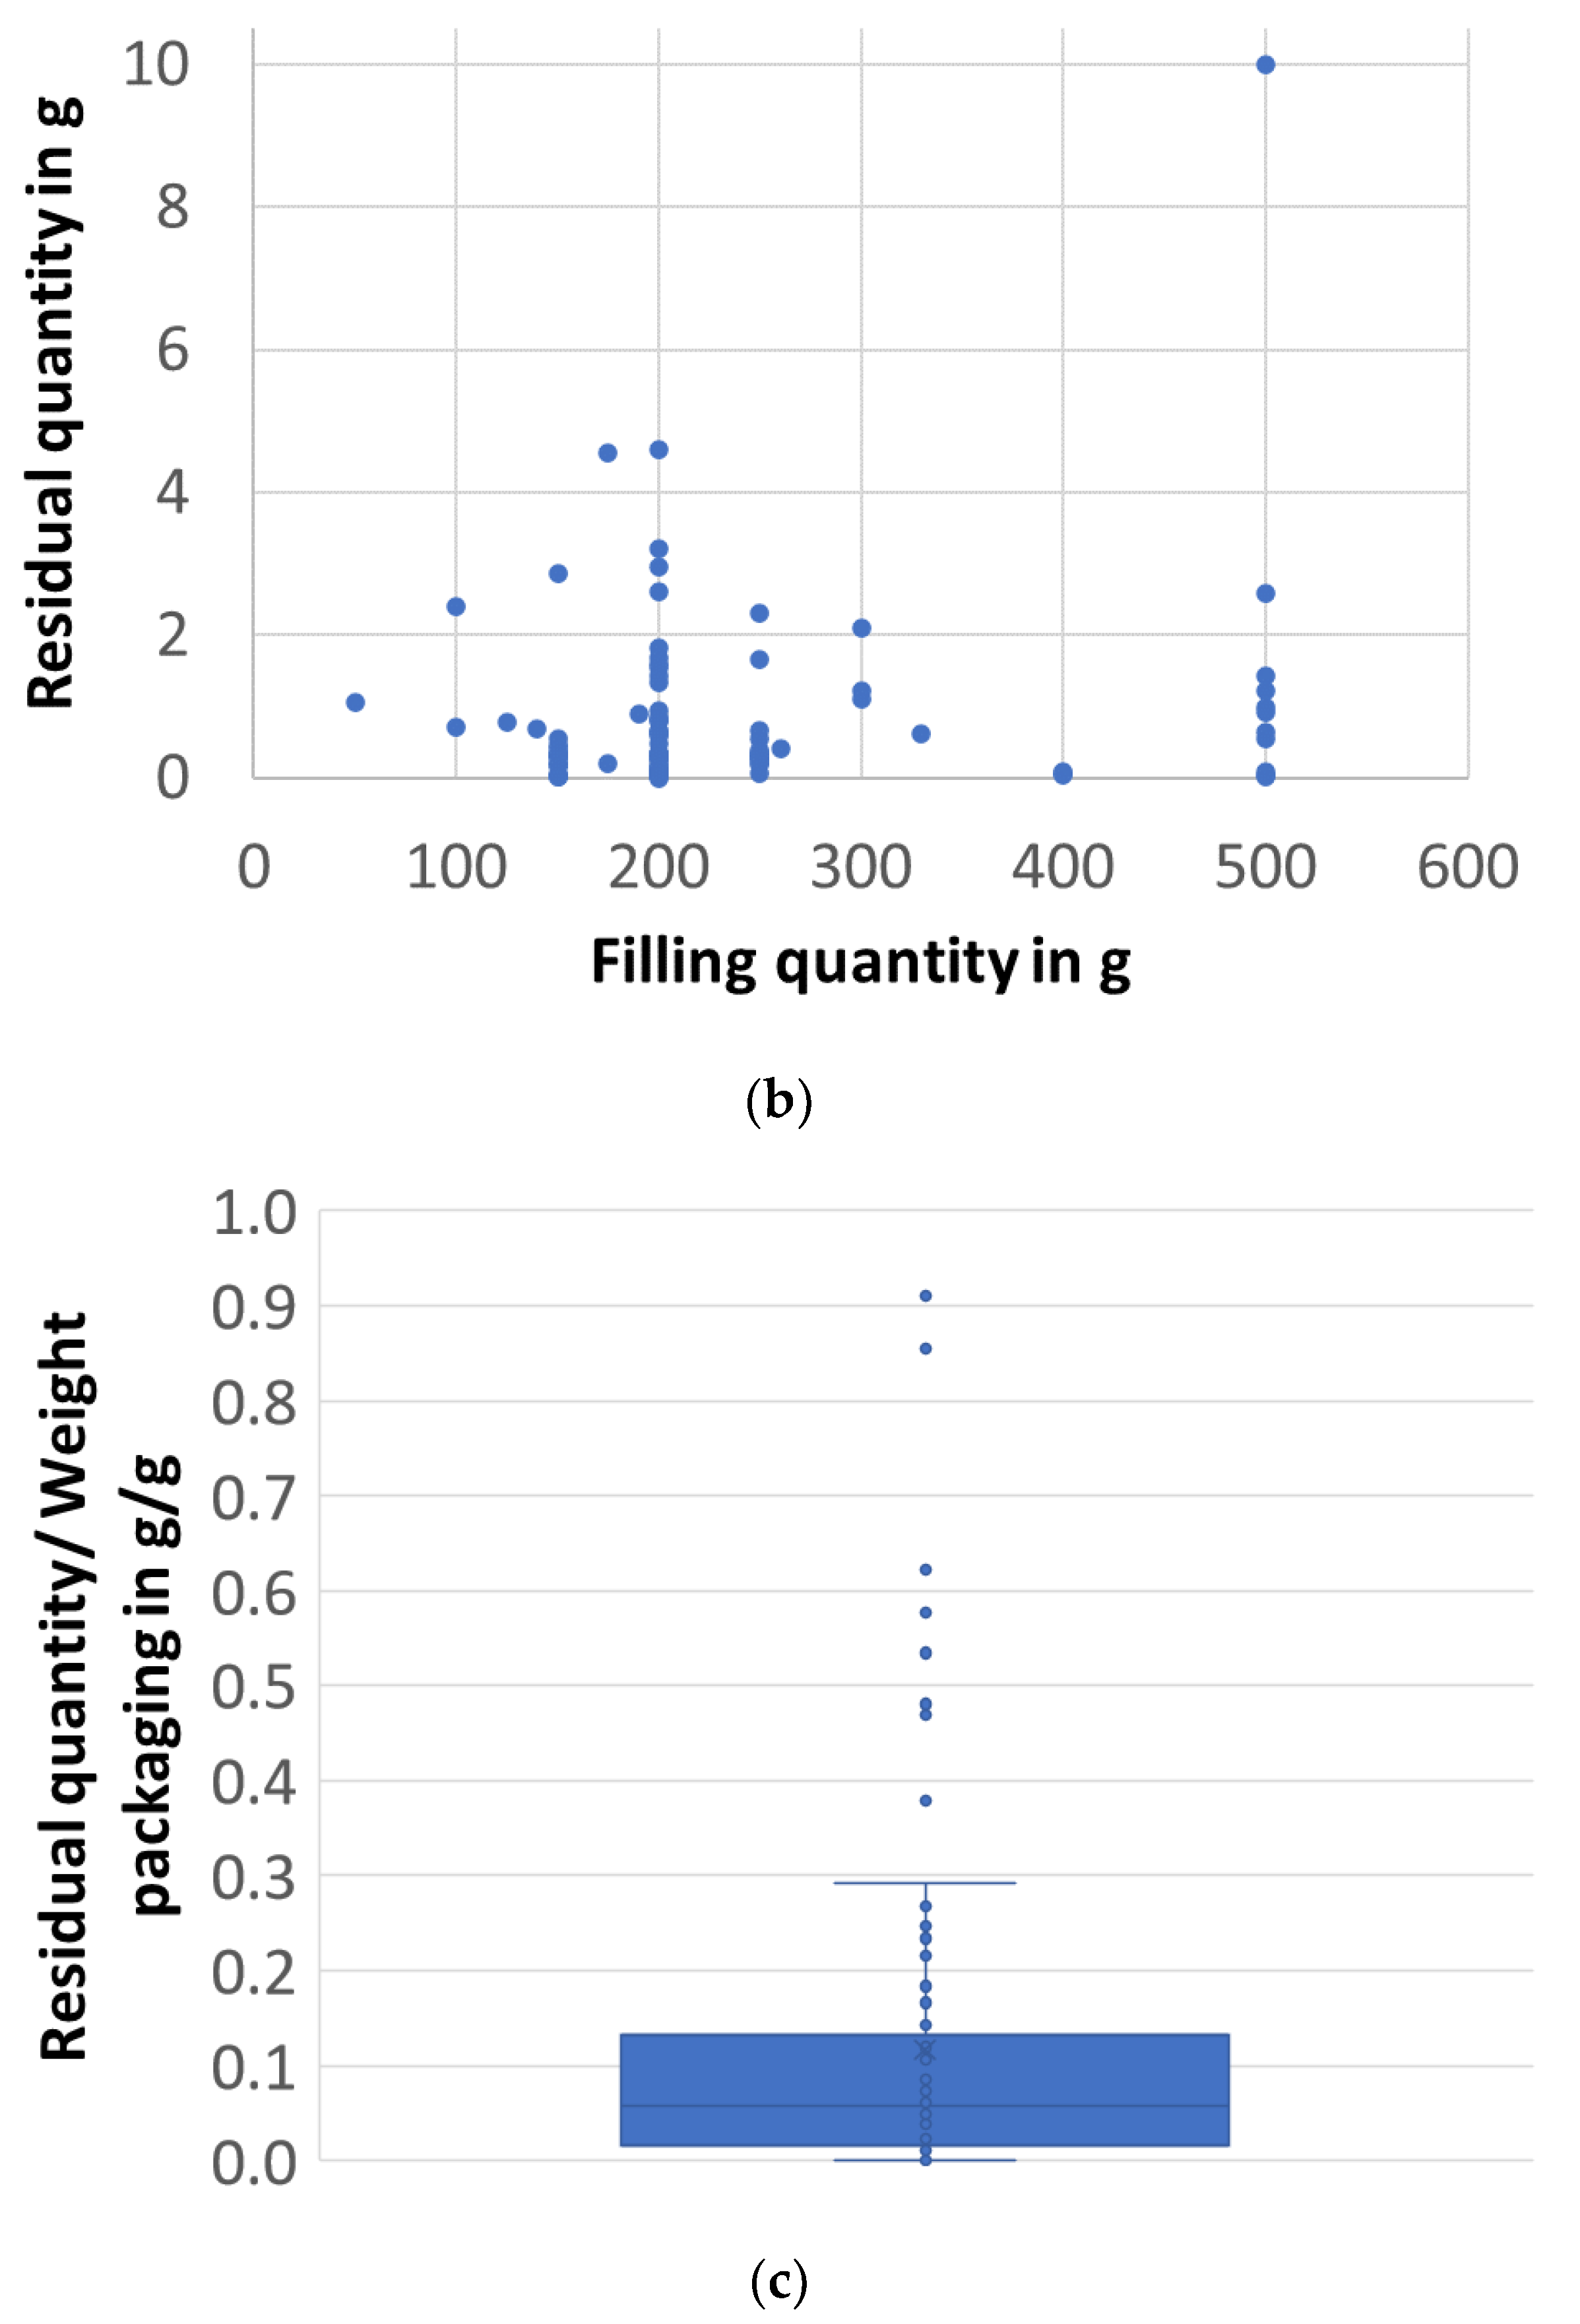
3.3. Bottles Composed of PP and PE-HD

In the analysed PP and PE-HD bottles, shower gel was filled with fill quantities of 100 to 800 g. For 87 PE bottles, the closures were left on the bottles, and for 70 bottles, the closures were removed. In the case of PP bottles, 62 bottles had the closures left on, and 47 had the closures removed. A mean of 2 wt. % of the fill product remained in the PP bottles, and in PE bottles, the amount was slightly higher at 3.4 wt. % (Figure 4). In total, 0.17 g of residue in the PP bottles and 0.34 g in the PE bottles remained, relating to 1 g of cleaned plastic. For the PE bottles, the following colours were observed: 5 transparent, 14 red/rose, 23 blue, 8 crème, 15 black/gray, 10 green, 79 white and 3 yellow. For the PP bottles, the following colours were observed: 62 transparent, 2 red, 12 blue, 7 crème, 10 black and 16 white.

3.4. PET Bottles

For PET bottles, a mean of 0.5 wt. % of fill product remained (Figure 5). The mean value of residue related to the packaging material was 0.07 g of residue related to 1 g of cleaned PET.
The tested PET bottles were used for various products with a wide range of viscosities (see Figure 6), resulting in a broad distribution. In the PET bottles with tomato ketchup, the mean residue amount (mean value) was highest, at almost 0.35 g residue in 1 g clean packaging material. A mean of between 0.01 g and 0.07 g of the other fill products remained in 1 g of clean PET bottles.

4. Discussion

In Table 1, the results were summarised and compared with results from other publications. High-viscosity fill products, such as toothpaste and crème, remained in higher quantities in packagings, here being tubes. These flowed slowly out of the packaging. As already reported by Schmidt before, a higher viscosity is an explanation for higher amounts of residues [44]. The viscous behaviour of toothpaste is more complex. It can be described with the Bingham model. A certain shear stress is required to induce the flow of toothpaste [50,51]. This behaviour is desirable, because it allows toothpaste to remain on the toothbrush and not fall off. Between 11 and 13 wt. % of toothpaste and crème remained in the packagings and were lost for consumption. The values were scattered (see Figure 2). According to Schmidt, approx. 14 wt. % of toothpaste remained as residue [44]. However, only four samples were measured there. Schmidt reported that 18 wt. % of hair gel remained in packagings, with five samples measured [44]. These values were higher than the mean value of 11.3 wt. % in this study. Additionally, these values were scattered, wherefore many samples would need to be analysed to obtain statistically valid results. The other residual quantities measured in this study were lower.
Residue amounts in the PP and PS cups were lower when taken from sorting plants. A possible explanation was the drying and water evaporating from products during collection and processing.
The amount of shower gel residue was slightly higher in PE bottles compared to PP bottles. An explanation could be that more PP bottles were transparent and, therefore, residues were visible to the consumers and were consumed.
Due to their low viscosity, PET bottles with beverages emptied well, with always less than 1 wt. % of the fill product remaining in the packaging. Higher amounts of residue were observed for nonbeverage fill products, with the highest amounts being obtained for tomato ketchup in PET bottles, at a mean product residue amount of 2.5 wt. %. The value was much lower than that previously reported for ketchup in PP bottles. The study of Wohner reported amounts of up to 30 wt. % of residue, i.e., product loss, for tomato ketchup packaged in PP bottles. However, Wohner did not measure the losses from recycling streams, but performed laboratory trials that may not have had reflected reality well. Ketchup is shear-thinning [51]. By shaking the packaging, ketchup can flow more easily, which could have been performed by consumers and could have been the explanation for the low amounts of ketchup residue found in PET bottles. However, laboratory results of residue amounts in bottles without shaking were not available for comparison for this study.
When the residue quantities were related to the packaging weight, it became obvious that residues were a considerable part of the plastic packaging waste. In the case of tubes, the median ranged from 0.26 g to 1.1 g of residue related to 1 g of clean packaging material. For tomato ketchup in PET bottles, a median of 0.36 g of ketchup was observed to 1 g of clean PET material. A median value of 0.17 g of shower gel residue was found to 1 g of clean PE bottles. The lowest median values were observed in PET bottles, with 0.01 g water residue remaining to 1 g of clean PET material. Obviously, the residue amounts measured using samples from recycling plants were lower than those from laboratory experiments. The lower values were an advantage, since residues had to be washed out after sorting and before recycling [15,21].

5. Conclusions

For this study, residue amounts in packaging waste were measured. For high-viscosity foods in difficult-to-empty packagings, such as tubes, the residue amounts were high. For low-viscosity foods, such as water, the residue amounts were low.
Fill product residues are problematic for several reasons. Residues are not consumed as intended, and, therefore, are lost for consumption, with overproduction potentially being required. Residues add additional weight to packaging waste that must be transported. Washing after sorting and before recycling is required to remove residues, causing additional efforts and extra costs for washing and wastewater disposal. Furthermore, because of the residues, the weight of the sorted input waste for recycling is lower than the output weight after washing and recycling. Hence, only a limited amount of packaging waste can be transformed into recyclates.
PP and PE bottles and tubes are often designed to be placed and stored on their closures. The filling material should flow to the closure. Even so, PE tubes with high-viscosity fill products were identified as a packaging format with the highest ratio of residue quantity to fill product quantity. The emptying behaviour of these packagings could be improved, and consumers could be motivated to better squeeze the tubes out.

Author Contributions

Conceptualization, S.S. and K.S.; methodology, K.S. and S.S.; validation, K.S. and S.S.; formal analysis, K.S.; sampling: K.S., S.R. and S.S.; investigation, K.S.; resources, S.S.; data curation, S.S.; writing—original draft preparation, K.S. and S.S.; writing—review and editing, S.S., K.M., T.F., B.K. and T.R.; supervision, S.S.; project administration, S.S. and B.K.; funding acquisition, S.S. All authors have read and agreed to the published version of the manuscript.

Funding

This research received no external funding.

Institutional Review Board Statement

Not applicable.

Informed Consent Statement

Not applicable.

Data Availability Statement

Original data are provided upon request.

Acknowledgments

This work was financially supported by the Munich University of Applied Sciences HM and the German Research Foundation (DFG) through the “Open Access Publishing” program. We thank Hoffman from the Munich University of Applied Sciences HM for support in the experiments.

Conflicts of Interest

The authors declare no conflict of interest.

Appendix A

Figure A1. Samples, tubes and PET bottles after cleaning.
Waste 01 00052 g0a1
Figure A2. Samples and PET bottles after cleaning.
Waste 01 00052 g0a2
Figure A3. Samples, PE bottles and cups after cleaning.
Waste 01 00052 g0a3
Figure A4. Samples and PP bottles after cleaning.
Waste 01 00052 g0a4
Figure A5. Residue in tube with toothpaste before cleaning.
Waste 01 00052 g0a5

References

  1. Snell, H.; Nassour, A.; Nelles, M. Qualitative comparison of polyethylene terephthalate flakes from various collection systems in Germany. Waste Manag. Res. 2017, 35, 163–171. [Google Scholar] [CrossRef]
  2. Picuno, C.; Alassali, A.; Chong, Z.K.; Kuchta, K. Flows of post-consumer plastic packaging in Germany: An MFA-aided case study. Resour. Conserv. Recycl. 2021, 169, 105515. [Google Scholar] [CrossRef]
  3. Dehio, J.; Janßen-Timmen, R.; Rothgang, M. Regulating markets for post-consumer recycling plastics: Experiences from Germany’s Dual System. Resour. Conserv. Recycl. 2023, 196, 107048. [Google Scholar] [CrossRef]
  4. Rudolph, N.; Kiesel, R.; Aumnate, C. Plastic Waste around the World: Increasing Potential of Recycling. In Understanding Plastics Recycling; Carl Hanser Verlag GmbH & Co. KG: Munich, Germany, 2020; pp. 97–115. ISBN 978-1-56990-846-4. [Google Scholar]
  5. Orth, P.; Bruder, J.; Rink, M. Kunststoffe im Kreislauf: Vom Recycling zur Rohstoffwende, 1st ed.; Springer Vieweg: Wiesbaden, Germany, 2022; ISBN 9783658378141. [Google Scholar]
  6. Lase, I.S.; Bashirgonbadi, A.; van Rhijn, F.; Dewulf, J.; Ragaert, K.; Delva, L.; Roosen, M.; Brandsma, M.; Langen, M.; De Meester, S. Material flow analysis and recycling performance of an improved mechanical recycling process for post-consumer flexible plastics. Waste Manag. 2022, 153, 249–263. [Google Scholar] [CrossRef] [PubMed]
  7. Chen, X.; Kroell, N.; Hofmann, B.; Schlögl, S.; Greiff, K. Improving drum sieve performance in lightweight packaging waste recycling by automatic parameter adjustment through 3D laser triangulation-based process monitoring. Resour. Conserv. Recycl. 2023, 192, 106924. [Google Scholar] [CrossRef]
  8. Voet, V.; Folkersma, R.; Jager, J. Plastics in the Circular Economy; Walter de Gruyter GmbH: Berlin, Germany, 2021; ISBN 9783110666762. [Google Scholar]
  9. Kaiser, K.; Schmid, M.; Schlummer, M. Recycling of Polymer-Based Multilayer Packaging: A Review. Recycling 2018, 3, 1. [Google Scholar] [CrossRef]
  10. Picuno, C.; van Eygen, E.; Brouwer, M.T.; Kuchta, K.; Thoden van Velzen, E.U. Factors Shaping the Recycling Systems for Plastic Packaging Waste—A Comparison between Austria, Germany and The Netherlands. Sustainability 2021, 13, 6772. [Google Scholar] [CrossRef]
  11. Chen, X.; Kroell, N.; Althaus, M.; Pretz, T.; Pomberger, R.; Greiff, K. Enabling mechanical recycling of plastic bottles with shrink sleeves through near-infrared spectroscopy and machine learning algorithms. Resour. Conserv. Recycl. 2023, 188, 106719. [Google Scholar] [CrossRef]
  12. Chen, X.; Kroell, N.; Wickel, J.; Feil, A. Determining the composition of post-consumer flexible multilayer plastic packaging with near-infrared spectroscopy. Waste Manag. 2021, 123, 33–41. [Google Scholar] [CrossRef]
  13. Feil, A.; Pretz, T. Chapter 11—Mechanical recycling of packaging waste. In Plastic Waste and Recycling; Letcher, T.M., Ed.; Academic Press: Cambridge, MA, USA, 2020; pp. 283–319. ISBN 978-0-12-817880-5. [Google Scholar]
  14. Koinig, G.; Friedrich, K.; Rutrecht, B.; Oreski, G.; Barretta, C.; Vollprecht, D. Influence of reflective materials, emitter intensity and foil thickness on the variability of near-infrared spectra of 2D plastic packaging materials. Waste Manag. 2022, 144, 543–551. [Google Scholar] [CrossRef]
  15. Ragaert, K.; Delva, L.; van Geem, K. Mechanical and chemical recycling of solid plastic waste. Waste Manag. 2017, 69, 24–58. [Google Scholar] [CrossRef] [PubMed]
  16. Möllnitz, S.; Küppers, B.; Curtis, A.; Khodier, K.; Sarc, R. Influence of pre-screening on down-stream processing for the production of plastic enriched fractions for recycling from mixed commercial and municipal waste. Waste Manag. 2021, 119, 365–373. [Google Scholar] [CrossRef] [PubMed]
  17. Kroell, N.; Chen, X.; Greiff, K.; Feil, A. Optical sensors and machine learning algorithms in sensor-based material flow characterization for mechanical recycling processes: A systematic literature review. Waste Manag. 2022, 149, 259–290. [Google Scholar] [CrossRef] [PubMed]
  18. Yang, C.; Wu, H.; Cai, M.; Zhou, Y.; Guo, C.; Han, Y.; Zhang, L. Valorization of Biomass-Derived Polymers to Functional Biochar Materials for Supercapacitor Applications via Pyrolysis: Advances and Perspectives. Polymers 2023, 15, 2741. [Google Scholar] [CrossRef] [PubMed]
  19. Schmiemann, A.; Amici, M.; Schröder, T.; van Roost, H.; Jahnke, E.; Nießner, N.; Mangold, H.; Beyer, C.; Leadbitter, J.; Wilhelmus, B. Mechanical Recycling. In Recycling of Plastics; Carl Hanser Verlag GmbH & Co. KG: Munich, Germany, 2022; pp. 275–433. ISBN 978-1-56990-856-3. [Google Scholar]
  20. Strangl, M.; Lok, B.; Breunig, P.; Ortner, E.; Buettner, A. The challenge of deodorizing post-consumer polypropylene packaging: Screening of the effect of washing, color-sorting and heat exposure. Resour. Conserv. Recycl. 2021, 164, 105143. [Google Scholar] [CrossRef]
  21. Lange, J.-P. Managing Plastic Waste—Sorting, Recycling, Disposal, and Product Redesign. ACS Sustain. Chem. Eng. 2021, 9, 15722–15738. [Google Scholar] [CrossRef]
  22. Strangl, M.; Schlummer, M.; Maeurer, A.; Buettner, A. Comparison of the odorant composition of post-consumer high-density polyethylene waste with corresponding recycled and virgin pellets by combined instrumental and sensory analysis. J. Clean. Prod. 2018, 181, 599–607. [Google Scholar] [CrossRef]
  23. Strangl, M.; Ortner, E.; Fell, T.; Ginzinger, T.; Buettner, A. Odor characterization along the recycling process of post-consumer plastic film fractions. J. Clean. Prod. 2020, 260, 121104. [Google Scholar] [CrossRef]
  24. Strangl, M.; Ortner, E.; Buettner, A. Evaluation of the efficiency of odor removal from recycled HDPE using a modified recycling process. Resour. Conserv. Recycl. 2019, 146, 89–97. [Google Scholar] [CrossRef]
  25. Gall, M.; Freudenthaler, P.J.; Fischer, J.; Lang, R.W. Characterization of Composition and Structure–Property Relationships of Commercial Post-Consumer Polyethylene and Polypropylene Recyclates. Polymers 2021, 13, 1574. [Google Scholar] [CrossRef]
  26. Strangl, M.; Fell, T.; Schlummer, M.; Maeurer, A.; Buettner, A. Characterization of odorous contaminants in post-consumer plastic packaging waste using multidimensional gas chromatographic separation coupled with olfactometric resolution. J. Sep. Sci. 2017, 40, 1500–1507. [Google Scholar] [CrossRef]
  27. Ladhari, A.; Kucukpinar, E.; Stoll, H.; Sängerlaub, S. Comparison of Properties with Relevance for the Automotive Sector in Mechanically Recycled and Virgin Polypropylene. Recycling 2021, 6, 76. [Google Scholar] [CrossRef]
  28. Küppers, B.; Schloegl, S.; Oreski, G.; Pomberger, R.; Vollprecht, D. Influence of surface roughness and surface moisture of plastics on sensor-based sorting in the near infrared range. Waste Manag. Res. 2019, 37, 843–850. [Google Scholar] [CrossRef]
  29. Schmidt, M.C.; Loibl, F.; Muller, M.; Oehr, C.; Hirth, T. The Emptying Behavior of Highly Viscous Liquids. Part I: Polymeric Surfaces and Plasma Coatings. J. Adhes. Sci. Technol. 2012, 26, 2449–2467. [Google Scholar] [CrossRef]
  30. Schmidt, M.C.; Müller, M.; Oehr, C.; Hirth, T. Influence of semi-solid fluid’s surface tension and rheological properties on the residues at packaging materials. J. Food Eng. 2012, 108, 211–215. [Google Scholar] [CrossRef]
  31. Liu, X.; Wang, L.; Qiao, Y.; Sun, X.; Ma, S.; Cheng, X.; Qi, W.; Huang, W.; Li, Y. Adhesion of liquid food to packaging surfaces: Mechanisms, test methods, influencing factors and anti-adhesion methods. J. Food Eng. 2018, 228, 102–117. [Google Scholar] [CrossRef]
  32. Cragnell, C.; Hansson, K.; Andersson, T.; Jönsson, B.; Skepö, M. Underlying mechanisms behind adhesion of fermented milk to packaging surfaces. J. Food Eng. 2014, 130, 52–59. [Google Scholar] [CrossRef]
  33. Go, N. Beitrag zum Recyclingpotential von PET- und PS-Kunststoffverpackungsabfällen; Shaker Verlag: Düren, Germany, 2020; ISBN 9783844077261. [Google Scholar]
  34. Wohner, B. The Relationship between Packaging and Food Waste and Its Consideration in Sustainability Assessments. Ph.D. Thesis, TU Wien, Vienna, Austria, 2020. [Google Scholar]
  35. Loibl, F.; Holtz, C.; Langowski, H.-C. Improving the Emptying Behaviour of Packaging via Coating their Surfaces with Plasma-Polymerized Nanoscale Layers. In Proceedings of the 51st Annual Technical Conference, Society of Vacuum Coaters, Chicago, IL, USA, 19–24 April 2008; pp. 554–558. [Google Scholar]
  36. Michalski, M.-C.; Desobry, S.; Hardy, J. Food materials adhesion: A review. Crit. Rev. Food Sci. Nutr. 1997, 37, 591–619. [Google Scholar] [CrossRef]
  37. Adhikari, B.; Howes, T.; Bhandari, B.R.; Truong, V. Stickiness in Foods: A Review of Mechanisms and Test Methods. Int. J. Food Prop. 2001, 4, 1–33. [Google Scholar] [CrossRef]
  38. Loibl, F.; Schmidt, M.C.; Auer-Seidl, A.; Kirchner, C.; Holtz, C.; Miiller, K.; Stramm, C.; Langowski, H.-C. The Emptying Behaviour of Highly Viscous Liquids. Part II: Development of Test Methods and Evaluation of Untreated and Coated Films. J. Adhes. Sci. Technol. 2012, 26, 2469–2503. [Google Scholar] [CrossRef]
  39. Müller, K.; Bugnicourt, E.; Latorre, M.; Jorda, M.; Echegoyen Sanz, Y.; Lagaron, J.M.; Miesbauer, O.; Bianchin, A.; Hankin, S.; Bölz, U.; et al. Review on the Processing and Properties of Polymer Nanocomposites and Nanocoatings and Their Applications in the Packaging, Automotive and Solar Energy Fields. Nanomaterials 2017, 7, 74. [Google Scholar] [CrossRef] [PubMed]
  40. Meurer, I.R.; Lange, C.C.; Hungaro, H.M.; Valenzuela Bell, M.J.; Carvalho dos Anjos, V. de; Antonio de Sá Silva, Cleuber; Aparecida de Oliveira Pinto, Miriam. Quantification of whole ultra high temperature UHT milk waste as a function of packages type and design. J. Clean. Prod. 2017, 153, 483–490. [Google Scholar] [CrossRef]
  41. Wohner, B.; Gabriel, V.H.; Krenn, B.; Krauter, V.; Tacker, M. Environmental and economic assessment of food-packaging systems with a focus on food waste. Case study on tomato ketchup. Sci. Total Environ. 2020, 738, 139846. [Google Scholar] [CrossRef] [PubMed]
  42. Wohner, B.; Schwarzinger, N.; Gürlich, U.; Heinrich, V.; Tacker, M. Technical emptiability of dairy product packaging and its environmental implications in Austria. PeerJ 2019, 7, e7578. [Google Scholar] [CrossRef] [PubMed]
  43. Lasprilla-Botero, J.; Torres-Giner, S.; Pardo-Figuerez, M.; Álvarez-Láinez, M.; M. Lagaron, J. Superhydrophobic Bilayer Coating Based on Annealed Electrospun Ultrathin Poly(ε-caprolactone) Fibers and Electrosprayed Nanostructured Silica Microparticles for Easy Emptying Packaging Applications. Coatings 2018, 8, 173. [Google Scholar] [CrossRef]
  44. Schmidt, M.C. Untersuchung und Verbesserung des Entleerungsverhaltens von Füllgut-Verpackungssystemen; University of Stuttgart: Stuttgart, Germany, 2011. [Google Scholar]
  45. Smith, J.D.; Dhiman, R.; Anand, S.; Reza-Garduno, E.; Cohen, R.E.; McKinley, G.H.; Varanasi, K.K. Droplet mobility on lubricant-impregnated surfaces. Soft Matter 2013, 9, 1772–1780. [Google Scholar] [CrossRef]
  46. Solomon, B.R.; Khalil, K.S.; Varanasi, K.K. Drag Reduction using Lubricant-Impregnated Surfaces in Viscous Laminar Flow. Langmuir 2014, 30, 10970–10976. [Google Scholar] [CrossRef]
  47. Loibl, F.; Langowski, H.-C. Improved emptying behaviour of packaging coated with plasma-polymerized nanoscale layers. In VDI Berichte (2027); VDI Fachmedien GmbH & Co. KG: Düsseldorf, Germany, 2008; pp. 133–136. [Google Scholar]
  48. Dahlén, L.; Lagerkvist, A. Methods for household waste composition studies. Waste Manag. 2008, 28, 1100–1112. [Google Scholar] [CrossRef]
  49. Kostic, D.; Hoffmann, U.; Fürtauer, S.; Fell, T.; Yilmaz, C.; Burth, D.; Sängerlaub, S. Packaging Weight, Filling Ratio and Filling Efficiency of Yogurt and Relevant Packagings Depending on Commercial Packaging Design, Material, Packaging Type and Filling Quantity. Dairy 2022, 3, 46. [Google Scholar] [CrossRef]
  50. Braun, J. Technische Strömungsmechanik: Lehrbuch für Ingenieurstudiengänge; BoD—Books on Demand: Norderstedt, Germany, 2015; ISBN 9783735723482. [Google Scholar]
  51. Herwig, H. Das seltsame Verhalten einiger Flüssigkeiten im Haushalt. In Ach, So Ist Das!: 50 Thermofluiddynamische Alltagsphänomene Anschaulich und Wissenschaftlich Erklärt; Herwig, H., Ed.; Springer Fachmedien Wiesbaden: Wiesbaden, Germany, 2014; pp. 3–7. ISBN 978-3-658-05630-8. [Google Scholar]
Figure 1. Residual quantities in PE tubes (a) related to filling quantity (n = 180); (b) absolute values depending on the filling quantity (n = 180) (c) related to packaging weights (with closure, n = 125).
Waste 01 00052 g001aWaste 01 00052 g001b
Figure 2. Residual quantities in PE tubes broken down into individual fill products (a) related to filling quantity: cream—n = 78; gel—n = 18; shampoo—n= 43; toothpaste—n= 67; (b) related to packaging weight (with and without closures).
Waste 01 00052 g002aWaste 01 00052 g002b
Figure 3. Residual quantities in PP cups, n= 100, (a) related to filling quantity; (b) absolute values depending on the filling quantity (c) related to packaging weight (with and without lids).
Waste 01 00052 g003aWaste 01 00052 g003b
Figure 4. Residual quantities in PP bottles (n = 109) and PE bottles (n = 157) with shower gel (a) related to filling quantity; (b) absolute values depending on the filling quantity (c) related to packaging weight (with and without lids).
Waste 01 00052 g004
Figure 5. Residual quantities in PET bottles (n = 82) (a) related to filling quantity; (b) absolute values depending on the filling quantity (c) related to packaging weight (with and without closures).
Waste 01 00052 g005aWaste 01 00052 g005b
Figure 6. Residual quantities in PET bottles related to packaging weight (with lid) broken down into individual fill products: ketchup—n = 6; milk—n = 3; vegetable oil—n = 14; juice—n = 11; liquid soap—n = 2; soft drink—n = 9; handwashing detergent—n = 47; water—n = 16; mouthwash—n = 3.
Waste 01 00052 g006
Table 1. Emptying behaviour of various packagings; n: number of analysed samples; u. q.: upper quartile; l. q.: lower quartile; s.p.: sorting plant of a dual system; i.p.: instructed person (laboratory); m: mean values; v: various measuring series.
PackagingFill ProductnFill QuantityResidual Quantity in gResidual Quantity/Fill Quantity in g/gPackaging Weight (Body) in gWeight Closure in gWeight Label in gResidual Quantity/Weight Packaging in g/gSample
MedianMinMaxu. q.l. q.
PE tubetoothpaste3050–125 mL10.40.1273.8–7.71.6–6.5none1.100.263.051.670.72s.p.
PE tubehair gel4230–200 mL11.30.0694.6–14.52.4–10.0none0.360.080.840.70.24s.p.
PE tubeshampoo1650–200 mL8.20.0332.8–9.85.8–16.8none0.260.011.220.560.07s.p.
PE tubecrème3050–250 mL6.50.1133.9–16.21.5–10.6none0.670.031.5210.35s.p.
PP cupmostly dairy products10050–500 mL0.80.0043.8–13.5n.a.none0.05600.290.130.015s.p.
PP cupvarious dairy products3184–245 g0.95–3.070.007–0.0108.2–13.9 (all)n.a.n.a.0.11–0.22, m i.p. [34,42]
PS cupvarious dairy products3130–251 g1.19–1.940.007–0.0137.47–9.35 (all)n.a.n.a.0.13–0.34, m i.p. [34,42]
PS cupcurd37500 g0.30.0015.7–9.3≤0.56none0.0800.290.150.04s.p. [33]
PS cupyoghurt29500 mL0.50.00111.1–17.1≤1.54≤0.620.03600.090.050.019s.p. [33]
PS cupyoghurt36<500 mL0.30.0013.0–5.7≤0.52none0.0500.30.140.02s.p. [33]
PS cupyoghurt, dessert3950–200 g0.1n.a.2.2–14.5≤0.56none0.0280.0010.070.040.01s.p. [33]
PS cupyoghurt with corner30150 g0.50.0037.5–17.2≤0.49none0.040.010.0970.0590.023s.p. [33]
PS cupmilk rice29200 g0.20.0015.7–15.1≤1.820.940.020.0090.090.050.018s.p. [33]
PS cupbutter milk20500 g0.30.0019.4–13.1≤0.84none0.020.0040.070.040.013s.p. [33]
PS cupbutter milk drink17500 g0.30.00119.7–21.2≤3.11.680.0100.120.050.007s.p. [33]
PS cupbutter milk dessert15100–300 g0.2n.a.4.4–13.1≤0.96none0.0200.110.050.006s.p. [33]
PS cupsour cream10200 g0.20.0015.3–7.9≤14none0.0250.0090.070.040.019s.p. [33]
PS cupwhipped cream30200 mL0.10.0014.7–5.6≤0.62none0.020.0050.0550.040.01s.p. [33]
PS cupgrainy cream cheese11200 g0.30.0025.8–7.1≤0.88none0.040.0180.0890.060.026s.p. [33]
PE-HD bottleshower gel157150–750 mL9.20.03416.8–60.0none0.64–2.240.1701.010.440.06s.p.
PP bottleshower gel109100–750 mL4.70.01812.8–49.1none0.37–1.530.0800.470.240.02s.p.
PP bottletomato ketchup6380–550 g25.3–108.50.051–0.2922.3–31.04.7–11.10.63–1.270.67–3.94, m s.p. [34,41]
PET bottleketchup6500 mL12.30.02528.0–42.9n.a.n.a.0.360.090.630.490.16s.p.
PET bottlemilk3500–1000 mL1.30.00120.3–29.0n.a.n.a.0.0200.140.140.01s.p.
PET bottleoil14250–1000 mL1.10.00516.4–56.1n.a.n.a.0.0600.120.060s.p.
PET bottlejuice11330–1350 mL2.10.00217.8–50.6n.a.n.a.0.0200.250.120s.p.
PET bottleliquid soap2250 mL0.60.00222.5–49.2n.a.n.a.0.0100.020.020s.p.
PET bottlesoft drink9250–1000 mL1.80.00314.5–76.4n.a.n.a.0.0100.150.10s.p.
PET bottlehand washing detergent47125–1000 mL3.00.00424.7–60.1n.a.n.a.0.0400.230.110.01s.p.
PET bottlemouthwash3600 mL0.90.00140.0–51.5n.a.n.a.0.010.010.030.030.01s.p.
PET bottlevarious dairy products3126–750 g1.8–20.30.005–0.067.2–31 (all) 0.1–0.81, m i.p. [34,42]
PET bottlewater16500–1500 mL1.70.00313.9–54.2n.a.n.a.0.0100.060.050s.p.
PET bottlewater16–29, v500 mL0.5–2.50.001–0.00510.8–28.41.68–2.180.27–0.620.015–0.150–0.010.05–0.620.08–0.320.002–0.07i.p. [33]
PET bottlewater23750 mL2.20.00321.8–21.94.65–5.00.450.080.030.160.10.04i.p. [33]
PET bottlewater17–27, v1000 mL0.8–2.20.002–0.00826.7–30.61.63–2.830.31–0.540.02–0.0670–0.010.14–0.230.11–0.120.016–0.045i.p. [33]
PET bottlewater16–29, v1500 mL0.4–2.50.001–0.00221.8–32.10.87–2.950.4–0.650.01–0.090–0.030.018–0.260.014–0.160.011–0.07i.p. [33]
PET bottlewater181750 mL2.80.00235.9–35.11.65–1.830.770.0700.110.090.02i.p. [33]
PET bottlelemonade15–23, v500 mL1.2–1.90.002–0.00413.0–26.81.65–1.910.27–0.660.05–0.120.005–0.020.1–0.340.086–0.230.035–0.09i.p. [33]
PET bottlelemonade15–20, v1000 mL2.3–3.80.002–0.00434.7–36.02.57–2.691.270.07–0.0970.06–0.0840.087–0.130.082–0.1070.064–0.088i.p. [33]
PET bottleice tea15500 mL3.10.00641.9–42.12.85–2.936.00.050.030.110.070.039i.p. [33]
PET bottleice tea26–30, v1500 mL4.1–4.20.00336.1–37.12.98–3.271.06–1.290.09–0.0920–0.0430.151–0.210.11–0.130.06–0.07i.p. [33]
Disclaimer/Publisher’s Note: The statements, opinions and data contained in all publications are solely those of the individual author(s) and contributor(s) and not of MDPI and/or the editor(s). MDPI and/or the editor(s) disclaim responsibility for any injury to people or property resulting from any ideas, methods, instructions or products referred to in the content.

