Article

Gasification of Waste Machine Oil by the Ultra-Superheated Mixture of Steam and Carbon Dioxide

by
Sergey M. Frolov
*,
Anton S. Silantiev
,
Ilias A. Sadykov
,
Viktor A. Smetanyuk
,
Fedor S. Frolov
,
Jaroslav K. Hasiak
,
Alexey B. Vorob’ev
,
Alexey V. Inozemtsev
and
Jaroslav O. Inozemtsev
Semenov Federal Research Center for Chemical Physics of the Russian Academy of Sciences, 4 Kosygin Str., Moscow 119991, Russia
*
Author to whom correspondence should be addressed.
Waste 2023, 1(2), 515-531; https://doi.org/10.3390/waste1020031
Submission received: 10 March 2023 / Revised: 27 April 2023 / Accepted: 26 May 2023 / Published: 1 June 2023

Abstract

:
Reported in the article is further progress in the development of the novel pulsed detonation gun (PDG) technology for the conversion of organic wastes into syngas in a two-component gasifying agent (GA) containing ultra-superheated steam and carbon dioxide obtained by pulsed detonations of a natural gas–oxygen mixture at a frequency of 1 Hz. Experimental studies were carried out on a waste converter with a 40 dm3 flow reactor and two PDGs with a total volume of 2.4 or 3.2 dm3, which is approximately a factor of 6 and 4.5 less than in previous studies, respectively. The objective of the research was to find the design and operation parameters of the waste converter that provide a minimum amount of CO2 in the gasification products. Waste machine oil was used as a feedstock. It is shown that, compared with the earlier experiments with a higher average temperature of the reactor wall and with a PDG of a much larger volume, the contents of H2, CO, CH4, and CO2 in the syngas remained virtually unchanged, whereas the efficiency of the gasification process increased significantly: the use of 1 g of natural gas made it possible to gasify up to 4 g of the feedstock. It is also shown that the determining role in the gasification process of liquid feedstock is played by the feedstock residence time in the PDG rather than in the reactor. The minimum ratio between the flow rates of the GA and liquid feedstock, the minimum ratio between the flow rates of combustible gas and liquid feedstock, as well as the actual GA consumption in the gasification process are determined experimentally.

1. Introduction

Thermal processing of liquid/solid organic waste with superheated water or steam [1,2,3,4] and/or CO2 [5] is considered a competitive and economically attractive technology for converting waste into energy [6,7], into hydrogen [8,9], into fuel [10], and into plastics [11], especially when the process heat is obtained using environmentally friendly sources [12,13,14], other than direct combustion of feedstock. The current state, problems, and prospects of the industrial thermal processing of organic wastes were discussed elsewhere [15].
The use of H2O and/or CO2 as gasifying agents has a number of advantages [16,17]. H2O and CO2 consist only of H and O atoms and C and O atoms, respectively; therefore, the syngas obtained by organic waste gasification is not diluted with other gases. Waste gasification with H2O and/or CO2 requires less gasifying agent (GA) due to its high enthalpy. The use of the combined H2O/CO2 gasifying agent allows controlling the composition of the syngas. The use of H2O as a GA increases economic efficiency [18,19]. Finally, the syngas obtained by waste gasification in the absence of free oxygen does not contain toxic compounds such as dioxins and furans [20]. The amount of H2 obtained during the steam gasification of biomass is about three times greater than during its air-assisted gasification. CO2 for the gasification of organic waste can be taken from the flue gases of power plants, which will reduce greenhouse gas emissions and reduce the carbon footprint.
Depending on the heat source used, all gasification technologies are divided into autothermal and allothermal [21,22]. Autothermal technologies use the gasification heat generated in the gasifier itself by adding oxygen or air to partially burn the feedstock. The share of the burned feedstock can be essential [23,24]. Allothermal technologies use heat for gasification supplied from an external source, such as heat exchangers, electric heaters, heat carriers, plasma arcs, etc. [25].
Depending on the process temperature, all gasification technologies are divided into low-temperature and high-temperature ones. Low-temperature gasification is usually carried out at temperatures below 1000 °C and results in the production of syngas, char, and slag. Syngas is usually contaminated with tar (aromatic organic compounds heavier than C6H6), CO2, and particulate matter, as well as alkali metal-, chlorine-, and sulfur-containing compounds. Therefore, the removal of impurities from syngas is one of the necessary stages of all low-temperature gasification technologies. Char, the solid residue of organic waste, consists mainly of carbon, but may contain some hydrogen and oxygen, as well as inorganic ash. Slag, the glassy by-product of gasification, is considered safe and can be used as road construction, roofing material, etc.
The main disadvantages of existing low-temperature gasification technologies are the low quality of the product syngas due to the high content of tar and CO2, the low process efficiency due to the large amount of residual char, the difficulty in controlling the quality of syngas due to the long stay of the feedstock in the reaction zone, as well as the low yield of syngas due to the high content of tar and char and the partial use of syngas and char for producing the process heat. Current research and development are mainly focused on the pretreatment of feedstock and increasing its reactivity [26].
High-temperature gasification is carried out at temperatures above 1200 °C. Such temperatures are reached during combustion, in plasma, and in concentrators of solar radiation. Gasification products are high-quality syngas and slag, and syngas consists mainly of H2 and CO, the content of hydrocarbons higher than C1–C2 is negligible, and compounds containing alkali metals, chlorine, and sulfur take on the simplest chemical structures.
The main advantages of high-temperature gasification technologies are the production of high-quality syngas with low tar and CO2 content, high process efficiency due to negligible tar and char residues, ease of syngas quality control due to the short residence time of feedstock in the reaction zone, and potentially high syngas yield due to the use of external energy sources for producing the process heat. Despite these advantages, high-temperature plasma and solar-assisted technologies have certain disadvantages that limit their wide application. Industrial microwave and electric arc technologies require tremendous amounts of electricity to obtain plasma with local temperatures from 5000 to 10,000 °C, which are not in demand because the typical average operation temperatures in plasma gasifiers are 1300–1700 °C. Due to such a high average operation temperature, the walls of the gasifiers must be water-cooled and made of special materials with a refractory lining. The service life of arc electrodes is only hundreds of hours. The efficiency of microwave gasification depends on feedstock properties. The main disadvantage of solar-assisted gasification is its intermittent nature.
In [21,22,27,28], we proposed a new technology referred to as the pulsed detonation gun (PDG) technology for the high-temperature gasification of organic wastes by the combined GA containing H2O and CO2 heated to temperatures above 2000 °C in pulsed or continuous detonations of fuel–oxygen mixtures diluted with low-temperature steam. The ability of such a GA to gasify liquid and solid organic wastes without adversely affecting the environment is well known [21,22]. At temperatures above 1500 °C, the tar and char formed at the initial stages of the gasification process are completely converted into syngas ideally consisting only of H2 and CO in a ratio depending on the feedstock, while the condensed solid and liquid residues consist of safe simple oxides and aqueous solutions of simple anoxic acids such as HCl, HF, H2S, and ammonia NH3 [29,30,31]. Mineral residues can be used as additives in building materials, while acids can be separated, concentrated, and marketed. In other words, the gasification of organic waste with such a GA potentially allows complete conversion of waste into useful products without emissions into the atmosphere, into the ground, and into water bodies.
This work is aimed at the further development of the PDG technology for the conversion of organic wastes into syngas by a two-component (H2O/CO2) GA obtained by pulsed detonations of a natural gas–oxygen mixture [32,33,34]. In [32,33], the PDG technology was used for autothermal high-temperature conversion of natural gas and allothermal oxygen-free gasification of liquid/solid organic wastes in a waste gasifier (WG) at atmospheric pressure using a PDG with a volume of 15 dm3, operating at a frequency of 1 Hz, and flow reactors with a volume of 100 [32,33] and 40 dm3 [33]. It turned out that the measured concentrations of H2, CO, and CO2 in the syngas obtained by the conversion of natural gas and the gasification of liquid/solid organic wastes were virtually independent of the feedstock and the volume of the flow reactor, which is explained by the high values of the local instantaneous temperature in the reactor (above 2000 °C).
In this work, similar studies are carried out on a WG with a flow reactor 40 dm3 in volume, but instead of a PDG of 15 dm3 in volume, we use two PDGs with a total volume of approximately a factor of 6 and 4.5 less: 2.4 and 3.2 dm3. The main goal of the research is to find the design and operating parameters of the WG such that the gasification products contain the minimum amount of CO2 when the WG operates at a frequency of 1 Hz. The main tasks of the research are: (1) to determine the minimum ratio between the mass flow rates of the GA and liquid feedstock to achieve the maximum conversion of feedstock into syngas, (2) to determine the influence of the location of feedstock supply on the syngas quality, and (3) to determine the effect of the feedstock residence time in the PDG and flow reactor on the syngas quality.

2. Materials and Methods

2.1. Properties of Feedstock and Fuel

Table 1 and Table 2 show the proximate and ultimate analyses of the waste machine oil used as a feedstock in this work. Table 3 shows the composition of natural gas used in the PDGs as a fuel. Technical oxygen (99.7%) was used as an oxidizer for the PDGs. Table 4 shows the typical composition of the GA—the mixture of ultra-superheated steam and carbon dioxide—measured in the experiments without feedstock supply.

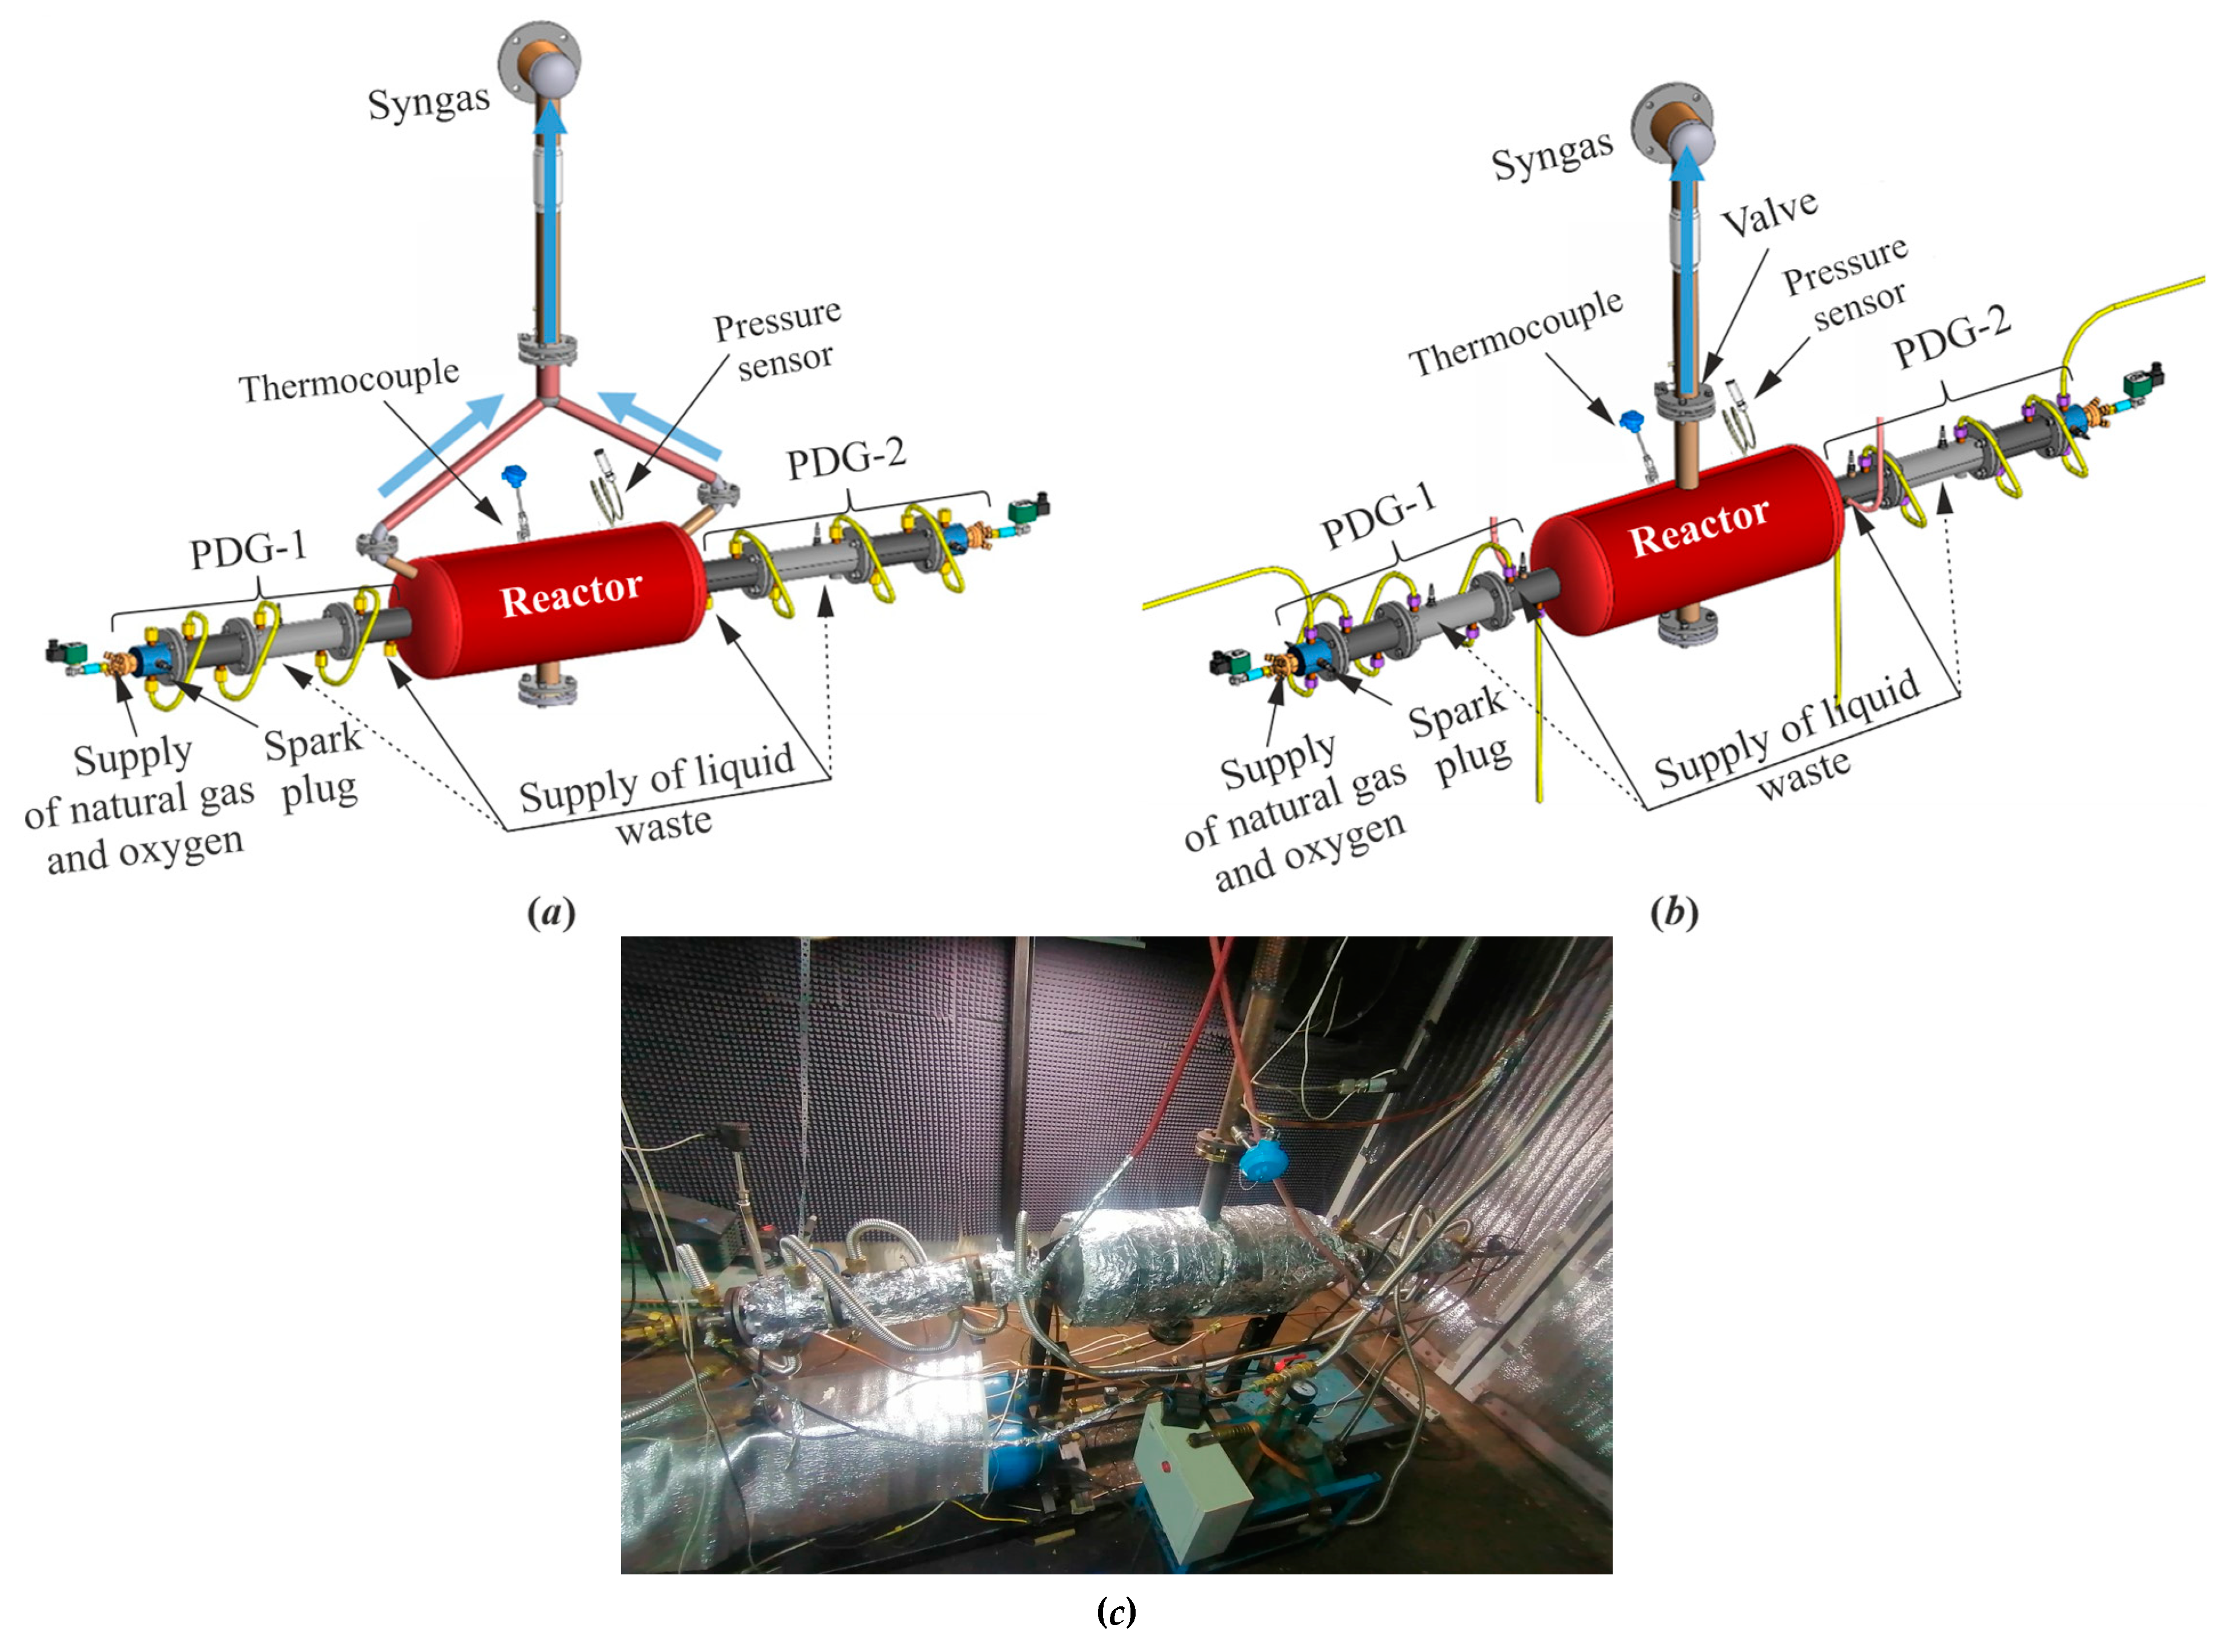
2.2. Waste Gasifier and Principle of Its Operation

Figure 1 shows a schematic and a photograph of the WG. The WG consists of two coaxial identical PDGs (PDG-1 and PDG-2) connected from different sides to a flow reactor. Liquid waste is supplied from a single tank in the PDGs in the form of sprays under the pressure of nitrogen. The location of waste supply to a PDG can change: either at the end of the PDG before entering the flow reactor, or in the central part of the PDG. A detailed description of the design and operation principle of PDG, flow reactor, and WG as a whole is given below.
The PDG is a tube 50 mm in diameter with one end open and the other closed. The open end of the tube communicates with the flow reactor. The closed end of the tube is equipped with a spark plug and ports for the supply of fuel and oxygen from manifolds with control valves. The operation cycle of the PDG starts from supplying fuel and oxygen to the tube. Once the tube is filled with the combustible mixture, the spark plug is triggered to ignite the flame, which rapidly accelerates in the tube and transitions to a detonation via deflagration-to-detonation transition (DDT). The resulting detonation wave propagates through the combustible mixture at a speed above 2300 m/s, converting the mixture into the detonation products, consisting mainly of H2O and CO2 at very high values of temperature (above 3400 °C) and pressure (above 20 bar). After the detonation wave enters the flow reactor as a strong shock wave, the detonation products expand into the flow reactor in the form of a high-speed (above 1000 m/s) dense jet with the temperature reduced to about 2000 °C [21,34]. When the pressure in the PDG drops to a value slightly exceeding the atmospheric pressure, a new portion of combustible mixture is supplied to the tube through the ports at the closed end. After the PDG is filled with the mixture, the spark plug is triggered to ignite the flame, and the next operation cycle starts. To avoid uncontrolled ignition of the combustible mixture of the new cycle by the hot detonation products of the previous cycle, a short advance in fuel supply is used for creating a plug between them. The PDG operates in a pulsed mode with a pulse frequency mainly determined by the characteristic fill and exhaust times, as these times are an order of magnitude greater than the time taken for flame ignition, DDT, detonation propagation along the tube, and outflow of detonation products. Note that waste supply to the PDG can affect both DDT and developed detonation. Depending on the location and the mass flow rate of waste supply, they can fail or decay, respectively.
The PDG as a generator of ultra-superheated GA (a mixture of H2O and CO2) has a number of advantages [28]. Firstly, it can be made of conventional construction materials, since it is effectively cooled internally during the fill process, and can be water cooled externally. Secondly, it is capable of operating on any available gaseous or liquid hydrocarbon fuel as fuel–oxygen mixtures commonly exhibit high detonability. Moreover, the PDG can efficiently operate on the syngas obtained from organic waste gasification if the syngas is not much diluted with incombustible gases (nitrogen, CO2). Thirdly, the simplicity of design and operation principle of the PDG allow its scaling for industrial applications. Fourthly, the energy consumption for the cyclic operation of the PDG is negligible.
The flow reactor is based on the standard 40-L gas cylinder (241 mm in diameter and 997 mm long). It has a compact shape to avoid the formation of long-lived gas-dynamic stagnation zones leading to feedstock accumulation and slagging. Two PDGs are connected to the flow reactor coaxially opposite to each other to induce strong colliding shock waves and powerful vortex structures, increasing the residence time of feedstock particles in the flow reactor. Pulsed shock waves emanating from the PDGs possess a tremendous destructive power. They effectively crush the feedstock. Moreover, feedstock particles are subject to multiple acts of fragmentation not only by pulsed incident shock waves, but also by shock waves reflected from reactor walls. The shock waves also prevent the agglomeration of feedstock particles and their adhesion to the reactor walls. As for the powerful vortex structures, they repeatedly deliver feedstock particles in the zones with high-temperature GA far from reactor walls, thus promoting the gasification process. The flow reactor is equipped with outlet ports for continuous outflow of syngas and continuous/periodic removal of mineral residue. To avoid suction of atmospheric air, the average operation pressure in the flow reactor is kept slightly higher than the atmospheric pressure. The issues of operation safety are discussed in detail in [28].
In general, the operation principle of WG includes three transient stages preceding the nominal operation mode. The first and second stages are used to reach the steady thermal states of all structural elements without and with feedstock supply to the flow reactor, respectively. At these two stages, the WG operates on the available starting fuel (herein, natural gas). At the third stage, the starting fuel is gradually replaced with the product syngas to reach the steady-state nominal operation mode. In this latter mode, the composition of the product syngas is appropriate for use as a fuel in the PDGs. Due to the extremely high temperatures of the GA entering the flow reactor from the PDGs and the sufficient residence time of feedstock particles in the flow reactor, the product syngas must mainly contain H2 and CO, whereas volume fractions of CO2, CH4, and CxHy must tend to zero [28]. In the nominal operation mode, only a part of syngas is used as fuel [28].

2.3. Experimental Conditions

The experiments were conducted using the WG of four schemes indicated in Table 5.
In valveless schemes 1 and 3, the feedstock was supplied to the WG continuously, whereas the product syngas was taken from the end zones of the flow reactor through steel tubes 8 mm in diameter (see Figure 1a). In valved schemes 2 and 4, the feedstock was supplied to the WG in batches, whereas the product syngas was taken from the central outlet port of the flow reactor equipped with a periodically opened pneumatic valve (see Figure 1b). The valve was used to increase the residence time of the feedstock in the flow reactor: it opened after three successive detonation pulses and closed before the next detonation pulse. When the valve was opened, the supply of feedstock to the WG was interrupted. In schemes 1 and 2, the feedstock was supplied either through the port at the end or in the central part of each PDG. In schemes 3 and 4, the feedstock was supplied only through the port located in the central part of each PDG.
The following parameters were measured in the experiments: the mass flow rates of fuel and oxygen to the PDG, the mass flow rate of waste machine oil; the composition of the product syngas; the pressure in the flow reactor; and the temperature of the wall of the flow reactor. The mass flow rate of fuel varied from 0 to 0.6 g/s and was measured by the pressure drop in the fuel receiver over the measurement period. The mass flow rate of oxygen varied from 0 to 3 g/s and was measured by the pressure drop in the oxygen receiver over the measurement period. The relative error in measuring the mass flow rates of gases was 15%. The error in measuring the mass flow rate of feedstock did not exceed 10%. The composition of detonation products and syngas was measured using gas analyzers VARIO plus “Syngas” (measurement error 5% abs.) and Kristall 2000M Thermotech (measurement error ±0.0001% abs.). The temperature of the walls of the flow reactor was measured using Oven DTPN286M +1200C thermocouple (measurement error ±5 °C). The pressure in the flow reactor was measured using a Courant-DI 60 atm sensor with a natural oscillation frequency of 10 kHz (measurement error 1.0%). The locations of the thermocouple and pressure sensor are shown in Figure 1a,b. The changes of these locations on the surface of the flow reactor did not affect essentially the measured temperature and pressure.
Pulsed detonation guns in all experiments operated at a frequency of 1 Hz. The main variable in the experiments is the mass flow rate of feedstock: it varied from 0 to 3.2 g/s. The composition of the combustible mixture in the PDG was close to stoichiometric (slightly fuel-rich). The total measured content of CO2 in the dry detonation products of such a mixture reached 91.5%vol., and the remaining species were CO (5.8%vol.) and H2 (2.7%vol.).
Figure 2 shows typical time histories of the overpressure in the flow reactor, P r , and temperature of the wall, T r , of the flow reactor in two experiments with the WG of valveless (Figure 2a) and valved (Figure 2b) schemes. The instantaneous overpressure in the WG of both schemes is seen to pulsate. In the WG of the valveless scheme, the overpressure pulsates in a single pulsation mode from approximately 0.2 to 0.7 bar, whereas in the WG of valved scheme, it pulsates in a double pulsation mode from approximately 0.1 to 1.2 bar. The first mode includes 1-Hz detonation pulses, while the second mode includes three successive detonation pulses followed by the gradual pressure drop caused by valve opening. The pulsations of the first mode result in the pressure build-up. Despite these differences, the average pressure, P r m , in the flow reactor in both examples remains approximately constant and close to 0.3 and 0.4 bar, respectively. The temperature of the reactor wall in both examples is maintained as approximately constant at a level of 550–600 °C.
Figure 3 shows typical records of the VARIO gas analyzer in experiments on the WG of valveless (Figure 3a) and valved (Figure 3b) schemes when reaching a steady operation mode with a subsequent shutdown of the PDGs. The approximate moments of entering the steady mode and turning off the PDGs are shown by arrows. In both cases, the duration of WG operation in the steady mode exceeded 10 min. It can be seen that the content of free oxygen in the product syngas in the steady operation mode is zero, and the content of CO2 tends to 6–8% (vol., dry). The content of combustible gases reaches 92–94% (vol., dry), while the contents of H2 and CO reach 28 and 38% (vol., dry) in the WG of valveless scheme and 32 and 40% (vol., dry) in the WG of the valved scheme, respectively. Since the VARIO gas analyzer does not measure nitrogen and hydrocarbons other than CH4, these compounds are presented in Figure 3 as N2+CxHy. The sharp increase in the contents of N2+CxHy and O2 after the shutdown of the PDGs corresponds to the displacement of the product syngas by atmospheric air in the gas analyzer. The use of the Kristall 2000M gas analyzer made it possible to determine the composition of N2+CxHy during WG operation: mainly C2H4 (up to 51%), C2H6 (up to 36%), and C3H8 (up to 13%). No other compounds, including nitrogen, were found.

3. Results

3.1. Effect of Feedstock Supply Location

To determine the effect of the feedstock supply location on the gasification process, the WG of valveless scheme 1 and valved scheme 2 was used. The feedstock supply port was located at a distance of either L w = 545 mm or L w = 295 mm from the closed end of the PDG (see Table 5). If one counts the distance from the PDG open end, then the feedstock supply ports were located at distances of 85 mm or 335 mm, respectively. Table 6 shows the results of experiments in terms of the feedstock mass flow rate, G w , the mass flow rate of fuel (natural gas), G f , the mass flow rate of oxygen, G ox , the ratio θ = G f / G w characterizing the energy efficiency of the gasification process, the temperature of the wall of the flow reactor, T r , and the contents of CO2, CO, H2, CH4, O2, and CxHy in the dry syngas. Figure 4 compares the measured compositions of the syngas. Based on the data in Table 5 and Figure 4, the following conclusions can be drawn.
  • Increasing the residence time of feedstock in the flow reactor due to the use of valve (the mean residence time is expected to increases by a factor of about 3) leads to an increase in the yields of target gasification products (H2 and CO) and a decrease in the yields of CO2, CH4, and CxHy. In the valved schemes, the contents of H2 and CO reach 31 and 43% (vol., dry), respectively, and the contents of CO2, CH4, and CxHy decrease to 10, 10, and 6% (vol., dry), respectively, i.e., the maximum content of combustible gases reaches 90% (vol., dry);
  • The supply of feedstock to the PDG through the port located farther from the inlet to the flow reactor increases the yields of target gasification products (H2 and CO) and reduces the yield of CO2. As for CH4 and CxHy, the displacement of the feedstock supply location from the flow reactor has a multidirectional effect on their yields: the yield of CH4 increases, while the yield of CxHy decreases. The obtained results are apparently explained by the fact that the supply of feedstock to the PDG farther from the inlet to the flow reactor leads to an increase in the feedstock residence time in the high-temperature GA behind a propagating detonation wave and a greater progress in the gasification reaction, resulting in a decrease in the yields of CO2 and CxHy;
  • In the WG with short PDGs, a minimum G f / G w ratio of 0.17 was achieved in the experiments.

3.2. Effect of Length (Volume) of the Pulsed Detonation Gun

To determine the effect of the length (volume) of the PDG on the gasification process, the WG of valveless schemes 1 and 3 and valved schemes 2 and 4 was used. Remember that these pairs of schemes differ by the lengths (volumes) of PDGs equal to 0.63 cm (2.4 dm3) and 0.82 cm (3.2 dm3), respectively. The feedstock supply port was located at a distance L w = 335 mm or L w = 525 mm from the closed end of the PDG, respectively (see Table 5). If one counts the distances from the PDG open end, then the feedstock supply ports were located at a distance of 295 mm in all cases. Table 7 shows the results of experiments in terms of G w , G f , G ox , θ = G f / G w , T r , and the composition of dry syngas. Figure 5 compares the measured compositions of the syngas. Based on the data in Table 6 and Figure 5, the following conclusions can be drawn:
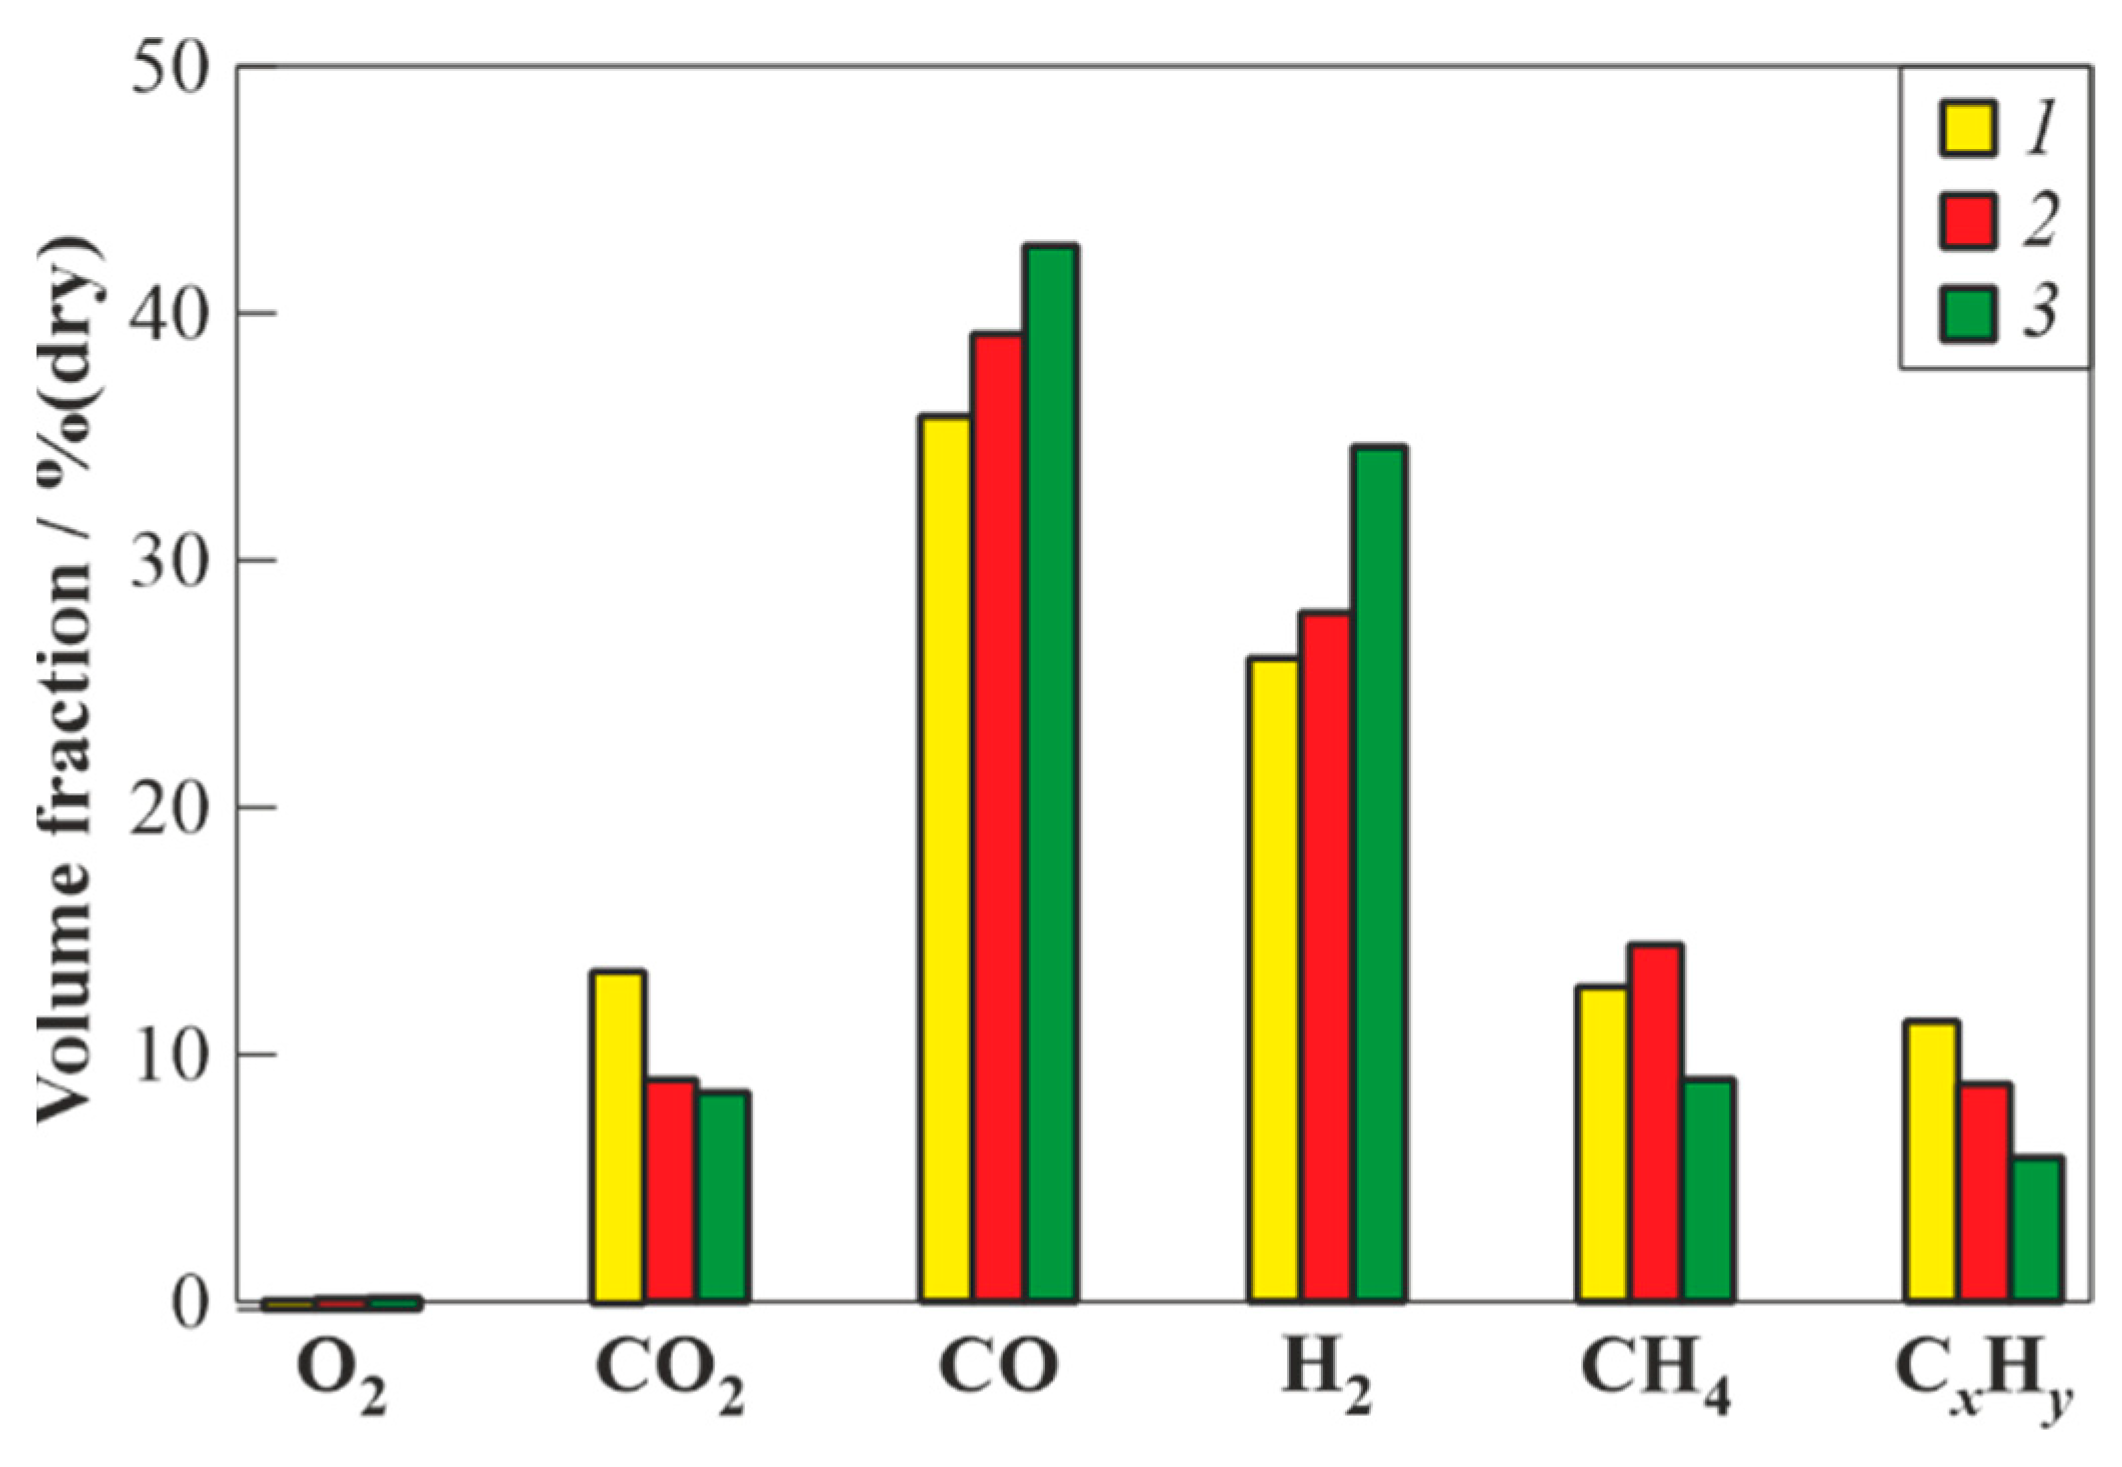
  • An increase in the residence time of the feedstock in the WG of valveless scheme due to the use of longer PDGs leads to an increase in the yields of target gasification products (H2 and CO) and a decrease in the yields of CO2, CH4, and CxHy. In the WG of valveless scheme 3, the yields of H2 and CO reach 35 and 43% (vol., dry), respectively, and the yields of CO2, CH4, and CxHy decrease to 8, 8, and 5% (vol., dry), respectively, i.e., the maximum yield of combustible gases reaches 92% (vol., dry);
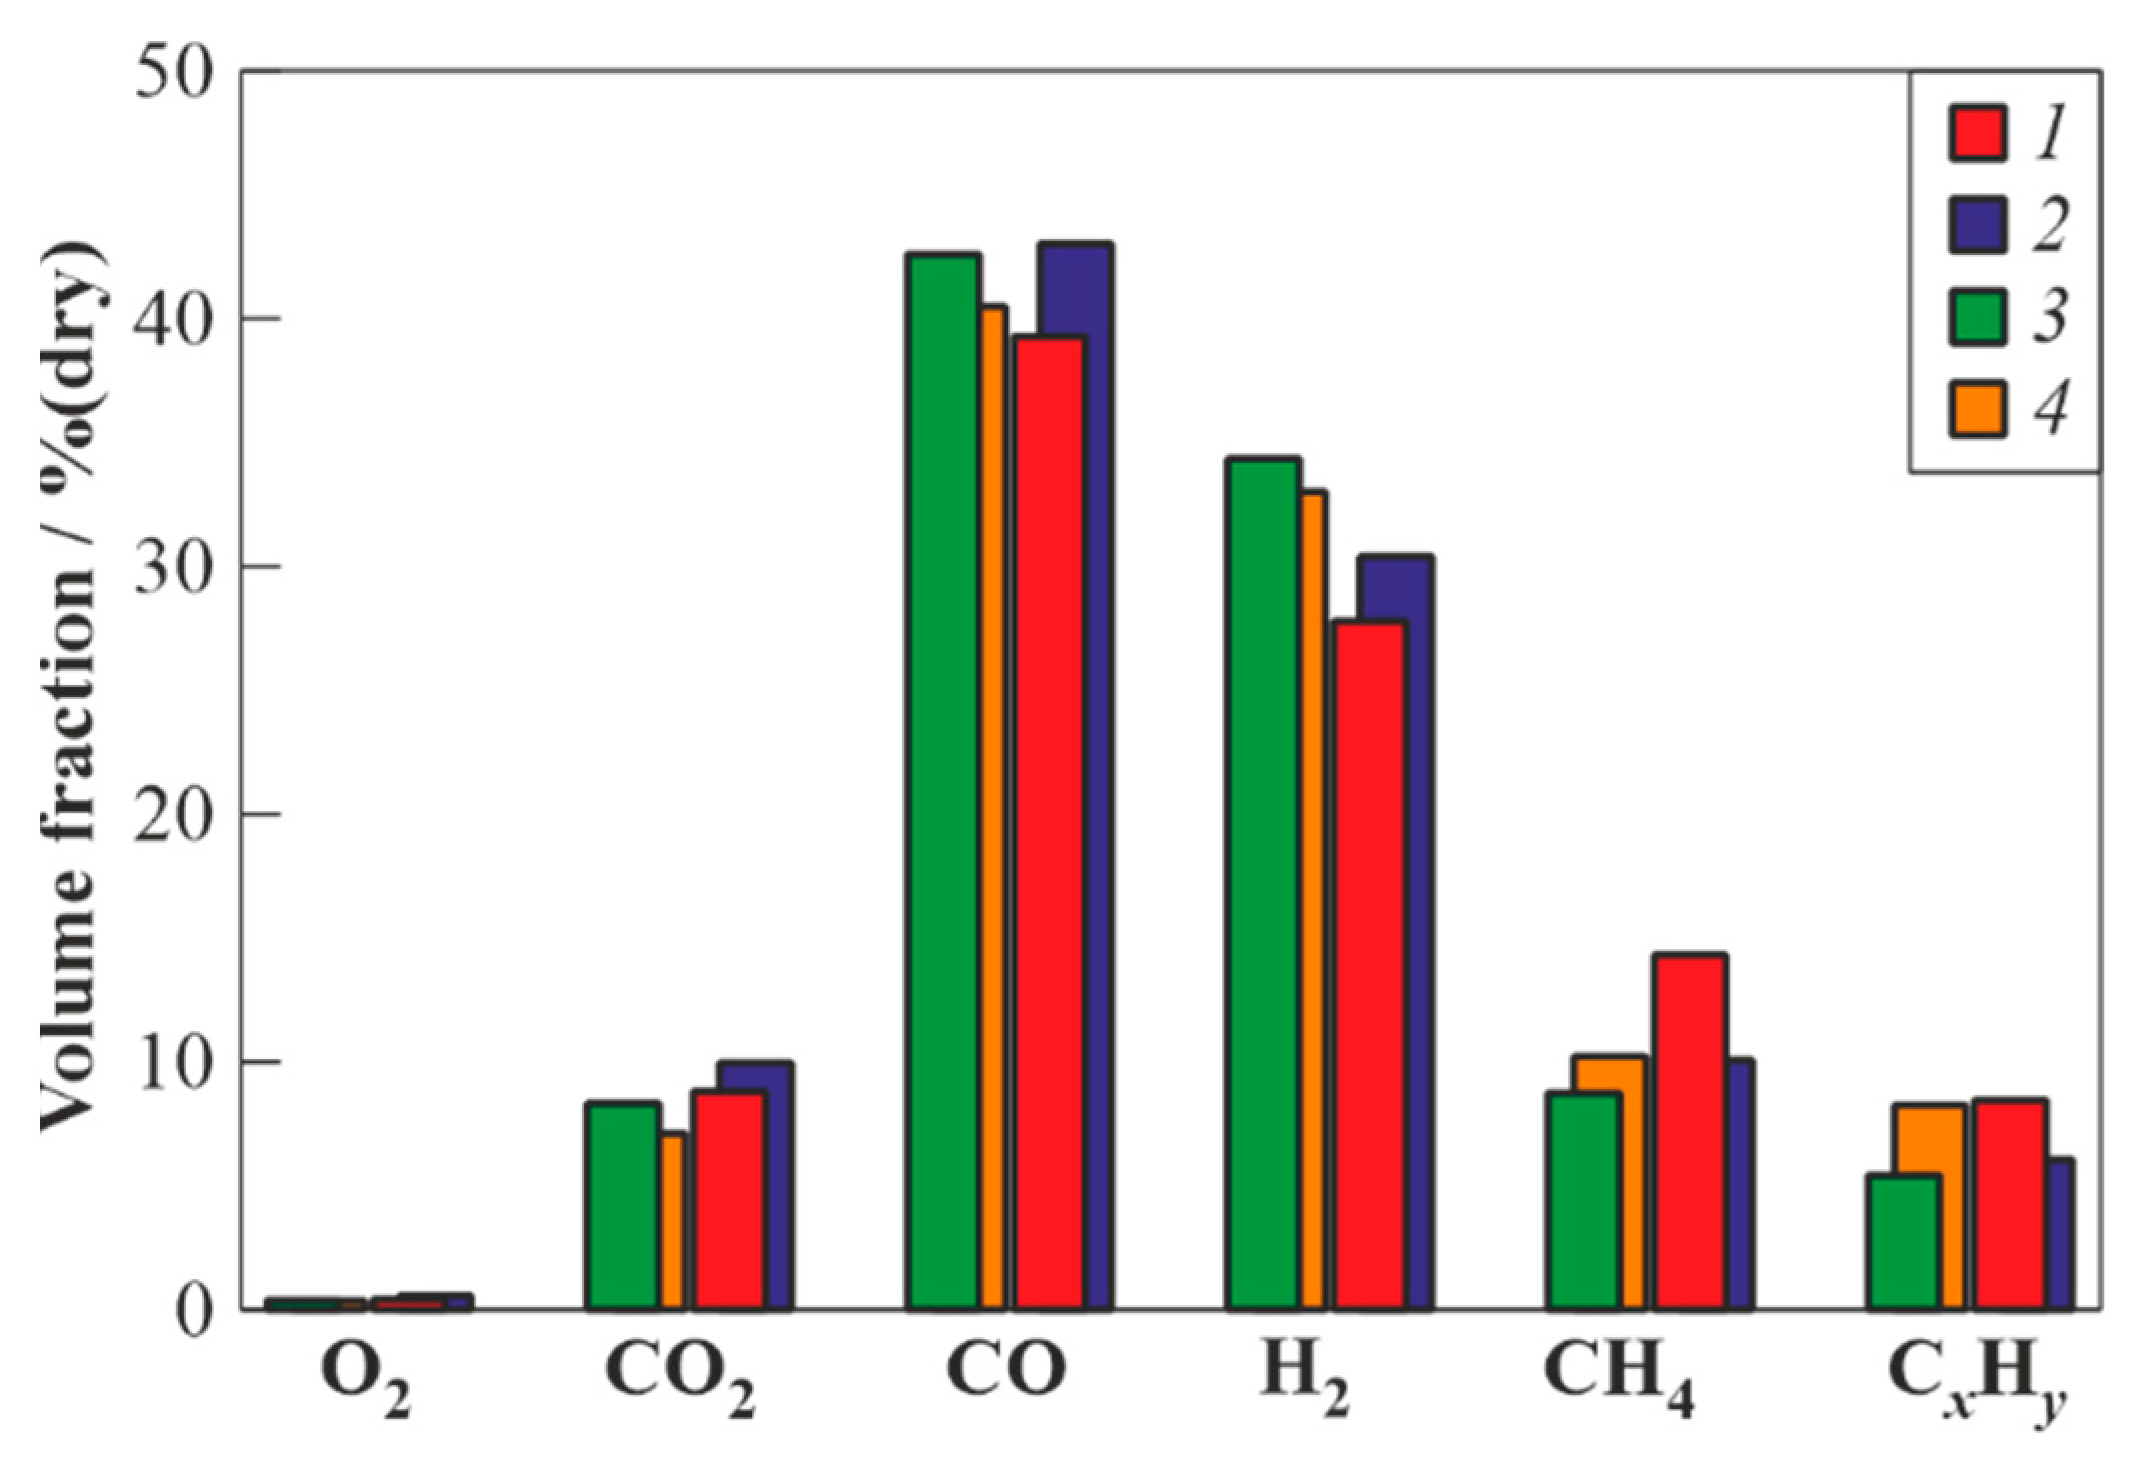
  • Increasing the residence time of the feedstock in the WG due to the use of both longer PDGs and valves leads to a decrease in the yield of CO2 to 7% (vol., dry) and an increase in the maximum combustible gas yield to 93% (vol., dry) (compare schemes 3 and 4). At the same time, the yields of the target gasification products (H2 and CO) somewhat decrease (to 34 and 40% (vol., dry)), while the yields of CH4 and CxHy slightly increase (to 10 and 8% (vol., dry)) compared to those in the valveless schemes. The latter could be explained by the larger relative loading of the reactor with the feedstock ( G w to G f + G ox ratio 0.56 vs. 1.21) and possibly incomplete gasification of feedstock;
  • The use of the valve in the WG with short PDGs leads to an increase in the yields of both the target gasification products (H2 and CO) and CO2, but also to a decrease in the yields of CH4 and CxHy. The yields of H2 and CO increase from 27 and 39% (vol., dry) to 31 and 43% (vol., dry), respectively, the yield of CO2 increases from 9 to 10% (vol., dry), and the yields of CH4 and CxHy decrease from 15 and 8% (vol., dry) to 10 and 6% (vol., dry), respectively. The maximum yield of combustible gases reaches 90% (dry vol.);
  • In contrast to the WG with short PDGs, the use of the WG of the valved scheme with long PDGs leads to a decrease in both the yields of target gasification products (H2 and CO) and CO2, but also to an increase in the yields of CH4 and CxHy. The yields of H2 and CO decrease from 34.5 and 43% (vol., dry) to 33 and 41% (vol., dry), respectively, the yield of CO2 decreases from 8 to 7% (vol., dry), and the yields of CH4 and CxHy increase from 8 and 5% (vol., dry) to 10 and 8% (vol., dry), respectively. The maximum yield of combustible gases reaches 93% (vol., dry);
  • As in the case of the WG with short PDGs, the minimum ratio θ = G f / G w = 0.16 was achieved in the WG with long PDGs.

3.3. Effect of Feedstock Residence Time in the Pulsed Detonation Gun

The use of PDGs of different length with different locations of feedstock supply makes it possible to trace the influence of the feedstock residence time in the PDG on the characteristics of the gasification process in the WG of valveless schemes. Obviously, the minimum residence time of the feedstock in the PDG is achieved in the WG of scheme 1 with short PDGs and with feedstock supply near the inlet to the flow reactor. The maximum residence time of the feedstock in the PDG was achieved using the WG of scheme 3 with long PDGs and with feedstock supply far from the inlet to the flow reactor. Finally, some intermediate residence time of the feedstock in the PDG was achieved in the WG of scheme 1 with short PDGs and with feedstock supply far from the inlet to the flow reactor. Figure 6 shows the measured compositions of dry gasification products of the waste machine oil in the WG of three valveless schemes with different residence times of the feedstock in the PDG: minimum, intermediate, and maximum. It can be seen that with an increase in the feedstock residence time in the PDG the content of CO2 in the product syngas decreases. The yields of target gasification products (H2 and CO) increase, while the yields of CH4 and CxHy decrease. The increase in the yield of CH4 when changing from minimum to intermediate residence time could be explained by incomplete gasification of feedstock (see below).

3.4. Effect of Feedstock Residence Time in the Flow Reactor

Since the residence time of the feedstock in the PDG is much shorter than in the flow reactor, the use of the WG of valveless and valved schemes makes it possible to reveal the effect of the feedstock residence time in the flow reactor on the characteristics of the gasification process. Contrary to the WG of valveless schemes, in which the gasification products outflowed freely from the flow reactor (see Figure 2a), in the WG of valved schemes, the gasification products outflowed from the flow reactor after each three operation cycles of the PDGs (see Figure 2b), i.e., the feedstock residence time in the flow reactor was much longer (approximately by a factor of 3). Figure 7 compares the influence of the feedstock residence time in the flow reactor on the measured composition of dry syngas obtained in the WG of valveless and valved schemes for six different cases. Based on the data in Figure 7, the following conclusions can be drawn.
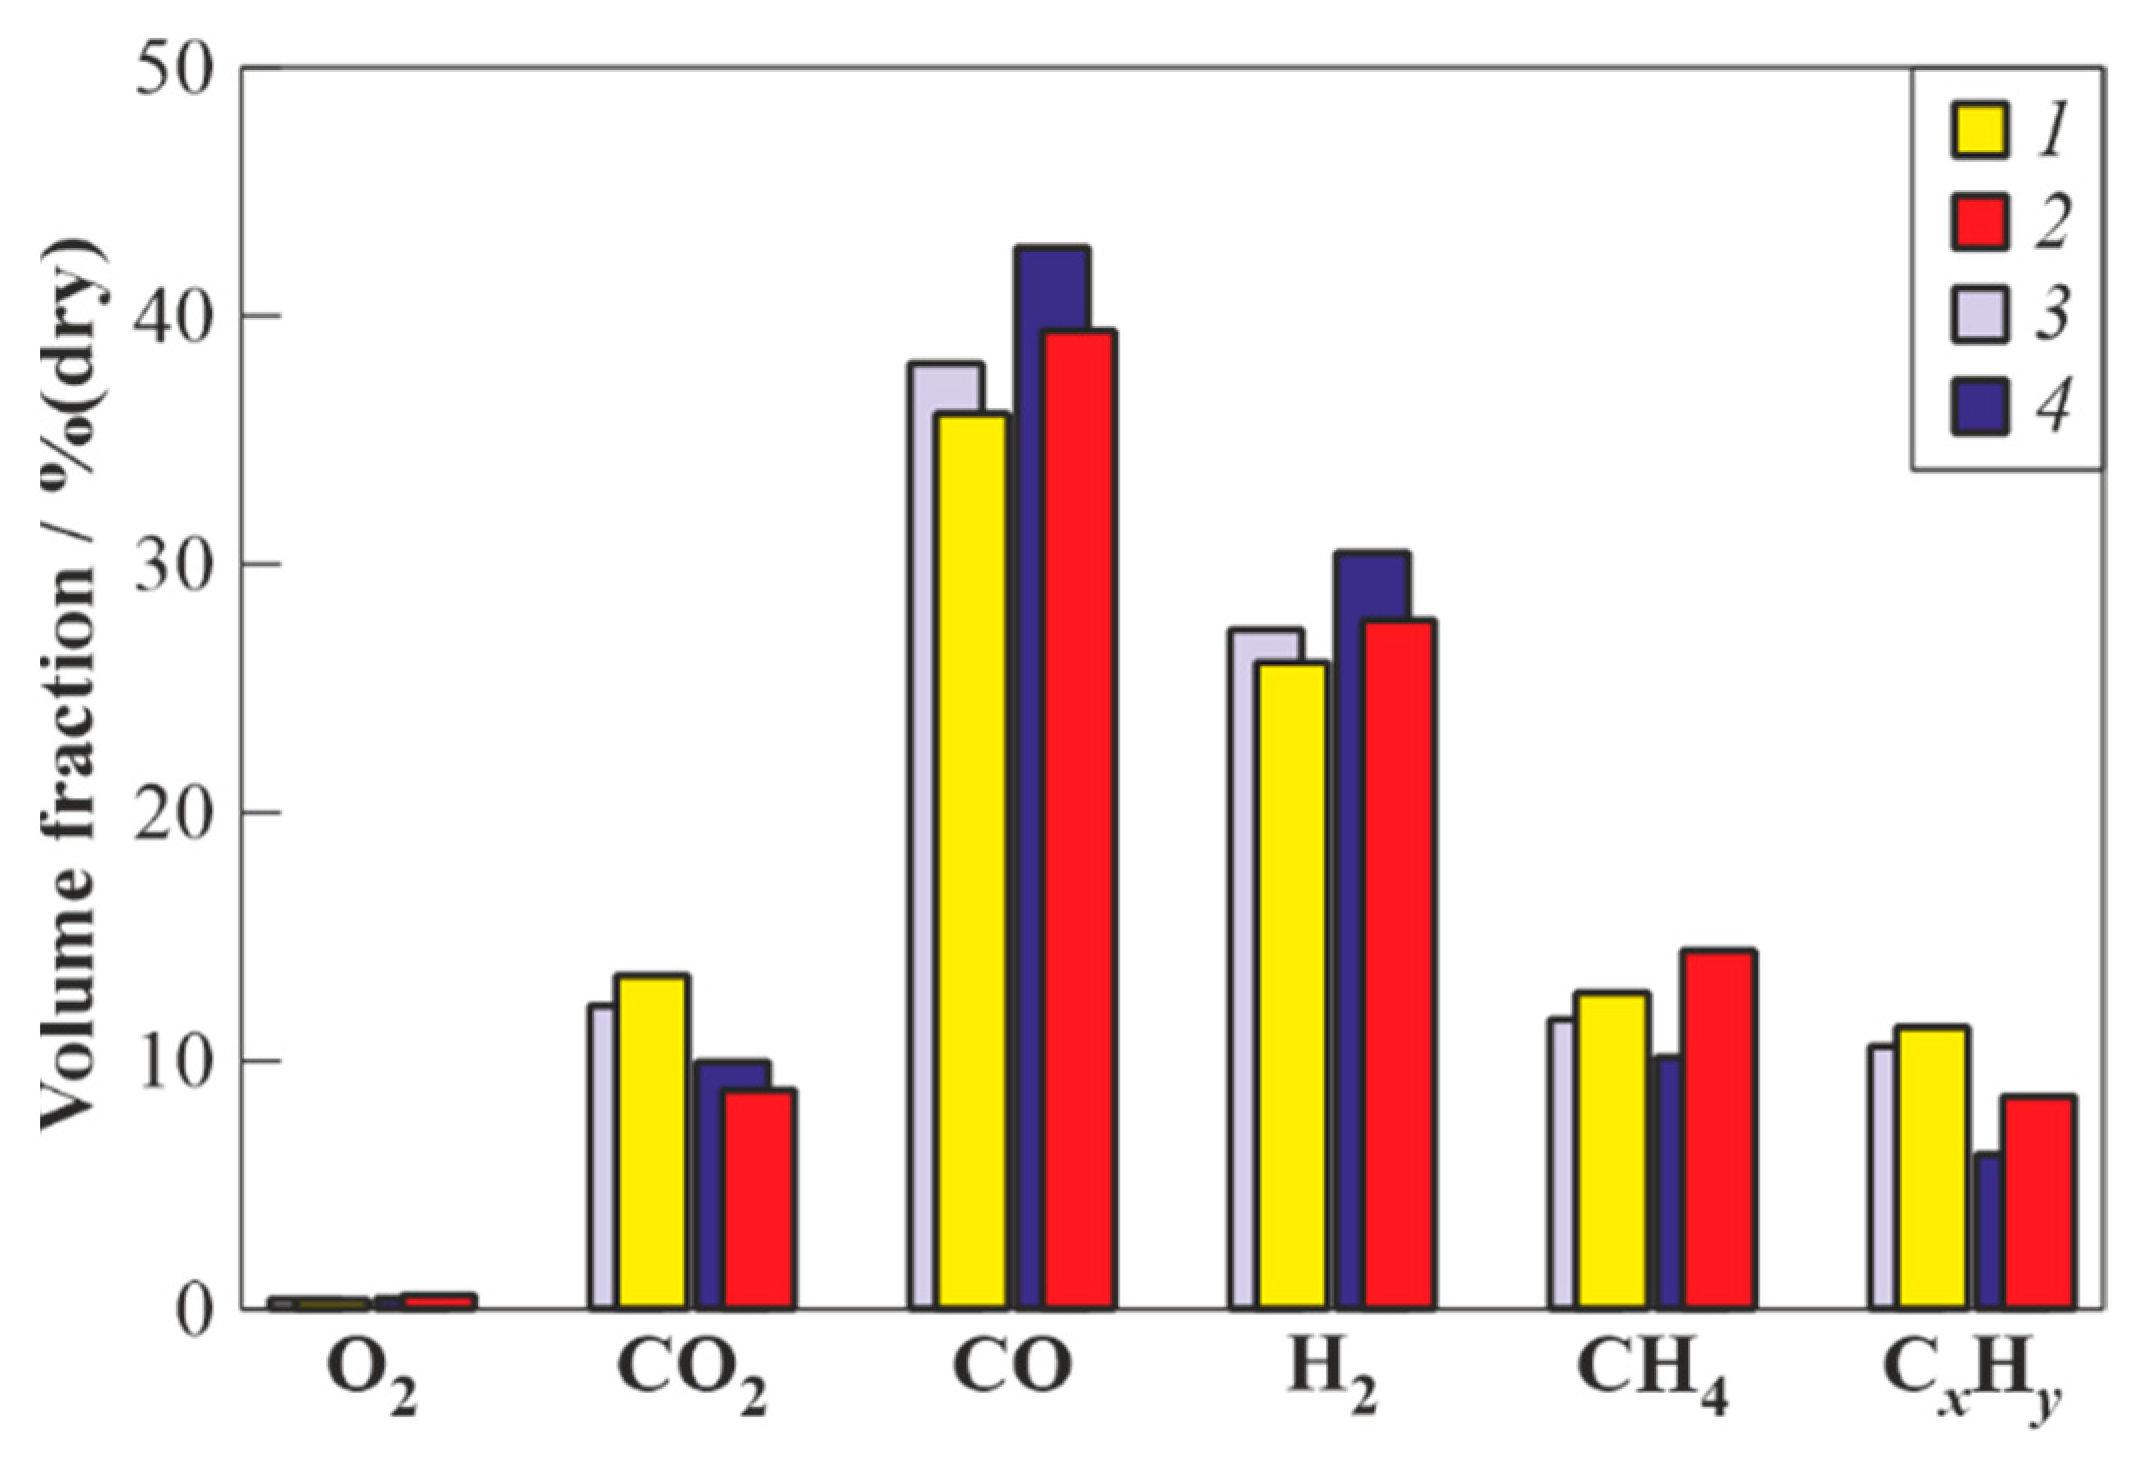
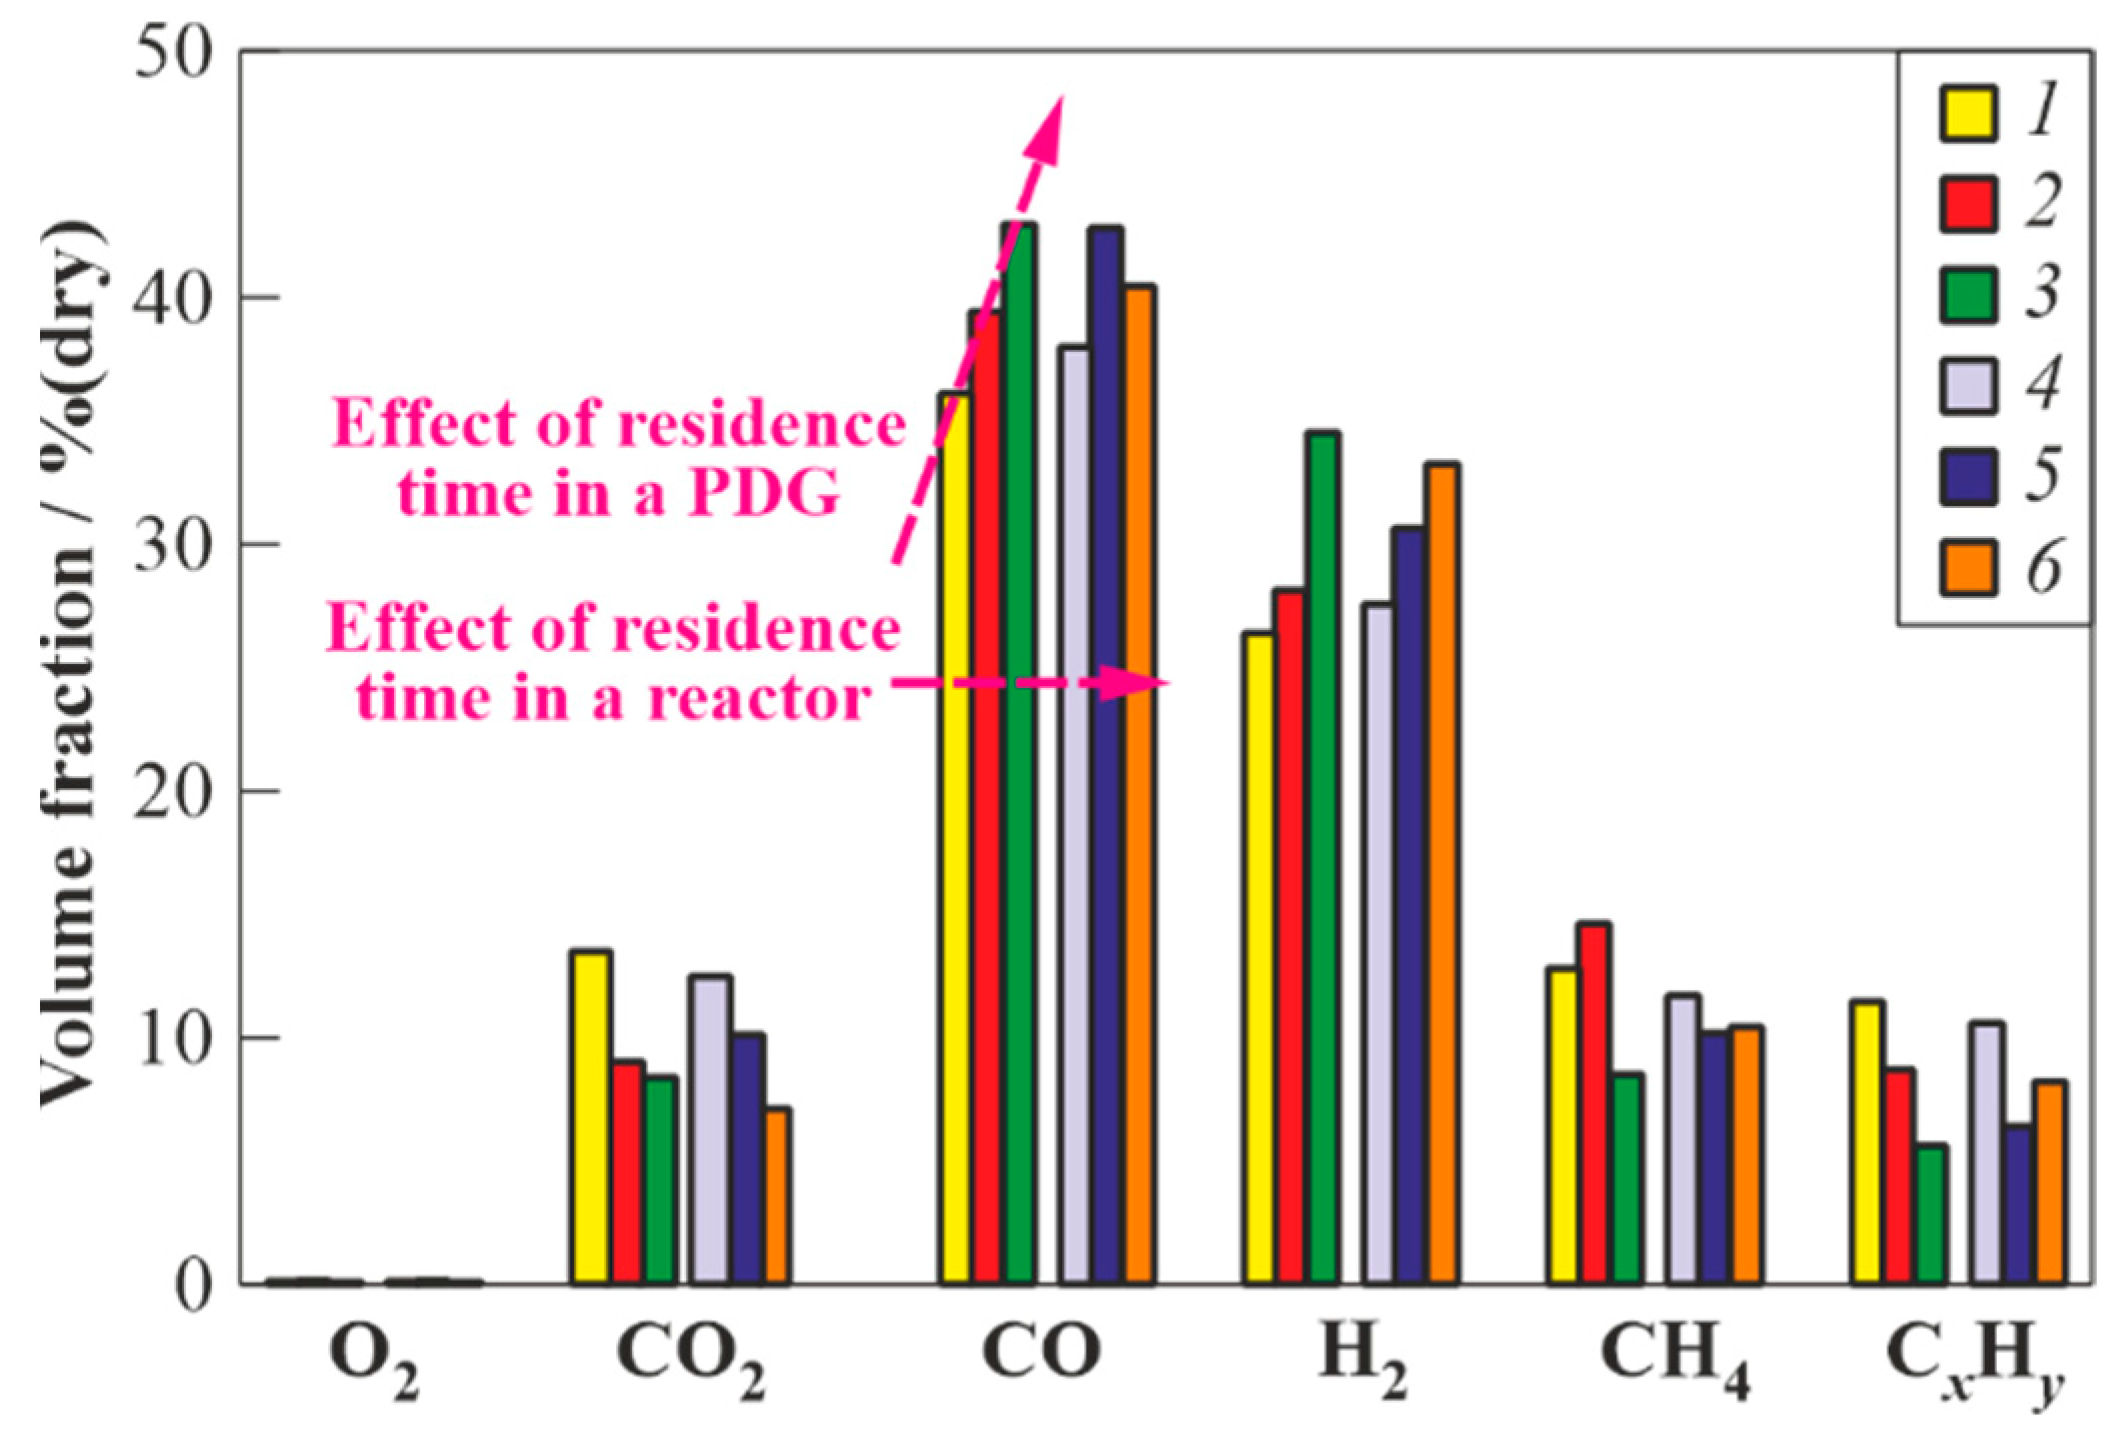
  • Both in the WG of valveless and valved schemes, an increase in the feedstock residence time in the PDG generally leads to a decrease in the yield of CO2 and increase in the yields of target gasification products (H2 and CO). Nevertheless, some inconsistencies must be noted, e.g., the irregularity between the contents of CO for cases 5 and 6 in Figure 7. Case 5 corresponds to the short and valved PDG with feedstock supply at a distance of 295 mm from the closed end (see Table 7, scheme #2). Case 6 corresponds to the long and valved PDG with the feedstock supply at the same distance from the closed end (see Table 7, scheme #4). The expected residence time in case 6 must be longer, and the yields of H2 and CO must be higher. However, Table 7 and Figure 7 show that despite the yield of H2 being higher indeed (30.6% vs. 33.2%), the yield of CO is somewhat smaller (43% vs. 40.6%). The possible reason for this is the incomplete gasification of feedstock in case 6 due to a larger relative loading of the reactor with the feedstock as compared with case 5 ( G w to G f + G ox ratio is 1.21 vs. 0.75);
  • An increase in the feedstock residence time in the flow reactor due to the use of valved schemes leads to a slight decrease in the yields of CO2 (by a maximum of 2% (vol., dry)) and a slight increase in the yields of H2 and CO (by a maximum of 3% (vol., dry.));
  • The feedstock residence time in PDGs shows a significantly greater influence on the composition of the product syngas than the feedstock residence time in the flow reactor. This is due to the fact that both the instantaneous and the average temperature of the ultra-superheated GA in a propagating detonation wave are much higher than in the flow reactor.

3.5. Efficiency of the Gasification Process

To indicate the efficiency of the gasification process, it is proposed to use the following three parameters:
θ = G f G w ; ζ = W s t W s r W w 0 W w ; η = 1 W s r W s t
where W s t is the theoretical amount of water obtained during the detonation of a stoichiometric fuel–oxygen mixture in the PDG during the entire duration of the operation process (determined by the empirical formula for the complete oxidation of such a mixture and by the operation time of the WG); W s r is the amount of water remaining after the process (determined visually by the height of the water column in the sump after cooling of the gasification products); W w 0 is the total mass of the feedstock supplied to the WG; W w is the mass of ungasified feedstock in the condensate (determined visually by the height of the oil layer above the water column in the sump after cooling of the gasification products). The parameter θ characterizes the energy efficiency of the gasification process. The parameter ζ is the specific amount of the GA required for the gasification of a unit mass of feedstock. The parameter η is the degree of utilization of the GA in the gasification process.
To estimate the values of the proposed parameters, we used experiments on the WG of valveless schemes 1 and 3. In the experiments, we varied the mass flow rates of feedstock G w and fuel G f , and measured the total mass of supplied feedstock W w 0 and the mass of unreacted feedstock in the condensate W w . It turned out that in the absence of feedstock supply ( G w = 0), the mass of water condensed from the detonation products approximately corresponded to its mass calculated by the empirical formula, i.e., W s r W s t and η = 0. The supply of feedstock to the PDGs led to the decrease in the mass of condensate and increase in the parameter η . Ideally, the parameter η must tend to 1, i.e., the entire GA formed in detonation waves must participate in the gasification process. The presence of condensate indicates the imperfection of the operation process in the WG. In addition to water, the condensate may contain residues of unreacted or partly reacted feedstock with mass W w , which enter the exhaust system of the flow reactor due to insufficient residence time.
Table 8 and Table 9 show the values of the efficiency parameters θ , ζ , and η for the gasification process in the WG of valveless schemes 1 (Table 8) and 3 (Table 9). It can be seen that in the valveless scheme 3, the efficiency indicators of the gasification process turned out to be higher: for the gasification of a unit mass of feedstock, it was required to use less fuel ( θ = 0.17–0.28 instead of 0.20–0.40) and less GA ( ζ = 0.24–0.26 instead of 0.35–0.70), and the degree of steam utilization was generally higher: η = 0.40–0.58 instead of 0.33–0.49.
The value of sum G w + G f + G ox and the process time (~600 s) can be used to estimate the amount of the produced wet syngas in the WG of valveless schemes 1 and 3. For the cases with the absence of unreacted feedstock ( W w = 0 ) in Table 8 and Table 9, this amount ranges from 2.5 to 2.6 kg. Taking into account the residual water, W s r , the amount of the produced dry syngas ranges from 1.8 to 2.2 kg. This means that the yield of dry syngas per unit mass of feedstock ranges from 1.8 to 2.5 kg syngas/kg feedstock. Knowing the syngas composition, this gives the volumetric yield of syngas ranging from 2.1 to 3 Nm3/kg feedstock. The gasification process provides the volumetric hydrogen production ranging from 0.63 to 0.90 Nm3 H2/kg feedstock or mass-based hydrogen production ranging from 50 to 72 g H2/kg feedstock.

4. Discussion

Consider now the most important results obtained experimentally. The first one is related to the gasification process efficiency. Remember that in [22,23], the measured average temperature of the wall of the flow reactor in the steady-state operation mode reached 700 °C. In the present study, the average temperature of the wall of the flow reactor was reduced to 490–570 °C (see Table 6 and Table 7). Despite such a considerable decrease in the wall temperature, the contents of H2, CO, CH4, and CO2 in the product syngas at the same flow rates of liquid feedstock and the same operation frequency of 1 Hz remained virtually unchanged. This is explained by the fact that both in [22,23] and in the present studies, the value of the gasification temperature (the maximum temperature of the detonation products of the natural gas–oxygen mixture after expansion to 1 bar) remained at the same level (above 2000 °C). Thus, the reduction in the mass flow rate of the combustible mixture by a factor of 6 (WG with short PDGs) and 4.5 (WG with long PDGs) had virtually no effect on the syngas quality, but significantly increased the efficiency of the gasification process: with the use of 1 g of natural gas, it was possible to gasify up to 4 g of waste machine oil without any unreacted residues of feedstock in the condensate. If one takes into account that natural gas is supposed to be used only as a starting fuel for the WG, and after the WG enters the nominal operation mode, natural gas will be replaced by the product syngas, then the share of syngas used in the PDGs will be at a level of 25% of the total produced syngas. This result agrees satisfactorily with the thermodynamic calculation [30], in which the proportion of syngas used in the PDGs is estimated at 10%, taking into account the total heat recovery.
Another important result obtained experimentally is that the determining role in the process of gasification of waste machine oil is shown to be played by the time during which the feedstock stays in the PDG rather than in the flow reactor. This is explained by the fact that the temperature of the AG in the propagating detonation wave is much higher than after expansion in the flow reactor, and the reactions of gasification of feedstock microdroplets proceed in the PDG much faster than in the flow reactor.
It is worth to comparing the obtained results with the available literature data. Despite there being many articles on the gasification of such organic wastes as plastic, biomass, tires, etc. (see, e.g., [12,35,36]), there is unfortunately little data on the gasification of waste machine oil [37,38]. Reported in [37] are the results of gasification of fresh synthetic engine oil with steam and supercritical water at a temperature ranging from 500 to 800 °C and a high pressure ranging from 50 to 500 bar. At the optimal conditions (750 °C, 250 bar, reaction time 1.9 min) found by the authors, over 85% of the feedstock was gasified and produced 1.6 kg syngas/kg feedstock and 60 g H2/kg·feedstock. The obtained results look also comparable with the literature data on the gasification of organic feedstock. Experiments on H2O, CO2, and mixed H2O/CO2 gasification of rice straw in an electrically heated reactor at temperatures 750–950 °C and pressure 1 bar were reported in [39]. In general, experiments showed that substitution of H2O with 30 and 60% vol. CO2 in the GA lowered the H2 yield and enhanced the CO yield. Thus, in gasification tests at 950 °C the yield of H2 decreased with the addition of CO2 from 82 to 1 g H2/kg feedstock, and the yield of CO increased from 560 to 900 g CO/kg feedstock. The thermal efficiency of gasifier was higher at a higher CO2 blending ratio. The authors of [40] reported the results of thermodynamic calculations on the gasification of rice straw with steam and CO2 as gasifying agents at 900 °C and 1 bar. Calculations were made for the composition of syngas at various CO2-to-feedstock ratios (from 0 to 0.87) when temperature and steam-to-feedstock ratio were kept constant at 900 °C and 0.3, respectively. The yield of H2 decreased from 54 to 34% vol., while that of CO increased from 37 to 40% vol. The conclusion was made that the selection of a proper CO2-to-feedstock ratio could result in attaining the highest gasification efficiency. These findings are well comparable with our results presented in Section 3.5.

5. Conclusions

This work continues the development of the new technology for the gasification of organic wastes into syngas using a two-component H2O/CO2 ultra-superheated gasifying agent obtained by pulsed detonations of a natural gas–oxygen mixture. The following conclusions can be formulated:
(1)
Compared with the experiments carried out earlier at a higher average temperature of the reactor wall and when using a PDG of a much larger volume, the contents of H2, CO, CH4; and CO2 in the product syngas remained virtually unchanged;
(2)
The efficiency of the gasification process increased significantly: with the help of 1 g of natural gas, it was possible to completely gasify up to 4 g of feedstock. This is explained by the fact that the value of the gasification temperature (the maximum temperature of the detonation products of the natural gas–oxygen mixture after expansion to 1 bar) remained as high (above 2000 °C) as in earlier experiments;
(3)
The determining role in the process of gasification of liquid feedstock is played by the time during which the feedstock stays in the pulsed detonation gun rather than in the flow reactor. This is explained by the fact that the temperature of the gasifying agent in a propagating detonation wave is much higher than after expansion in the flow reactor, and the reactions of gasification of feedstock microdroplets in the pulsed detonation gun proceed much faster than in the flow reactor;
(4)
The study defines the minimum ratio between the mass flow rates of the gasifying agent and liquid feedstock, the minimum ratio between the mass flow rates of fuel and liquid feedstock, and the degree of utilization of the gasifying agent in the gasification process.
Future work will be focused on the effect of the operation frequency of the pulsed detonation guns on the composition of the product syngas. It is expected that the increase in the operation frequency will increase the mean process temperature in the reactor and improve the quality of the product syngas.

Author Contributions

Conceptualization, S.M.F.; methodology, S.M.F. and V.A.S.; investigation, A.S.S., I.A.S., V.A.S. and F.S.F.; resources, S.M.F.; data curation, V.A.S., I.A.S., J.K.H., A.B.V., A.V.I. and J.O.I.; writing—original draft preparation, S.M.F. and V.A.S.; writing—review and editing, S.M.F.; supervision, S.M.F.; project administration, S.M.F.; funding acquisition, S.M.F. All authors have read and agreed to the published version of the manuscript.

Funding

This research received no external funding.

Institutional Review Board Statement

Not applicable.

Informed Consent Statement

Not applicable.

Data Availability Statement

The data will be available on request.

Conflicts of Interest

The authors declare no conflict of interest.

References

  1. Zhan, L.; Jiang, L.; Zhang, Y.; Gao, B.; Xu, Z. Reduction, detoxification and recycling of solid waste by hydrothermal technology: A review. Chem. Eng. J. 2020, 390, 124651. [Google Scholar] [CrossRef]
  2. Boukis, N.; Stoll, I.K. Gasification of biomass in supercritical water, challenges for the process design—Lessons learned from the operation experience of the first dedicated pilot plant. Processes 2021, 9, 455. [Google Scholar] [CrossRef]
  3. Hameed, Z.; Aslam, M.; Khan, M.; Maqsood, K.; Atabani, A.E.; Ghauri, M.; Shahzad Khurram, M.; Rehan, M.; Nizami, A.-S. Gasification of municipal solid waste blends with biomass for energy production and resources recovery: Current status, hybrid technologies and innovative prospects. Renew. Sust. Energ. Rev. 2021, 136, 110375. [Google Scholar] [CrossRef]
  4. DiCarlo, A.; Savuto, E.; Foscolo, P.U.; Papa, A.A.; Tacconi, A.; Del Zotto, L.; Aydin, B.; Bocci, E. Preliminary results of biomass gasification obtained at pilot scale with an innovative 100 kWth dual bubbling fluidized bed gasifier. Energies 2022, 15, 4369. [Google Scholar] [CrossRef]
  5. Roncancio, R.; Gore, J.P. CO2 char gasification: A systematic review from 2014 to 2020. Energ. Convers. Manag. 2021, 10, 100060. [Google Scholar] [CrossRef]
  6. Siwal, S.S.; Zhang, Q.; Sun, C.; Thakur, S.; Gupta, V.K.; Thakur, V.K. Energy production from steam gasification processes and parameters that contemplate in biomass gasifier—A review. Bioresour. Technol. 2020, 297, 122481. [Google Scholar] [CrossRef]
  7. Yang, Y.; Liew, R.K.; Tamothran, A.M.; Foong, S.Y.; Yek, P.N.Y.; Chia, P.W.; Van Tran, T.; Peng, W.; Lam, S.S. Gasification of refuse-derived fuel from municipal solid waste for energy production: A review. Environ. Chem. Lett. 2021, 19, 2127–2140. [Google Scholar] [CrossRef]
  8. Inayat, A.; Khan, Z.; Aslam, M.; Shahbaz, M.; Ahmad, M.M.; Abdul Mutalib, M.I.; Yusup, S. Integrated adsorption steam gasification for enhanced hydrogen production from palm waste at bench scale plant. Int. J. Hydrogen Energy 2021, 46, 30581–30591. [Google Scholar] [CrossRef]
  9. Wijayasekera, S.C.; Hewage, K.; Siddiqui, O.; Hettiaratchi, P.; Sadiq, R. Waste-to-hydrogen technologies: A critical review of techno-economic and socio-environmental sustainability. Int. J. Hydrogen Energy 2022, 49, 5842–5870. [Google Scholar] [CrossRef]
  10. Nanda, S.; Berruti, F. Thermochemical conversion of plastic waste to fuels: A review. Environ. Chem. Lett. 2021, 19, 123–148. [Google Scholar] [CrossRef]
  11. Yu, H.; Wang, C.; Lin, T.; An, Y.; Wang, Y.; Chang, Q.; Yu, F.; Wei, Y.; Sun, F.; Jiang, Z.; et al. Direct production of olefins from syngas with ultrahigh carbon efficiency. Nat. Commun. 2022, 13, 5987. [Google Scholar] [CrossRef] [PubMed]
  12. Oliveira, M.; Ramos, A.; Ismail, T.M.; Monteiro, E.; Rouboa, A. A review on plasma gasification of solid residues: Recent advances and developments. Energies 2022, 15, 1475. [Google Scholar] [CrossRef]
  13. Chun, Y.N.; Song, H.G. Microwave-induced carbon–CO2 gasification for energy conversion. Energy 2020, 190, 116386. [Google Scholar] [CrossRef]
  14. Yi, F.; Manosh, C.P.; Sunita, V.; Xian, L.; Young-Kwon, P.; Siming, Y. Concentrated solar thermochemical gasification of biomass: Principles, applications, and development. Renew. Sust. Energ. Rev. 2021, 150, 11484. [Google Scholar] [CrossRef]
  15. Hrbek, J. Past, present and future of thermal gasification of biomass and waste. Acta Innov. 2020, 35, 5–20. [Google Scholar] [CrossRef]
  16. Larsson, A.; Kuba, M.; Berdugo Vilchesa, T.; Seemann, M.; Hofbauer, H.; Thunman, H. Steam gasification of biomass—Typical gas quality and operational strategies derived from industrial-scale plants. Fuel Process. Technol. 2021, 212, 106609. [Google Scholar] [CrossRef]
  17. Shahbeig, H.; Shafizadeh, A.; Rosen, M.A.; Sels, B.F. Exergy sustainability analysis of biomass gasification: A critical review. Biofuel Res. J. 2022, 33, 1592–1607. [Google Scholar] [CrossRef]
  18. Filippova, S.P.; Keiko, A.V. Coal gasification: At the crossroads. Economic outlook. Therm. Eng. 2021, 68, 347–360. [Google Scholar] [CrossRef]
  19. Wang, K.; Kong, G.; Zhang, G.; Zhang, X.; Han, L.; Zhang, X. Steam gasification of torrefied/carbonized wheat straw for H2-enriched syngas production and tar reduction. Int. J. Env. Res. Public Health 2022, 19, 10475. [Google Scholar] [CrossRef]
  20. Maric, J.; Berdugo Vilches, T.; Pissot, S.; Canete Vela, I.; Gyllenhammar, M.; Seemann, M. Emissions of dioxins and furans during steam gasification of automotive shredder residue; experiences from the Chalmers 2–4-MW indirect gasifier. Waste Manag. 2020, 102, 114–121. [Google Scholar] [CrossRef]
  21. Frolov, S.M. Organic waste gasification: A selective review. Fuels 2021, 2, 556–651. [Google Scholar] [CrossRef]
  22. Frolov, S.M. Gasification of organic waste with ultra-superheated steam and carbon dioxide. Combust. Explos. 2021, 14, 74–97. [Google Scholar] [CrossRef]
  23. Bany Ata, A.; Seufert, P.M.; Heinze, C.; Alobaid, F.; Epple, B. Optimization of integrated gasification combined-cycle power plant for polygeneration of power and chemicals. Energies 2021, 14, 7285. [Google Scholar] [CrossRef]
  24. Pio, D.T.; Gomes, H.G.M.F.; Tarelho, L.A.C.; Vilas-Boas, A.C.M.; Matos, M.A.A.; Lemos, F.M.S. Superheated steam injection as primary measure to improve producer gas quality from biomass air gasification in an autothermal pilot-scale gasifier. Renew. Energ. 2022, 181, 1223–1236. [Google Scholar] [CrossRef]
  25. Tsekos, C.; del Grosso, M.; de Jong, W. Gasification of woody biomass in a novel indirectly heated bubbling fluidized bed steam reformer. Fuel Process. Technol. 2021, 224, 107003. [Google Scholar] [CrossRef]
  26. Hess, J.R.; Ray, A.E.; Rials, T.G. Advancements in biomass feedstock preprocessing: Conversion ready feedstocks. Front. Energy Res. 2020, 7, 140. [Google Scholar] [CrossRef]
  27. Frolov, S.M.; Smetanyuk, V.A.; Avdeev, K.A.; Nabatnikov, S.A. Method for Obtaining Highly Overheated Steam and Detonation Steam Generator Device (Options). Patent of Russian Federation No. 2686138, 24 April 2019. [Google Scholar]
  28. Frolov, S.M. Organic waste gasification by ultra-superheated steam. Energies 2023, 16, 219. [Google Scholar] [CrossRef]
  29. Shahabuddin, M.; Alam, M.T.; Krishna, B.B.; Bhaskar, T.; Perkins, G. A review on the production of renewable aviation fuels from the gasification of biomass and residual wastes. Bioresour. Technol. 2020, 312, 123596. [Google Scholar] [CrossRef]
  30. Frolov, S.M.; Smetanyuk, V.A.; Sadykov, I.A.; Silantiev, A.S.; Shamshin, I.O.; Aksenov, V.S.; Avdeev, K.A.; Frolov, F.S. Natural gas conversion and liquid/solid organic waste gasification by ultra-superheated steam. Energies 2022, 15, 3616. [Google Scholar] [CrossRef]
  31. Frolov, S.M.; Smetanyuk, V.A.; Sadykov, I.A.; Silantiev, A.S.; Shamshin, I.O.; Aksenov, V.S.; Avdeev, K.A.; Frolov, F.S. Natural gas conversion and organic waste gasification by detonation-born ultra-superheated steam: Effect of reactor volume. Fuels 2022, 3, 375–391. [Google Scholar] [CrossRef]
  32. Frolov, S.M.; Smetanyuk, V.A.; Sadykov, I.A.; Silantiev, A.S.; Aksenov, V.S.; Shamshin, I.O.; Avdeev, K.A.; Frolov, F.S. Autothermal natural gas conversion and allothermal gasification of liquid and solid organic wastes by ultra-superheated steam. Combust. Explos. 2022, 15, 75–87. [Google Scholar] [CrossRef]
  33. Frolov, S.M.; Smetanyuk, V.A.; Sadykov, I.A.; Silantiev, A.S.; Shamshin, I.O.; Aksenov, V.S.; Avdeev, K.A.; Frolov, F.S. Effect of reactor volume on autothermal natural gas conversion and allothermal gasification of organic waste by ultra-superheated steam. Combust. Explos. 2022, 15, 71–87. [Google Scholar] [CrossRef]
  34. Frolov, S.M.; Smetanyuk, V.A.; Shamshin, I.O.; Sadykov, I.A.; Koval’, A.S.; Frolov, F.S. Production of highly superheated steam by cyclic detonations of propane and methane–steam mixtures with oxygen for waste gasification. Appl. Therm. Eng. 2021, 183, 116195. [Google Scholar] [CrossRef]
  35. Havilah, P.R.; Sharma, A.K.; Govindasamy, G.; Matsakas, L.; Patel, A. Biomass gasification in downdraft gasifiers: A technical review on production, up-gradation and application of synthesis gas. Energies 2022, 15, 3938. [Google Scholar] [CrossRef]
  36. Szul, M.; Iluk, T.; Zuwała, J. Use of CO2 in pressurized, fluidized bed gasification of waste biomasses. Energies 2022, 15, 1395. [Google Scholar] [CrossRef]
  37. Sanchez-Hernandez, A.M.; Martin-Sanchez, N.; Sanchez-Montero, M.J.; Izquierdo, C.; Salvador, F. Different options to upgrade engine oils by gasification with steam and supercritical water. J. Supercrit. Fluids 2020, 487, 104912. [Google Scholar] [CrossRef]
  38. Mishra, A.; Siddiqi, H.; Kumari, U.; Behera, I.D.; Mukherjee, S.; Meikap, B.C. Pyrolysis of waste lubricating oil/waste motor oil to generate high-grade fuel oil: A comprehensive review. Renew. Sust. Energy Rev. 2021, 150, 111446. [Google Scholar] [CrossRef]
  39. Prabowo, K.; Umeki, M.; Yan, M.; Nakamura, M.R.; Castaldi, M.J.; Yoshikawa, K. CO2-steam mixture for direct and indirect gasification of rice straw in a downdraft gasifier: Laboratory-scale experiments and performance prediction. Appl. Energy 2014, 113, 670–679. [Google Scholar] [CrossRef]
  40. Parvez, A.M.; Mujtaba, I.M.; Wu, T. Energy, exergy and environmental analyses of conventional, steam and CO2-enhanced rice straw gasification. Energy 2016, 94, 579–588. [Google Scholar] [CrossRef]
Figure 1. Waste gasifier with two PDGs: (a) valveless scheme; (b) valved scheme; and (c) photograph.
Waste 01 00031 g001
Figure 2. Typical records of the wall temperature T r and overpressure P r in the flow reactor of valveless (a) and valved (b) WG schemes. Curves P r m correspond to the average overpressure in the flow reactor. Zero time approximately corresponds to the conditions when the second transient stage of WG operation comes to an end.
Waste 01 00031 g002
Figure 3. Typical records of the gas analyzer for experiments with the WG of valveless (a) and valved (b) schemes. Arrows indicate approximate time instants of reaching a steady operation mode and PDG shutdown. Zero time approximately corresponds to the start of the second transient stage of WG operation.
Waste 01 00031 g003
Figure 4. The measured composition of dry gasification products of waste machine oil obtained in the WG of valveless scheme 1 (columns 1 and 2) and valved scheme 2 (columns 3 and 4) when feedstock is supplied near (85 mm) (columns 1 and 3) and at a distance (355 mm) (columns 2 and 4) from the PDG open end.
Waste 01 00031 g004
Figure 5. The measured compositions of dry gasification products of waste machine oil obtained in the GW of valveless schemes 1 and 3 and valved schemes 2 and 4 with PDGs of different lengths (1 and 2—short PDGs; 3 and 4—long PDGs), when supplying feedstock at a distance of 295 mm from the closed end of the PDG.
Waste 01 00031 g005
Figure 6. The measured compositions of dry gasification products of waste machine oil obtained in the WG of valveless schemes with different residence times of feedstock in the PDG: 1—minimum; 2—intermediate; and 3—maximum.
Waste 01 00031 g006
Figure 7. The measured compositions of dry gasification products of waste machine oil in the WG of valveless and valved schemes for six cases: case 1—scheme 1 with the feedstock supply to the PDG near the open end; case 2—scheme 1, feedstock supply far from the open end; case 3—scheme 3, feedstock supply far from the open end; case 4—scheme 2, feedstock supply near the open end; case 5—scheme 2, feedstock supply far from the open end; and case 6—scheme 4, feedstock supply far from the open end.
Waste 01 00031 g007
Table 1. Proximate analysis of waste machine oil.
WasteDensity, kg/m3HHV, * MJ/kgMoisture, ** %Ash, *** %
Waste machine oil90045.7450.7
* Calorimeter ABK-1V (Russia). ** Moisture was measured by gravitational phase separation. *** Ash content was determined according to the method of the State Standard GOST 33106 (Russia).
Table 2. Ultimate analysis of waste machine oil *.
WasteCHN Σ , %
Waste machine oil86.3413.44trace99.78
* CHNS/O PE 2400 Ser. II analyzer (Perkin Elmer, USA); CHN determination accuracy < 0.30% abs.
Table 3. Composition of natural gas.
Species%vol.
CH496.1
C2H62.1
C3H80.6
C4H100.2
N21.0 *
* By difference.
Table 4. Typical composition of the gasifying agent.
Species%vol.
H2O65
CO232
CO2
H21
Remark: measured by flow gas analyzer MRU VARIO SYNGAS PLUS (Germany), the measurement error of volume fractions is estimated at 5%.
Table 5. Configurations of waste gasifier.
Scheme
No.
ValvePDG
Length
PDG
Volume
Feedstock Supply
Location ,   L w   *
1NoShort (0.63m)2.4 dm3545 mm295 mm
2YesShort (0.63m)2.4 dm3545 mm295 mm
3NoLong (0.82 m)3.2 dm3295 mm-
4YesLong (0.82 m)3.2 dm3295 mm-
* Feedstock supply locations, L w , are measured from the PDG closed end.
Table 6. The results of experiments on the gasification of waste machine oil in the WG of valveless (1) and valved (2) schemes, when feedstock is supplied near (85 mm) and at a distance (355 mm) from the PDG open end.
Scheme
No.
Lw,
mm
Gw,
g / s
Gf,
g / s
Gox,
g / s
θ Tr,
° C
[CO2]
%vol.
Dry
[CO]
%vol.
Dry
[H2]
%vol.
Dry
[CH4]
%vol.
Dry
[O2]
%vol.
Dry
[CxHy]
%vol.
Dry
15452.700.532.120.2058013.436.026.212.7011.4
2953.240.552.200.176009.039.527.914.50.358.7
25451.900.321.280.1755012.338.027.411.60.1010.7
2951.350.361.440.2657010.043.030.610.206.2
Table 7. The results of experiments on the gasification of waste machine oil in the WG of valveless (1, 3) and valved (2, 4) schemes with PDGs of different lengths, when waste machine oil is supplied at a distance of 295 mm from the closed end of the PDGs.
Scheme
No.
Gw,
g / s
Gf,
g / s
Gox,
g / s
θ Tr,
° C
[CO2]
%vol.
Dry
[CO]
%vol.
Dry
[H2]
%vol.
Dry
[CH4]
%vol.
Dry
[O2]
%vol.
Dry
[CxHy]
%vol.
Dry
13.240.552.200.176009.039.527.914.50.48.7
21.350.361.440.2657010.043.030.610.206.2
31.980.712.840.366208.542.834.58.705.5
42.180.361.440.164907.240.633.210.40.38.3
Table 8. Experimental values of the efficiency parameters for the gasification process in the WG of valveless scheme 1.
Test
No.
Gw,
g / s
Gf,
g / s
Gox,
g / s
Ww0,
g
Wst,
g
Wsr,
g
Ww,
g
θ ζ η
11.630.512.041440127575000.310.360.41
22.170.532.12180011255504000.240.410.49
32.700.532.12220094020011500.200.700.79
Table 9. Experimental values of the efficiency parameters for the gasification process in the WG of valveless scheme 3.
Test
No.
Gw,
g / s
Gf,
g / s
Gox,
g / s
Ww0,
g
Wst,
g
Wsr,
g
Ww,
g
θ ζ η
11.600.552.20100066040000.280.260.40
21.430.552.20120062033000.230.240.47
33.240.552.2025009504004000.170.260.58
Disclaimer/Publisher’s Note: The statements, opinions and data contained in all publications are solely those of the individual author(s) and contributor(s) and not of MDPI and/or the editor(s). MDPI and/or the editor(s) disclaim responsibility for any injury to people or property resulting from any ideas, methods, instructions or products referred to in the content.

