Article

Simulation of Dynamic Evolution of Ring Current Ion Flux by a Lunar Base Energetic Neutral Atom (ENA) Imaging

1
Laboratory of Space Environment Exploration, National Space Science Center of the Chinese Academy of Sciences, Beijing 100190, China
2
Beijing Key Laboratory of Space Environment Exploration, Beijing 100190, China
3
Key Laboratory of Science and Technology on Space Environment Situational Awareness of the Chinese Academy of Sciences, Beijing 101499, China
4
Shanghai Institute of Satellite Engineering, Shanghai 200240, China
*
Author to whom correspondence should be addressed.
Astronomy 2023, 2(3), 153-164; https://doi.org/10.3390/astronomy2030011
Submission received: 10 May 2023 / Revised: 7 July 2023 / Accepted: 27 July 2023 / Published: 22 August 2023

Abstract

:
The distribution of energetic ion flux in the ring current region, such as a meteorological cumulonimbus cloud, stores up the particle energy for a geomagnetic substorm. It is helpful to study the geomagnetic substorm mechanism by using a lunar base ENA imaging simulation of the dynamic evolution of the ring current, and establishing the corresponding relationship between key node events of the substorm. Based on the previous observation experience and our simulation results of the dynamic evolution of the ring current, we propose a macroscopic model of substorms related to the dynamic evolution of ring currents and present the possibility of confirming the causal sequence of some of those critical node events of substorms with the lunar base ENA imaging measurement. IBEX, operating in the ecliptic plane, may even give examples of the telemetry of ring current ion fluxes through ENA measurements during substorms/quiets.

1. Introduction

The ring current ion flux spreads from 2 to 8 Earth radii (RE), with the maximum at 4 Re, where ion energy ranges from tens of eV to tens of keV, accompanied by westward drift. The enhancement of the ring current is due to injection from the magnetotail plasma sheet during a geomagnetic storm. Its effect is to generate a magnetic field at the ground that is opposite to the geomagnetic field, causing a negative disturbance in the Dst index. The partial disturbance of the ring current produces substorms, which often affect the high-latitude auroral region. The plasma pressure and ion fluxes of the ring current increased dramatically during super substorms, while little change was observed for substorms with AE < 1000 nT [1]. During substorms, the major terrestrial energetic neutral atom (ENA) emissions also originate from the ring current.
Ogasawara et al. [2] reported a continuous daylong observation of bright terrestrial ENA emissions with the Interstellar Boundary Explorer (IBEX) [3]. The IBEX-Hi operates in a lunar resonance orbit with an apogee of ~48 Earth radius (RE), and it can monitor ENAs from 0.3 to 6.0 keV for long periods of time. The correlation between the auroral electric jet (AE) index and ENA emissions was found through long-term monitoring. The results show that the temporal profile of ENA correlated with Earth’s auroral activities. However, IBEX-Hi’s single-pixel (6° × 6°) scan observations make it difficult to distinguish the ENA emission source from the low-altitude auroral region or the ring current region, providing no further information about the trigger of the substorm.
There are many substorm models, and they all involve three key node phenomena, including the magnetotail lobe reconnection, cross-tail current disruption, and aurora brightening (see Figure 1). The widely accepted models are the near-Earth current disruption model [4,5,6,7] and the near-Earth neutral line model [8,9]; both include the three key phenomena mentioned above, but occur in different timing sequence.
Among the three key node phenomena of the substorm, only auroral brightening (including the brightening of visible light, EUV, and ENA emission) is visible, which has the spatiotemporal telemetry evidence of its occurrence. The other two items have no visibility and occur randomly at specific times and in limited airspace. There was never any direct-measurement evidence to confirm their temporal and spatial existence. IBEX-Hi observed ENA scanning images of the magnetotail plasma sheet disconnection (at 10 RE) during the geomagnetic quiet period at the apogee of the lunar resonance orbit [10], which brings a glimmer of light to the visual remote sensing of the ring current.
In Section 2, we discuss ENA imaging simulation of ring current dynamic evolution. Section 3 describes a macro substorm model, which can be dynamically monitored by ENA imaging. In Section 4, the supporting evidence of previous observations for the proposed model is given. Finally, the Section 5 gives a summary.

2. ENA Imaging Simulation of Dynamic Evolution of Ring Current

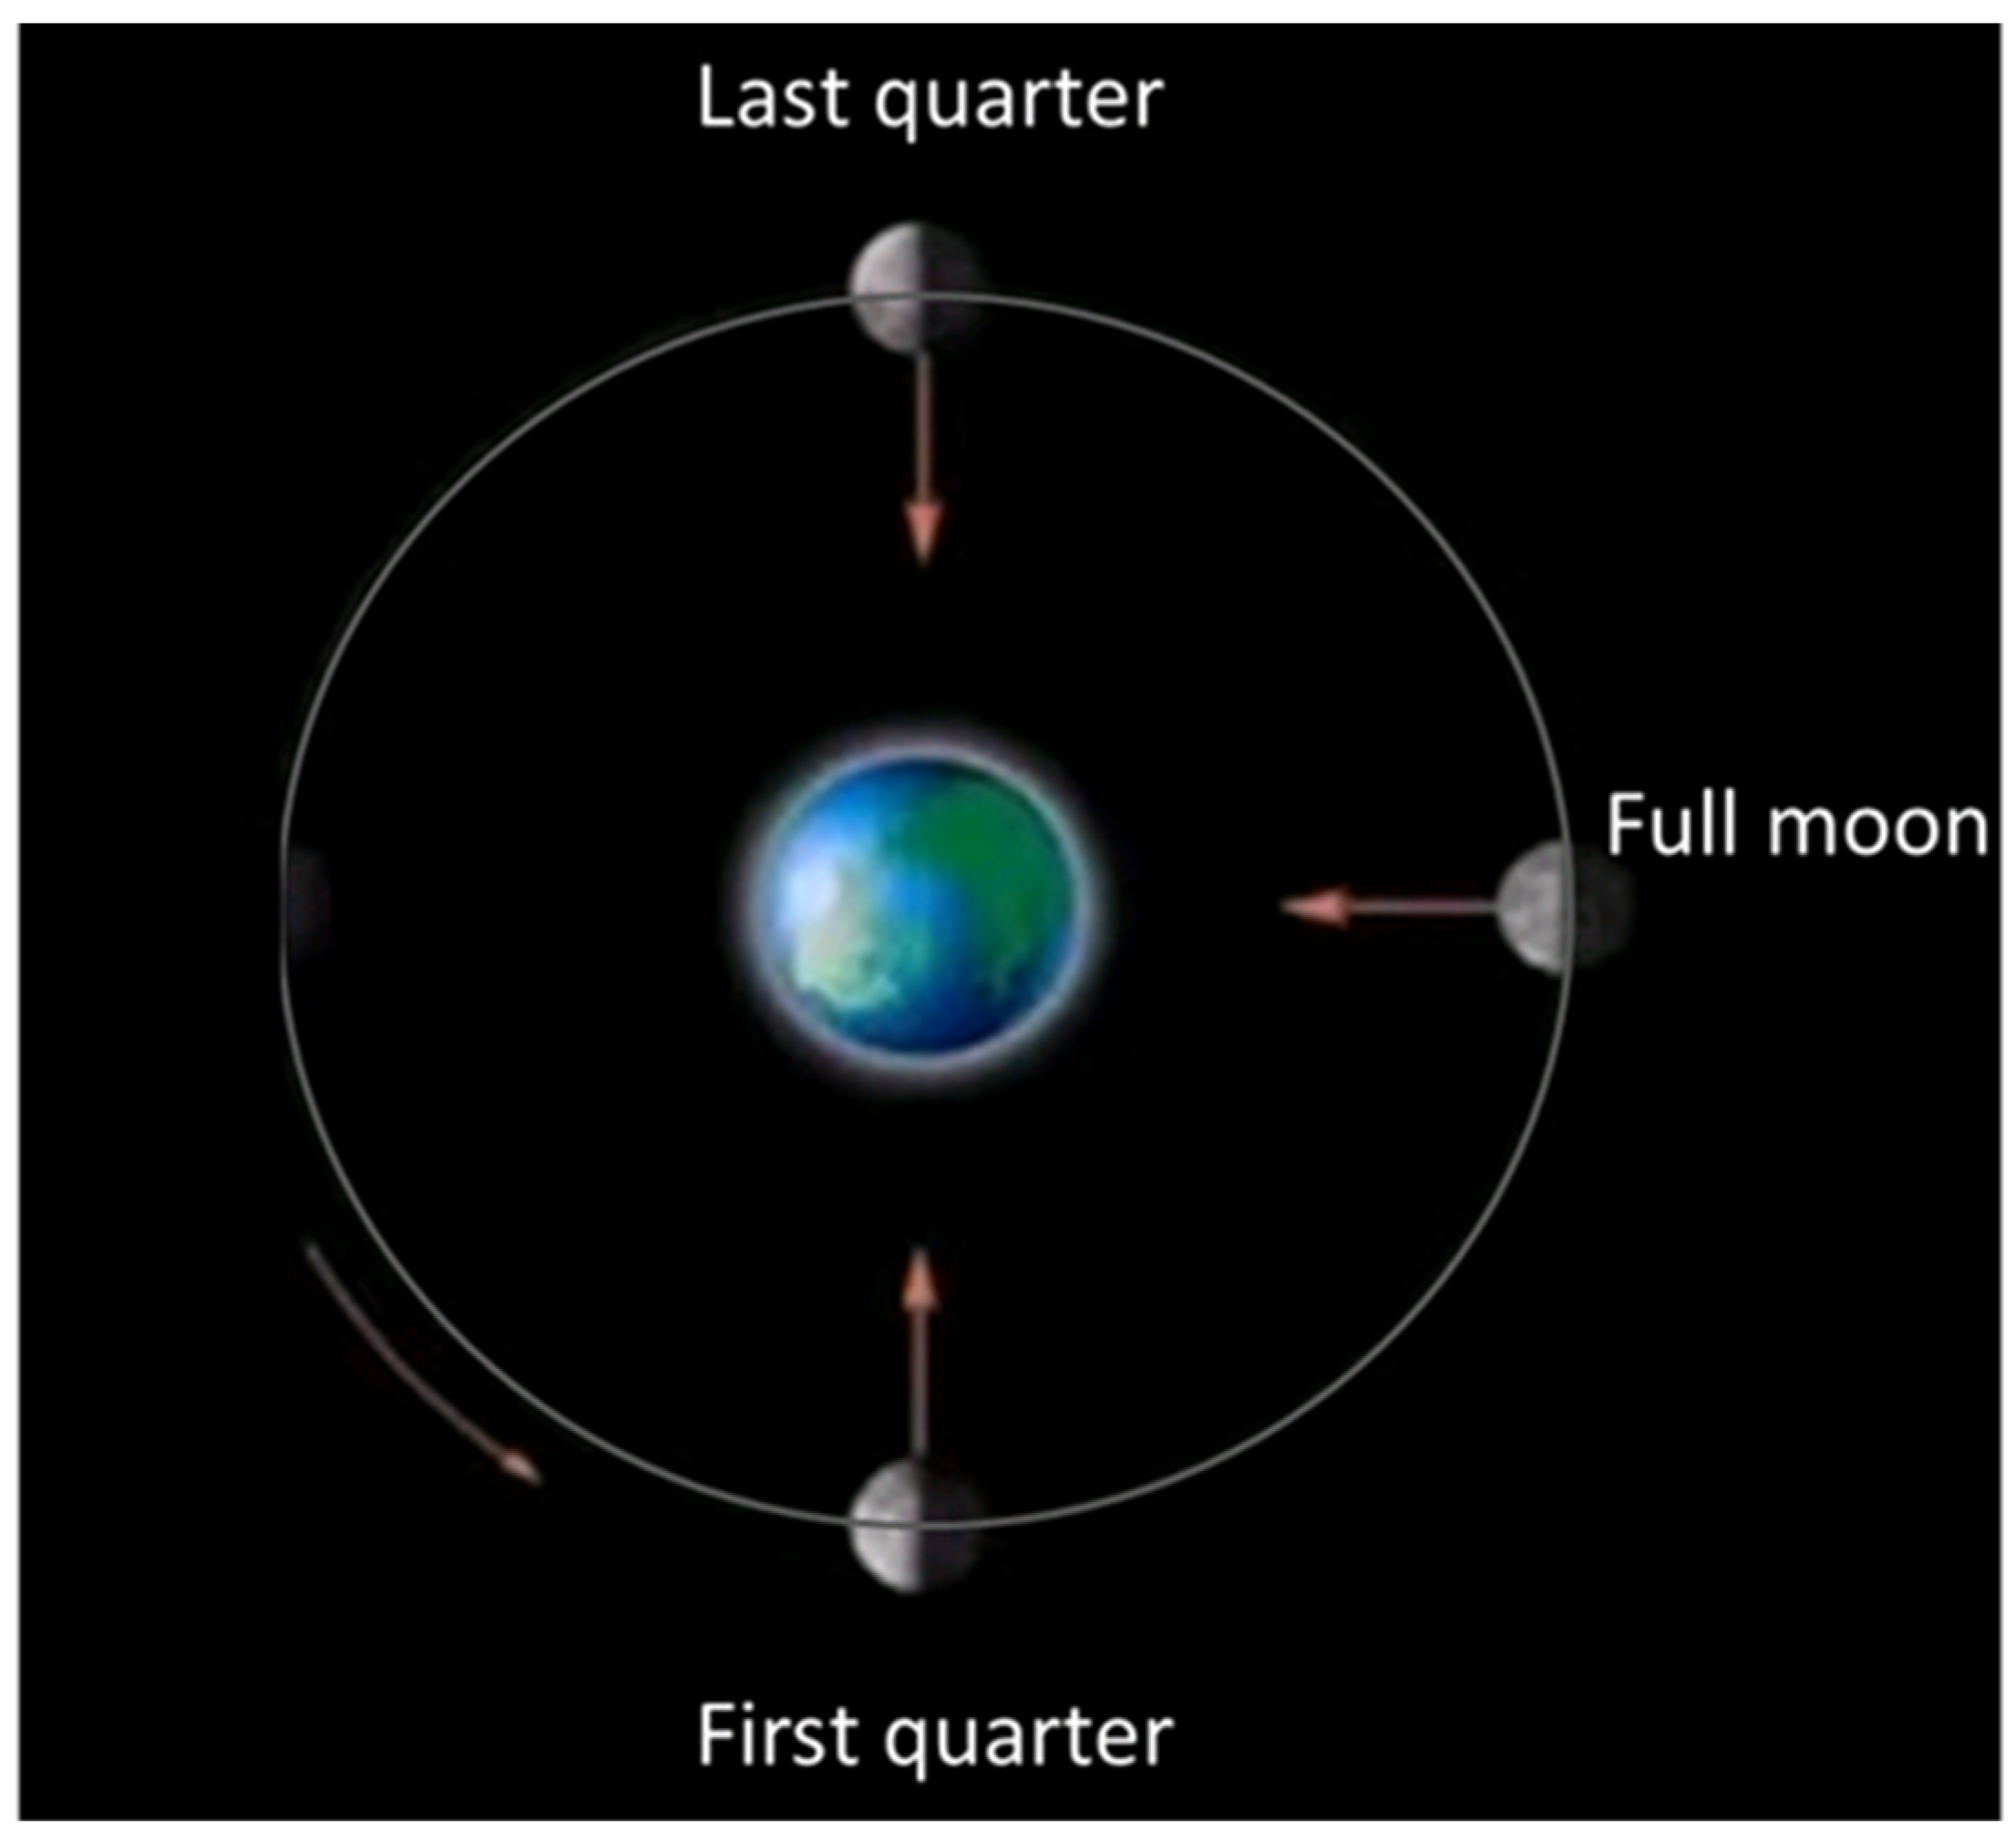
2.1. Lunar Orbit and Instrument Parameters for the Simulation

Average lunar orbit distance of 380,000 km, about 60 radii of the Earth (Re), 1 Re with respect to the Moon’s orbit, has an angle of less than 1°. The space range of the magnetospheres’ ring current is between 2 and 8 RE. Therefore, the field of view of the instrument is designed to be 20° × 20°, and the angle resolution is better than 0.5°. It is planned to integrate 40 one-dimensional arrays, each consisting of 40 detectors, into a two-dimensional detector array. According to the lunar orbit positions (see Figure 2), the specific technical specifications of the simulation design of the lunar base ENA imager, include FOV and angular resolution, are shown in Table 1. ENA generated by ring current energetic ions is the strongest omnidirectional emission source for particle imaging exploration of the geo-magnetosphere in lunar orbit. The geometric factor of a single detector of the instrument is 0.0044 cm2 sr, and the integration time is about 3 min, which can meet the statistical requirements of ENA imaging [11]. The ENA is suitable for the tracer particle of ring current energetic ion distribution. The intensity and distribution of ENA flux in different orbital positions are predicted by simulation, which is similar to the previous telemetry instruments, and the results are expected.

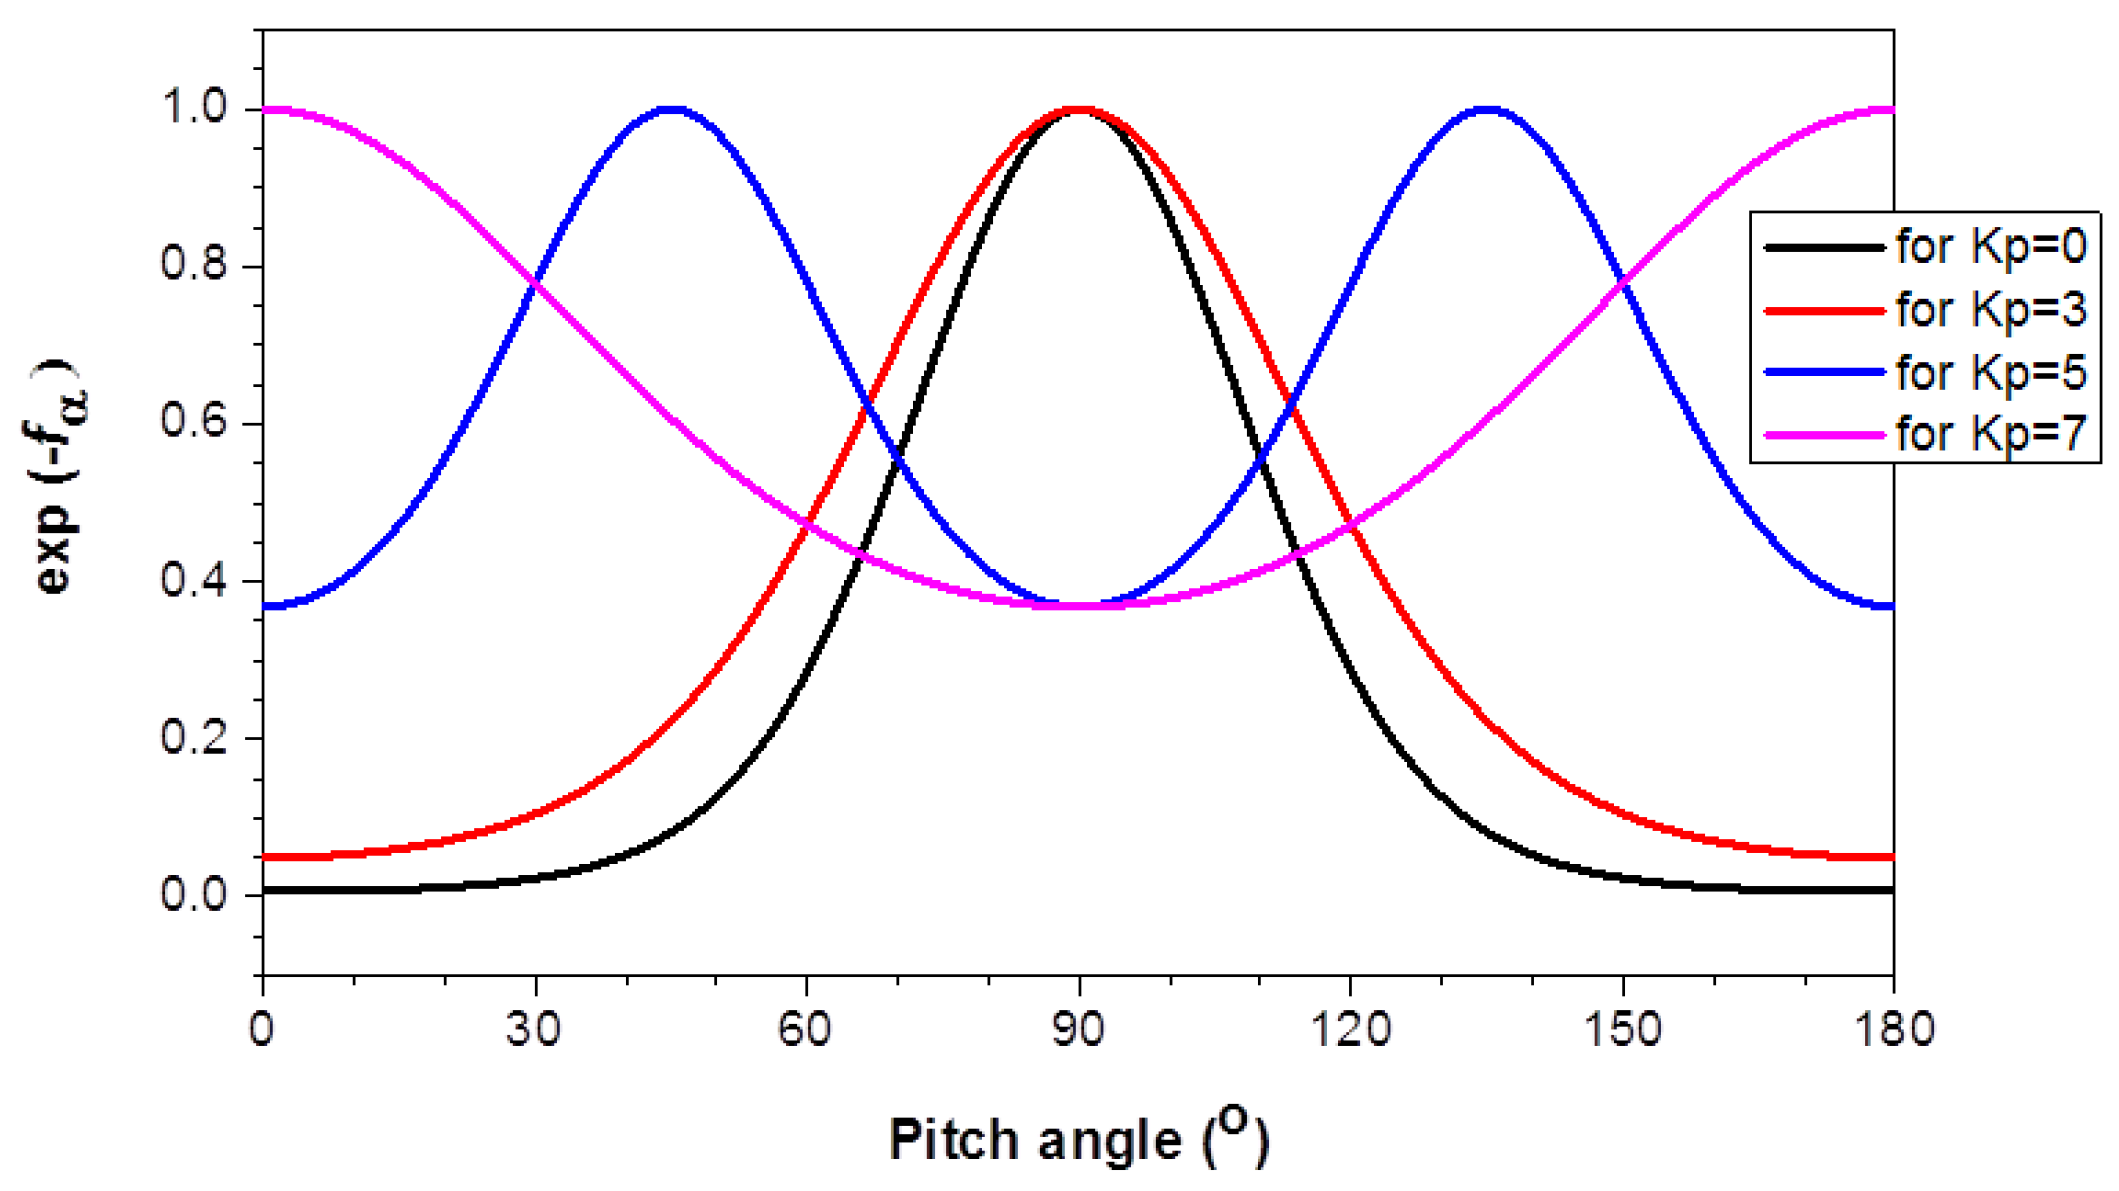
2.2. Simulation Equations

The counts recorded in each pixel of an ENA image, C(δ, ε) with elevation δ and azimuth ε, are represented in the simulation equation,
C δ , ε = Δ E Δ T Δ Ω j i o n L , ϕ , θ , E , α A ( δ , ε ) σ ( E ) n r , ϕ , θ d V ,
where ΔE is the energy range within, ΔT the integral time for the pixel, and ΔΩ the solid angle of the volume element pointing to the δ, ε pixel; jion represents ion differential flux at the integral volume element, A(δ, ε) the response function of a detector [12], and σ(E) the charge exchange cross sections [13]; n(r, φ, θ) is the exospheric neutral atomic density, where r represents the geocentric distance, φ the longitude, and θ the latitude; and dV is the volume element integral along the line of sight of the detector.
The ion flux in the ring current region may be expressed in the form of [14]
j i o n ( L , ϕ , E , α ) = e j max 0 e q ( ϕ , L , α e q ) E E max 0 1 + E κ E max 0 κ 1 ,
where e = ( 1 + 1 / κ ) κ + 1 2.962 (k = 5.5), θ is the magnetic latitude, and
j max 0 e q ( ϕ , L , α ) = J 0 e q exp f ϕ + f L + f α ,
where J max 0 e q = 6 × 10 6 cm2 sr1 keV1 s1.
φ is azimuth, that
f ϕ = ξ 1 cos ( ϕ ϕ s )
where φs = 180°, ξ = 0.73 for azimuth asymmetry of ring current ion flux.
L is the magnetic shell index, where
f L = γ 1 ( L L 11 ) 2 , L < L 11 γ ( L L 11 ) , L 11 L L 22 γ 2 ( L L 22 ) 2 + γ ( L 22 L 11 ) , L > L 22 ,
L 11 = 4.01 , L 22 = 7.3 , γ 1 = 0.53 , γ = 1.16 , γ 2 = 0.88 , and
L b = 122 10 K p 2 a 24 7.3
where Kp is the geomagnetic activity index, and the maximum ion fluxes and corresponding positions by the model above are shown in Table 2. Equatorial ion flux distributions under different Kp indices are shown in Figure 3.
The pitch angle function (fα) of the particles within the volume element is expressed in terms of αeq (equatorial pitch angle) such that
f α = K α c o s 2 α e q , ( K α = 5 , K p = 0 ) K α c o s 2 α e q , ( K α = 3 , K p = 3 ) K α c o s 2 2 α e q , ( K α = 1 , K p = 5 ) K α s i n 2 α e q , ( K α = 1 , K p = 7 )
Here, the parameter Kα (adjusting the pitch angle distribution width) corresponds to the Kp index from 0 to 7, which simulates the dynamic evolution of pitch angle from pancake to butterfly during a substorm [15,16,17,18], as shown in Figure 4.
The minimum energy channel of the ENA imager starts at 4 keV, so it does not directly record the neutral gas (≤106 K) in the background. The ENA map recorded by the ENA imager is the energetic neutral atom produced after the charge exchange of the neutral atom evaporated from the exosphere and energetic ions precipitated from the ring current region.
The neutral hydrogen densities provided by Chamberlain’s model, adjusted by Rairden et. al. [19], are too low to be applicable in the ring current region. If conservation of the radial flux of neutral atoms during a major geomagnetic storm is assumed, we may, however, add an additional term, (a0/r)2, to the Chamberlain model so that the density can be represented by
n ( r , θ , ϕ ) = n 0 exp 17.5 e 1.5 r r 1.46 ( 1 - 0.3 sin θ cos ϕ ) + a 0 r 2 ,
where r is the geocentric distance in RE, a0 = 1.78 RE represents the height of the exosphere, and n0 = 1600 cm−3 represents the neutral density constant. This model is better fitted for the yearly average hydrogen density in solar maximum conditions in the ring current region measured by Tinsley et al. [20], which should also be suitable in the substorm period.

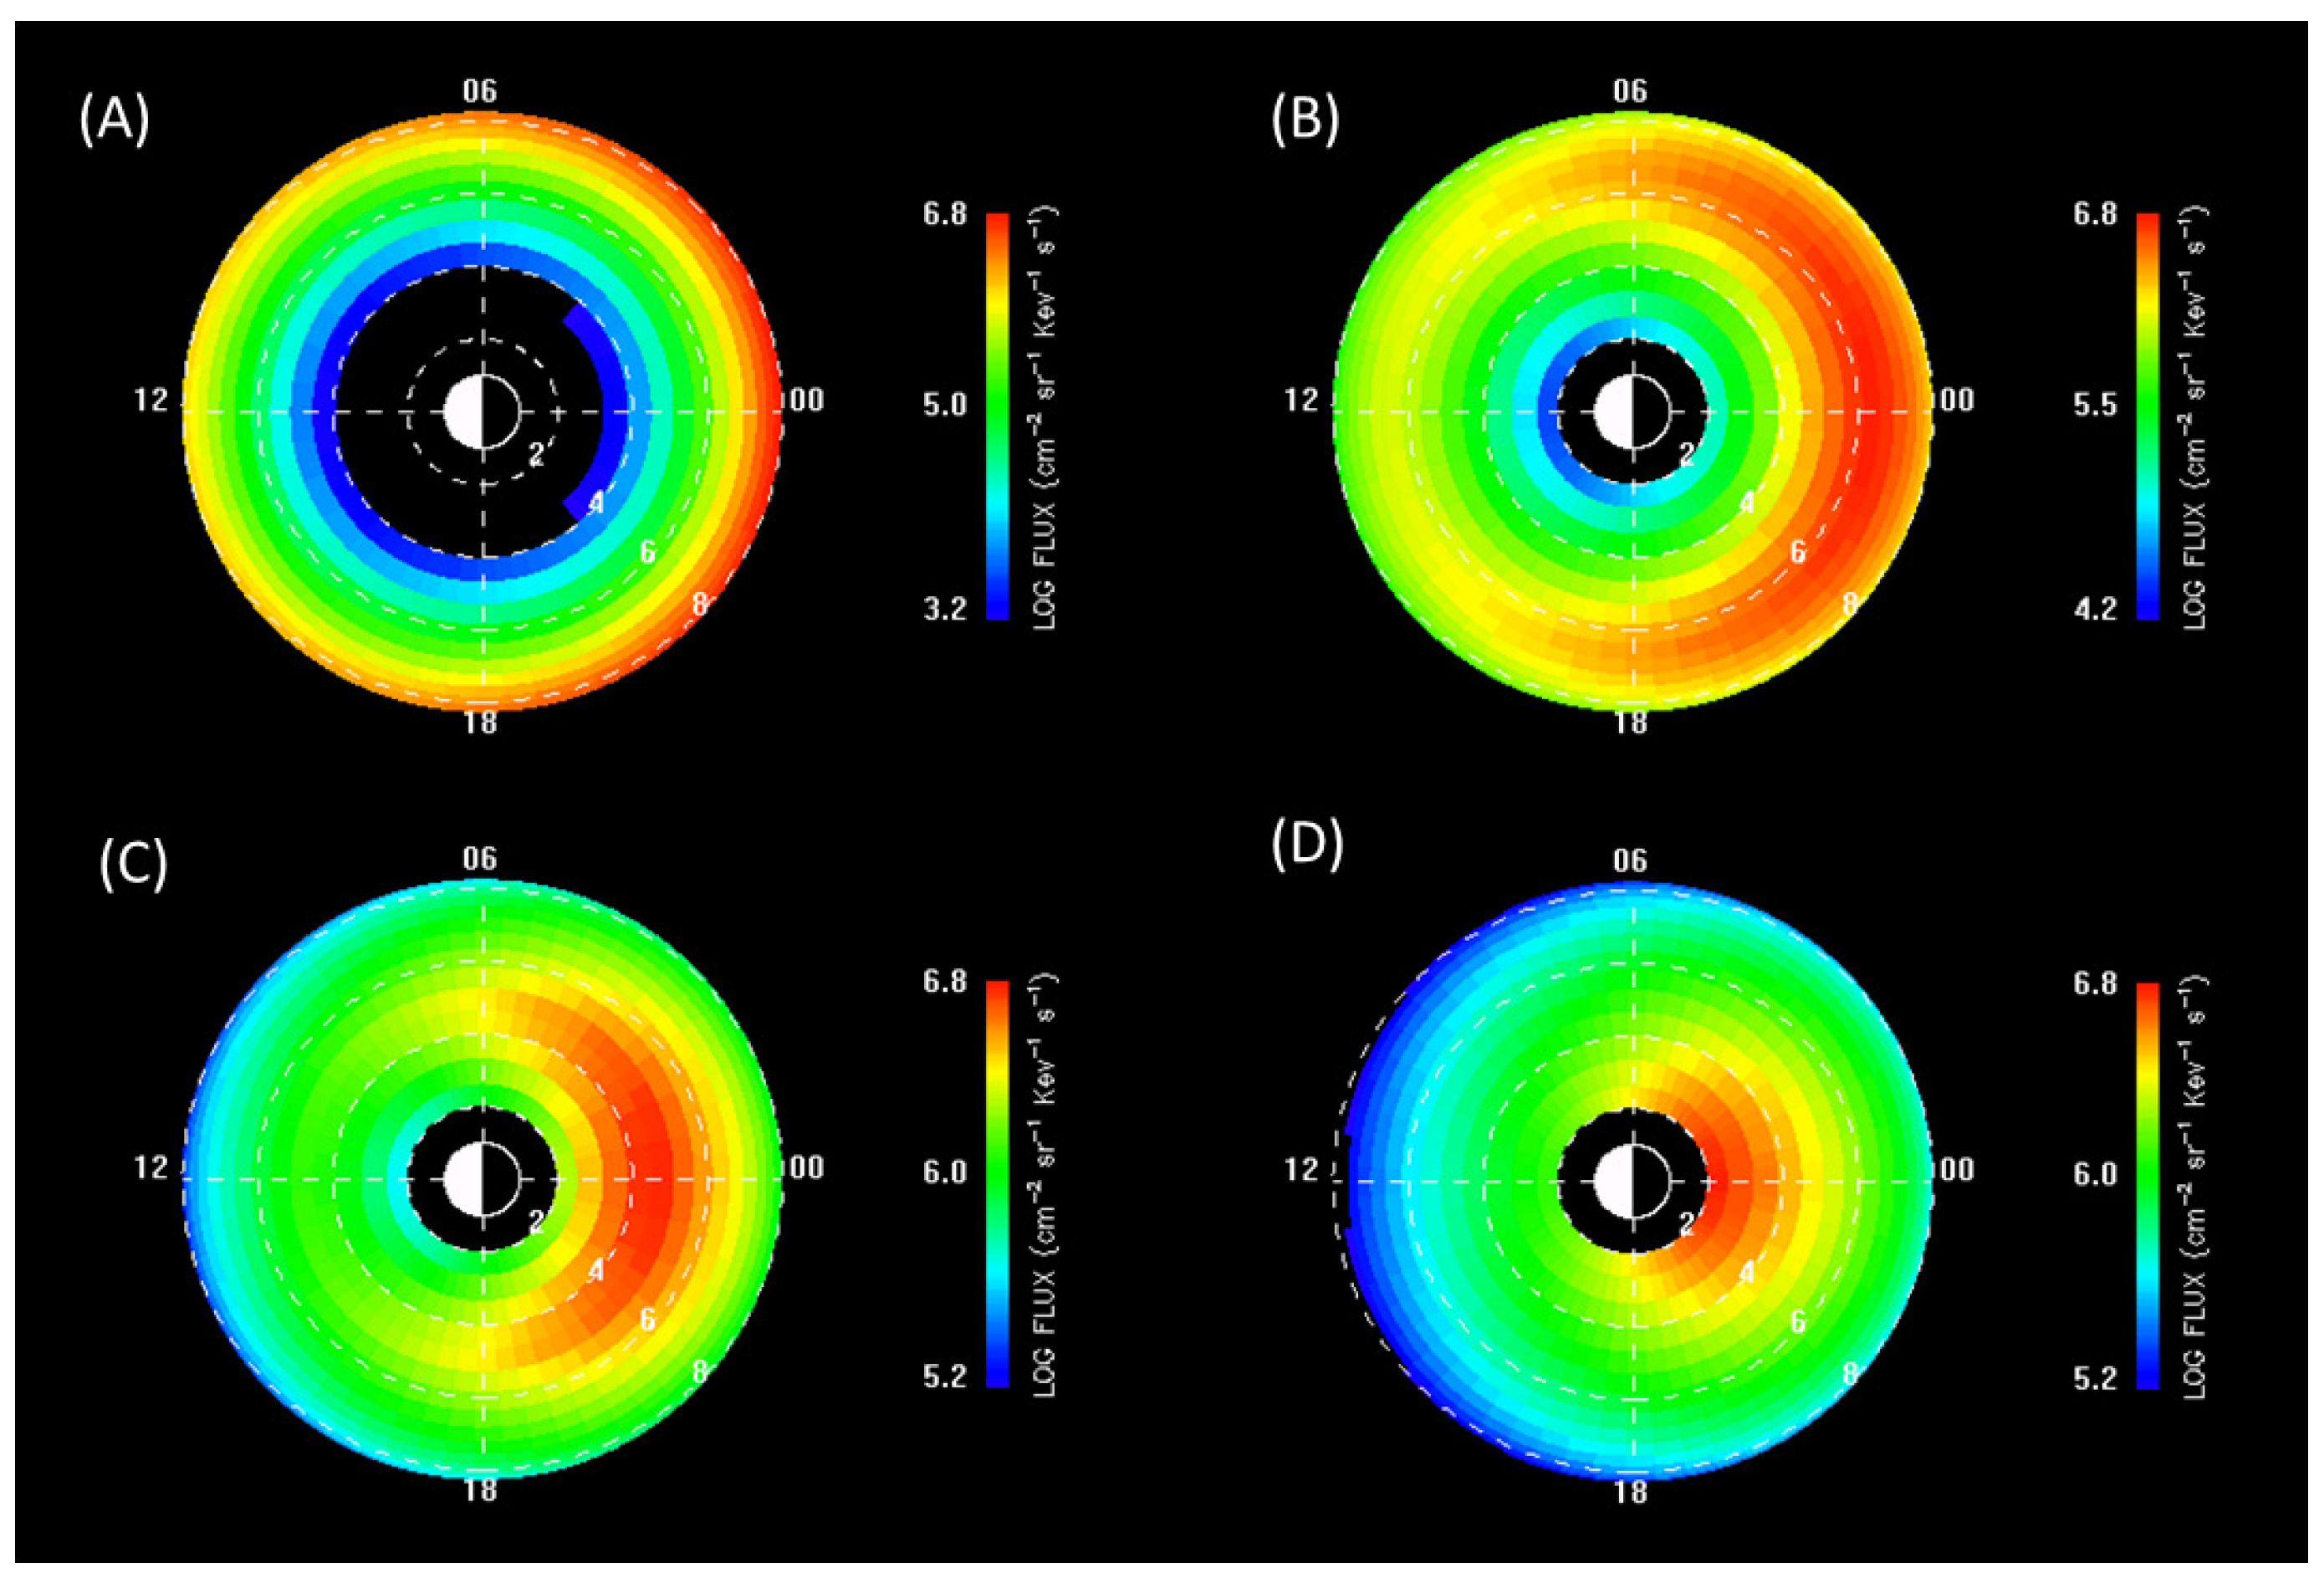
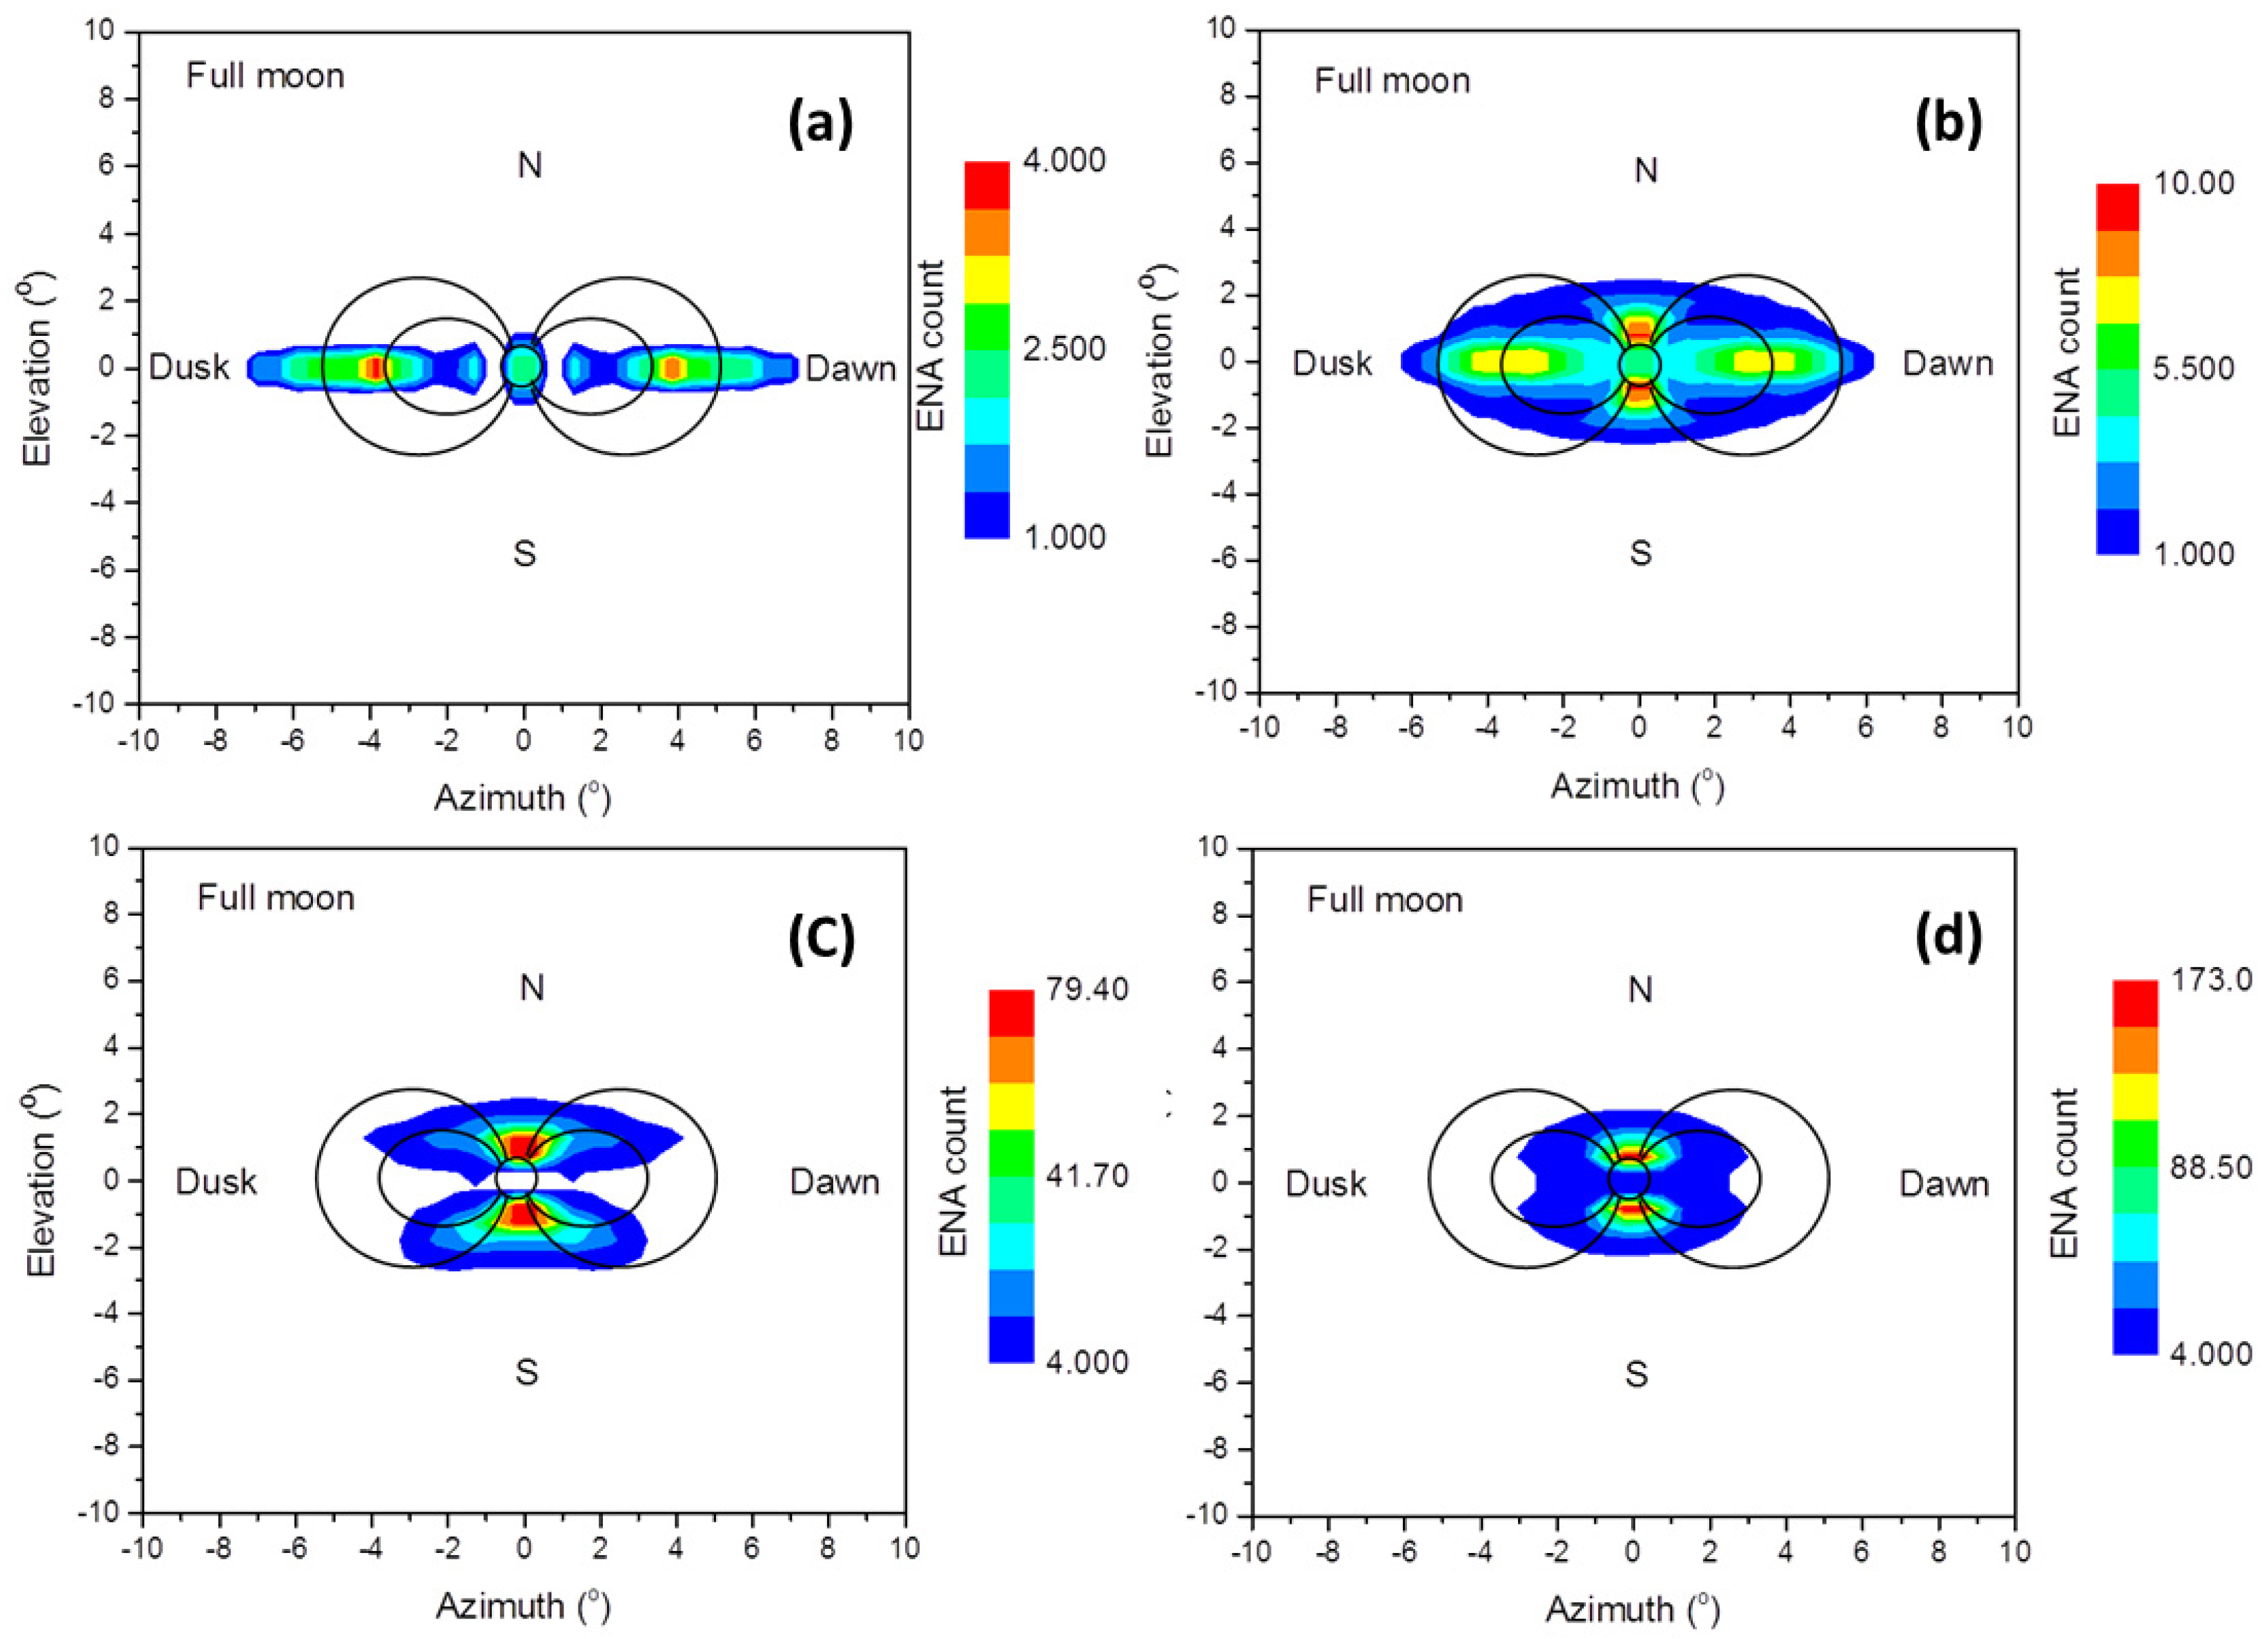
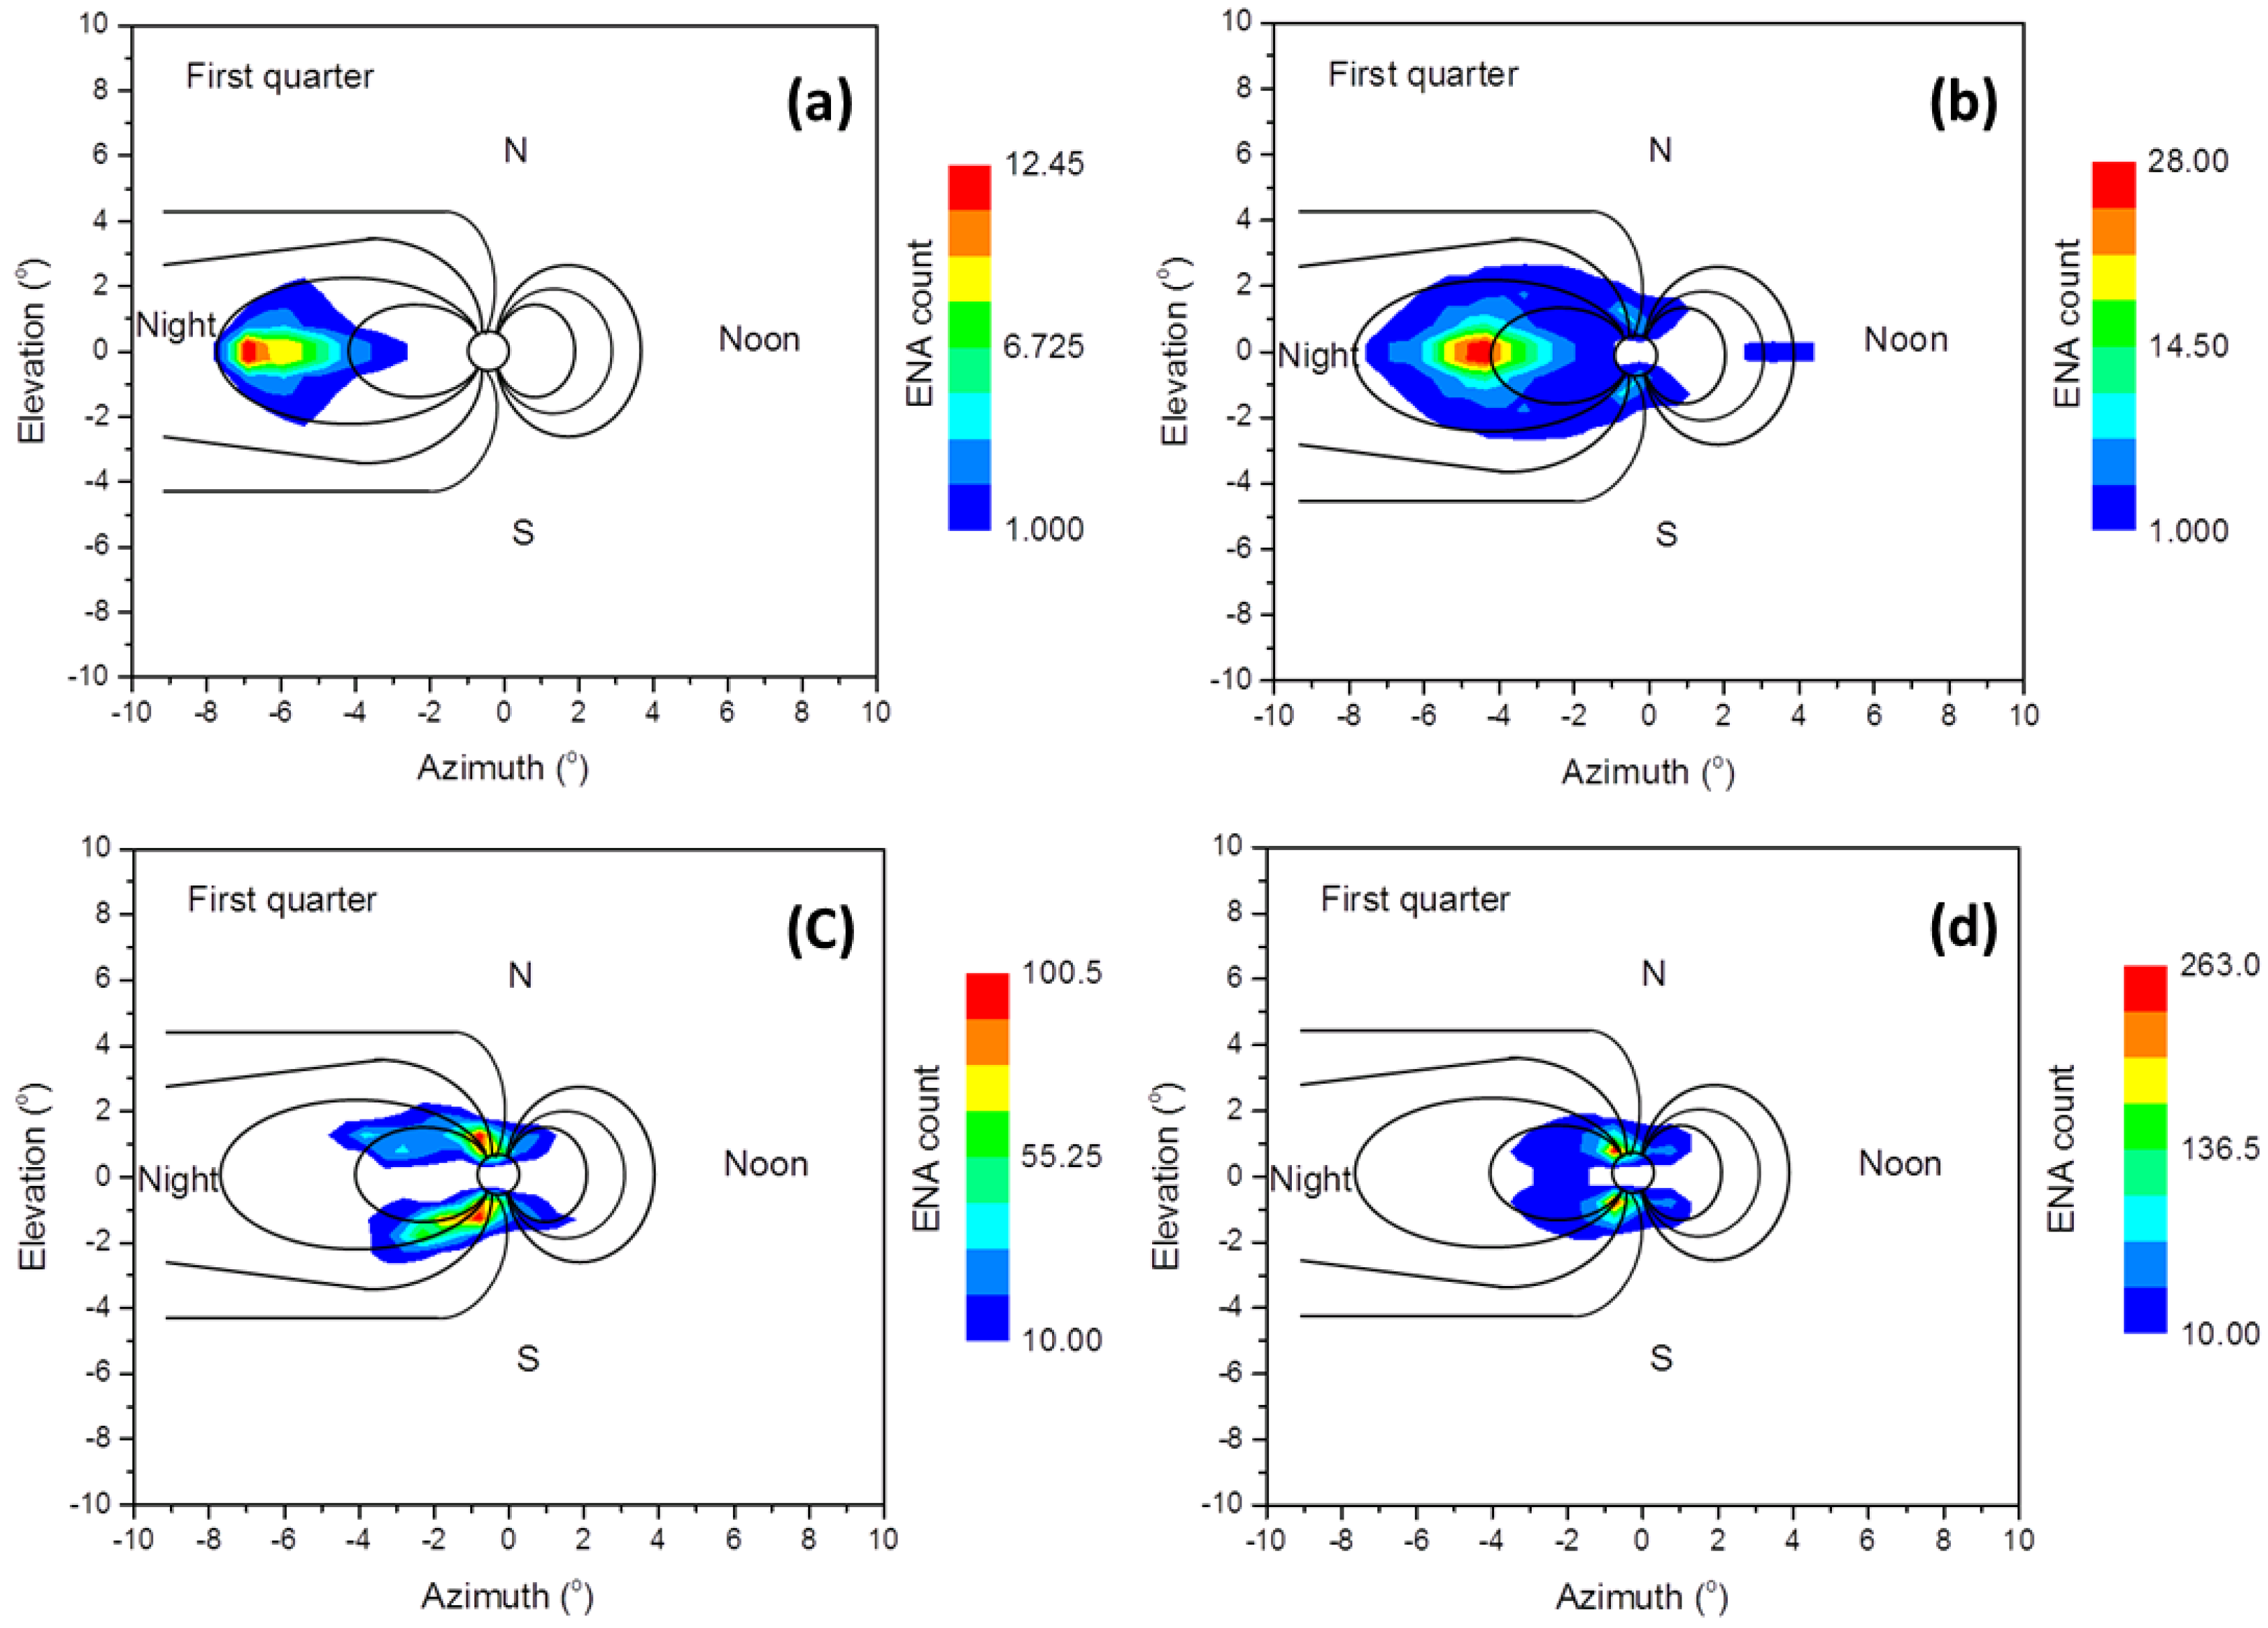
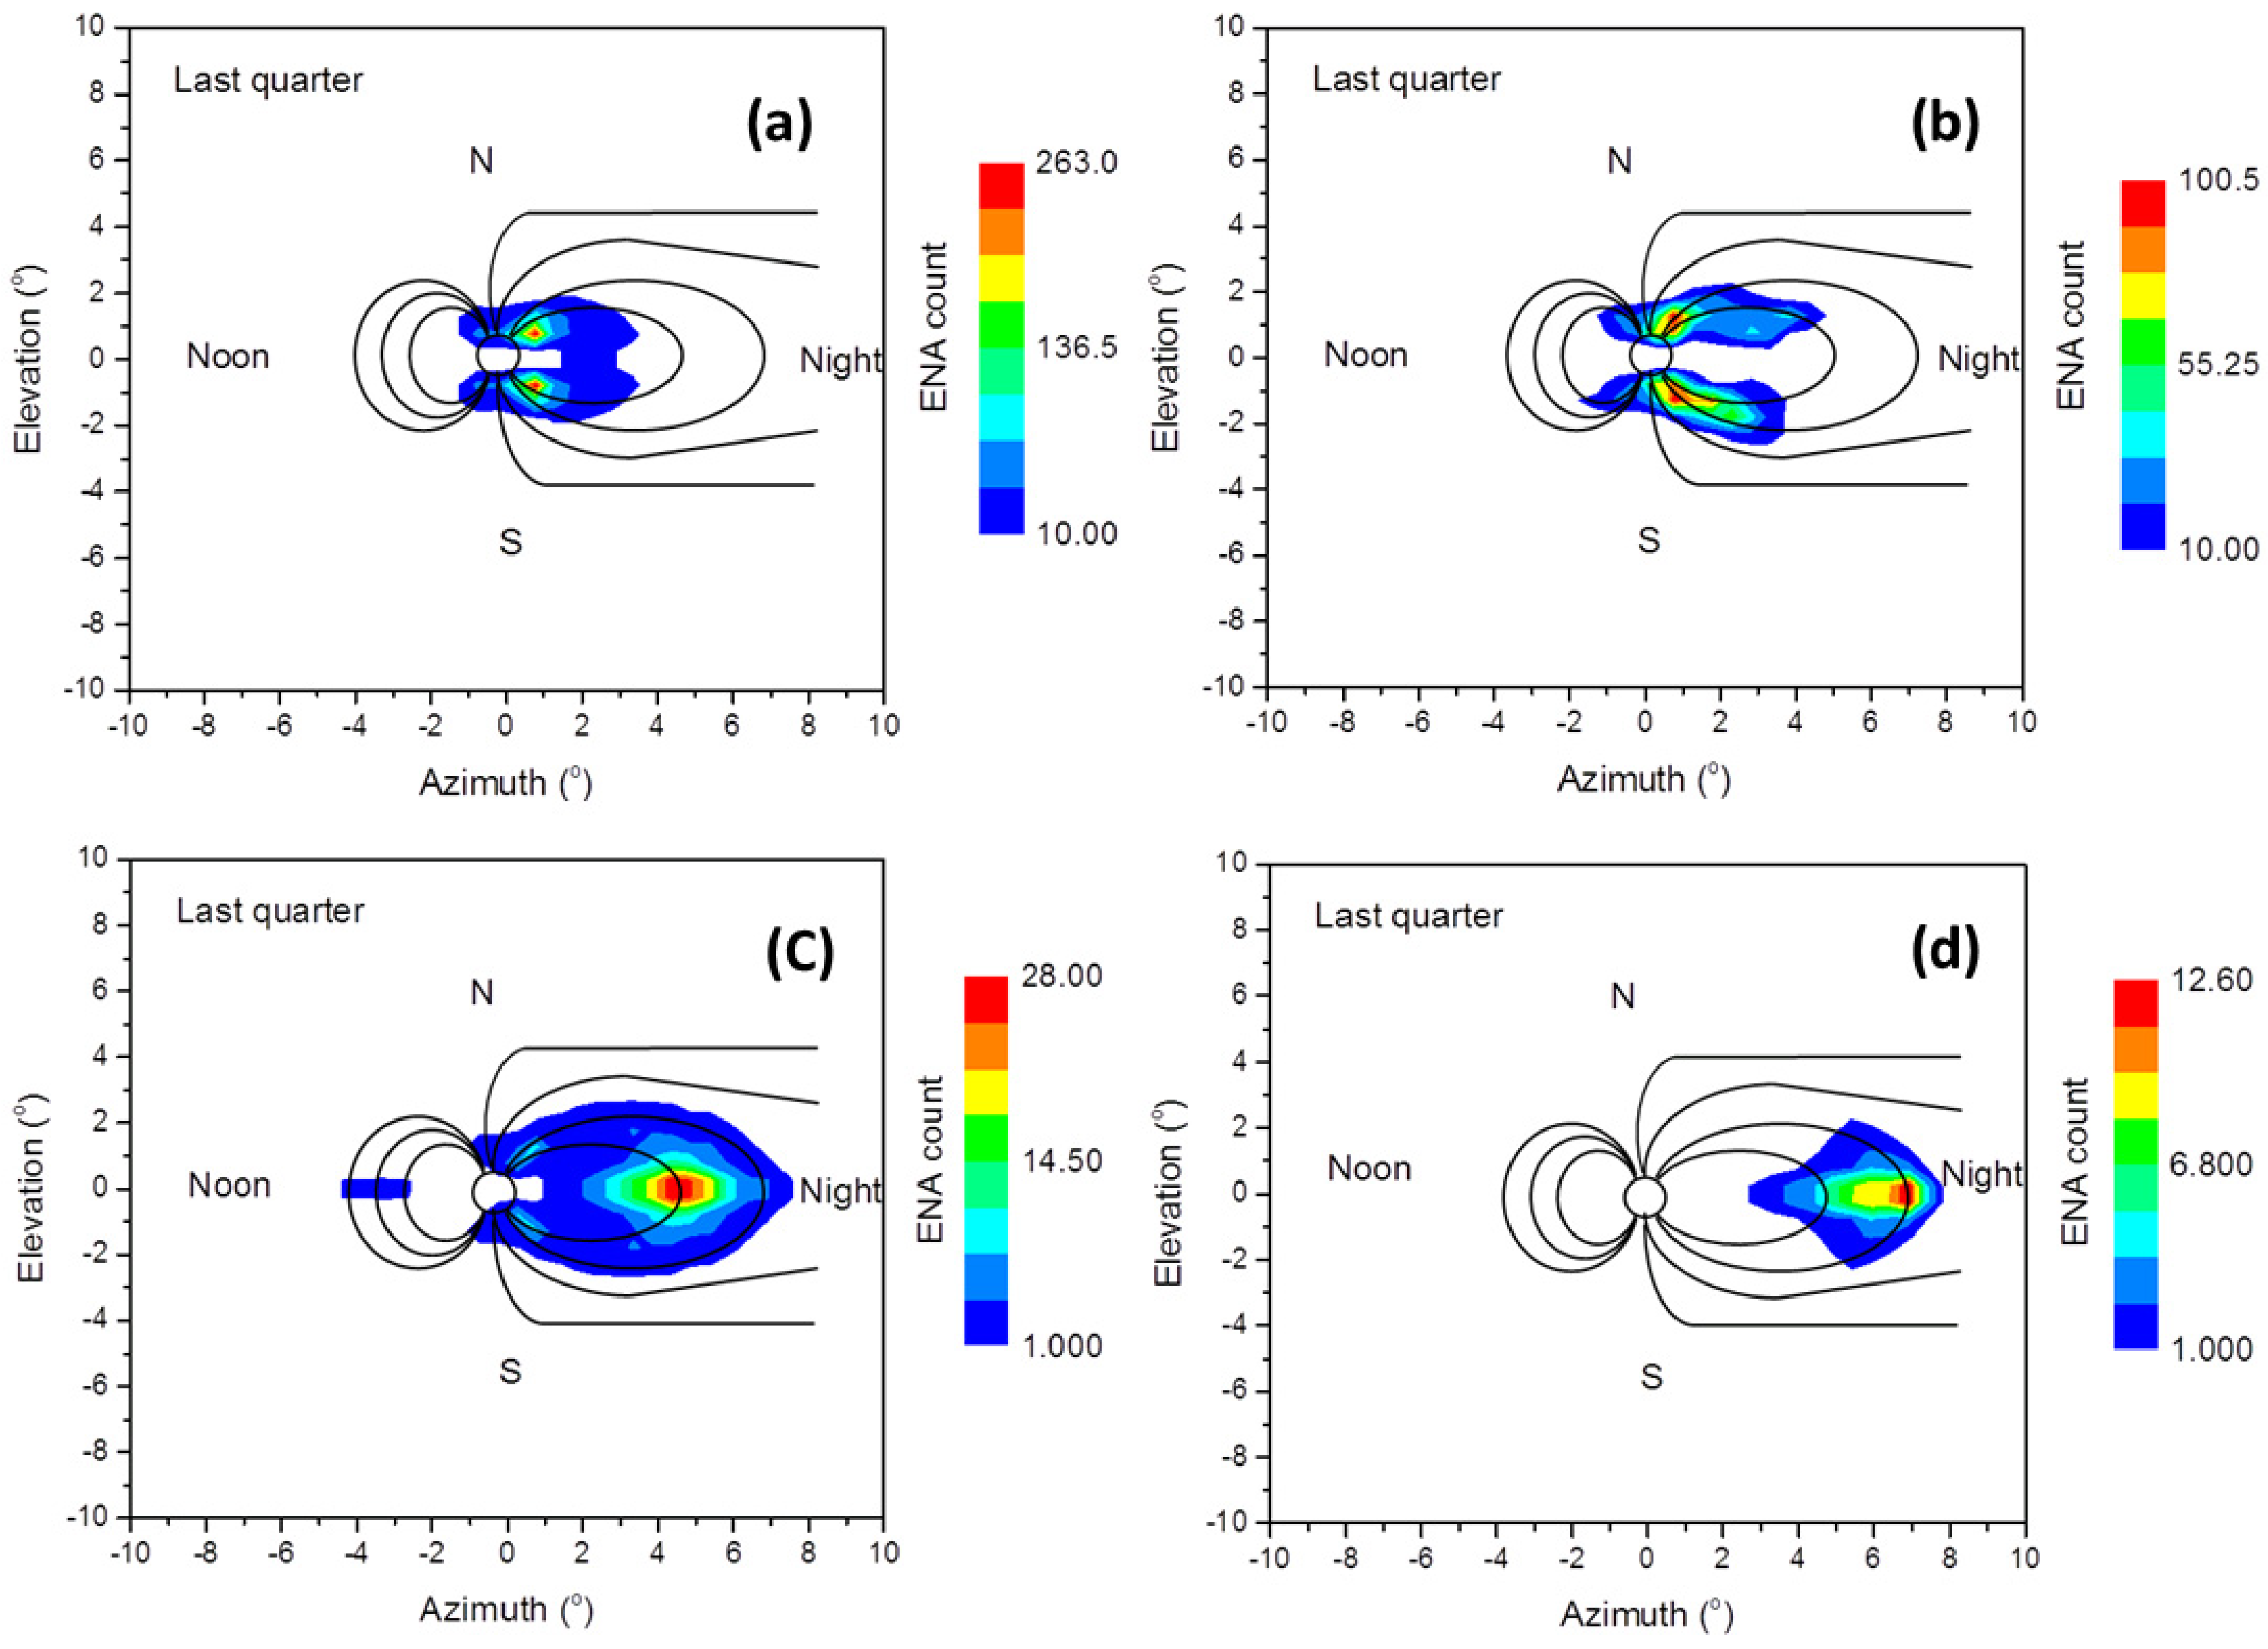
2.3. Simulation Results

We simulate the dynamic process of magnetospheric substorms with the increase in the Kp index combined with ion pitch angle diffusion. The low-altitude polar ENA enhancement caused by substorms often appears before midnight and is accompanied by eastward drift. When the ENA-enhanced signal decays, it will be accompanied by westward movement [21,22]. Thus, we mimic the substorm growth phase with the Kp index ascending sequence of the simulation images at the full moon and the first quarter (Figure 5 and Figure 6). The substorm recovery phase is simulated with the Kp index descending sequence of the simulation image in the last quarter (Figure 7).
During geomagnetic quiet, Figure 5a, Figure 6a and Figure 7d, the pitch angle of ring current energetic ions is mostly 90° (pancake-shaped distribution), and the ENA emission source is located in the equatorial ring current region and only propagates within the ecliptic plane with slow attenuation. At ~60 RE lunar orbit, the ENA imager can obtain about 200 counts in a 3 min integration time. Among them, the maximum ENA event count of a single pixel is about 4–12, as shown in Table 3. The first quarter image of the ENAs in Figure 6a are distributed near L ≥ 7 and tend to expand along magnetic field lines. The equatorial ring current is far away from the Earth and the neutral gas density is low, resulting in a low global energetic neutral index (GENI) by Ogasawara et al. [2]. Almost no ENA emission was measured in the auroral zone.
With the increase in Kp index and the pitch angle dispersion, the ENA emission source begins to shift along the magnetic field line to the low-altitude and high-latitude polar region, and the magnetic flux tubes converge in the auroral zone at low altitude. As the density of neutral gas is much higher than that in the equinoctial ring current, ENA emission from the auroral zone is rapidly enhanced, and its GENI also increases correspondingly, as shown in Figure 5b and Figure 6b. After the dispersion of the pitch angle, the ring current energetic ions with continuous pitch angle distribution in the auroral zone can produce almost omnidirectional ENA emissions. Here, we define the ENA emission brightening in the aurora zone as ENA aurora.
When the Kp index continues to increase and the pitch angle diffuses further, the energetic ion flux perpendicular to the magnetic field decreases, and the ENA emission source in the equatorial ring current begins to decrease, but the GENI further increases, as shown in Figure 5c and Figure 6c.
When the pitch angle finally diffuses into a butterfly shape distribution (the energetic ion flux perpendicular to the magnetic field line decrease to a minimum), the ENA emission source basically transfers to the high-latitude aurora zone, and the GENI also reaches a maximum, as shown in Figure 5d and Figure 6d. ENA simulation counts may increase rapidly with the increase in ion pitch angle diffusion, and both the ENA maximum and the sum counts (or GENI) increased by more than one order of magnitude, as shown in Table 3.
In Figure 7, the Kp index evolves in a reversed order, with the pitch distribution returning from butterfly to pancake. Lunar base ENA imaging measurements of the entire substorm process were not only characterized by GENI [2], but also visually monitored the evolution of the ring current ion flux through the distribution pattern of ENA emission sources.

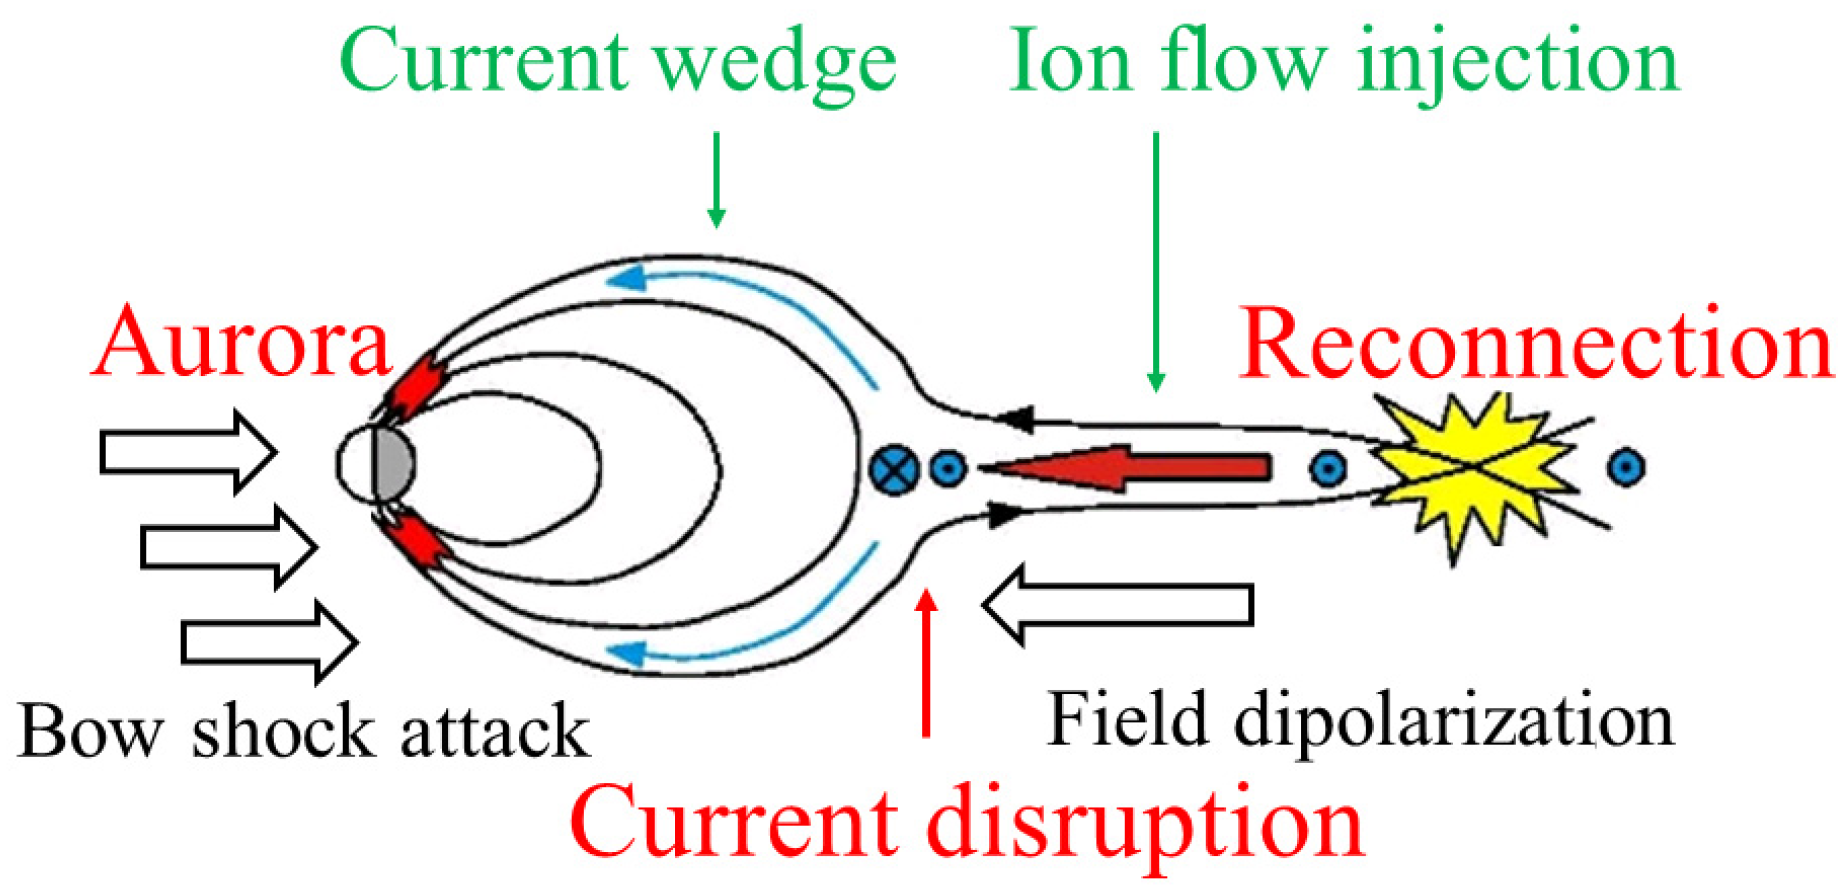
3. Macroscopic Models of Magnetospheric Substorms

Based on possibility of the visual remote sensing of ring current ion flux by ENA imaging, we propose a macroscopic model of magnetospheric substorms dominated by solar wind dynamic pressure. We believe that the energetic ions that support geomagnetic activity are originally stored in the ring current region, as shown in Figure 5a and Figure 6a. When the solar wind particle flow (bow shock) strikes, in the growth phase, the magnetopause dynamic pressure increases and the geomagnetic field is stretched tailward (bow shock attack marked in black, Figure 1). Due to the conservation of the first adiabatic invariant, the pitch angle of energetic ions diffuses within the ring current (current disruption marked in red, Figure 1), and then those ions precipitate along the field lines towards the low-altitude polar region (current wedge marked in green, Figure 1), thus completing the triggering of the aurora substorm (aurora marked in red, Figure 1), as shown from Figure 5b–d and Figure 6b–d. At the same time, the geomagnetic field permeating the magnetotail solar wind particles stream constantly picks up energetic ions in the solar wind. During the recovery phase of the substorm, the solar wind particle flow passed away, the solar wind dynamic pressure decreases, and the magnetic field begins dipolarization (field depolarization marked in black, Figure 1). The magnetic field carries the energetic ions collected from the solar wind into the ring current (ion flow injection marked in green, Figure 1). This allows the energetic ions lost in the loss cone during the precipitation to be replenished, as shown from Figure 7a–d. Visual remote sensing of magnetic reconnection at the magnetotail lobe is not available at present. However, either the high-speed stream caused by magnetotail reconnection (reconnection marked in red, Figure 1) or Earthward convection caused by magnetic field dipolarization can contribute to ring current ion injection.
Except for the phenomenon of magnetotail lobe reconnection, the different ring current morphological changes corresponding to the whole substorm process can be monitored by ENA imaging remote sensing. In general, under solar wind pressure, the angular diffusion process of energy ion ejection is very fast in the growth stage, and the recovery of substorms driven by magnetic field dipole is slow. However, the high-speed flow of energetic ions generated by magnetotail reconnection will accelerate the process of the substorm recovery stage, and even trigger a continuous series of substorms.
According to the previous inversion logic of ENA imaging, all the mass spectra and energy spectra of ENA are usually converted into the corresponding flux distributions of energetic ions on the equatorial plane. By measuring the distribution of energetic ion flux (including mass spectrum and energy spectrum) in the ring current before the substorm, changes in energy and mass spectrum (such as changes in oxygen ion composition) during the substorm can be monitored so as to obtain targeted information about the source and acceleration of ions of different components.

4. Observation Basis of Macroscopic Model of Substorms

The previous mission for ENA observations, such as Astrid [23], IMAGE [24], TC-2 [25], TWINS [26], etc., have high orbital inclination. With the exception of IBEX operating on the ecliptic plane, there are almost no ENA telemetry signals directly from the ring current. The ENA brightening signal basically comes from the low-altitude polar regions, which is called ENA aurora here. However, the NUADU/TC-2 measurements and inversions of the ENA auroral evolutionary series, combined with the in situ measurements of other multi-satellite systems, reveal many characteristics about the evolution of the ring current [21,22]. IBEX, operating within the ecliptic plane, even gave examples of ENA remote measurements of ring current ion fluxes during substorms/quiets [10].

4.1. Multi-Satellite Joint Observation of Causal Sequence of Substorm Events

High time resolution ENA imaging data recorded by the NUADU instrument aboard TC-2 are available throughout the major magnetic storm of 15 May 2005 [21]. Ion flux distributions inversed from those ENA imaging measurements showed that the evolution of the ring current ion flux during a major storm was closely related to variations of two series of substorms. Comparisons of these retrieved distributions with in situ measurements of ion fluxes made aboard the spacecraft of the LANL constellation and with magnetic field measurements recorded aboard the spacecraft of the GOES constellation (both of which are located in the equatorial plane at ~6.6 RE in the environment of the outer radiation belt) showed covariations in the three data sets. The magnetic field response of the substorms occurred earlier at the geosynchronous altitude on the night side than was the case on the ground [21]. It was found that the ENA aurora brightening occurred during geomagnetic field stretching in the growth phases of the substorms, rather than after Earthward-directed dipolarization events (Tables S1 and S2). This suggests that the energetic ions that cause the ENA aurora brightening were stored in the ring current region before. This work does not support the neutral line model of magnetotail reconnection triggering substorms. The ion flow injection/convection events that occur after this are simply the particle energy for the subsequent substorm.

4.2. Azimuth Evolution Direction of ENA Aurora

On 12 November 2004, TC-2/NUADU obtained the ENA image with the highest temporal resolution by using the close measurement at the perigee, and then reversed the ion flux distribution of the equatorial ring current [22]. We found that in ENA images projected on the equatorial plane (i.e., inverted ring current ion flux), the brightening of the ENA auroras was usually accompanied by an eastward shift of the enhanced area of the ring current ion flux. On the contrary, the ENA aurora moved westward when it weakened [21,22]. Due to the rotation of the Earth, the response sequence of the magnetospheric shell stretching tailward is from west to east, while the response sequence of magnetic field dipolarization is the opposite, stretching from east to west (Figure S1). However, the above variation in the geomagnetic field has regional characteristics, so it is hardly suitable to obtain in situ measurement to support specific geomagnetic field variations. Anyway, these observational results are indirect evidence that that magnetospheric magnetic disturbances trigger substorms.

4.3. Examples of ENA Telemetry of Ring Current during Quiet/Substorms

IBEX-Hi ENA scanning images from orbit 51 and 52 near apogee [10] (Figure S6) indicate that there are indeed ENA signals from the direction of magnetotail during geomagnetic quiet. These ENA signals with flux variations may serve as examples of the telemetry of ring current ion flux during geomagnetic substorms and quiet periods.
These IBEX-Hi ENA scanning images with gaps appearing at about −10 RE were originally thought to be remote sensing images of the plasma sheet disconnection events (Figure 2 and Figure 3 of Mccomas et al. [10], Figures S2 and S4). However, the differential fluxes of ENA on both sides of the crack are similar, indicating that the emission mechanism of ENA on both sides is the same. During the geomagnetic quiet, the energetic ions in the ring current are confined by the magnetic field, and their pitch angle is about 90°. The ENA produced by the exchange of charge between them and the surrounding neutral gas only propagates in the ecliptic plane and decays slowly. On the other hand, the energetic ions in the plasma sheet are almost in a state of thermal motion under the condition of high β value. The ENA produced by them has the characteristics of omnidirectional propagation and rapid attenuation. In Figure 4a of Mccomas et al. [10] (Figure S7), IBEX-Hi’s ENA count measurement, covering most of the magnetotail region from 26 October 2009 to 2 November 2009, shows that the ENA signal disappeared quickly at dusk on 29 October 2009, although the field of view of IBEX-Hi remained facing the plasma sheet until it entered the magnetotail on 2 November. Considering the position error caused by the width of the IBEX-Hi field of view, we believe that ENAs measured by IBEX-Hi at a distance of about 50 Re should be emitted from the ring current.
The ENA flux sunk from 500 to 250 cm−2 sr−1 s−1 keV−1 in the direction of the magnetotail observed by IBEX-Hi at orbit 51 over the interval from 21:21 UT on 27 October 2009 to 13:40 UT on 29 October 2009, as shown in Figure 3 of Mccomas et al. [10]. A substorm occurred on 28 October 2009 (Figure S3). At 3:45, the AE index (AE = 22 nT) began to grow, reaching a maximum at 11:15 (AE = 281 nT), and quieted down at 23:05 (AE = 44 nT) for about a whole day. During the substorm, the pitch angle of energetic ions in the ring current diffused, and the ENAs propagated in the ecliptic plane decreased, resulting in the observation illusion of plasma disconnection. Before midnight on the 28th, the geomagnetic activity returned to quiet, and the scanning FOV of IBEX-Hi could still cover the ring current at the far end of the magnetotail, so the enhanced signal of the ENAs was measured. The so-called plasma sheet disconnected can be understood as ENA signal weakening in the ring current region caused by the pitch angle diffusion of ring current ions during the substorm. Ogasawara et al. [2] found a positive correlation between the GENI and AE index. Unfortunately, due to the limited field of view, IBEX-Hi was not able to measure the large increase in ENA emission from the auroral zone during substorms.
IBEX orbit 52 was different. During ENA signal acquisition from 10:48 UT on 5 November 2009 to 02:23 UT on 7 November 2009, there was a small negative bay (about −6 nT) disturbance in the Dst index forecast (Figure S5) calculated by the ACE satellite real-time solar wind parameter measurement, and no substorm was generated. Although no substorms were formed, IBEX-Hi sensitively observed changes in the ion flux of the ring current and formed a transient crack in the ENA measurements, as shown in Figure 2 of Mccomas et al. [10]. This indicates that the ENA emission response monitoring of the solar wind disturbance in the ring current region may be more sensitive than the AE index.

5. Conclusions

The terrestrial ring current is an aggregation area of energetic ions that are bound by the magnetic field of the magnetosphere with a pitch angle of about 90° near the magnetotail equatorial plane. Similar to a cumulonimbus cloud in the meteorological sense, the spatial extent and the flux strength of the energetic ions are determinants of geomagnetic activity. The dynamic evolution of ENA emission in the ring current region and the global ENA emission flux are more sensitive to the solar wind disturbance response. During the solar maximum, the solar wind pressure surrounding the magnetopause is stronger, and the scale of the ring current is larger so that the geomagnetic activity is also stronger. The effective monitoring of the ring current will be the key data support for the space weather forecast. The Moon-based platform will be an ideal choice for ENA imaging monitoring of the terrestrial ring current.
Based on the motion characteristics of the ring current energetic ions, there is only one order of magnitude difference between the ENA counts generated in the equatorial plane and the auroral zone, which is within the effective range of the ENA imager measurements. The simulated ENA image can characterize the ring current ion flux distribution pattern of the magnetosphere. The lunar base two-dimensional ENA imager can be used to obtain the ENA measurement image with the minimum time resolution of about 3 min, which has statistical significance. The simulation of the spatial distribution pattern of the magnetospheric ring current by the lunar base ENA imager shows that the current interruption and substorm current wedge, another important link in the process of the magnetospheric substorm, can be visualized. The variation in the ring current distribution reflects the evolution of magnetospheric substorms. It will provide an intuitive and reliable basis for investigating the formation mechanism of magnetospheric substorms. The ENA imager with the function of mass spectrum and energy spectrum can remote sense the position and motion of the earliest occurrence of energetic oxygen ions during the substorm so as to obtain the relevant information of the source and acceleration of these oxygen ions.

Supplementary Materials

The following supporting information can be downloaded at: https://www.mdpi.com/article/10.3390/astronomy2030011/s1, Figure S1: Evolutionary sequence diagrams show the azimuth drift of the ENA aurora and ion flux inversions during a substorm; Figure S2: IBEX-Hi measurement of orbit 51; Figure S3: AE index curve; Figure S4: IBEX-Hi measurement of orbit 52; Figure S5: Time-varying curves of Dst index; Figure S6: Orbit 51 of IBEX; Figure S7: The raw data of IBEX-Hi of orbit 51; Table S1:Time sequence of various events during the 0736 UT substorm; Table S2: Time sequence of various events during the 0822 UT substorm.

Author Contributions

Conceptualization, L.L.; methodology, L.L.; software, L.L.; validation, Q.Y., S.J. and Z.X.; formal analysis, L.L.; investigation, L.L.; resources, Q.Y.; data curation, Y.C.; writing—original draft preparation, L.L.; writing—review and editing, L.L.; visualization, J.L.; supervision, L.L.; project administration, Q.Y.; funding acquisition, Q.Y. All authors have read and agreed to the published version of the manuscript.

Funding

This research was funded by [National Key R&D Program of China] grant number [2020YFE0202100] and [National Mission/National Major Science and Technology Project: CE-7 Relay Satellite Display Neutral Atom Imager] grant number [E16504 B31 S].

Acknowledgments

This study was Supported by National Key R&D Program of China (Grant No. 2020YFE0202100), National Mission/Other National Mission: Research on Key Technologies of the Outer Heliospheric Space Exploration System (Grant No. Y91 Z100102) and National Mission/National Major Science and Technology Project: CE-7 Relay Satellite Display Neutral Atom Imager (Grant No. E16504 B31 S).

Conflicts of Interest

The authors declare no conflict of interest.

References

  1. Jang, E.J.; Yue, C.; Zong, Q.G.; Fu, S.Y.; Fu, H.B. The effect of non-storm time substorms on the ring current dynamics. Earth Planet. Phys. 2021, 5, 251–258. [Google Scholar] [CrossRef]
  2. Ogasawara, K.; Dayeh, M.A.; Fuselier, S.A.; Goldstein, J.; McComas, D.J.; Valek, P. Terrestrial energetic neutral atom emissions and the ground-based geomagnetic indices: Implications from IBEX observations. J. Geophys. Res. Space Phys. 2019, 124, 8761–8777. [Google Scholar] [CrossRef]
  3. McComas, D.J.; Allegrini, F.; Bochsler, P.; Bzowski, M.; Collier, M.; Fahr, H.; Fichtner, H.; Frisch, P.; Funsten, H.O.; Fuselier, S.A.; et al. IBEX—Interstellar Boundary Explorer. Space Sci. Rev. 2009, 146, 11–33. [Google Scholar] [CrossRef]
  4. Lui AT, Y.; Burrows, J.R. On the location of aural arcs near substorm onset. J. Geophys. Res. 1978, 83, 3342. [Google Scholar] [CrossRef]
  5. Samson, J.C.; Lyons, L.R.; Newell, P.T.; Creutzberg, F.; Xu, B. Proton aurora and substorm intensifications. Geophys. Res. Lett. 1992, 19, 2167–2170. [Google Scholar] [CrossRef]
  6. Frank, I.A.; Sigwarth, J.B. Findings concerning the positions of substorm onsets with auroral images from the polar spacecralt. J. Geophys. Res. 2000, 105, 12747. [Google Scholar] [CrossRef]
  7. Donovan, E.; Liu, W.; Liang, J.; Spanswick, E.; Voronkov, I.; Connors, M.; Syrjäsuo, M.; Baker, G.; Jackel, B.; Trondsen, T.; et al. Simultaneous THEMIS in situ and auroral observations of a small substorm. Geophys. Res. Lett. 2008, 35, L17S18. [Google Scholar] [CrossRef]
  8. Baker, D.N.; Pulkkinen, T.I.; Angelopoulos, V.; Baumjohann, W.; McPherron, R.L. Neutral line model of substorms: Past results and present view. J. Geophys. Res. 1996, 101, 12975. [Google Scholar] [CrossRef]
  9. Kepko, L.; McPherron, R.L.; Amm, O.; Apatenkov, S.; Baumjohann, W.; Birn, J.; Lester, M.; Nakamura, R.; Pulkkinen, T.I.; Sergeev, V. Substorm current wedge revisited. Space Sci. Rev. 2015, 190, 1–46. [Google Scholar] [CrossRef]
  10. McComas, D.J.; Dayeh, M.A.; Funsten, H.O.; Fuselier, S.A.; Goldstein, J.; Jahn, J.M.; Janzen, P.; Mitchell, D.G.; Petrinec, S.M.; Reisenfeld, D.B.; et al. First IBEX observations of the terrestrial plasma sheet and a possible disconnection event. J. Geophys. Res. 2011, 116, A02211. [Google Scholar] [CrossRef]
  11. Lu, L.; Yu, Q.L.; Zhou, P.; Zhang, X.; Zhang, X.G.; Wang, X.Y.; Chang, Y. Simulation study of the energetic neutral atom (ENA) imaging monitoring of the geomagnetosphere on a lunar base. Sol. Terr. Phys. 2021, 7, 3–11. [Google Scholar] [CrossRef]
  12. Lu, L.; Yu, Q.L.; Lu, Q. Near-approach imaging simulation of low-altitude ENA emissions by a LEO satellite. Front. Astron. Space Sci. 2020, 7, 35. [Google Scholar] [CrossRef]
  13. Smith, P.H.; Bewtra, N.K. Charge exchange lifetimes for ring current ions. Space Sci. Rev. 1978, 22, 301–318. [Google Scholar] [CrossRef]
  14. Brandt, P.C.; Barabash, S.; Roelof, E.C.; Chase, C.J. Energetic neutral atom imaging at low altitudes from the Swedish microsatellite Astrid: Extraction of the equatorial ion distribution. J. Geophys. Res. 2001, 106, 25731–25744. [Google Scholar] [CrossRef]
  15. Sauvaud, J.A.; Winckler, J.R. Dynamics of plasma, energetic particles, and fields near synchronous orbit in the nighttime sector during magnetospheric substorms. J. Geophys. Res. 1980, 85, 2043–2056. [Google Scholar] [CrossRef]
  16. Fu, H.S.; Khotyaintsev, Y.V.; André, M.; Vaivads, A. Fermi and betatron acceleration of suprathermal electrons behind dipolarization fronts. Geophys. Res. Lett. 2011, 38, L16104. [Google Scholar] [CrossRef]
  17. Liu, C.M.; Fu, H.S.; Xu, Y.; Cao, J.B.; Liu, W.L. Explaining the rollingpin distribution of suprathermal electrons behind dipolarization fronts. Geophys. Res. Lett. 2017, 44, 6492–6499. [Google Scholar] [CrossRef]
  18. Liu, C.M.; Fu, H.S.; Cao, J.B.; Xu, Y.; Yu, Y.Q.; Kronberg, E.A.; Daly, P.W. Rapid pitch angle evolution of suprathermal electrons behind dipolarization fronts. Geophys. Res. Lett. 2017, 44, 10116–10124. [Google Scholar] [CrossRef]
  19. Rairden, R.L.; Frank, L.A.; Craven, J.D. Geocoronal imaging with dynamics explorer. J. Geophys. Res. Space Phys. 1986, 91, 13613–13630. [Google Scholar] [CrossRef]
  20. Tinsley, B.A.; Hodges RR, J.R.; Rohrbaugh, R.P. Monte carlo models for the terrestrial exosphere over a solar cycle. J. Geophys. Res. Space Phys. 1986, 91, 13631–13647. [Google Scholar] [CrossRef]
  21. Lu, L.; McKenna-Lawlor, S.; Cao, J.B.; Kudela, K.; Balaz, J. The causal sequence investigation of the ring current ion-flux increasing and the magnetotail ion injection during a major storm. Sci. China Earth Sci. 2016, 59, 129–144. [Google Scholar] [CrossRef]
  22. Lu, L.; McKenna-Lawlor, S.; Balaz, J. Close up observation and inversion of low-altitude ENA emissions during a substorm event. Sci. China Earth Sci. 2019, 62, 1024–1032. [Google Scholar] [CrossRef]
  23. Barabash, S.; Brandt, P.C.; Norberg, O.; Lundin, R.; Roelof, E.C.; Chase, C.J.; Mauk, B.H.; Koskinen, H. Energetic neutral atom imaging by the Astrid microsatellite. Adv. Space Res. 1997, 20, 1055–1060. [Google Scholar] [CrossRef]
  24. Burch, J.L. IMAGE mission overview. Space Sci. Rev. 2000, 91, 114. [Google Scholar] [CrossRef]
  25. McKenna-Lawlor, S.; Balaz, J.; Barabash, S.; Johnsson, K.; Lu, L.; Shen, C.; Shi, J.K.; Zong, Q.G.; Kudela, K.; Fu, S.Y.; et al. The energetic NeUtral Atom Detector Unit (NUADU) for China’s Double Star Mission and its Calibration. Nucl. Inst. Methods A 2004, 530, 311–322. [Google Scholar] [CrossRef]
  26. McComas, D.J.; Allegrini, F.; Baldonado, J.; Blake, B.; Brandt, P.C.; Burch, J.; Clemmons, J.; Crain, W.; Delapp, D.; DeMajistre, R.; et al. The two wide-angle imaging neutral-atom spectrometers (twins) nasa mission-of-opportunity. Space Sci. Rev. 2009, 142, 157–231. [Google Scholar] [CrossRef]
Figure 1. Schematic diagram of the substorm model, including three key node phenomena (marked in red), two connection processes (in green), and two driving factors (in black).
Astronomy 02 00011 g001
Figure 2. Schematic diagram of lunar orbit. Three simulation positions are labeled as first quarter, last quarter, and full moon.
Astronomy 02 00011 g002
Figure 3. Simulated ion flux distribution of equatorial ring current before the ion pitch angle diffusion, where the Kp index is 0, 3, 5 and 7 from (AD) respectively.
Astronomy 02 00011 g003
Figure 4. Pitch angle distributions of different Kp indices.
Astronomy 02 00011 g004
Figure 5. Simulation distribution of Luna based ENA imaging at full moon, where the order of Kp indices from (ad) is the same as in Figure 3.
Astronomy 02 00011 g005
Figure 6. Simulation distribution of Luna based ENA imaging at the first quarter with the same Kp index order from (ad) as Figure 5.
Astronomy 02 00011 g006
Figure 7. Simulation distribution of Luna based ENA imaging at the last quarter, the Kp index is 7, 5, 3, and 0 from (ad), in the reverse order of Figure 5.
Astronomy 02 00011 g007
Table 1. Instrument simulation design parameters [11].
Atomic speciesH, O (simulation: H)
Energy range4–200 keV (simulation: 4–20 keV)
Field of view30° × 30°(simulation: 20° × 20°)
Angle resolution≤0.5°(simulation: 0.5° × 0.5°)
Geometric factorSingle detector: 1.08 × 10⁻⁴ cm2 sr; (simulation: ×40 × 40 ≈ 0.173)
Sampling periodSimulation: 3 min
Element numbersSimulation: 30 (latitude) × 60 (longitude) × 18 (L value) = 32,400
Table 2. Maximum hydrogen ion fluxes.
Kp index0357
Maximum ion flux (cm−2 sr−1 keV−1 s−1)5.89 × 1065.88 × 1065.91 × 1065.94 × 106
Location of L7.36.44.63.2
Table 3. Statistics of ENA counts.
Full MoonFirst (or Last) Quarter
Kp IndexMaximumSumMaximumSum
03.8194.312.4225.9
39.2600.427.3702.6
579.22169.1100.12279.3
7172.92334.8262.12416.8
Disclaimer/Publisher’s Note: The statements, opinions and data contained in all publications are solely those of the individual author(s) and contributor(s) and not of MDPI and/or the editor(s). MDPI and/or the editor(s) disclaim responsibility for any injury to people or property resulting from any ideas, methods, instructions or products referred to in the content.

