Proceeding Paper

Bayesian Model Selection and Parameter Estimation for Complex Impedance Spectroscopy Data of Endothelial Cell Monolayers †

1
Institut für Physiologie, Medizinische Fakultät Carl Gustav Carus, TU Dresden, Fetscherstr. 74, 01307 Dresden, Germany
2
Carl-von-Basedow-Klinikum Saalekreis gGmbH, Weiße Mauer 52, 06217 Merseburg, Germany
3
Physiologisches Institut, Fachbereich Medizin der Justus-Liebig-Universität, Aulweg 129, 35392 Giessen, Germany
*
Author to whom correspondence should be addressed.
Presented at the 42nd International Workshop on Bayesian Inference and Maximum Entropy Methods in Science and Engineering, Garching, Germany, 3–7 July 2023.
Phys. Sci. Forum 2023, 9(1), 8; https://doi.org/10.3390/psf2023009008
Published: 28 November 2023

Abstract

:
Endothelial barrier function can be quantified by the determination of the transendothelial resistance (TER) via impedance spectroscopy. However, TER can only be obtained indirectly based on a mathematical model. Models usually comprise a sequence of a resistance in parallel with a capacitor (RC-circuit), each for the cell layer (including TER) and the filter substrate, one resistance (R) for the medium, and a constant phase element (CPE) for the electrode–electrolyte interface. We applied Bayesian data analysis on a variety of model variants. Phase and absolute values of impedance data were acquired over time by a commercial device for measurements of pure medium, medium and raw filter, and medium with cell-covered filter stimulated with different agents. Medium and raw filter were best described by a series of four and three RC-circuits, respectively. Parameter estimation of the TER showed a concentration-dependent decrease in response to thrombin. Model comparison indicated that even high concentrations of thrombin did not fully disrupt the endothelial barrier. Insights in the biophysical meaning of model parameters were gained through complemental cell-free measurements with sodium chloride. In summary, Bayesian analysis allows for valid parameter estimation and the selection of models with different complexity under various experimental conditions to characterize endothelial barrier function.

1. Introduction

The endothelium forms the essential barrier between the intravascular and the tissue space. It is indispensable for physiological and pathophysiological processes like the selectivity of the blood–brain barrier or the formation of oedema. An important parameter for describing this barrier is permeability. A method for quantifying the endothelial barrier function is impedance spectroscopy. Here, an alternating current is applied and the resulting complex resistance, the impedance Z ( f ) , is measured for different frequencies f. The defining parameters are the frequency-dependent course of absolute value | Z | and the phase Ph of the complex impedance. For the measurements, isolated cell monolayers are cultivated on a filter insert. For characterizing the monolayer, the transendothelial resistance TER is often used. This parameter cannot be measured directly, and therefore it will be obtained by mathematical modeling with an equivalent circuit, which describes the measuring system (see Figure 1). The model parameters have to be optimized to obtain the best fit of the model to data values. Commercially available impedance spectroscopes allow for the easy experimental access of | Z | and Ph and often a direct data analysis with preset models. However, these models are neither exchangeable nor expandable. The standard deviation of the resulting model parameters is often not provided and should therefore be calculated via repeated measurements. Further, a quantitative model comparison is not possible. Hence, we used Bayesian Data analysis for evaluating impedance spectroscopy data.

2. Materials and Methods

Measurements were performed with a commercially available impedance spectroscope (CellZscope®–nanoAnalytics GmbH, Münster, Germany). Three different conditions were measured—only medium, medium and filter, and medium with cell-covered filter. We used human umbilical vein endothelial cells (HUVEC), which were isolated and cultivated according to established protocols [1,2]. ECGM (Endothelial Cell Growth Medium, PromoCell®, Heidelberg, Germany) was used as cell medium. The filter inserts were composed of polyester (Transwell® Permeable Support, Corning, NY, USA) with an area of 0.33 cm2, a pore size of 0.4 μm, and 4 × 10⁶ pores/cm2. Stimulations were carried out with thrombin, which leads to a concentration-dependent increase in the macromolecule permeability via the contraction of endothelial cells and intercellular gap formation [3,4]. Four different concentrations (0.1 U/mL, 0.2 U/mL, 1.0 U/mL, and 2.0 U/mL) were used. Furthermore, cells were exposed to triton X-100 0.1%, which destroys the lipid layer of the cell membrane [5]. Cell medium was used as a reference for stimulation. Measurements were performed at 42 frequencies in the range from 3 Hz to 100 kHz; this whole spectrum is the data set per time point. The time period of 0.5 h before to 1.5 h after stimulation was analyzed. The temporal resolution was about 5 min, which resulted in 54 time points for each stimulation.
Bayesian data analysis is based on the Bayesian Theorem:
P H | D , I = P D | H , I · P H | I P D | I
It is a logically consistent method for determining model parameters given a model hypothesis H by taking into account the measured data, their errors D, and previous information I [6,7]. The result is the posterior P H | D , I , which represents the probability density functions of the parameters. It is based on the posterior mean, and its standard deviation can be calculated. Previous knowledge of parameters can be included as a prior P H | I , and both data sets | Z | and Ph can be incorporated in the likelihood P D | H , I for the analysis. The determination of the evidence P D | I allows for quantitative model comparisons ([8] (chapter 3.5) and [9]) and therefore valid decisions on the most appropriate model based on the respective data. Bayesian data analysis was performed with a MultiNested-Sampling algorithm based on [10] and the Python interface of [11].
As all parameters of the models are positive and may vary over several orders of magnitude, the Jeffreys’ prior was used. The implementation within nested sampling was performed as in the procedure of [9].
Since data uncertainties and possible correlations of | Z | and Ph of the CellZscope are not known, an algorithm was implemented to estimate those for each measured frequency for every single well during steady state measurements at the end of the experiment. Analyzing the frequency course of the estimated uncertainties indicated that | Z | and Ph are not measured directly by the commercial device, and therefore their uncertainties may be correlated. This was included by a correlation matrix in the likelihood.
Different equivalent circuits were analyzed for the three experimental conditions. The commonality of all of the models chosen for the analysis was a constant phase element CPE, describing the electrode–electrolyte interface, combined with a series connection of several RC-circuits (the parallel connection of a resistance R and a capacitor C). The impedance of such an RC-circuit is calculated by Z R C = R 1 + i · ω · C · R . The exact number n RC of the RC-circuits was determined as a parameter via model comparison. The particular R and C are denominated with the index e and the number 1 to n RC . The impedance of the CPE is calculated by Z C P E = 1 A · ( i · ω ) n , so it is characterized by two parameters A and n, which are denoted by CPE A and CPE n in this work. The exponent n is limited between 0 and 1, describing for the lower limit a pure ohmic and for the higher limit a pure capacitative performance, respectively.
For measurements with medium only, this equivalent circuit was compared to a model with an additional ohmic resistance in series (as in [12]).
For the filter, 6 different elements added in series were tested: an ohmic resistance, an RC-circuit, an RC-circuit with a definite capacitance calculated from the physical properties of the filter, an R||CPE-circuit, and two more complex models, which attempted to include the pores of the filter. The cell monolayer was modeled by an RC-circuit. The capacitance of cells was already determined experimentally in 1925 by [13] for erythrocytes with C C e = 0.81 μF/cm2. This magnitude was also verified for other cell types [14]. Thus, this capacitance of cells could be separated via specifying the corresponding prior limits.
For obtaining deeper insight into the biophysical meaning of the model components and parameters, further experiments with deionised water ( dd H 2 O ) and sodium chloride solutions were carried out. A 1 M stock solution was diluted in 9 different concentrations ranging from ratio 1:1012 to 1:10. For each concentration, several data sets were measured, and these data sets were numbered consecutively since there is not such a relevant time course like for the stimulation experiments.

3. Results

After an extensive and successful validation with self simulated test data (data not shown), the algorithm was applied to the experimental data. For each time point, the impedance spectrum was analyzed with different models and the model probabilities and parameters were estimated. For measurements with medium only, a model consisting of the CPE and n RC = 3 RC-circuits had the best results. This is in contrast to the common assumption that the medium should be described as a simple ohmic resistance. It is noteworthy that the capacitance of one RC-circuit resulted in the low range of 10−9 F, whereas the others were estimated within the range of 10−5–10−6 F. This low capacitance will be denominated as C e 1 .
Analyzing the wells with medium and raw filter showed that also the model containing a CPE and n RC RC-circuits without further elements proved to be the most appropriate model. For up to 20% of all time points with n RC = 4, no valid parameter estimation was possible; therefore, it was decided to except n RC = 3 as the optimal number of RC-circuits for the whole time course. To compare the values of the capacities for the different measurement conditions, estimated capacities were sorted according to magnitude and the mean value of all time points was calculated. There was high equality for two of the capacities of medium only and medium with raw filter. Especially, the formerly mentioned C e 1 with the range of 10−9 F was in good accordance between the two measuring conditions. However, for C e 3 there was a discrepancy of one magnitude. That difference is not due to the missing RC-circuit. For some time points, even n RC = 4 could be estimated, and there C e 3 remained stable and C e 4 was again in good accordance to medium measurements (see Figure 2a). Therefore, this RC-circuit describes filter specific behavior.
Analyzing the wells with medium and cell-covered filter, the model probability indicated that again a CPE with n RC = 4 RC circuits is best for describing the data. As mentioned above, the range of the capacitance of the monolayer is well known from the literature; therefore, it can be separated via the prior. Comparing the filter describing capacitance C e 3 from the measurements of the raw filter and the cell-covered filter, one can see that there is quite a difference indicating that the cells have an influence on filter properties. This may be due to the migration of small cellular extensions into the filter pores (see Figure 2b). Thus, parameters extracted from measurements with only medium or medium and raw filter should not be used as direct references for those with cells.
The resulting TER showed the well-known concentration-dependent decrease after thrombin stimulation. The parameter estimation was robust and with small uncertainties (see Figure 3).
To further analyze and quantify the damage of the monolayer caused by high concentrations of thrombin or triton X-100, a model comparison was executed for a model of a CPE with n RC RC-circuits with or without the cell-specific RC-circuit, which can be strictly separated by the prior as explained above. After adding thrombin 2.0 U/mL, there is a high increase in the evidence of the cell-free models (with n RC = 3 to 5), but the cell model still remains with the highest evidence (see Figure 4a). When adding triton X-100, the evidence of a filter with n RC = 4 is much higher, resulting in a shift of model probabilities, indicating that there is no intact monolayer remaining, which has to be incorporated in the model (see Figure 4b).
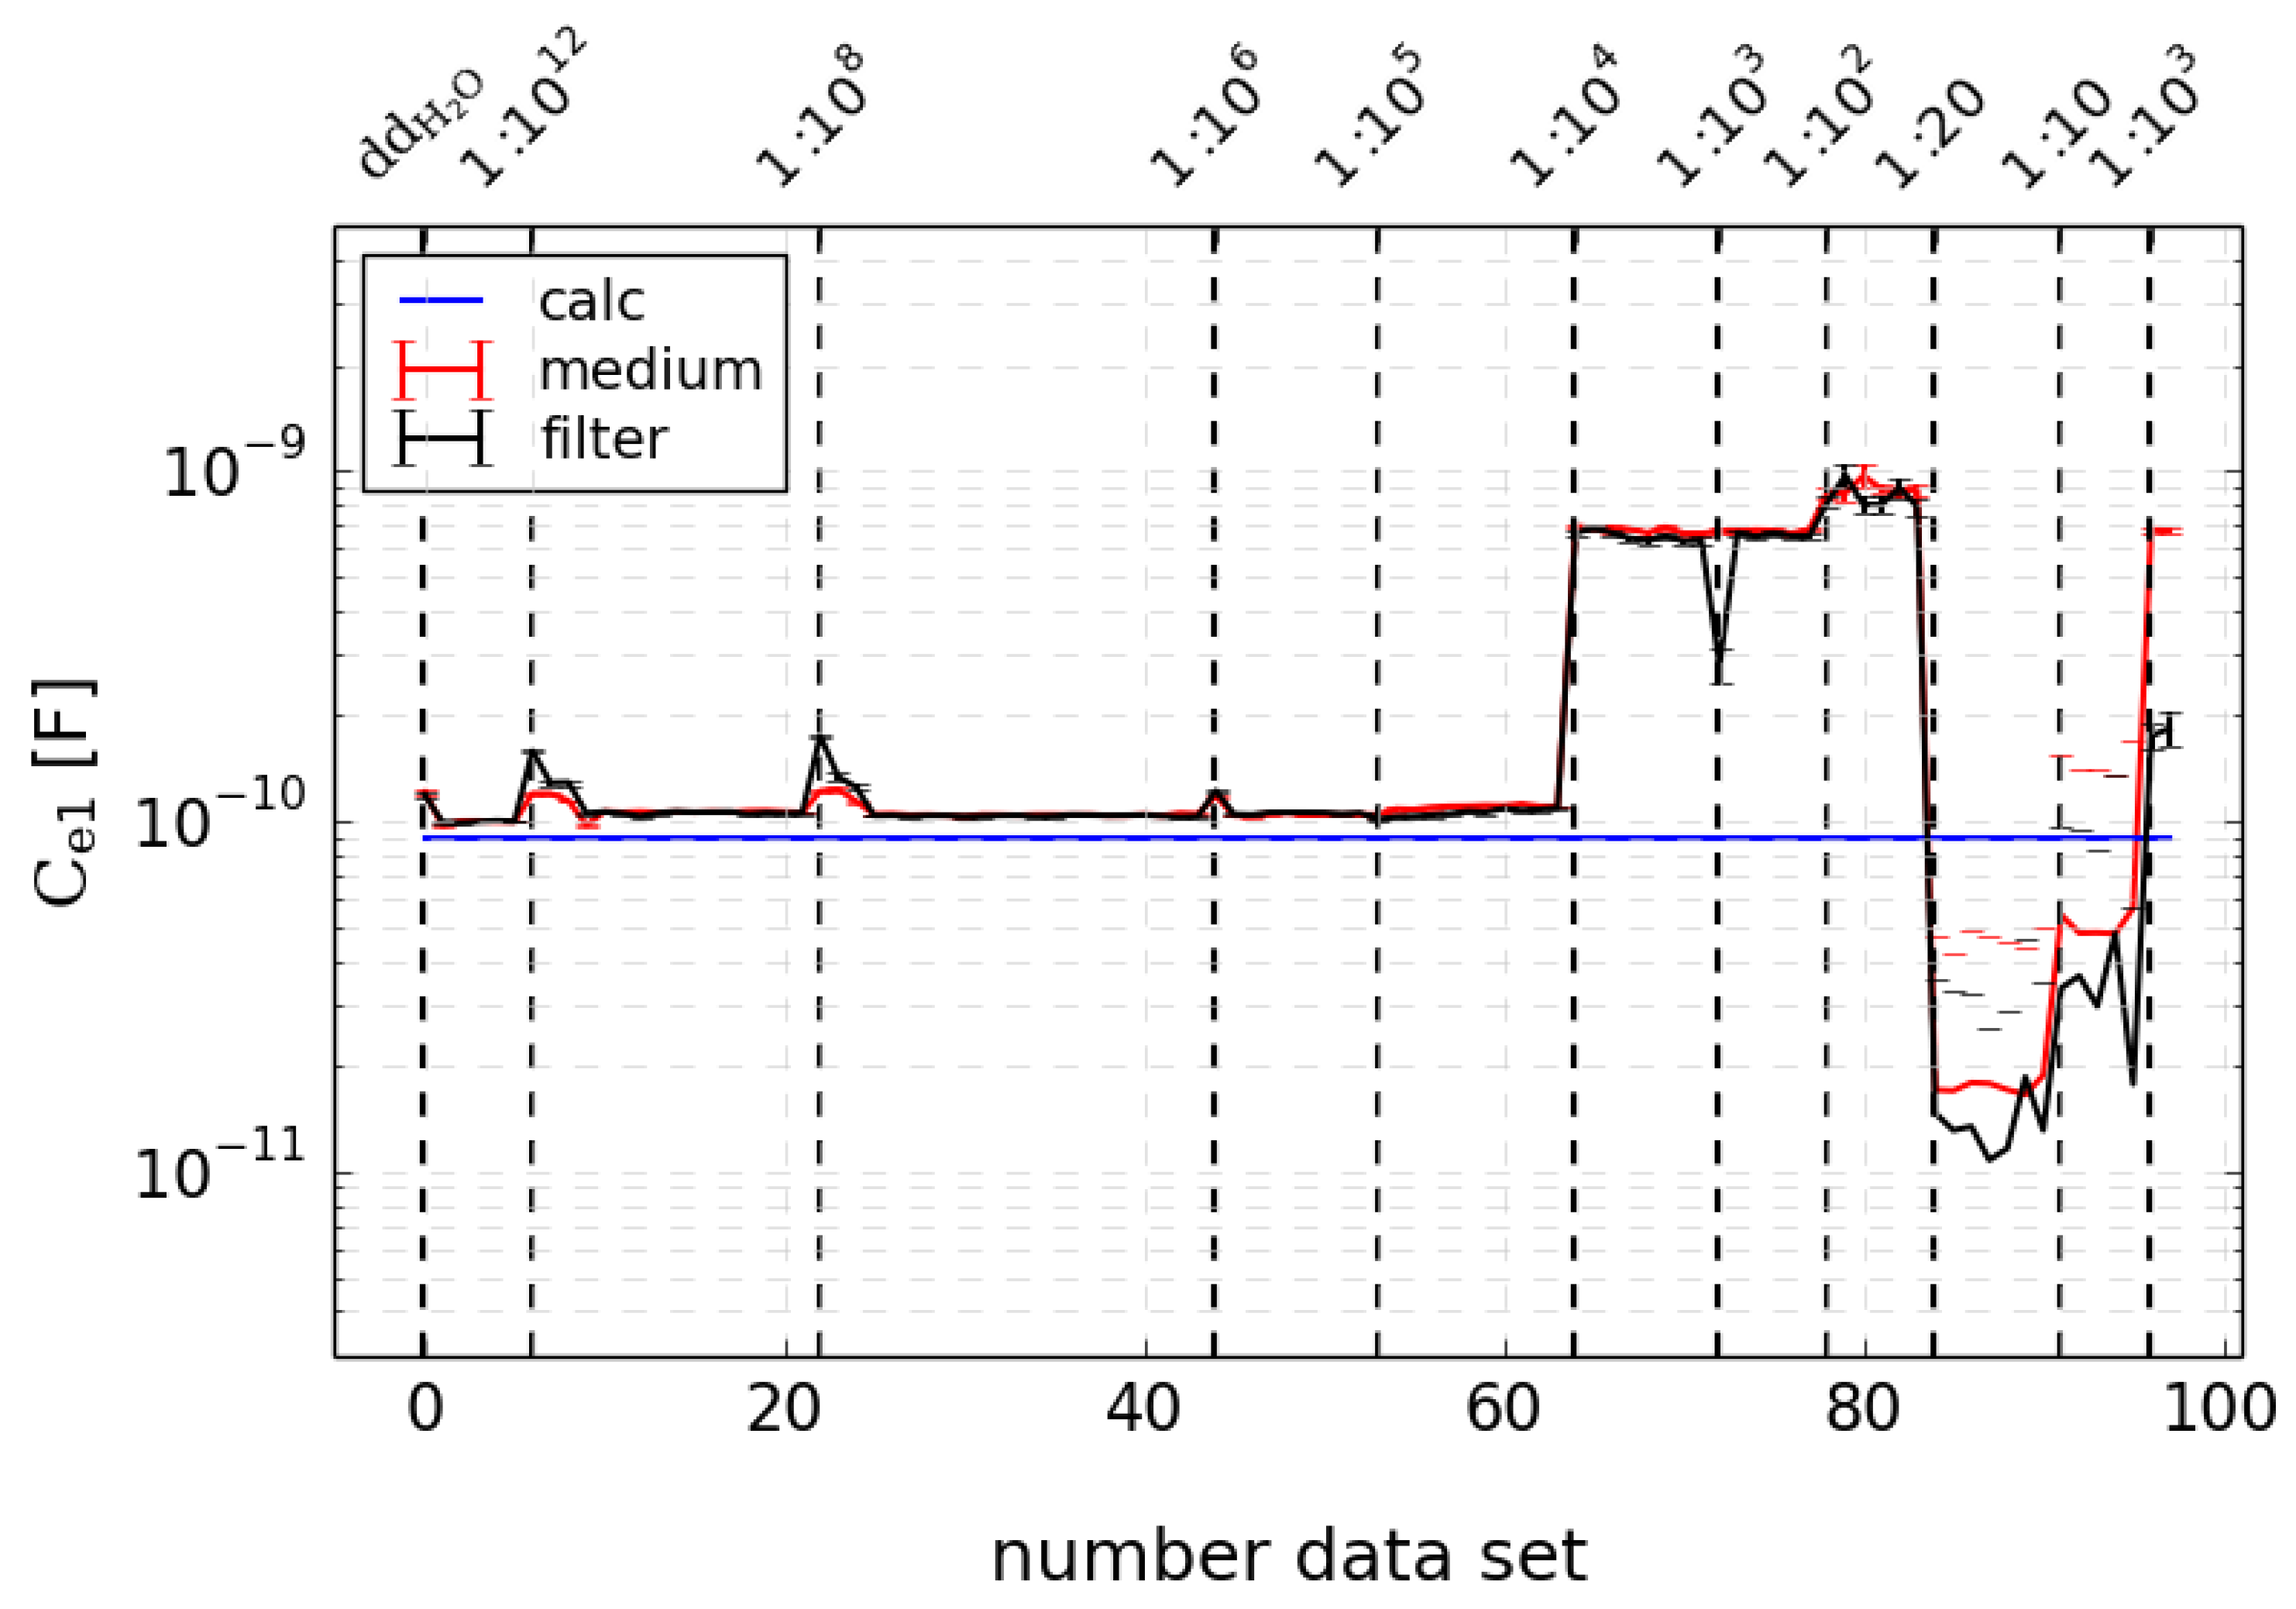
The measurements with sodium chloride and deionised water ( dd H 2 O ) were also analyzed with the model of a CPE and n RC RC-circuits. The analysis revealed the low capacitance C e 1 mentioned above, which also resulted in an equivalent range without dependency on sodium chloride concentration (see Figure 5). There is only a fluctuation of less than 1 magnitude for higher concentrations. The other capacities showed an interesting course with low values for low concentrations and an abrupt rise after a kind of edge concentration to magnitudes comparable to those estimated with cell medium (data not shown). Ref. [15] compared a circuit model of a series connection of a capacitance and an RC-circuit for a two-electrode setup with a dynamic density functional theory equivalent to the Nernst–Planck–Poisson theory of two sorts of ions in a fluid. The estimated parameters were compared to the equations of this simple model. There was good accordance of the magnitude of this low, concentration-independent capacitance, as illustrated with the blue line in Figure 5. This indicated that this is mainly determined by the setup properties like the distance and size of the electrodes. The slight divergence for higher concentrations may be due to additional correlation effects that were included in the theoretical model of [15].
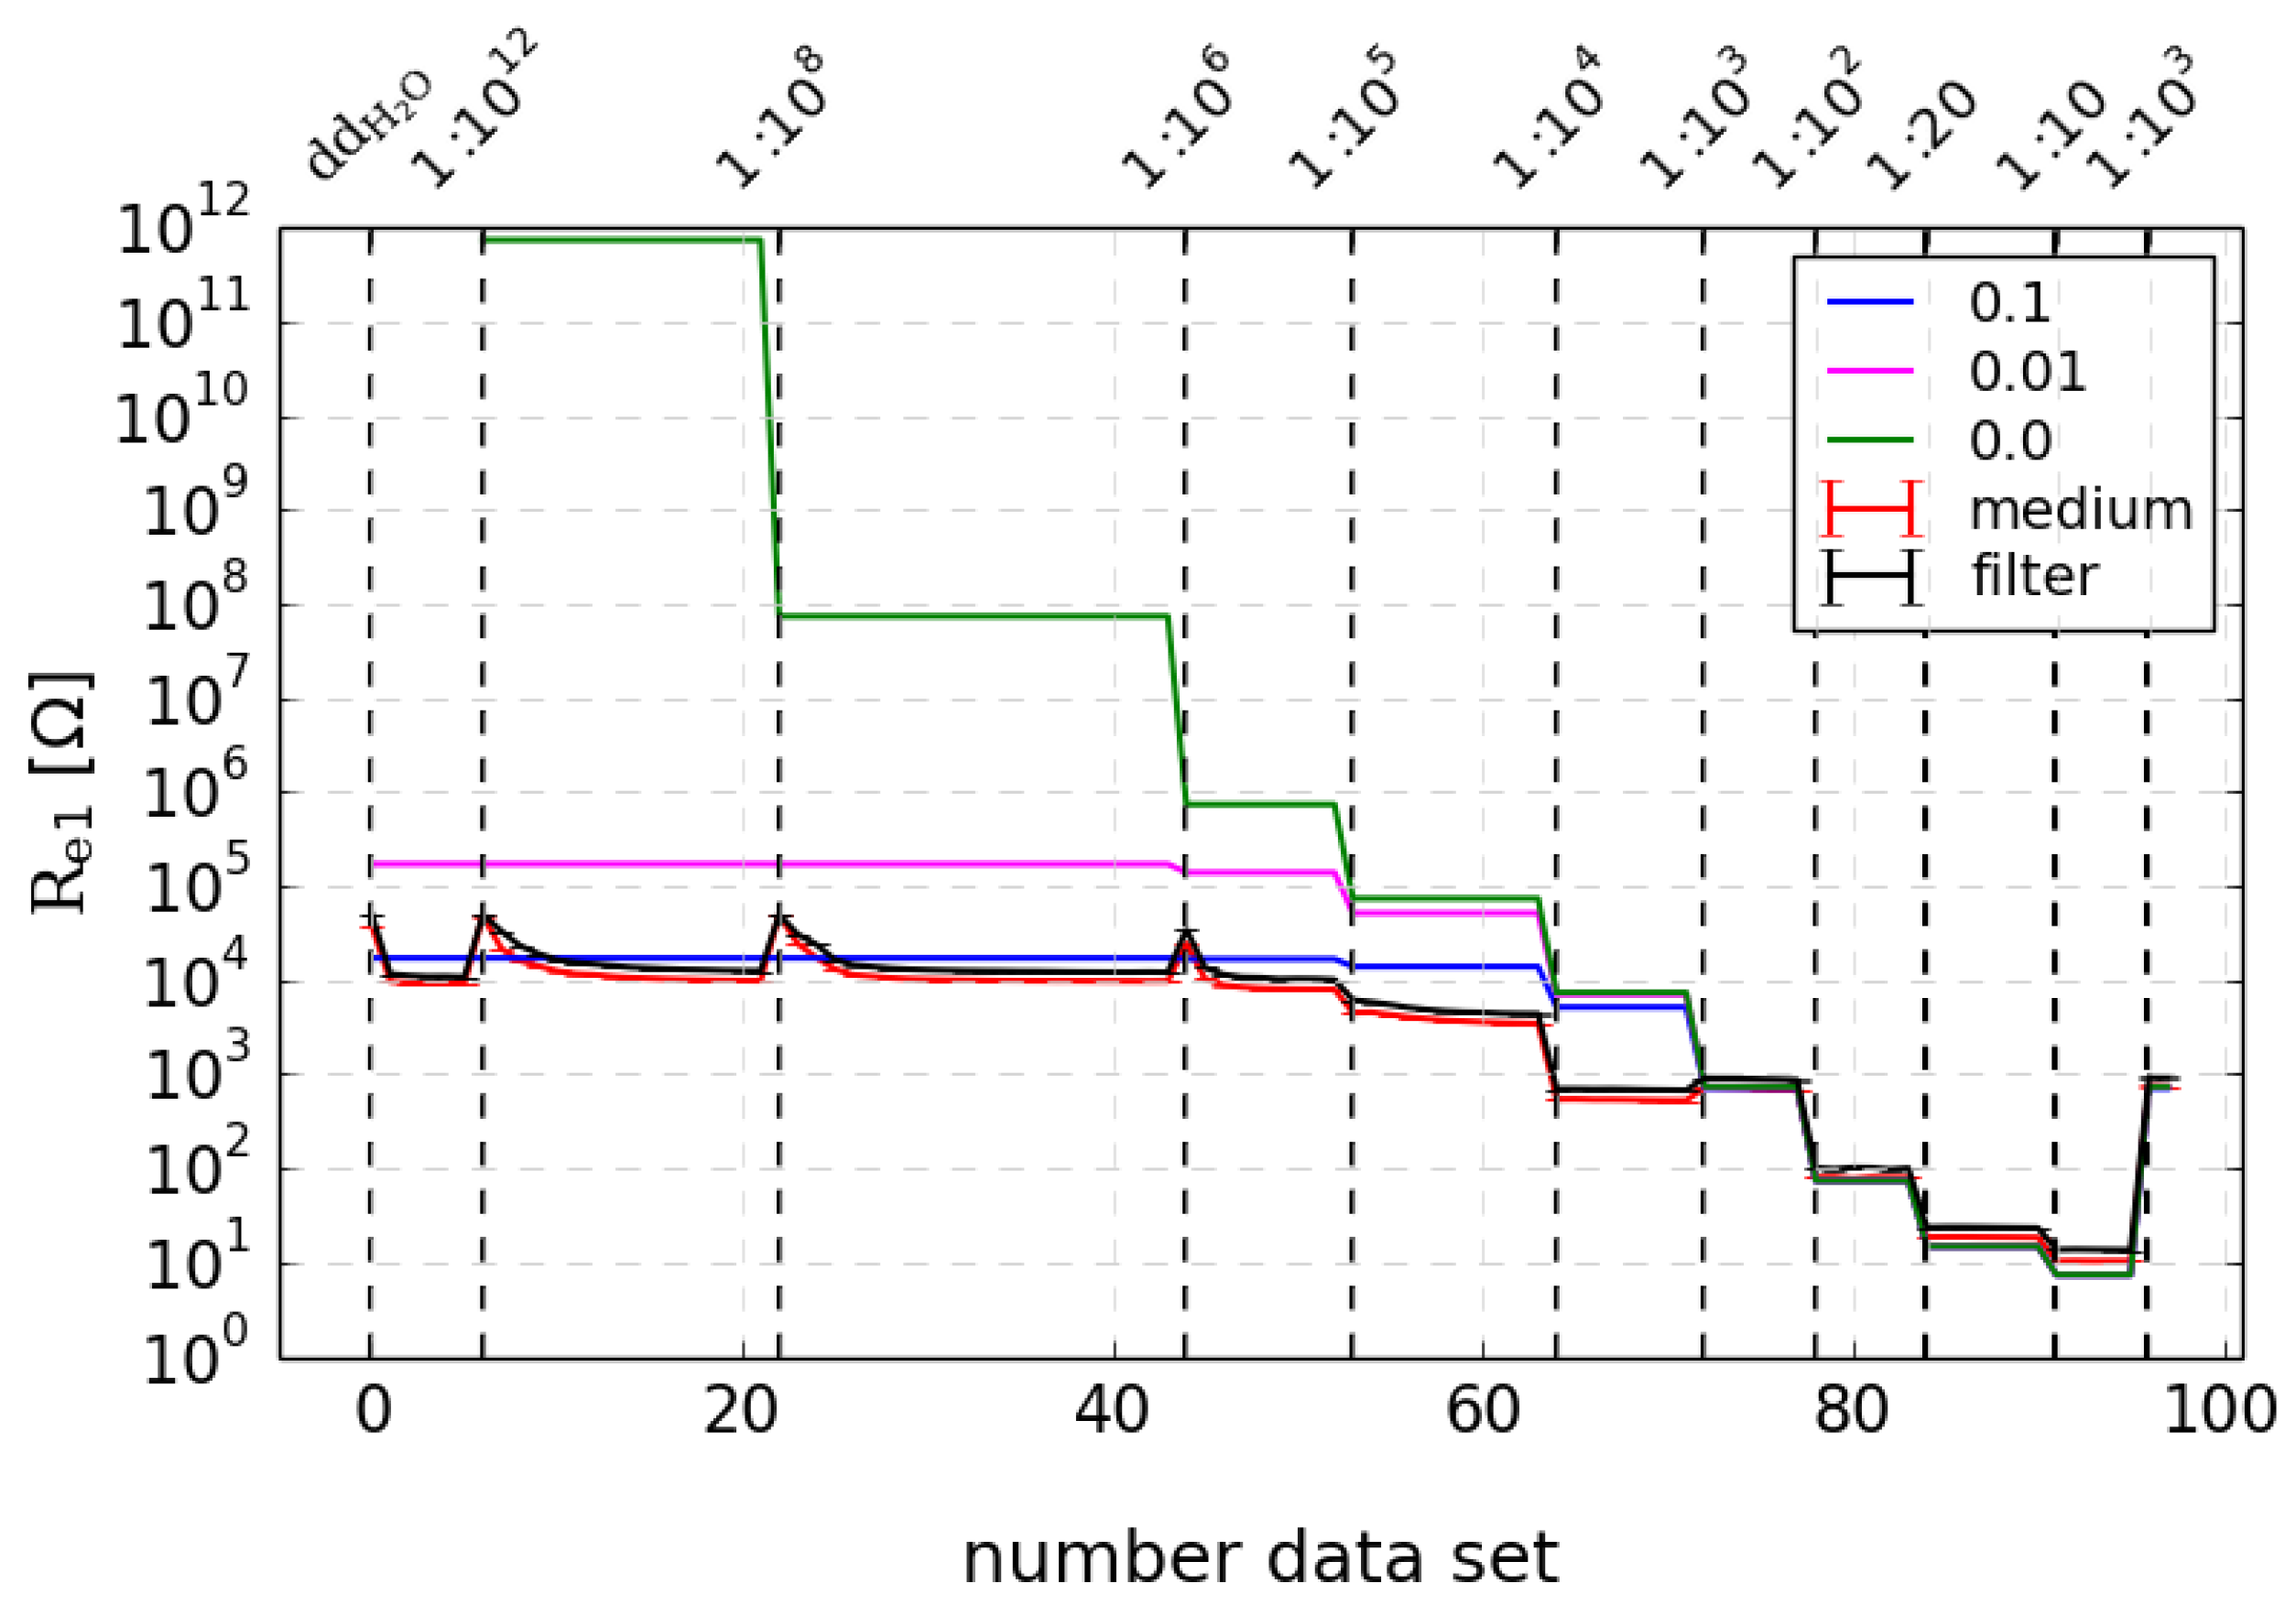
By contrast, the corresponding resistance is clearly concentration-dependent and also showed high similarity to the calculated values, especially for higher concentrations (Figure 6). This means that this resistance is determined mainly by the medium. Differences in low concentrations are probably due to the discrepancy of the theoretical assumed concentration of sodium chloride and real values since there was no control with additional measurements (like conductivity of the medium). Accordance was optimized through consideration of a factor for real sodium chloride concentration, as indicated in blue and red; the green line shows the calculated values without this factor.

4. Discussion

We have shown that Bayesian analysis is suitable for analyzing impedance spectroscopy data. By applying the MultiNested sampling algorithm to the extracted data of absolute value | Z | and phase Ph of the complex impedance, we could benefit from the easy handling of a commercial device and still enhance parameter estimation. The algorithm was verified extensively with self-simulated test data. Model replacement and extensions can be easily carried out. Here, models consisting basically of a CPE and various RC circuits extended with other elements have been analyzed. Regarding the model parameters, there was only limited prior knowledge, except for the RC circuit describing the cell monolayer. Implementing the Jeffreys prior even enabled us to analyze models with a higher number of parameters. That shows that the correct choice of priors is crucial for parameter estimation without distorting the results.
The model comparison indicated that the description of the medium, known from the literature as pure ohmic resistance, is inadequate. A model of a CPE and n RC = 4 RC-circuits had the best results. With further basic experiments with sodium chloride as the medium, it could be shown that the very low capacitance of one RC-circuit mainly depends on setup characteristics like electrode size, whereas the corresponding resistance depends on ion concentration. For the capacities of the RC-circuits, the course indicated that they are determined by ion concentration since they showed an abrupt rise after a border concentration. We suppose that this is due to the formation of thin ionic layers operating as capacitors. For low concentrations, the ionic layer is thicker and therefore capacitance is lower, and for concentrations above a definite border, this leads to a thinner ionic layer, resulting in higher capacitance. To further evaluate this, additional experiments with definite medium composition could be carried out.
Another important insight is that cells have an influence on filter properties. This might be due to cellular migration processes within the pores or again the formation of thin ionic layers between cells and filter. Therefore, filter parameters must be estimated via an adequate model for each measuring condition and should not be subtracted by reference measurements of medium with raw filter as carried out by the Cellzscope algorithm. Like for all setup elements, there is a high risk of incorrect determination of cell parameters if other elements like the cell medium are not respected properly.
The concentration-dependent course of TER after thrombin stimulation was estimated in agreement with literature data. The decrease in TER is discussed well in the literature and occurs due to cell contraction and intercellular gap formation. The parallel increase in cell capacitance is rarely discussed. We assume that there may be processes of vesicle formation and pinozytosis due to intracellular calcium rise, which can have an influence on cell capacitance. To verify this hypothesis, additional microscopic studies could be carried out.
A model comparison was used to characterize the influence of agents known to challenge endothelial barrier function. In our experiments, the highest used concentration of thrombin, which led to a decrease in TER of about 40%, still did not lead to a change of the model. Data still were described best with a model with a cell-specific RC-circuit and not with a filter-only model. However, after stimulation with triton X-100 there was a substantial change in model probability, indicating that there is no relevant intact monolayer anymore.
As a future prospect, this algorithm could also be used for more complex experimental setups of co-cultures like of endothelial and smooth muscle cells.

Author Contributions

Conceptualization, F.Z., T.N. and P.D.; methodology, F.Z. and P.D.; software, F.Z. and P.D.; validation, F.Z. and P.D.; formal analysis, F.Z.; investigation, F.Z., A.D. and F.V.H.; resources, F.Z., A.D., F.V.H., T.N. and P.D.; data curation, F.Z. and P.D.; writing—original draft preparation, F.Z.; writing—review and editing, T.N. and P.D.; visualization, F.Z.; supervision, T.N. and P.D.; and project administration, P.D. The manuscript contains parts of the doctoral thesis of F.Z. All authors have read and agreed to the published version of the manuscript.

Funding

This research received no external funding.

Institutional Review Board Statement

The study was conducted in accordance with the Declaration of Helsinki and approved by the Ethics Committee of the Medical Faculty Carl Gustav Carus of TU Dresden (permission EK 203112005).

Data Availability Statement

The raw data of this study are available on reasonable request from the corresponding author. Examples of Python programs for the application of nested sampling to Bayesian inference are found in the zenodo archive https://zenodo.org/record/6325568 ( accessed on 25 July 2023).

Acknowledgments

The authors are grateful to the Center for Information Services and High Performance Computing (Zentrum für Informationsdienste und Hochleistungsrechnen (ZIH)) at TU Dresden for providing its facilities for high-throughput calculations.

Conflicts of Interest

The authors declare no conflict of interest.

Abbreviations

The following abbreviations are used in this manuscript:
CPEconstant phase element
TERtransendothelial resistance
Rresistance
Ccapacitance
HUVEChuman umbilical vein endothelial cells
thrthrombin
dd H 2 O deionized water

References

  1. Thom, V.T.; Wendel, M.; Deussen, A. Regulation of Ecto-5’-Nucleotidase by Docosahexaenoic Acid in Human Endothelial Cells. Cell. Physiol. Biochem. 2013, 32, 355–366. [Google Scholar] [CrossRef] [PubMed]
  2. Khedr, S.; Deussen, A.; Kopaliani, I.; Zatschler, B.; Martin, M. Effects of tryptophan-containing peptides on angiotensin-converting enzyme activity and vessel tone ex vivo and in vivo. Eur. J. Nutr. 2018, 57, 907–915. [Google Scholar] [CrossRef] [PubMed]
  3. Lum, H.; Aschner, J.L.; Phillips, P.G.; Fletcher, P.W.; Malik, A.B. Time course of thrombin-induced increase in endothelial permeability: Relationship to Ca2+i and inositol polyphosphates. Am. J. Physiol. Lung Cell. Mol. Physiol. 1992, 263, L219–L225. [Google Scholar] [CrossRef] [PubMed]
  4. Rabiet, M.J.; Plantier, J.L.; Rival, Y.; Genoux, Y.; Lampugnani, M.G.; Dejana, E. Thrombin-Induced Increase in Endothelial Permeability Is Associated With Changes in Cell-to-Cell Junction Organization. Arterioscler. Thromb. Vasc. Biol. 1996, 16, 488–496. [Google Scholar] [CrossRef] [PubMed]
  5. Ehret, R.; Baumann, W.; Brischwein, M.; Schwinde, A.; Stegbauer, K.; Wolf, B. Monitoring of cellular behavior by impedance measurements on interdigitated electrode structures. Biosens. Bioelectron. 1997, 12, 29–41. [Google Scholar] [CrossRef] [PubMed]
  6. Feroz, F.; Hobson, M.P. Multimodal nested sampling: An efficient and robust alternative to Markov Chain Monte Carlo methods for astronomical data analyses. Mon. Not. R. Astron. Soc. 2008, 384, 449–463. [Google Scholar] [CrossRef]
  7. von Toussaint, U. Bayesian inference in physics. Rev. Mod. Phys. 2011, 83, 943–999. [Google Scholar] [CrossRef]
  8. Gregory, P. Bayesian Logical Data Analysis for the Physical Sciences: A Comparative Approach with Mathematica® Support; Cambridge University Press: Cambridge, UK, 2005. [Google Scholar] [CrossRef]
  9. Handley, W.; Hobson, M.; Lasenby, A. POLYCHORD: Next-generation nested sampling. Mon. Not. R. Astron. Soc. 2015, 453, 4384–4398. [Google Scholar] [CrossRef]
  10. Feroz, F.; Hobson, M.P.; Bridges, M. MultiNest: An efficient and robust Bayesian inference tool for cosmology and particle physics. Mon. Not. R. Astron. Soc. 2009, 398, 1601–1614. [Google Scholar] [CrossRef]
  11. Buchner, J.; Georgakakis, A.; Nandra, K.; Hsu, L.; Rangel, C.; Brightman, M.; Merloni, A.; Salvato, M.; Donley, J.; Kocevski, D. X-ray spectral modelling of the AGN obscuring region in the CDFS: Bayesian model selection and catalogue. Astron. Astrophys. 2014, 564, A125. [Google Scholar] [CrossRef]
  12. Wegener, J.; Seebach, J. Experimental tools to monitor the dynamics of endothelial barrier function: A survey of in vitro approaches. Cell Tissue Res. 2014, 355, 485–514. [Google Scholar] [CrossRef] [PubMed]
  13. Fricke, H. The Electric Capacity of Suspensions of Red Corpuscles of a Dog. Phys. Rev. 1925, 26, 682–687. [Google Scholar] [CrossRef]
  14. Wegener, J.; Sieber, M.; Galla, H.J. Impedance analysis of epithelial and endothelial cell monolayers cultured on gold surfaces. J. Biochem. Biophys. Methods 1996, 32, 151–170. [Google Scholar] [CrossRef] [PubMed]
  15. Reindl, A.; Bier, M. Impedance spectroscopy of ions at liquid-liquid interfaces. Phys. Rev. E 2013, 88, 052312. [Google Scholar] [CrossRef] [PubMed]
Figure 1. Scheme of the measurement setup: Isolated cells are cultivated on a filter and inserted in a so-called well, which is embedded in tissue medium. | Z | and Ph are measured via a two-electrode setup. The transendothelial resistance, T E R , as a quantity of endothelial barrier function, is determined by an equivalent circuit model. One typically used model consists of a constant phase element (CPE), describing the non-ideal capacity behavior of the electrode–electrolyte interface, an ohmic resistance for the medium, and an RC-circuit (in this case with R = TER and C = C Cell ) for the cell monolayer cultivated on the filter support.
Psf 09 00008 g001
Figure 2. Comparison of the mean of resulting capacities of the RC-circuits of different measurement conditions. Values of the bars have to be multiplied with the respective order of the magnitude indicated by the y-axis in (a) or the label of the y-axis in (b), respectively. (a) Resulting capacities of the RC-circuits for medium only and medium with filter. Medium only resulted in n RC = 4 (blue), whereas most of the data of medium and raw filter resulted in n RC = 3 (magenta) and only for some time points n RC = 4 (red). There was good accordance within parameter estimates of C e 1 and C e 2 , respectively, between the two measuring conditions. For C e 3 , a difference of about one magnitude is noticeable, which is stable for n RC = 3 and n RC = 4 . Hence, the divergent C e 3 is characteristic for the filter. (b) Comparison of the filter specific capacitance from measurements with raw filter and those with cell-covered filter stimulated with different concentrations of thrombin. This resulted in a stable difference, indicating that the cells have an influence on filter properties.
Psf 09 00008 g002
Figure 3. Time course of TER and C Cell after stimulation with different concentrations of thrombin. The model analysis (CPE and n RC = 4 RC-circuits) showed a concentration-dependent decrease in the TER. Magnitude and time needed for regeneration were also dependent of thrombin concentration. For all measured concentrations, the initial levels are reached within the observation time of 1.5 h . C Cell shows an inversely concentration-dependent increase after stimulation with thrombin.
Psf 09 00008 g003
Figure 4. Resulting evidence and model probability for a model with a cell-specific RC-circuit (grey) and a filter model with n RC = 3 to 5 RC-circuits (brown, green, and light blue) but without a cell-specific one. The dashed line indicates the addition of the stimulation agents (high concentration of thrombin or triton X-100) with disrupting effect on endothelial barrier function. (a) After adding high concentration of thrombin, there is a high rise of the evidence of the filter models (without the cell-specific RC-circuit), but the cell model (with the cell-specific RC-circuit) still remains as the one with the highest evidence. (b) After adding triton X-100, there is a shift in model probability to a cell-free model, indicating that the monolayer is not intact any more.
Psf 09 00008 g004
Figure 5. Comparison of estimated lowest capacitance C e 1 as a function of sodium chloride concentration of the medium (as a ratio of the 1 M stock solution) of a well with pure medium (red) and a well with medium and raw filter (black). The capacitance, which already attracted attention in the results of measurements with cell medium because of the really small magnitude, is independent of concentration of the medium and of the presence of a filter. It was compared to calculated values (blue) according to a model for a similar setup published by [15]. There is really high accordance in the magnitude and the concentration-independent course. As it can be seen by the equations in the cited publication, this capacitance mainly depends on setup criteria like electrode size and distance.
Psf 09 00008 g005
Figure 6. Course of the estimated resistance corresponding to the lowest capacitance as a function of sodium chloride concentration of the medium (as a ratio of the 1 M stock solution) of a well with pure medium (red) and a well with medium and raw filter (black). There is a clear dependence on concentration. Results are compared to calculated values according to a model for a similar setup published by [15], considering an extra factor for real concentration of sodium chloride (green, purple, and blue), which is presumptively underestimated due to basic experimental protocol. Especially with this factor there is really good congruence to the calculated values. The underlying equations show that this resistance is mainly determined by characteristics of the medium.
Psf 09 00008 g006
Disclaimer/Publisher’s Note: The statements, opinions and data contained in all publications are solely those of the individual author(s) and contributor(s) and not of MDPI and/or the editor(s). MDPI and/or the editor(s) disclaim responsibility for any injury to people or property resulting from any ideas, methods, instructions or products referred to in the content.

