Proceeding Paper

Results and Prospects of the Hellenic Open University Air Shower Array †

Physics Laboratory, School of Science and Technology, Hellenic Open University, 26222 Patras, Greece
*
Author to whom correspondence should be addressed.
Presented at the 2nd Electronic Conference on Universe, 16 February–2 March 2023; Available online: https://ecu2023.sciforum.net/.
Phys. Sci. Forum 2023, 7(1), 7; https://doi.org/10.3390/ECU2023-14015
Published: 15 February 2023
(This article belongs to the Proceedings of The 2nd Electronic Conference on Universe)

Abstract

:
Astroneu is an array of autonomous extensive air shower detection stations deployed at the Hellenic Open University (HOU) campus on the outskirts of Patras in Western Greece. In the first phase of operation, nine scintillators detectors and three radio frequency (RF) antennas have been installed and operated at the site. The detector units were arranged in three autonomous stations each consisting of three scintillator detectors (SDM) and one RF antenna. In the second phase of operation, three more antennas were deployed at one station in order to study the correlation of the RF signals from four antennas subject to the same shower event. In this report, we present the standard offline SDM-RF data and simulations analysis, the main research results concerning the reconstruction of the EAS parameters as well as the prospects of a new compact array that will be deployed by 2023.

1. Introduction

Cosmic rays, for more than a century after their discovery, continue to stimulate scientific interest since they are connected to the most energetic regions of the universe while questions concerning the nature and origin of ultra-high-energy ones remain still open. When a high energy cosmic ray (>103 TeV) enters the atmosphere, it will collide with the air nucleus creating a shower of secondary particles many of which reach the ground: this is called the extensive air shower (EAS). Due to the charge of the secondary particles during the evolution of the EAS, electromagnetic radiation is emitted both in the optical (fluorescence and Cherenkov light) and radio part of the spectrum. Apart from the established EAS detection techniques (particle detectors and optical telescopes) radio detection, which has been developed in the last twenty years, has gained scientific interest mainly because it is competitive with the others in reconstructing the cosmic ray parameters while the low-cost detectors (antennas) and the large duty cycle are among its advantages (see [1,2] for reviews).
As a result of the work that has been completed in the field of EAS radio detection, the main mechanisms involved in the radio frequency (RF) domain emission are now well understood and experimentally verified. The most powerful one related to the acceleration of EAS electrons and positrons from the geomagnetic field in a direction transverse to the EAS axis as first proposed by Kahn and Lerche [3]. A second mechanism, which under conditions can contribute up to 25% to the measured RF signal, comes from the excess of electrons in the EAS front. As suggested by Askaryan [4] the acceleration of the negative charge excess parallel to the EAS axis induces an electric field directed radially to the axis. As the two main mechanisms create electric fields of different directions, by analyzing the measured electric field on the ground, it is possible to highlight the contribution rate of each mechanism.
The Astroneu [5] is an array for hybrid EAS detection operating at the HOU campus since 2014. In the initial phase of operation (2014–2017), nine particle detectors and three RF antennas were installed and operated at the site. The particle detectors of each station are large scintillator counters (scintillator detector module—SDM), while the RF detectors are CODALEMA-type butterfly antennas [6,7]. An approximate equilateral triangle is formed by the SDMs in stations A and C, while station B forms an amblygonal triangle, offering the opportunity to study the efficiency and resolution of such geometry. The three detection stations are split up by a few hundred meters (170, 330, and 470 m), allowing the option for very high energy EAS detection by searching for coincidences between stations. In the second period (2017–2022) of Astroneu operation, three additional RF detectors were installed and operated in station A in order to examine the performance in estimating the EAS parameters using the RF signal, in a city environment with strong electromagnetic transients. The layout of the Astroneu array in both operation periods and details of the detector deployment is shown in Figure 1.
The rest of this report is organized as follows: In Section 2, we briefly describe the station’s architecture (including the electronics for data acquisition—DAQ and selection trigger) while the simulation framework and the offline analysis are reported in Section 3. In Section 4, results concerning the efficiency and resolution of the stations are presented as they emerged analyzing data and simulations from the first operation period. In Section 5, we emphasize the performance of the RF detectors using almost data from the second operation phase. For the end of Section 6, conclusions, comments, and discussion are drawn.

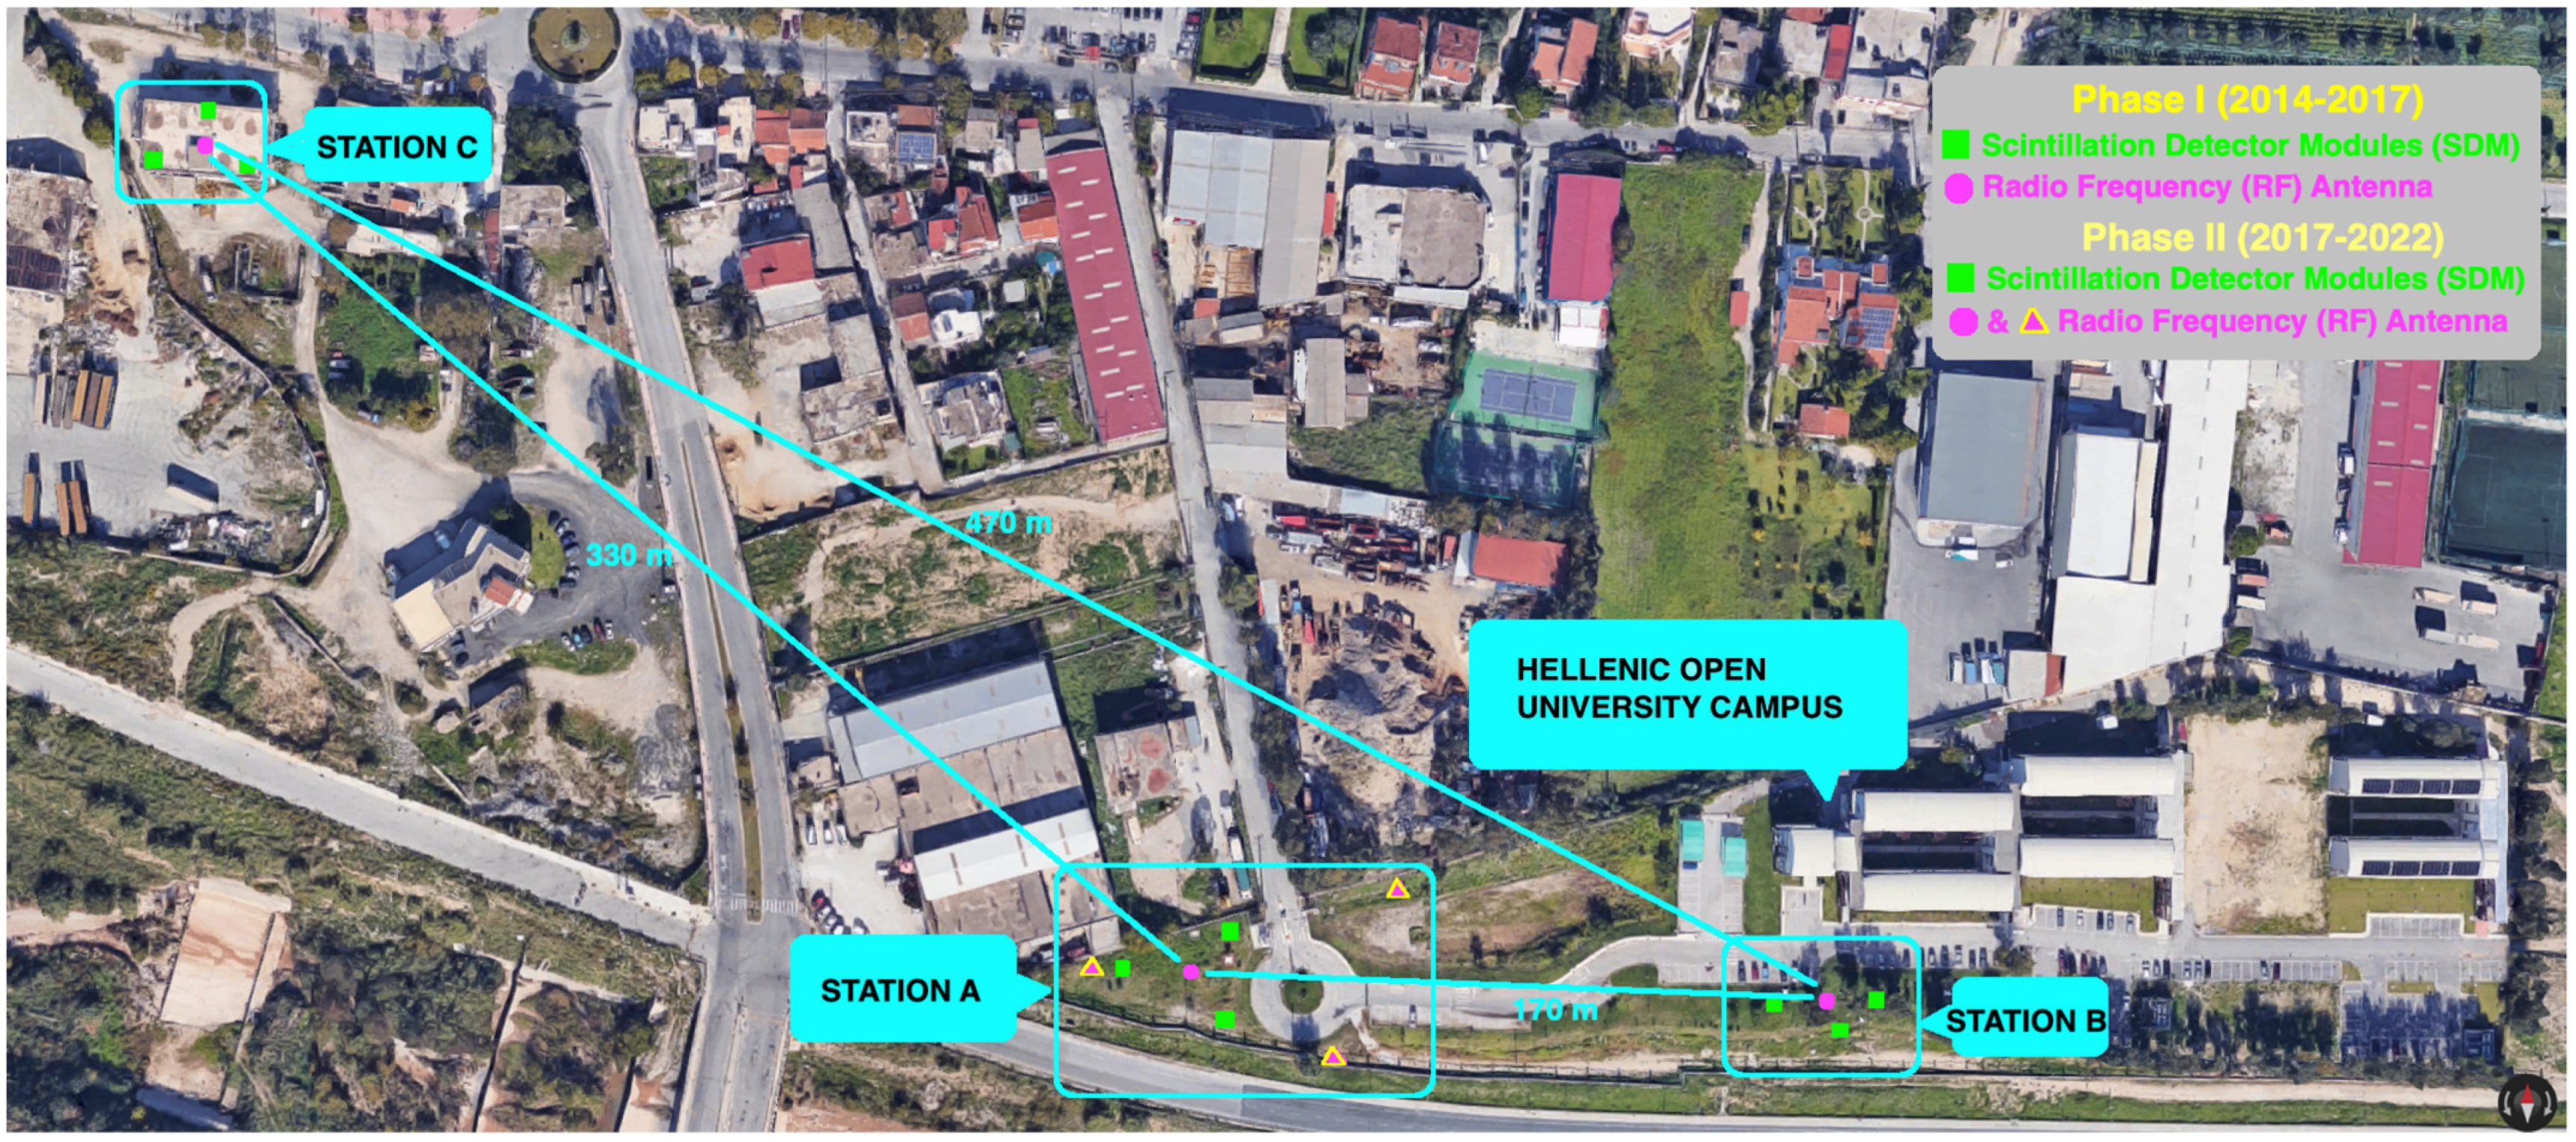
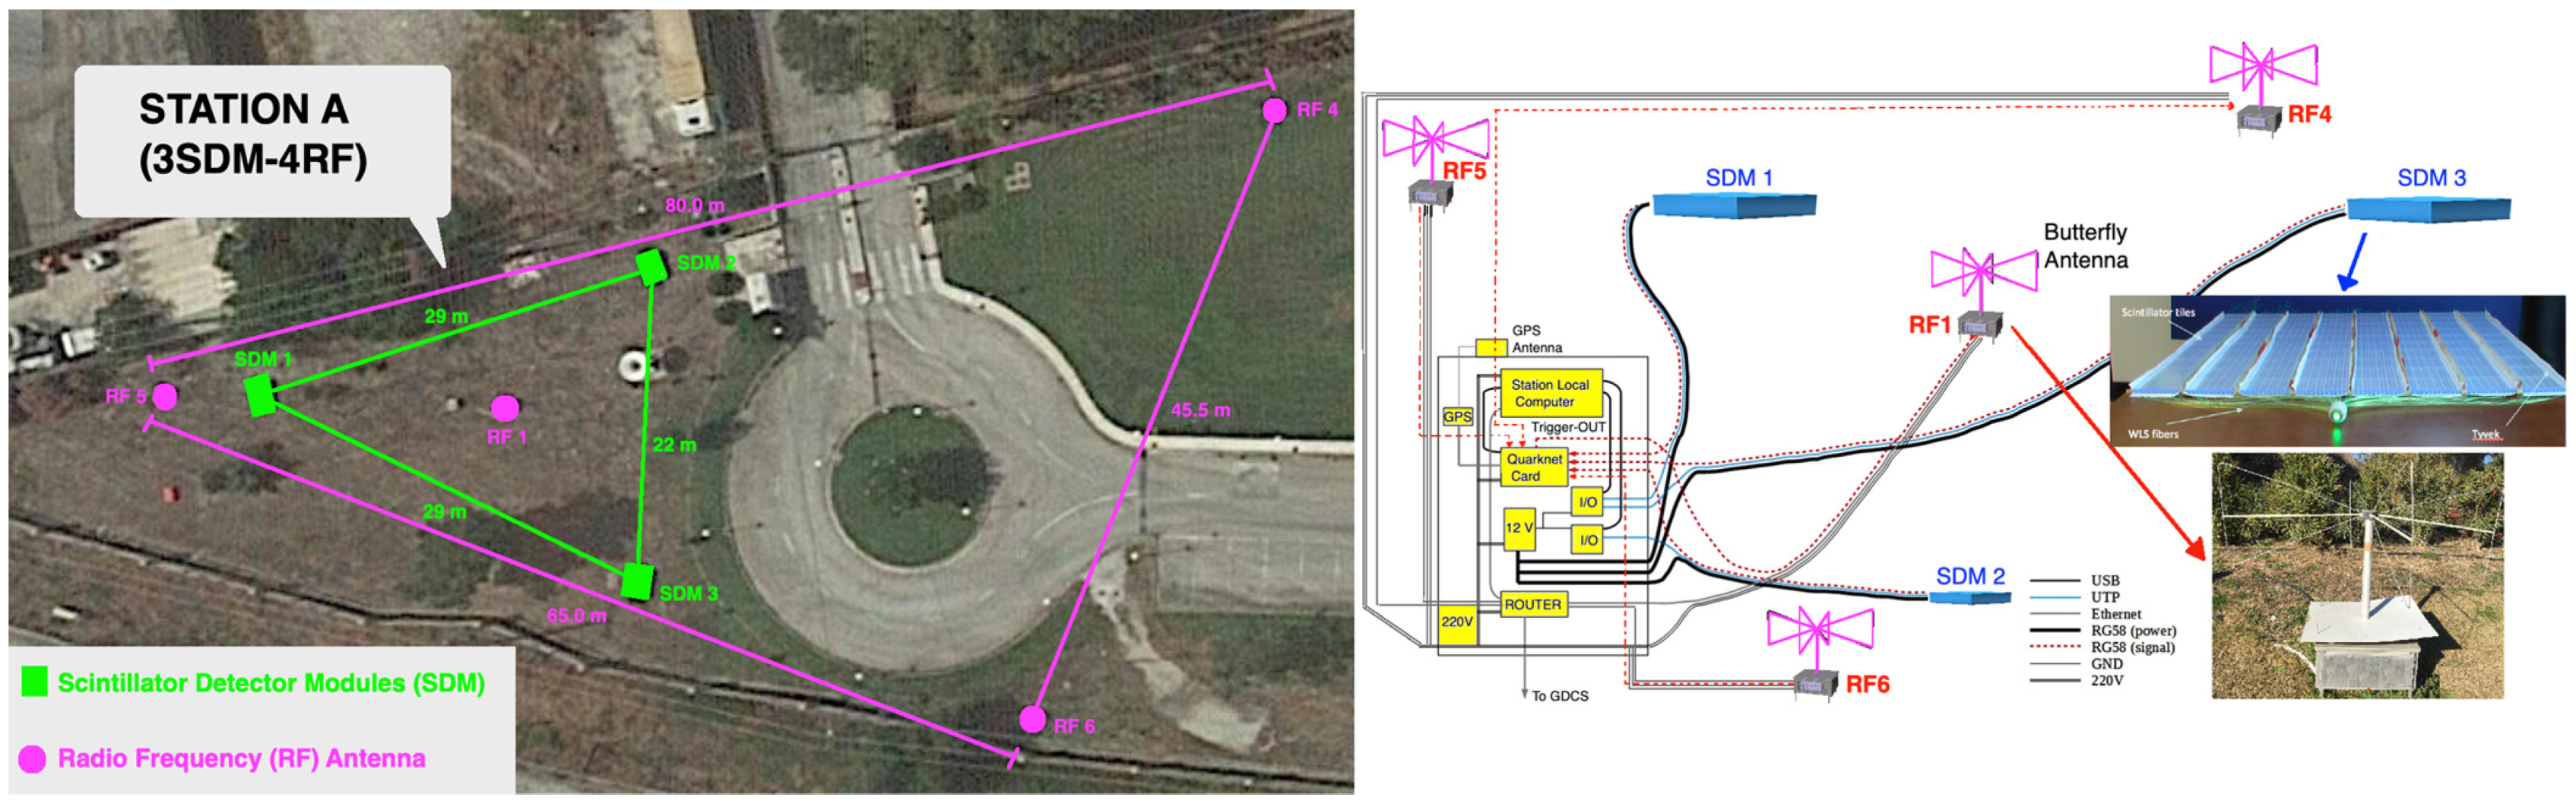
2. Station Architecture

Each station is equipped with its own independent DAQ system which comprises two individual units for the SDMs and RF detectors data [5]. The data from the SDMs are selected and digitized by the Quarknet board [8]. The data selection trigger relies on a three-fold coincidence of the SDMs signals, which overstep a default threshold of 9.7 mV; around twice the pulse height of a MIP (minimum ionizing particle). The time window for the coincidence is adapted to consider the inter-detector distances (typically 150 ns). Every time such a coincidence appears, the DAQ system generates a NIM pulse (Quarknet-OUT) that triggers the RF detectors (antennas) of the station. In the RF DAQ unit the detected signals, from both east–west and north–south polarizations, are amplified by a two-channel low noise amplifier (LNA) and then are driven to the antenna electronics. The RFA DAQ is triggered externally by the Quarknet-OUT signal. When a trigger signal is acquired the last 2560 sampled data from both polarizations are digitized and stored in dynamic memory. Both the Quarknet board and the RF DAQ unit are equipped with GPS cards to provide the appropriate timestamps for the recorded events. As described in [5] this time stamping allows for offline event selection related to EAS detected by more than one component of the array.
A detailed schematic representation of the connections between the independent SDM and RF DAQ units with the corresponding detectors of station A is shown in Figure 2 (right). Figure 2 (left) depicts the layout of station A as modified during the second operation period (3SDM-4RF).

3. Simulation Framework and Event Analysis

3.1. Simulation Framework
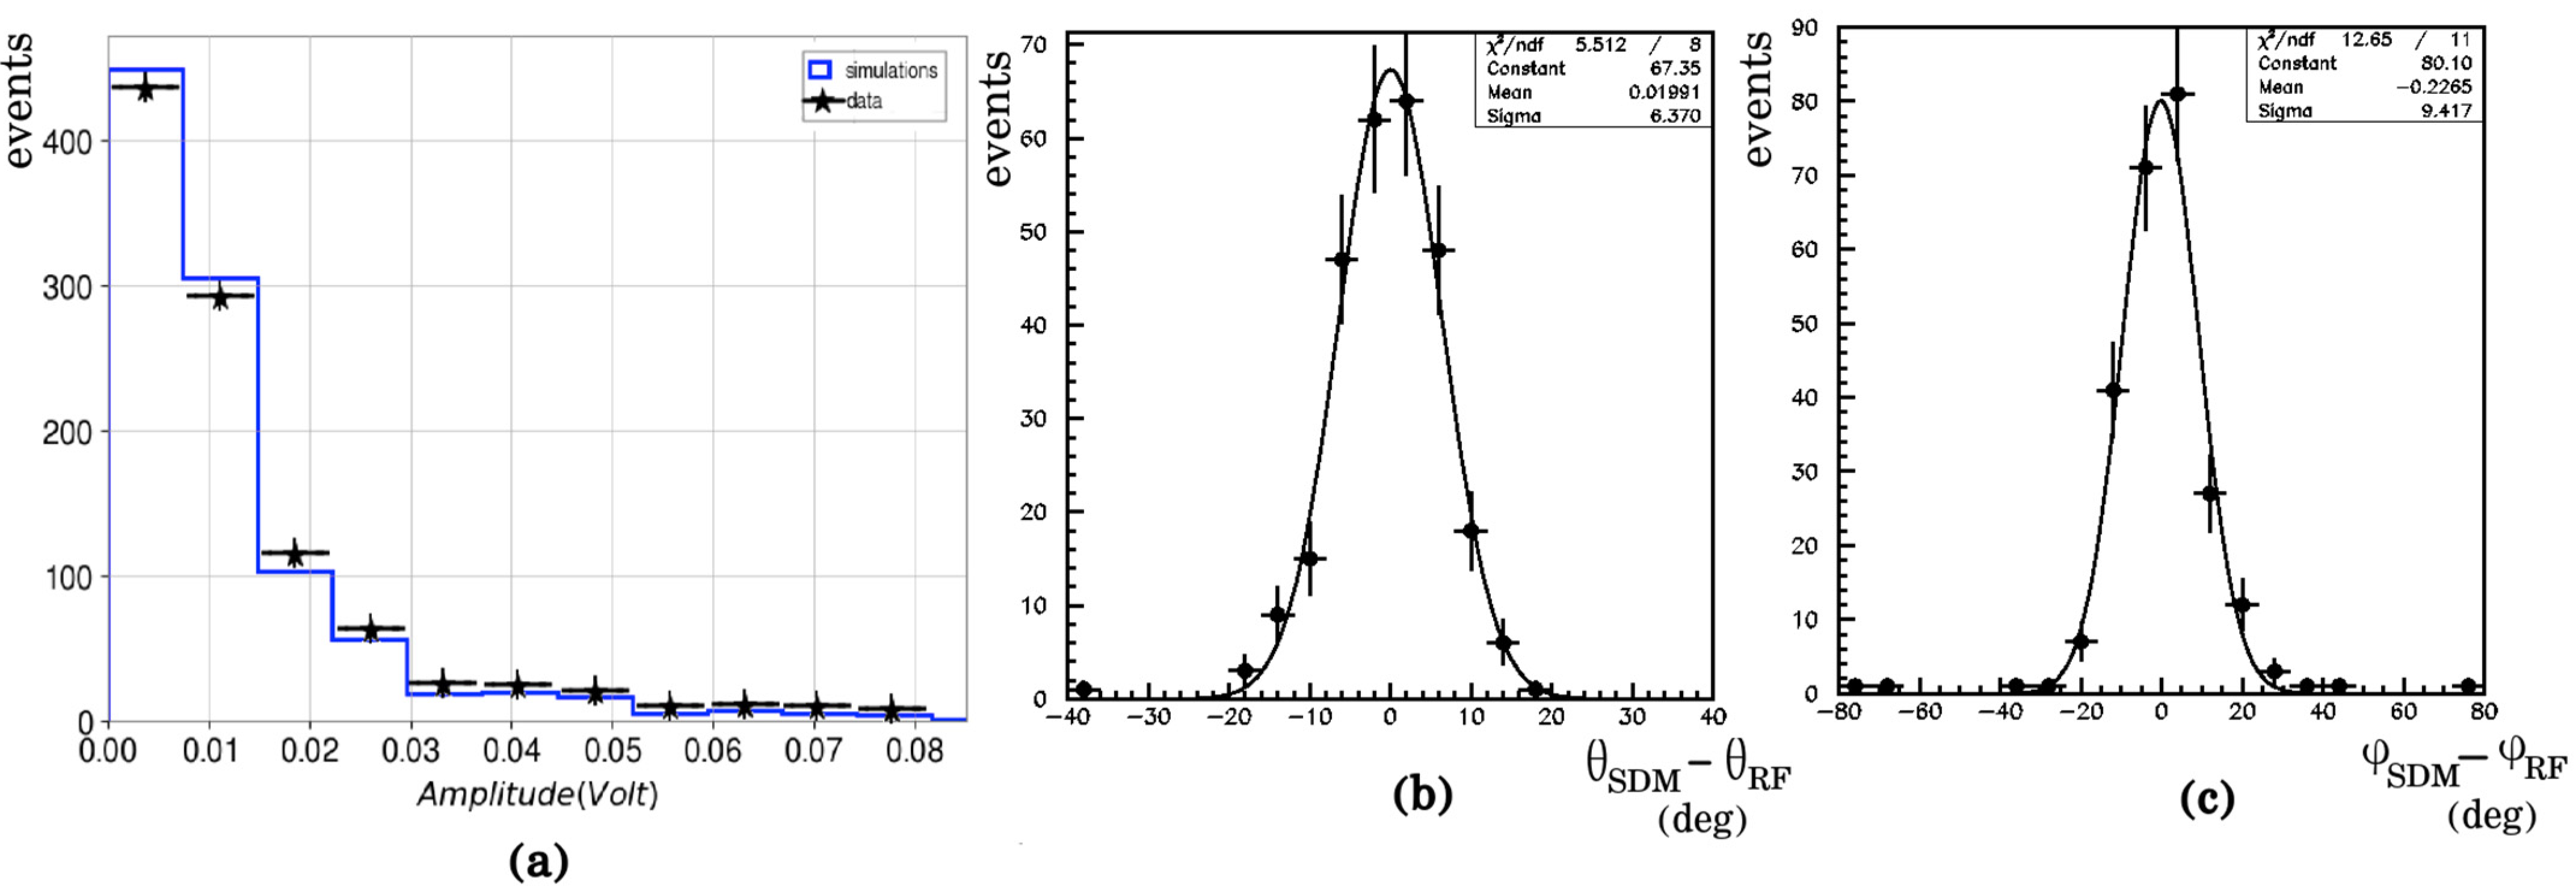
The simulation of the SDM signals induced by cosmic rays EAS is a two-step scheme; the first step deals with the phenomenology of the primary cosmic ray composition, direction, energy distribution, and EAS development in the atmosphere, while the second step is associated with the processes tangled in the experimental signal derivation. Especially, the CORSIKA [9] simulation code describes the evolution of the EAS, at the detector level. In the second step, the HOU Reconstruction and Simulation (HOURS) package [10] was applied to simulate the response of the SDMs to EAS particles [5].
For the RF signals simulation, the SELFAS package [11] is used, which calculates the electric field of the RF transient emitted during the EAS evolution in the atmosphere. The detector response to the RF radiation of an EAS is evaluated as the convolution of the electric field and the vector effective length (VEL) of the antenna. The VEL is determined in terms of the gain and structural features of the antenna using the NEC simulation code [12] as described in [13]. Finally, the RF signal is distorted by adding background human-made electromagnetic transients as measured around the station for a period of one year. The event selection algorithm described below was implemented in the simulation sample too.

3.2. Event Analysis

The event selection and reconstruction software [5] applies quality criteria to the experimental (or simulated) SDM data that reject noise, as well as merging algorithms that take care of artificially split pulses. In order to improve data quality, small width pulses (less than 15 ns) were rejected. An EAS is considered to be detected by a station in case all three SDMs of the station had valid pulses after the application of the above criteria. In the following, multiple station coincidences are formed by combining the signals of different stations when the absolute GPS timestamps of the stations fall within a time window of 1500 ns, which is wide enough even for horizontal showers.
The detected RF signals are analyzed as described in [13,14,15]. Initially, a filtering procedure rejects signal frequencies outside the region 30–80 MHz. In order to reject RF noise transients an event selection algorithm is applied based on the fact that RF signals produced by EAS: (a) should exhibit an intense peak localized in a narrow time interval, (b) they should be approximately linear polarized, and (c) they should have short rise times. The selected candidate events are further analyzed in order to quantify the RF noise contribution to each antenna waveform, quantify the sharpness of the signal, and estimate the degree of polarization.

4. Results Established in Phase I

The data collected during the first operation period (more than 3 years) were used to evaluate the performance of the Astroneu array in detecting and reconstructing EAS using the SDMs [5], while the RF component of the EAS was successfully isolated (despite the powerful background) and studied using noise filters, timing, and signal polarization [14]. Furthermore, we extend the analysis of the RF signals by correlating the timing and the strength of the RF signals with the SDM data and by comparing them with the simulation predictions [15]. The evaluated performance parameters of the Astroneu stations are summarized in Table 1. The resolution (the resolution in estimating the zenith or azimuth angle of the primary particle is defined as the square root of the variance of the difference between the true angle of the EAS primary particle and the respective reconstructed angle of the EAS using the simulated events) in reconstructing the zenith angle (σθ), the azimuth angle (σφ), the 3D reconstruction error (ω) (the 3D error in estimating the direction of the primary particle was defined as the median of the distribution of the 3D angle between the primary particle direction (the one used in the simulation input) and the reconstructed direction), as well as the energy threshold (Eth) for an EAS to be reconstructed, have been estimated by the simulation study.
The performance of each station depends mainly on the geometrical layout. For example, for station B where the three SDMs form an amblygonal triangle the event rate is lower (compared with the others) while the corresponding resolutions in reconstructing the zenith, and azimuth angles as well as the 3D reconstruction error are worsened. Although in stations A and C the three SDMs form an almost equilateral triangle, a better resolution appears in station A since the distances between the SDMs are slightly larger. The performance results of stations A and B coincidently comprise an event rate of 0.15 per hour while the resolution in reconstructing the zenith angle is 3.6 degrees, in azimuth 9.5 degrees, the 3D reconstruction error is about 2.9 degrees and the energy threshold 5 × 10 3 TeV.

5. Results Established in Phase II

Figure 3a shows the distribution of the RF signal amplitudes for experimental data (black points) and simulations. The data were collected from station A (with four RF detectors) during the second operation period.
A new method for reconstructing the direction of the shower axis has been developed [13]. The shape of the RF spectrum is sensitive to the pulse frequency and to the pulse direction. This method is based on the comparison of the event spectrum with a database of simulations spectrums from different showers directions. The resolution (defined as explained in Section 4) of the method have been estimated using simulations in 2.22 degrees in zenith and 5.43 degrees in azimuth angle. Furthermore, the EAS axis directions can be also reconstructed using the detectors positions (both SDMs and RF) and the arrival time of the pulses in each detector, through triangulation [16]. In order to compare the EAS axis direction as evaluated from RF data with the corresponding ones estimated with SDM data we use the standard deviation of the gaussian function that fits the distributions Δ θ = θ R F θ S D M for the zenith angle and Δ φ = φ R F φ S D M for the azimuth angle. The corresponding distributions are shown in Figure 3b and Figure 3c, respectively. The corresponding sigma is equal to 6.4 degrees for the zenith angle and 9.4 degrees for the azimuth angle.
In order to correlate the effect of the station geometry to the resolution of the EAS axis reconstruction, four combinations of three RF detectors were used (see Figure 1). The reconstruction was performed using the RF timing method and the corresponding resolutions for an equilateral formation are 3.0 degrees for the zenith angle and 5.0 degrees for the azimuth angle while for an amblygonal are 3.6 degrees for the zenith angle and approximately 6.0 degrees for the azimuth angle.
The position of the shower core can be estimated using the RF signal and simulations with a resolution of about 20 m for both the x and y coordinate [16]. Using the shower core position and analyzing the measured electric field on the ground in the directions expected considering the two main mechanisms (geomagnetic and charge excess contributions), the contribution rate of each mechanism is estimated ( a = E c h E g e o 100 % ) for different zenith angle (θ) and core positions (d) as summarized in Table 2 [16].

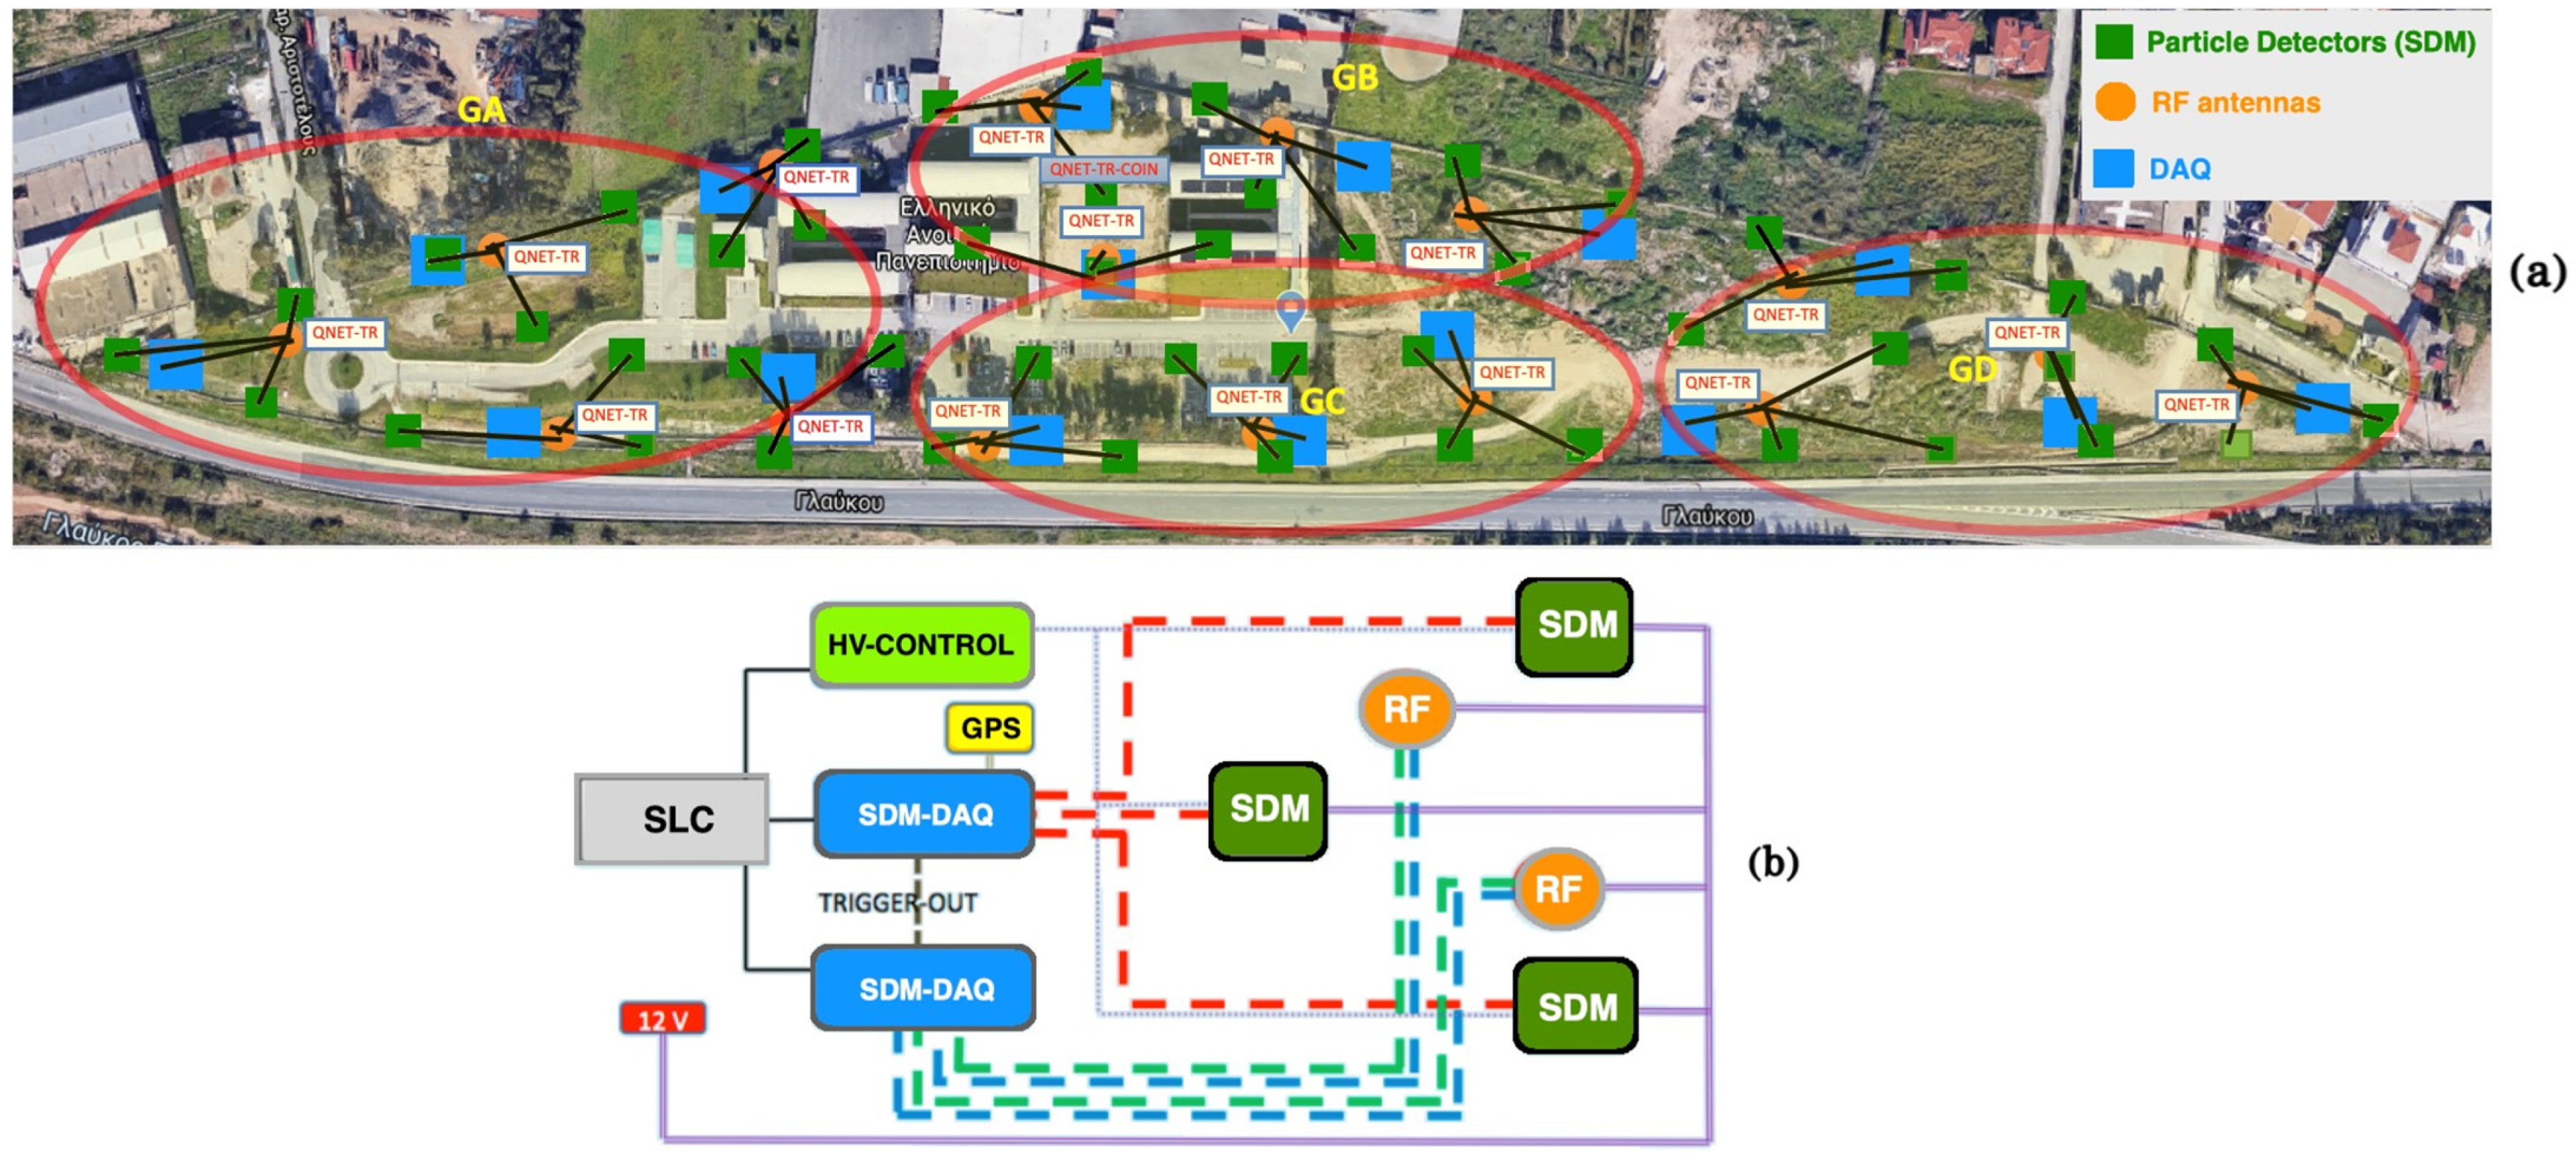
6. Prospects for the Expansion of Astroneu Array

The planned expansion of the Astroneu array on the HOU campus will consist of 16 stations, each comprising low-cost small SDMs and RF antennas developed by the HOU Physics Laboratory [17]. Each station is expected to be equipped with three SDMs and two (or more) RF antennas (in short, the 3SDM-2RF station) provided with the appropriate electronics for independent DAQ. Figure 4 right shows the station setup while the left picture depicts the layout of the stations on the HOU campus. It is expected that the new setup will start operating in 2023.

7. Discussion

Extended simulation studies and data analysis from the first operation period shows that the developed Astroneu array has a well-known response to EAS, while RF EAS detection in environments with strong electromagnetic noise is possible even with small-scale hybrid (particle + RF detection) arrays. The data collected during the second operation period allowed us to study the correlation between RF signals corresponding to the same EAS. Among the studies of this period, the estimation of the EAS axis direction using the RF spectrum, the reconstruction of the shower core using the RF signal and simulations, and charge excess-to-geomagnetic ratio measurements are included. Finally, we report prospects to expand the Astroneu array with more particle detectors and RF antennas for more accurate reconstruction of the main EAS parameters and extended RF studies. Among the prospects is to study the possibility of an RF-only self-triggered detector array in an EM noisy urban environment (efficient new methods for noise rejection).

Author Contributions

Data curation, A.L., S.N., and A.T.; formal analysis, S.N., A.T., A.L., and S.N.; investigation, A.L., S.N., and A.T.; methodology, S.N., A.T., and A.L.; project administration, A.L.; software, A.L., S.N., and A.T.; supervision, A.L.; writing—original draft, S.N. All authors have read and agreed to the published version of the manuscript.

Funding

This research was funded by the Hellenic Open University Grant No. ΦK 228: “Development of technological applications and experimental methods in Particle and Astroparticle Physics”.

Institutional Review Board Statement

Not applicable.

Informed Consent Statement

Not applicable.

Data Availability Statement

https://physicslab.eap.gr (accessed on 14 February 2023).

Conflicts of Interest

The authors declare no conflict of interest.

References

  1. Huege, T. Radio detection of cosmic ray air showers in the digital era. Phys. Rep. 2016, 620, 1–52. [Google Scholar] [CrossRef]
  2. Schröder, F.G. Radio detection of cosmic-ray air showers and high-energy neutrinos. Prog. Part. Nucl. Phys. 2017, 93, 1–68. [Google Scholar] [CrossRef]
  3. Kahn, F.D.; Lerche, I. Radiation from Cosmic Ray Air Showers. Proc. Math. Phys. Eng. Sci. 1966, 289, 206–213. [Google Scholar]
  4. Askaryan, G.A. Coherent radio emission from cosmic showers in air and in dense media. Sov. Phys. JETP Lett. 1965, 21, 658. [Google Scholar]
  5. Avgitas, T.; Bourlis, G.; Fanourakis, G.K.; Gkialas, I.; Leisos, A.; Manthos, I.; Tsirigotis, A.G.; Tzamarias, S.E. The Astroneu Extensive Air Shower array. JINST 2020, 15, T03003. [Google Scholar] [CrossRef]
  6. Ardouin, D.; Bellétoile, A.; Charrier, D.; Dallier, R.; Denis, L.; Eschstruth, P.; Ravel, O. Radio-detection signature of high-energy cosmic rays by the CODALEMA experiment. Nucl. Instrum. Methods A 2005, 555, 148–163. [Google Scholar] [CrossRef]
  7. Charrier, D. Antenna development for astroparticle and radioastronomy experiments. Nucl. Instrum. Methods Phys. Res. Sect. A 2012, 662, 142–145. [Google Scholar] [CrossRef]
  8. Hansen, S.; Jordan, T.; Kiper, T.; Claes, D.; Snow, G.; Berns, H.; Burnett, T.H.; Gran, R.; Wilkes, R.J. Low-cost data acquisition card for school-network cosmic ray detectors. IEEE Trans. Nucl. Sci. 2004, 51, 926–930. [Google Scholar] [CrossRef]
  9. Heck, D.; Knapp, J.; Capdevielle, J.N.; Schatz, G.; Thouw, T. CORSIKA: A Monte Carlo Code to Simulate Extensive Air Showers. Forsch. Karlsr. Rep. FZKA 1998, 6019. Available online: https://digbib.bibliothek.kit.edu/volltexte/fzk/6019/6019.pdf (accessed on 23 February 2023).
  10. Tsirigotis, A.G.; Leisos, A.; Tzamarias, S.E. HOU Reconstruction & Simulation (HOURS). Nucl. Instrum. Methods Phys. Res. Sect. A 2011, 626, 185–187. [Google Scholar]
  11. Marin, V.; Revenu, B. Simulation of radio emission from cosmic ray air shower with SELFAS2. Astropart. Phys. 2012, 35, 733–741. [Google Scholar] [CrossRef]
  12. Burke, G.; Poggio, A. Numerical Electromagnetics Code (NEC) Method of Moments, Parts I, II, III; Lawrence Livermore National Laboratory: Livermore, CA, USA, 1983; pp. 89–223. [Google Scholar]
  13. Nonis, S.; Leisos, A.; Tsirigotis, A.G.; Bourlis, G.; Papageorgiou, K.; Gkialas, I.; Manthos, I.; Tzamarias, S.E. Angular reconstruction of high energy air showers using the radio signal spectrum. Phys. Scr. 2020, 95, 084007. [Google Scholar] [CrossRef]
  14. Manthos, I.; Bourlis, G.; Gkialas, I.; Leisos, A.; Papaikonomou, A.; Tsirigotis, A.G.; Tzamarias, S.E. Cosmic Ray RF detection with the Astroneu array. New Astron. 2020, 81, 101443. [Google Scholar] [CrossRef]
  15. Leisos, A.; Nonis, S.; Tsirigotis, A.G.; Bourlis, G.; Papageorgiou, K.; Gkialas, I.; Manthos, I.; Tzamarias, S.E. Hybrid Detection of High Energy Showers in Urban Environments. Universe 2019, 5, 3. [Google Scholar] [CrossRef]
  16. Nonis, S.; Leisos, A.; Tsirigotis, A.G.; Bourlis, G.; Papageorgiou, K.; Gkialas, I.; Manthos, I.; Tzamarias, S.E. Performance of the RF detectors of the Astroneu Array. Universe 2023, 9, 17. [Google Scholar] [CrossRef]
  17. Tsirigotis, A.G.; Leisos, A.; Nonis, S.; Petropoulos, M.; Georgis, G.; Papageorgiou, K.; Gkialas, I.; Manthos, I.; Tzamarias, S.E. A low cost hybrid detection system of high energy air showers. Eng. Res. Express. 2020, 2, 025027. [Google Scholar] [CrossRef]
Figure 1. The Astroneu array during its two phases of operation installed at the HOU campus. The positions of the SDMs are marked with green squares, while the positions of the RF antennas with magenta circles. The triangles represent the 3 additional RF detectors installed in station A during the second phase of operation.
Psf 07 00007 g001
Figure 2. (Left) Station A of the Astroneu array as it was configured with 3 SDM (green squares) and 4 RF detectors (magenta circles), during the second operation phase. (Right) The schematic illustration of the connections between the station’s independent DAQ units. The inset photos depict the SDM (top photo) and the RF antenna (bottom photo).
Psf 07 00007 g002
Figure 3. (a) The distributions of the pulses amplitudes for the 4 antennas of station A, for data (black stars) and simulations (histograms). (b) The distribution of θSDM−θRF between the zenith angle estimated using the SDM timing and the corresponding angle estimated using the RF spectrum. The distribution is fitted with Gaussian function of sigma equal to 6.4 degrees. (c) The same as (b) for the azimuth angle. The distribution is fitted with Gaussian function of sigma equal to 9.4 degrees.
Psf 07 00007 g003
Figure 4. (a) The Astroneu array expansion, which is expected to consist of 16 stations, each of which will contain 3 SDM and 2 (or more) RF detectors, at the HOU campus. (b) The schematic illustration of the connections between the station’s units.
Psf 07 00007 g004
Table 1. Parameters describing the performance of the Astroneu stations at single mode of operation based on SDM data. The numbers in parenthesis denote the simulation predictions.
StationEAS Reconstruction Rate (h−1)σθ (deg)σφ (deg)ω (deg)Eth (TeV)
A17.5 ± 0.3 (16.8)3.310.43.320
B11.5 ± 0.3 (11.9)6.014.85.530
C18.9 ± 0.3 (18.7)3.711.23.620
Table 2. The summary of the contribution rate of each mechanism for different zenith angles and distance from EAS core bins.
d [ 0 ,   50 ]   m d [ 50 , 100 ]   m d [ 100 , 150 ]   m d [ 150 , 200 ]   m
θ [ 0 ,   15 ]   deg 8.10%13.15%17.14%19.23%
θ [ 15 ,   30 ]   deg 6.96%10.76%12.50%14.92%
θ [ 30 ,   45 ]   deg 5.16%7.08%8.74%10.76%
θ [ 45 ,   60 ]   deg 4.13%6.56%8.62%10.45%
Disclaimer/Publisher’s Note: The statements, opinions and data contained in all publications are solely those of the individual author(s) and contributor(s) and not of MDPI and/or the editor(s). MDPI and/or the editor(s) disclaim responsibility for any injury to people or property resulting from any ideas, methods, instructions or products referred to in the content.

