
Thermodynamic Investigation of the QCD Phase Diagram with 2+1 Quark Flavors †

Abstract
:1. Introduction
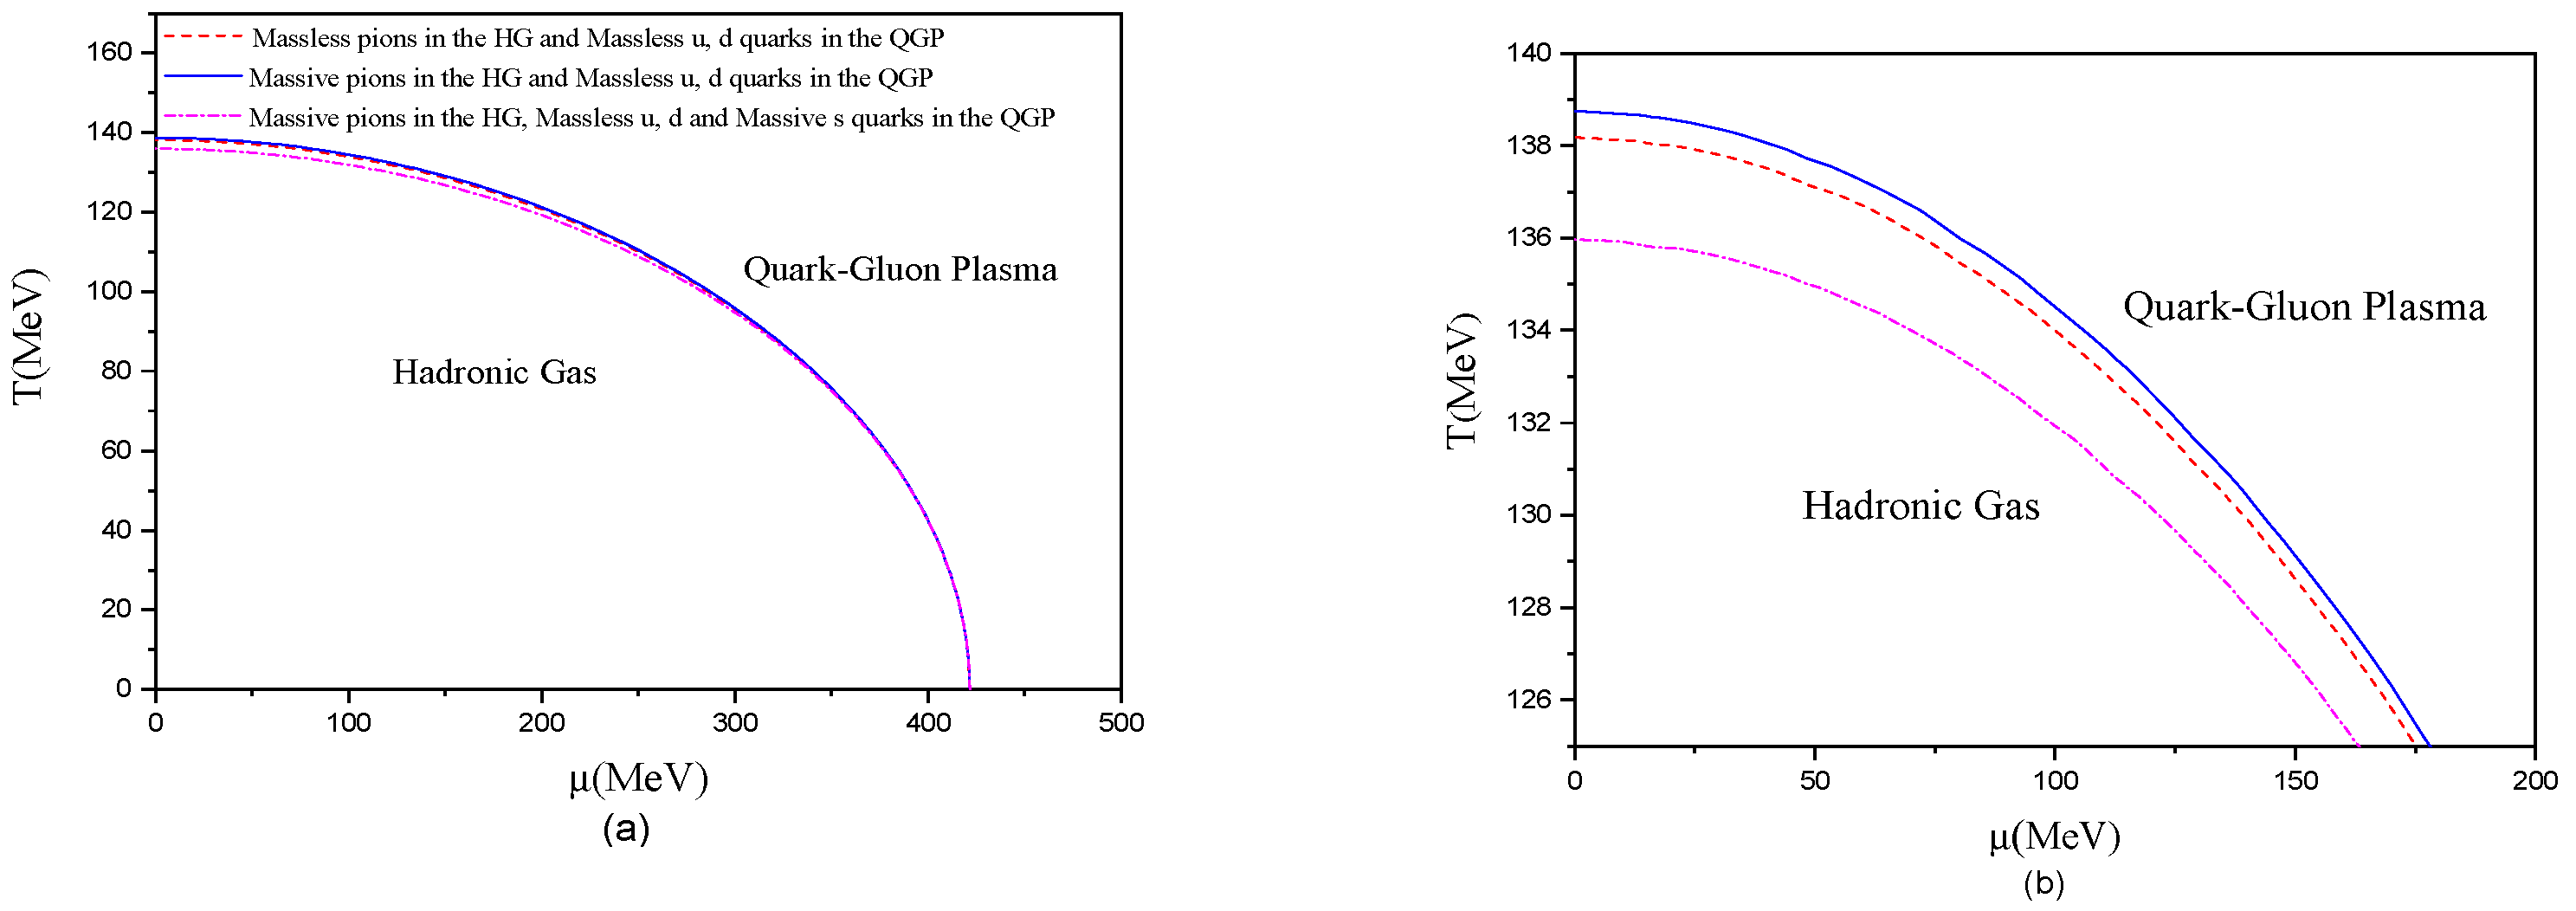
2. Phase Diagram in the µ–T Plane
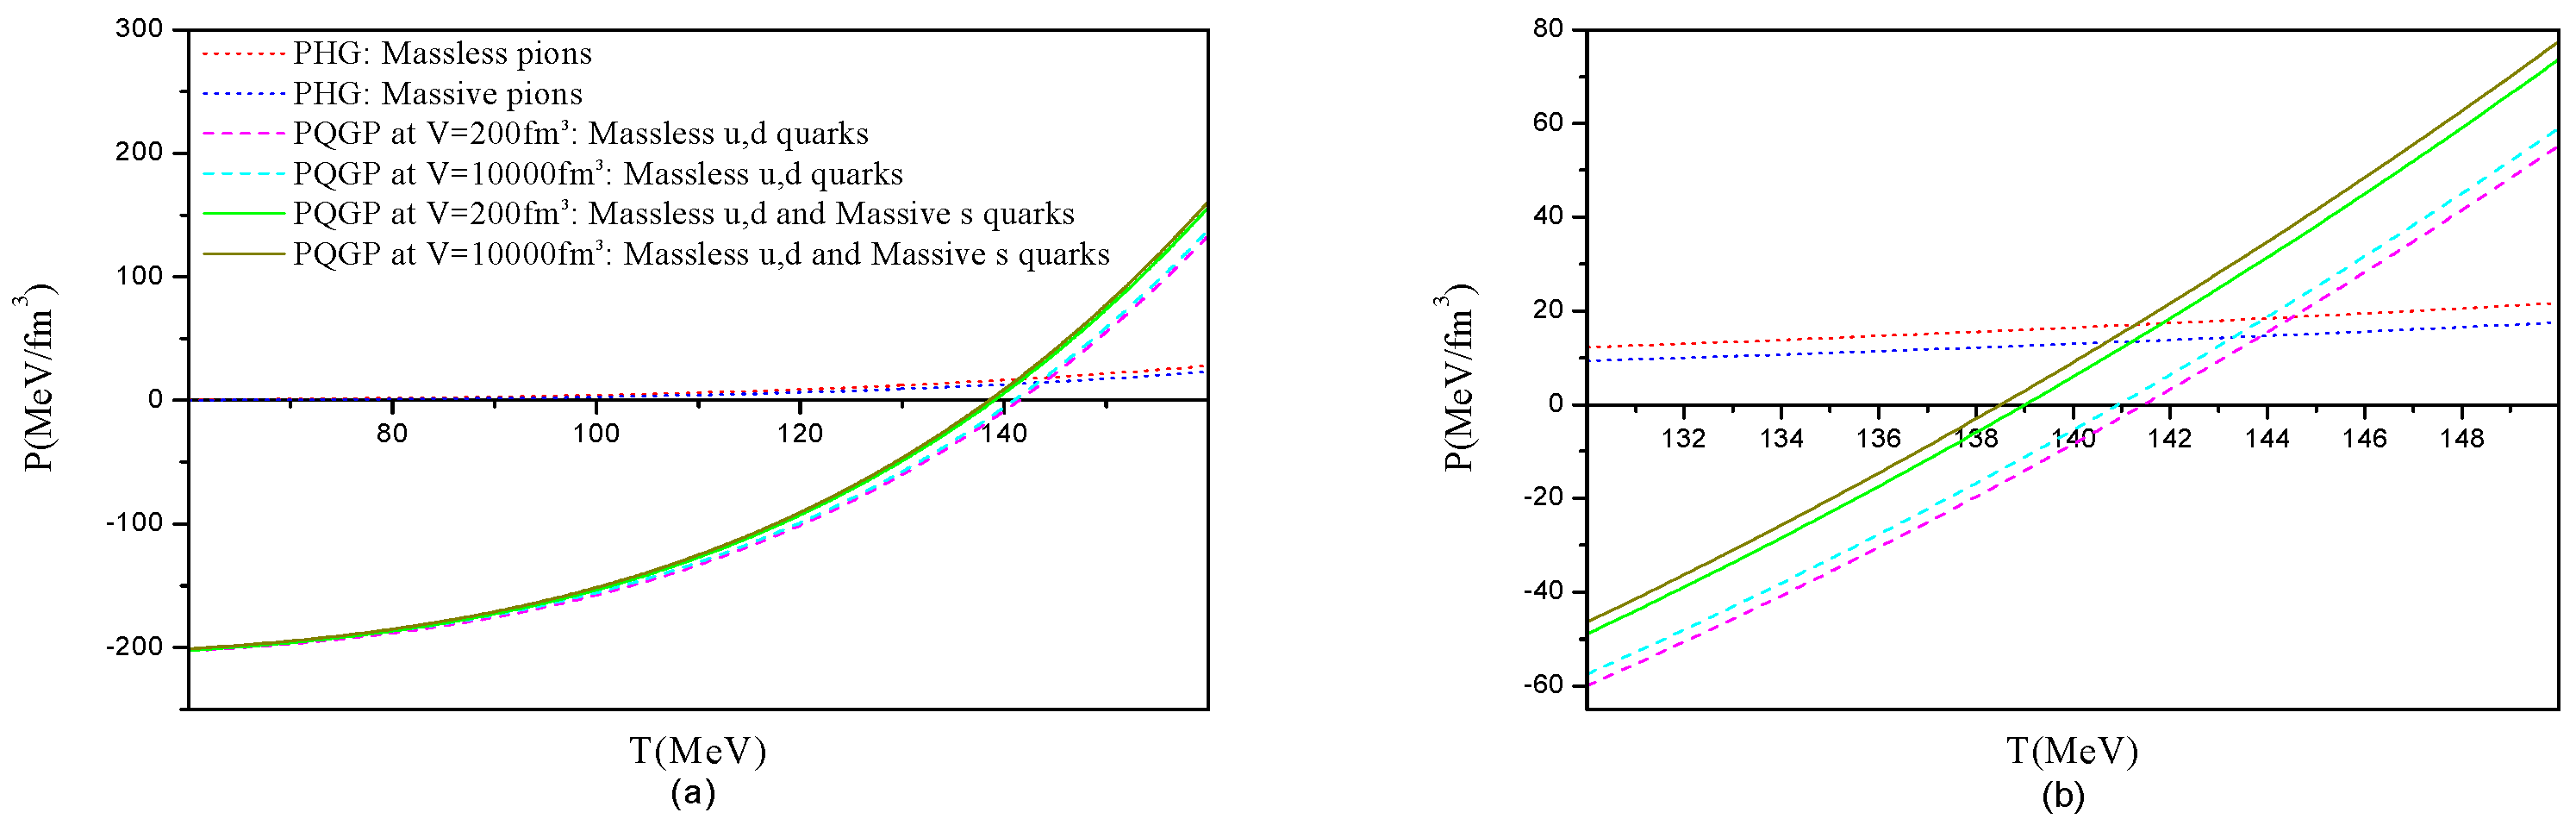
3. Phase Transition to a Color-Singlet QGP
4. Conclusions
Author Contributions
Funding
Institutional Review Board Statement
Informed Consent Statement
Data Availability Statement
Conflicts of Interest
References
- Akram, F. Basics of Quantum Chromodynamics. In Proceedings of the 5th School on LHC Physics, Islamabad, Pakistan, 15–26 August 2016; NCP: Islamabad, Pakistan, 2016. [Google Scholar]
- Ramadas, S. QGP in Quark Stars. Ph.D. Thesis, University of Calicut, Kerala, India, 2014. [Google Scholar]
- Pasechnik, R.; Šumbera, M. Phenomenological Review on Quark-Gluon Plasma: Concepts vs. Observations. Universe 2017, 3, 7. [Google Scholar] [CrossRef] [Green Version]
- Apolinário, L.; Milhano, J.G.; Salamand, G.P.; Salgado, C.A. Probing the Time Structure of the Quark-Gluon Plasma with Top Quarks. Phys. Rev. Lett. 2018, 120, 232301. [Google Scholar] [CrossRef] [PubMed] [Green Version]
- Redlich, K.; Turko, L. Quantum gases with internal symmetry. Phys. Lett. B 1981, 104, 153. [Google Scholar]


| V (fm3) | 200 | 1000 | 10,000 |
|---|---|---|---|
| (MeV) for masslesspions (HG) and massless u, d quarks (QGP) | 144.507 | 143.947 | 143.941 |
| (MeV) for massive pions (HG) and massless u, d quarks (QGP) | 143.859 | 143.305 | 143.299 |
| (MeV) for massless pions (HG) and massless u, d and massive s quarks (QGP) | 141.828 | 141.291 | 141.285 |
| (MeV) for massive pions (HG) and massless u, d and massive s quarks (QGP) | 141.216 | 140.685 | 140.679 |
Disclaimer/Publisher’s Note: The statements, opinions and data contained in all publications are solely those of the individual author(s) and contributor(s) and not of MDPI and/or the editor(s). MDPI and/or the editor(s) disclaim responsibility for any injury to people or property resulting from any ideas, methods, instructions or products referred to in the content. |
© 2023 by the authors. Licensee MDPI, Basel, Switzerland. This article is an open access article distributed under the terms and conditions of the Creative Commons Attribution (CC BY) license (https://creativecommons.org/licenses/by/4.0/).
Share and Cite
Sahi, H.; Ait El Djoudi, A. Thermodynamic Investigation of the QCD Phase Diagram with 2+1 Quark Flavors. Phys. Sci. Forum 2023, 7, 16. https://doi.org/10.3390/ECU2023-14024
Sahi H, Ait El Djoudi A. Thermodynamic Investigation of the QCD Phase Diagram with 2+1 Quark Flavors. Physical Sciences Forum. 2023; 7(1):16. https://doi.org/10.3390/ECU2023-14024
Chicago/Turabian StyleSahi, Hayet, and Amal Ait El Djoudi. 2023. "Thermodynamic Investigation of the QCD Phase Diagram with 2+1 Quark Flavors" Physical Sciences Forum 7, no. 1: 16. https://doi.org/10.3390/ECU2023-14024