
Bayesian and Machine Learning Methods in the Big Data Era for Astronomical Imaging †

 , and
, and 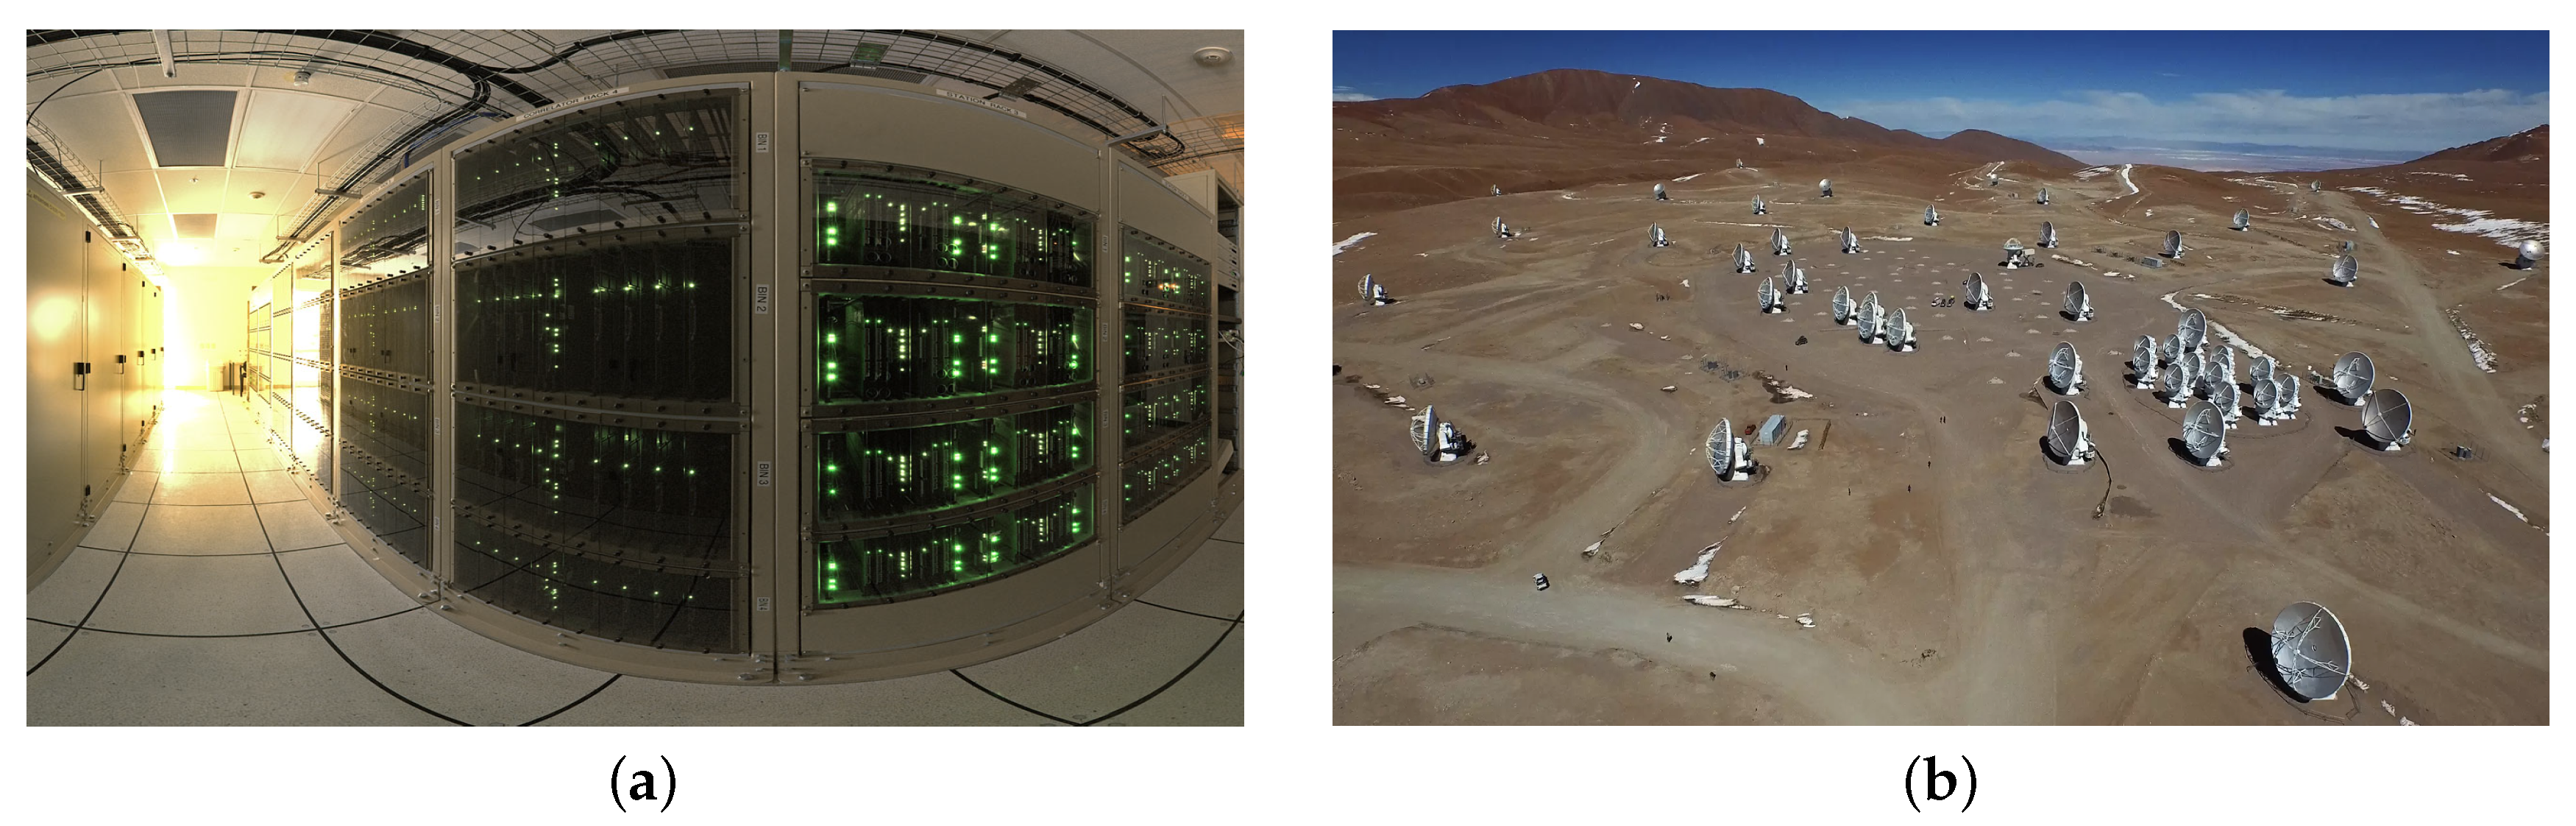
Abstract
:1. Introduction
2. ALMA and the Ill-Posed Inverse Problem
2.1. RESOLVE for Bayesian Signal Inference
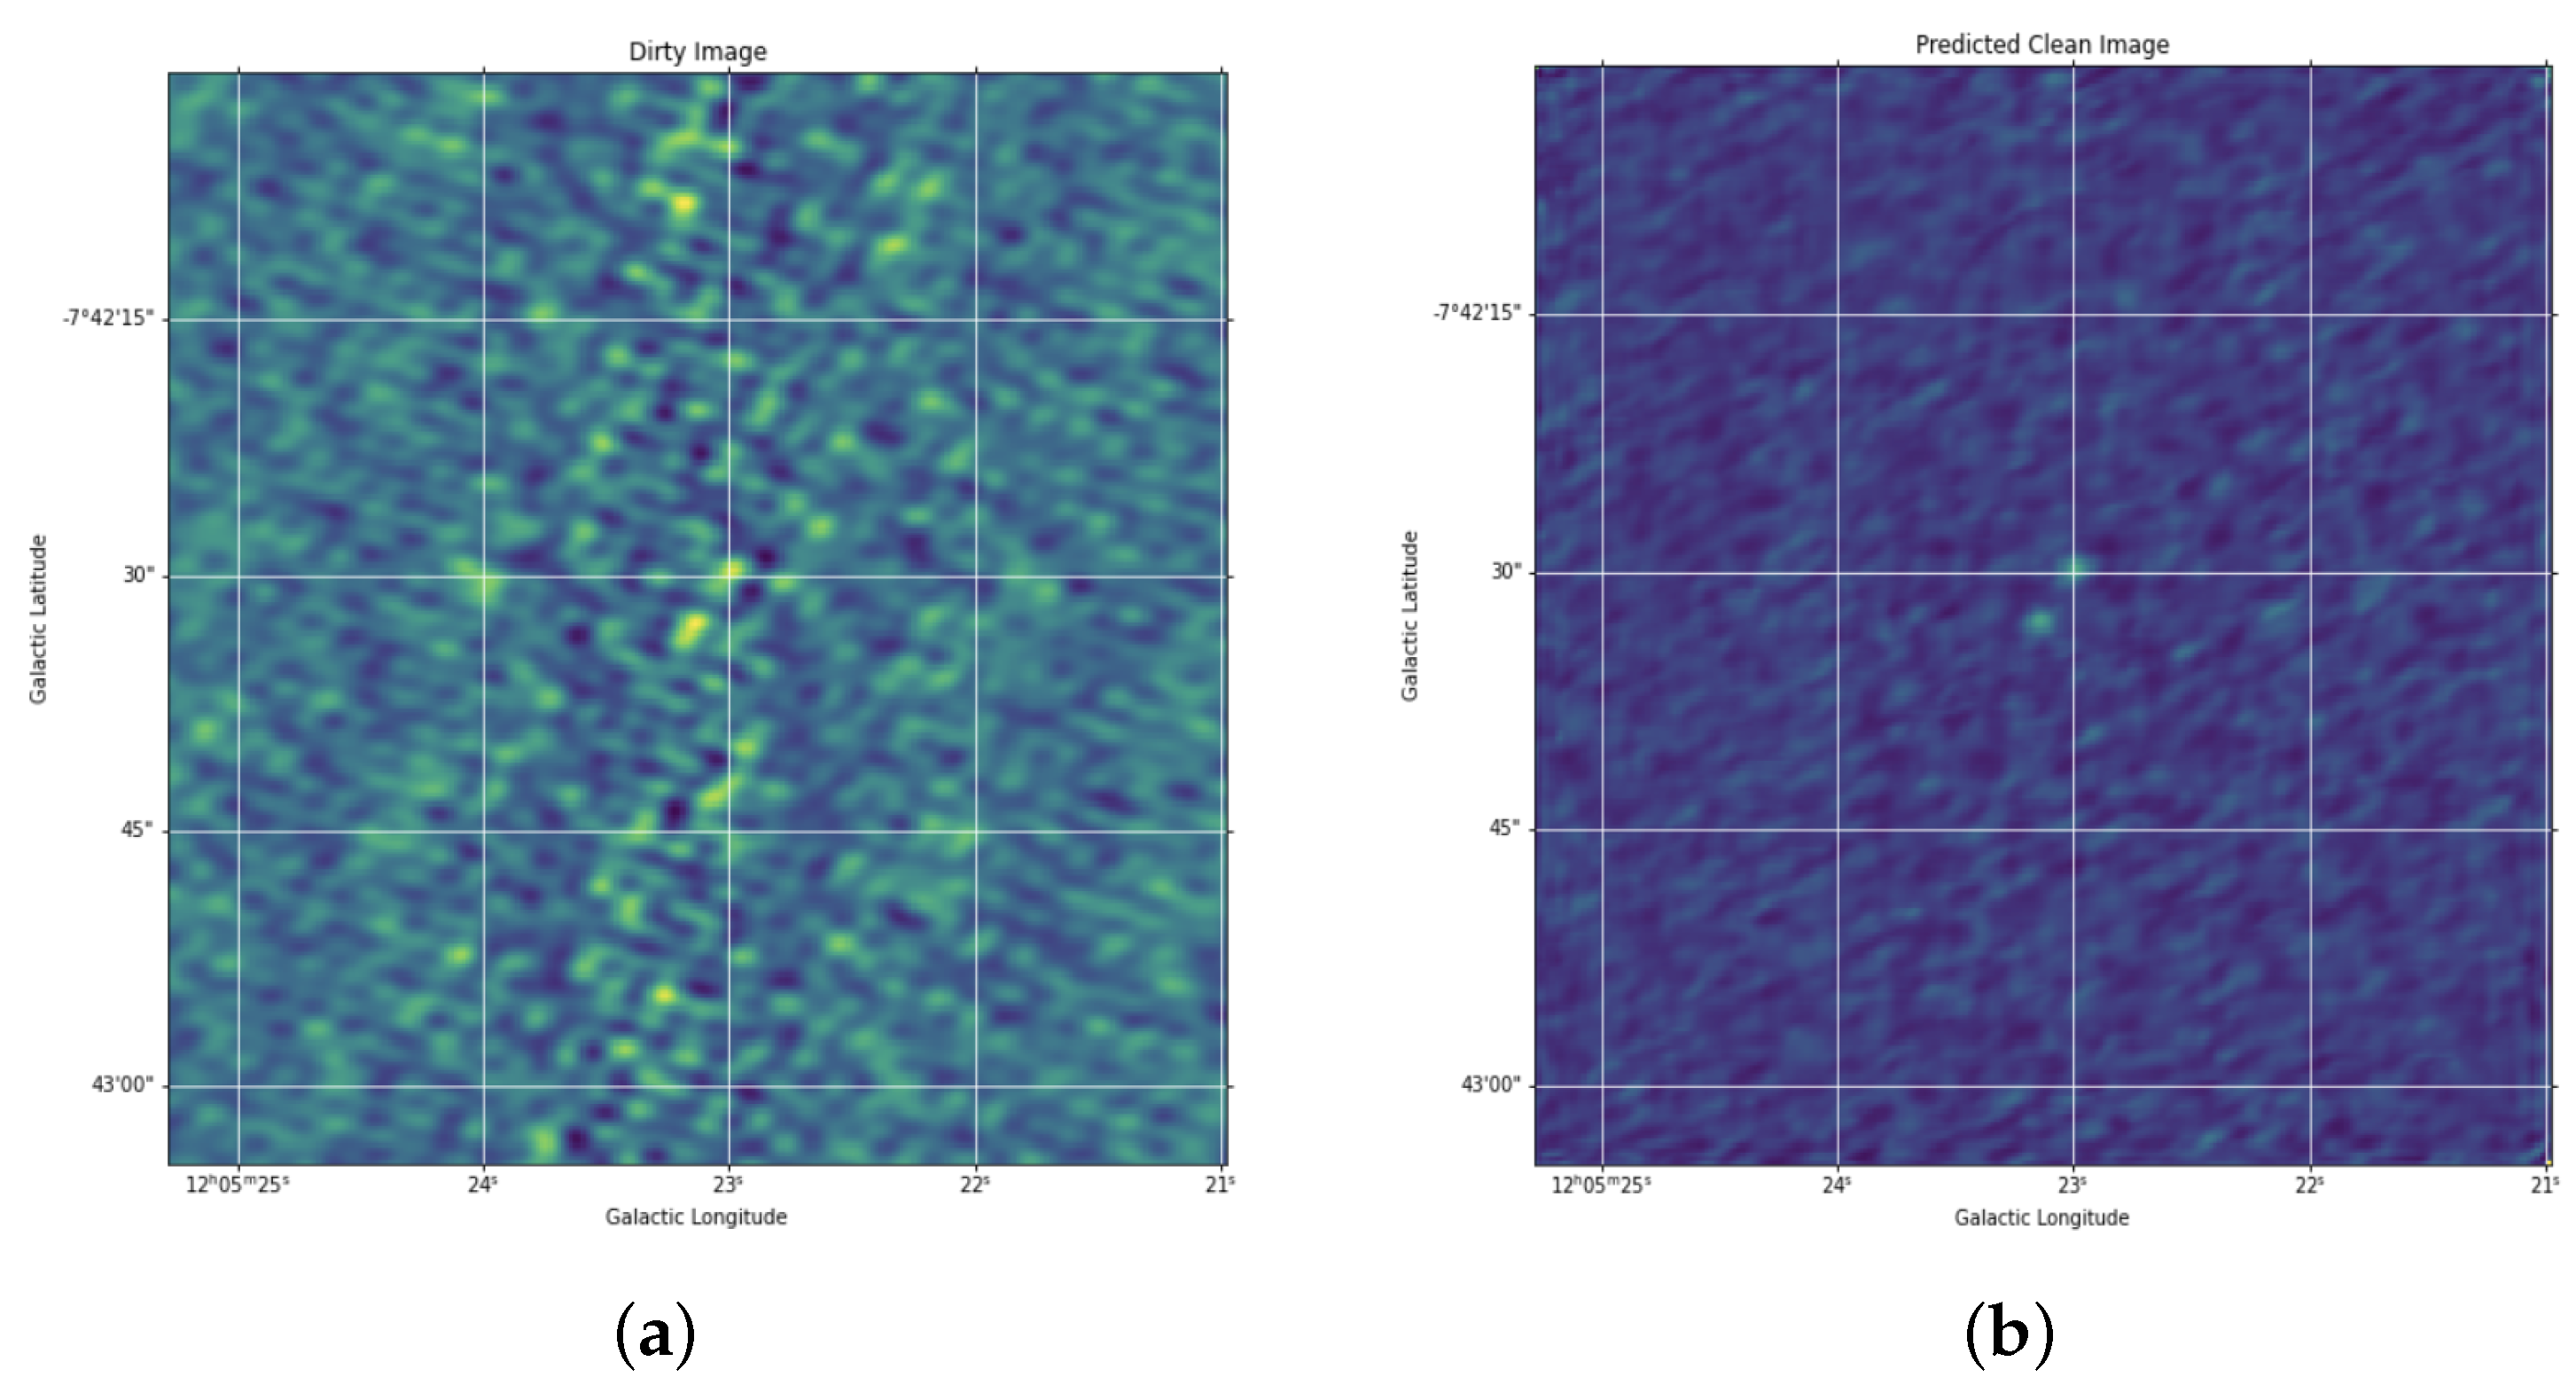
2.2. Deep Learning for Fast Image Reconstruction
3. Conclusions
Author Contributions
Funding
Institutional Review Board Statement
Informed Consent Statement
Data Availability Statement
Conflicts of Interest
References
- Wootten, A.; Thompson, A.R. The Atacama large millimeter/Submillimeter array. Proc. IEEE 2009, 97, 1463–1471. [Google Scholar] [CrossRef] [Green Version]
- Cortes, P.; Remijan, A.; Biggs, A.; Dent, B.; Carpenter, J.; Fomalont, E.; Hales, A.; Kameno, S.; Mason, B.; Philips, N.; et al. ALMA Cycle 8 2021 Technical Handbook; Atacama Large Millimeter/Submillimeter Array (ALMA): Antofagasta, Chile, 2021. [Google Scholar] [CrossRef]
- Huang, Y.D.T.; Morata, O.; Koch, P.M.; Kemper, C.; Hwang, Y.J.; Chiong, C.C.; Ho, P.; Chu, Y.H.; Huang, C.D.; Liu, C.T.; et al. The Atacama large millimeter/sub-millimeter array band-1 receiver. In Modeling, Systems Engineering, and Project Management for Astronomy VI; Angeli, G.Z., Dierickx, P., Eds.; SPIE: Bellingham, WA, USA, 2016; Volume 9911, p. 99111V. [Google Scholar] [CrossRef] [Green Version]
- Yagoubov, P.; Mroczkowski, T.; Belitsky, V.; Cuadrado-Calle, D.; Cuttaia, F.; Fuller, G.A.; Gallego, J.D.; Gonzalez, A.; Kaneko, K.; Mena, P.; et al. Wideband 67–116 GHz receiver development for ALMA Band 2. A&A 2020, 634, A46. [Google Scholar] [CrossRef] [Green Version]
- Carpenter, J.; Iono, D.; Kemper, F.; Wootten, A. The ALMA Development Program: Roadmap to 2030. arXiv 2020, arXiv:2001.11076. [Google Scholar] [CrossRef]
- McMullin, J.P.; Waters, B.; Schiebel, D.; Young, W.; Golap, K. CASA Architecture and Applications. In Astronomical Data Analysis Software and Systems XVI; Shaw, R.A., Hill, F., Bell, D.J., Eds.; SPIE: Bellingham, WA, USA, 2007; Volume 376, p. 127. [Google Scholar]
- Taylor, G.B.; Carilli, C.L.; Perley, R.A. Synthesis Imaging in Radio Astronomy II; Astronomical Society of the Pacific: San Francisco, CA, USA, 1999; Volume 180. [Google Scholar]
- Guglielmetti, F.; Villard, E.; Fomalont, E. Bayesian Reconstruction through Adaptive Image Notion. Proceedings 2019, 33, 21. [Google Scholar] [CrossRef] [Green Version]
- Junklewitz, H.; Bell, M.R.; Selig, M.; Enßlin, T.A. RESOLVE: A new algorithm for aperture synthesis imaging of extended emission in radio astronomy. Astron. Astrophys. 2016, 586, A76. [Google Scholar] [CrossRef] [Green Version]
- Greiner, M.; Vacca, V.; Junklewitz, H.; Enßlin, T.A. fastRESOLVE: Fast Bayesian imaging for aperture synthesis in radio astronomy. arXiv 2016, arXiv:1605.04317. [Google Scholar]
- Arras, P.; Knollmüller, J.; Junklewitz, H.; Enßlin, T.A. Radio Imaging with Information Field Theory. arXiv 2018, arXiv:1803.02174. [Google Scholar]
- Enßlin, T.A.; Frommert, M.; Kitaura, F.S. Information field theory for cosmological perturbation reconstruction and nonlinear signal analysis. Phys. Rev. D 2009, 80, 105005. [Google Scholar] [CrossRef] [Green Version]
- Enßlin, T. Information field theory. AIP Conf. Proc. 2013, 1553, 184. [Google Scholar] [CrossRef] [Green Version]
- Arras, P.A. Radio Interferometry with Information Field Theory. Ph.D. Thesis, Faculty of Physics, Ludwig-Maximilians-Universität München, München, Germany, January 2021. [Google Scholar]
- Reinecke, M.; Steininger, T.; Selig, M. NIFTy—Numerical Information Field TheorY. Version nifty4. 5 February 2018. Available online: https://gitlab.mpcdf.mpg.de/ift/nifty/-/tree/NIFTy_4#nifty4 (accessed on 18 July 2022).
- Arras, P.; Bester, H.L.; Perley, R.A.; Leike, R.; Smirnov, O.; Westermann, R.; Enßlin, T.A. Comparison of classical and Bayesian imaging in radio interferometry. Astron. Astrophys. 2021, 646, A84. [Google Scholar] [CrossRef]
- Tychoniec, L. Bayesian statistics approach to imaging of aperture synthesis data: RESOLVE meets ALMA. In Proceedings of the International Conference on Bayesian and Maximum Entropy Methods in Science and Engineering, Paris, France, 18–22 July 2022. Number 67. [Google Scholar]
- Brogan, C.L.; Pérez, L.M.; Hunter, T.R.; Dent, W.R.F.; Hales, A.S.; Hills, R.E.; Corder, S.; Fomalont, E.B.; Vlahakis, C.; Asaki, Y.; et al. The 2014 ALMA long baseline campaign: First results from high angular resolution observations toward the HL Tau region. Astrophys. J. Lett. 2015, 808, L3. [Google Scholar] [CrossRef]
- Realizing the potential of astrostatistics and astroinformatics. Bull. Am. Astron. Soc. 2019, 51, 233.
- Delli Veneri, M. 3D Detection and Characterisation of ALMA Sources through Deep Learning. MNRAS, 2022, submitted.
- Carniani, S.; Marconi, A.; Biggs, A.; Cresci, G.; Cupani, G.; D’Odorico, V.; Humphreys, E.; Maiolino, R.; Mannucci, F.; Molaro, P.; et al. Strongly star-forming rotating disks in a complex merging system at z = 4.7 as revealed by ALMA. Astron. Astrophys. 2013, 559, A29. [Google Scholar] [CrossRef]
- Siemiginowska, A.; Kuhn, M.; Graham, M.; Mahabal, A.A.; Taylor, S.R. The Next Decade of Astroinformatics and Astrostatistics. Bull. Am. Astron. Soc. 2019, 51, 355. [Google Scholar]


Disclaimer/Publisher’s Note: The statements, opinions and data contained in all publications are solely those of the individual author(s) and contributor(s) and not of MDPI and/or the editor(s). MDPI and/or the editor(s) disclaim responsibility for any injury to people or property resulting from any ideas, methods, instructions or products referred to in the content. |
© 2023 by the authors. Licensee MDPI, Basel, Switzerland. This article is an open access article distributed under the terms and conditions of the Creative Commons Attribution (CC BY) license (https://creativecommons.org/licenses/by/4.0/).
Share and Cite
Guglielmetti, F.; Arras, P.; Delli Veneri, M.; Enßlin, T.; Longo, G.; Tychoniec, L.; Villard, E. Bayesian and Machine Learning Methods in the Big Data Era for Astronomical Imaging. Phys. Sci. Forum 2022, 5, 50. https://doi.org/10.3390/psf2022005050
Guglielmetti F, Arras P, Delli Veneri M, Enßlin T, Longo G, Tychoniec L, Villard E. Bayesian and Machine Learning Methods in the Big Data Era for Astronomical Imaging. Physical Sciences Forum. 2022; 5(1):50. https://doi.org/10.3390/psf2022005050
Chicago/Turabian StyleGuglielmetti, Fabrizia, Philipp Arras, Michele Delli Veneri, Torsten Enßlin, Giuseppe Longo, Lukasz Tychoniec, and Eric Villard. 2022. "Bayesian and Machine Learning Methods in the Big Data Era for Astronomical Imaging" Physical Sciences Forum 5, no. 1: 50. https://doi.org/10.3390/psf2022005050