Proceeding Paper

Moon Mapping Project Results on Solar Wind ion Flux and Composition †

by
Francesco Nozzoli
1,2,* and
Pietro Richelli
3
1
INFN-TIFPA, Via Sommarive 14, I-38123 Trento, Italy
2
ASI Space Science Data Center (SSDC), via del Politecnico s.n.c., I-00133 Roma, Italy
3
Department of Physics, Trento University, via Sommarive 14, I-38123 Trento, Italy
*
Author to whom correspondence should be addressed.
Presented at the 1st Electronic Conference on Universe, 22–28 February 2021; Available online: https://ecu2021.sciforum.net/.
Phys. Sci. Forum 2021, 2(1), 16; https://doi.org/10.3390/ECU2021-09327
Published: 23 February 2021
(This article belongs to the Proceedings of The 1st Electronic Conference on Universe)

Abstract

:
The “Moon Mapping” project is a collaboration between the Italian and Chinese Governments allowing cooperation and exchange from students from both countries. Main aim of the project is to analyze remotely sensed data collected by the Chinese space missions Chang’E-1/2 over the Moon surface. The Italian Space Agency is responsible for the Italian side and the Center of Space Exploration, China Ministry of Education, is responsible for the Chinese side. The results of the “Moon Mapping” project topic #1: ”map of the solar wind ion” using data collected by Chang’E-1 satellite are summarized. Chang’E-1 is a lunar orbiter, the revolution period is 2 h and the orbit is polar. The satellite is equipped with two Solar Wind Ion Detectors (SWIDs) that are two perpendicular electrostatic spectrometers mapping the sky with 24 channels with a field of view of 15° × 6.7° each. The spectrometers can measure solar wind flux in the range 40 eV/q–17 keV/q with an energy resolution of 8%. The data collected by the two Solar Wind Ion Detectors are analyzed to characterize the solar wind flux and composition on the Moon surface, studying the large time variation due to the solar activity. The data measured by Chang’E-1, as compared with the one measured in the same period by the electrostatic spectrometers onboard the ACE satellite, enrich the multi-messenger/multi-particle view of the Sun, gathering valuable information about the space weather outside the Earth’s magnetosphere.

1. Introduction

The ”Moon Mapping” project is a collaboration between the Italian and Chinese Governments allowing cooperation and exchange from students from both countries. The main aim of the project is to analyze remotely sensed data collected by the Chinese space missions Chang’E-1/2 over the Moon surface. The Italian Space Agency is responsible for the Italian side and the Center of Space Exploration, China Ministry of Education, is responsible for the Chinese side. The project has six research topics: (1) map of the solar wind ion; (2) geo-morphological map of the Moon; (3) data pre-processing of Chang’E-1 mission; (4) map of element distribution; (5) establishment of 3D digital visualization system; and (6) compilation and publication of a tutorial on joint lunar mapping. Most of the results of the Moon Mapping project are collected in [1,2], here the details of the results of topic #1 are summarized.

The Solar Wind investigation

The nature of solar wind is an important object of study, there have been a lot of space projects launched in recent decades which probed it, e.g., SOHO [3], ACE [4] and WIND [5] which are near the Sun–Earth L1 Lagrange point, STEREO [6] and Ulysses [7] which are in heliocentric orbits, and FAST [8] and CHAMP [9] which orbit about the Earth. In addition, the investigation of the Moon and cislunar space exploration has become a hot topic in recent decades. In particular, Japan launched SELENE Explorer [10] in 2007 and India launched Chandrayaan-1 [11] in 2008. China also constructed and launched Chang’E-1 spacecraft in October 2007. This is an unmanned lunar-orbiter equipped with different scientific instruments, in particular two Solar Wind Ion Detectors (SWIDs) were mounted on the spacecraft. The SWID detectors were designed to measure the solar wind ion differential flux. The analysis of the composition of the solar wind improves our understanding of the Sun and allows constructing a model of the cislunar space environment. The solar wind is composed of ions, mainly protons and electrons, a small component of light elements (He + + and O 6 + ) as well as traces of heavy elements such as Si and Fe [12]. Solar wind is accelerated by the pressure difference between the solar corona and the interplanetary space at velocities large enough to allow particles to escape from the gravitational field of the Sun. Typical velocity of solar wind ranges from 300 to 700 km/s however the average velocity, as well as, the flux and the relative composition are subject to variations related to solar activity. The interaction of the Earth’s magnetosphere with the solar wind, is a key factor of the Space Weather studies providing a sizable impact on space technology.

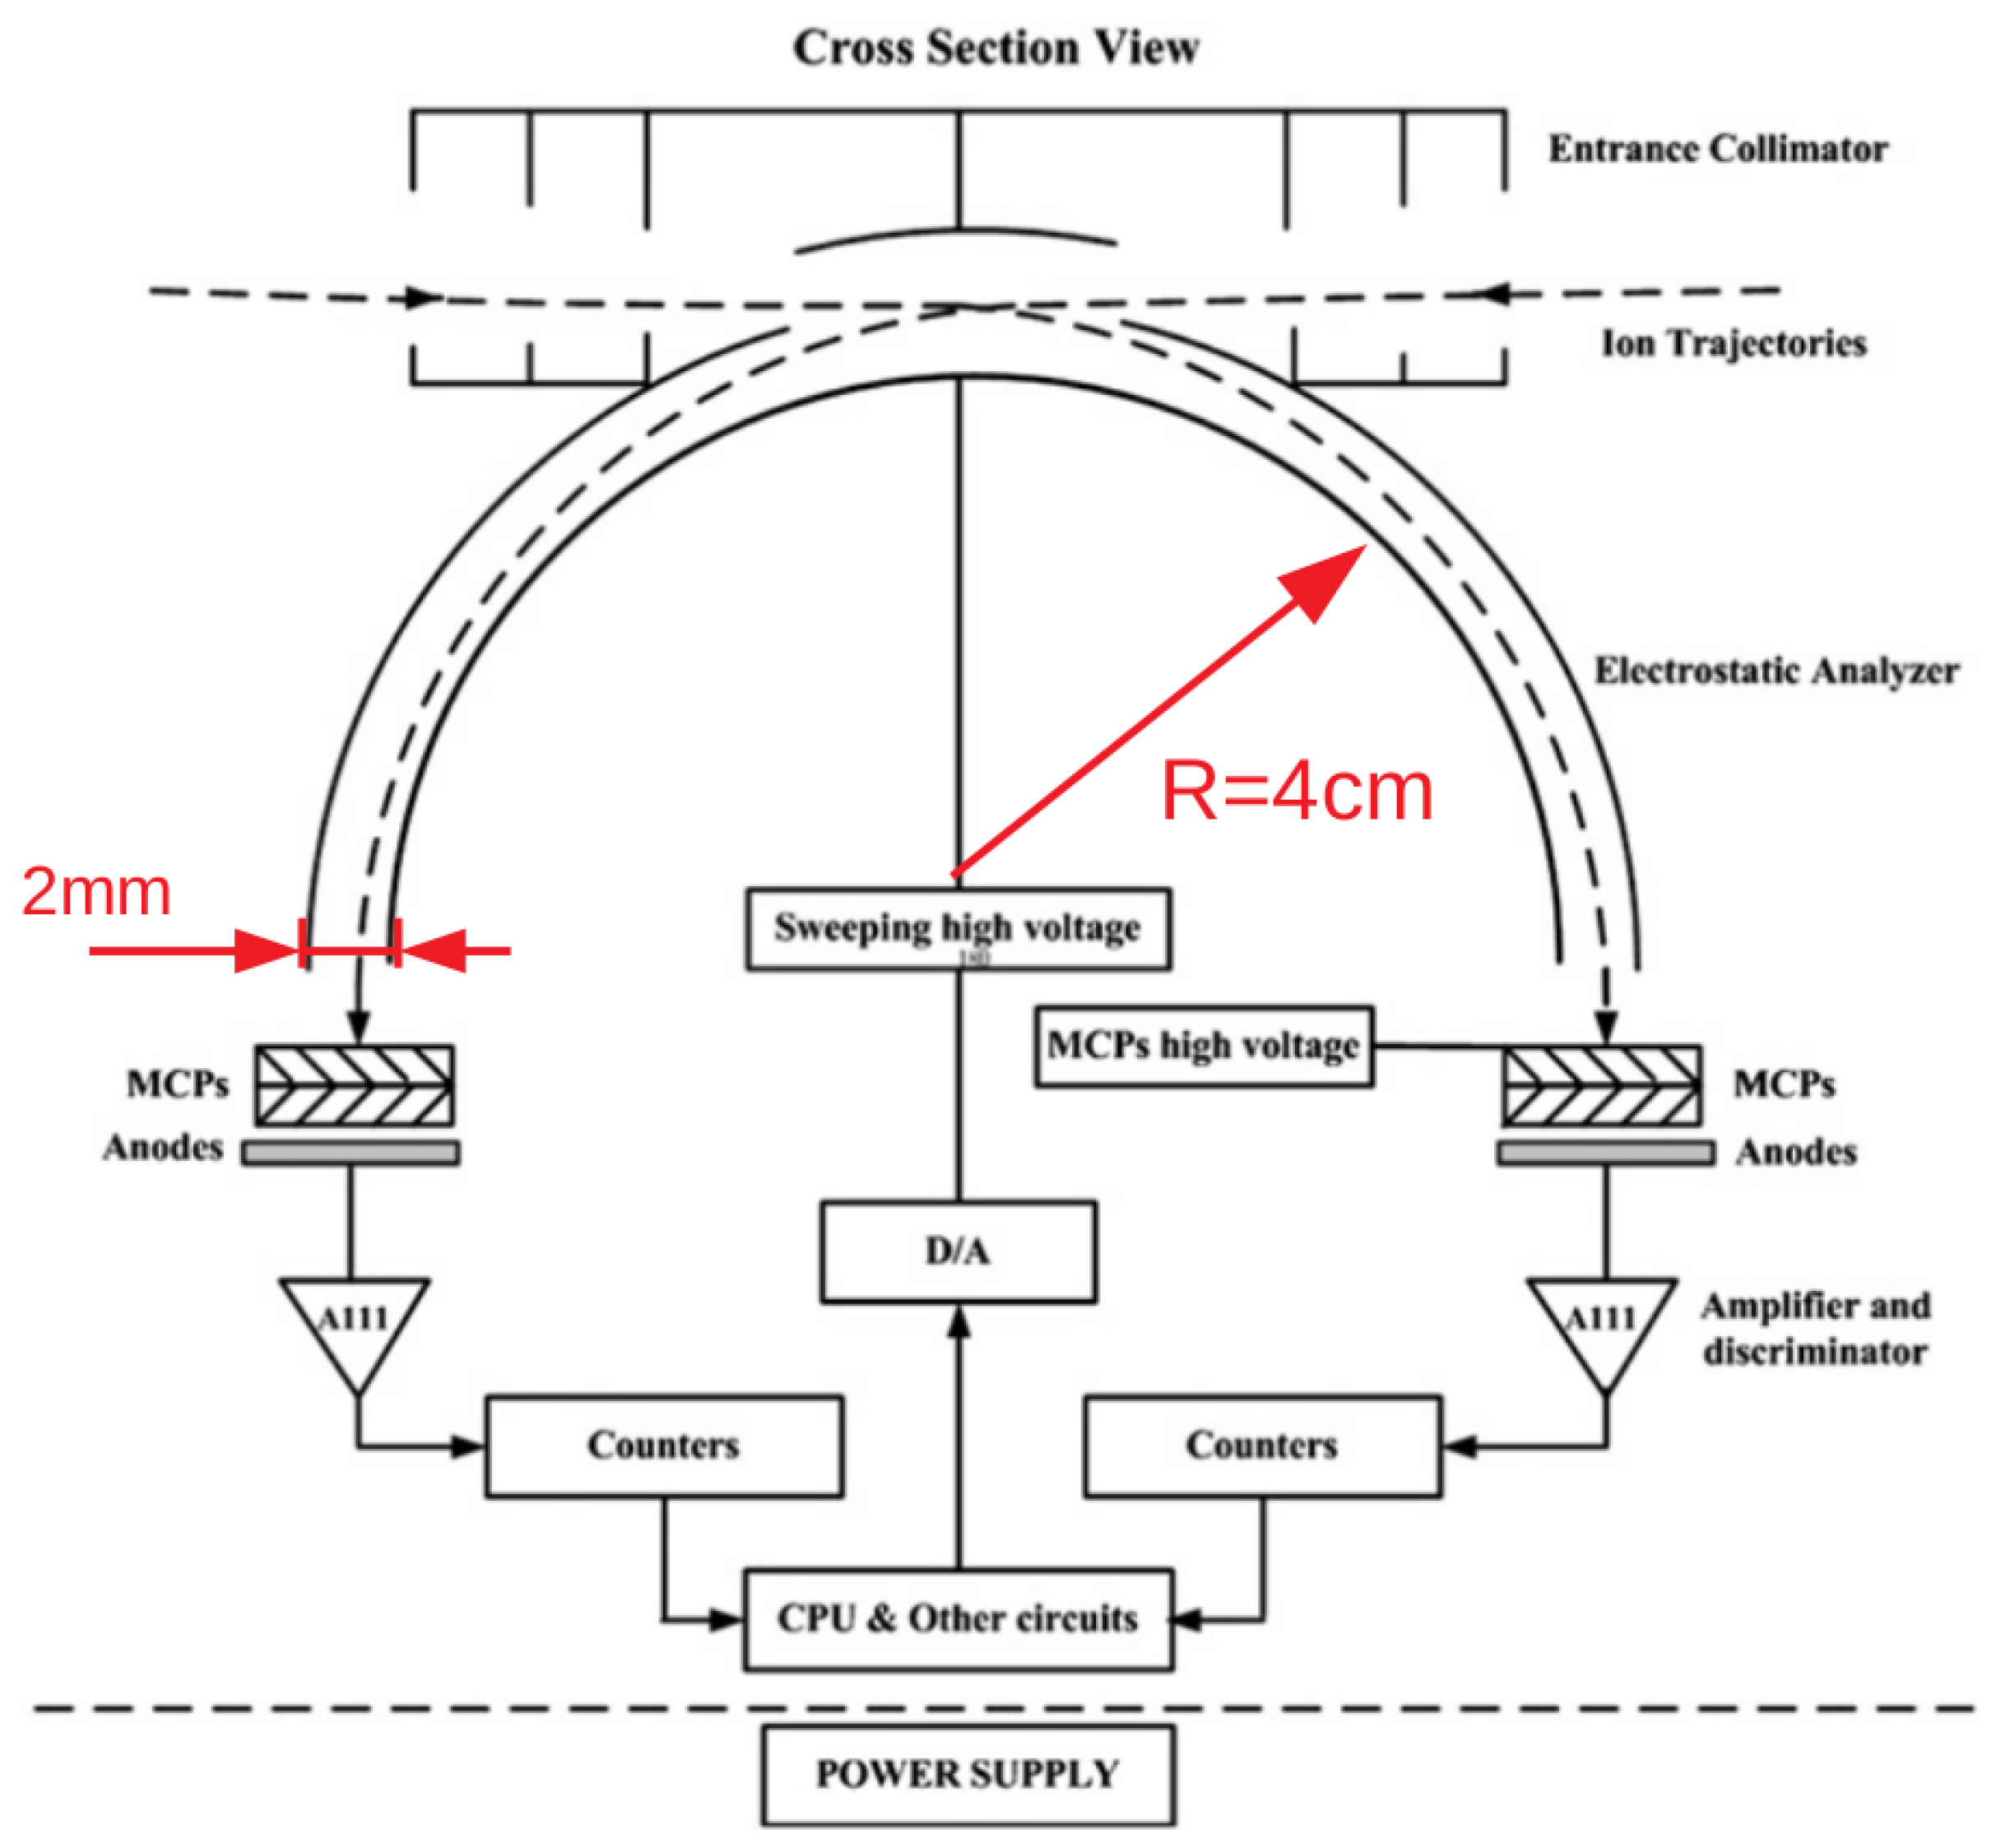
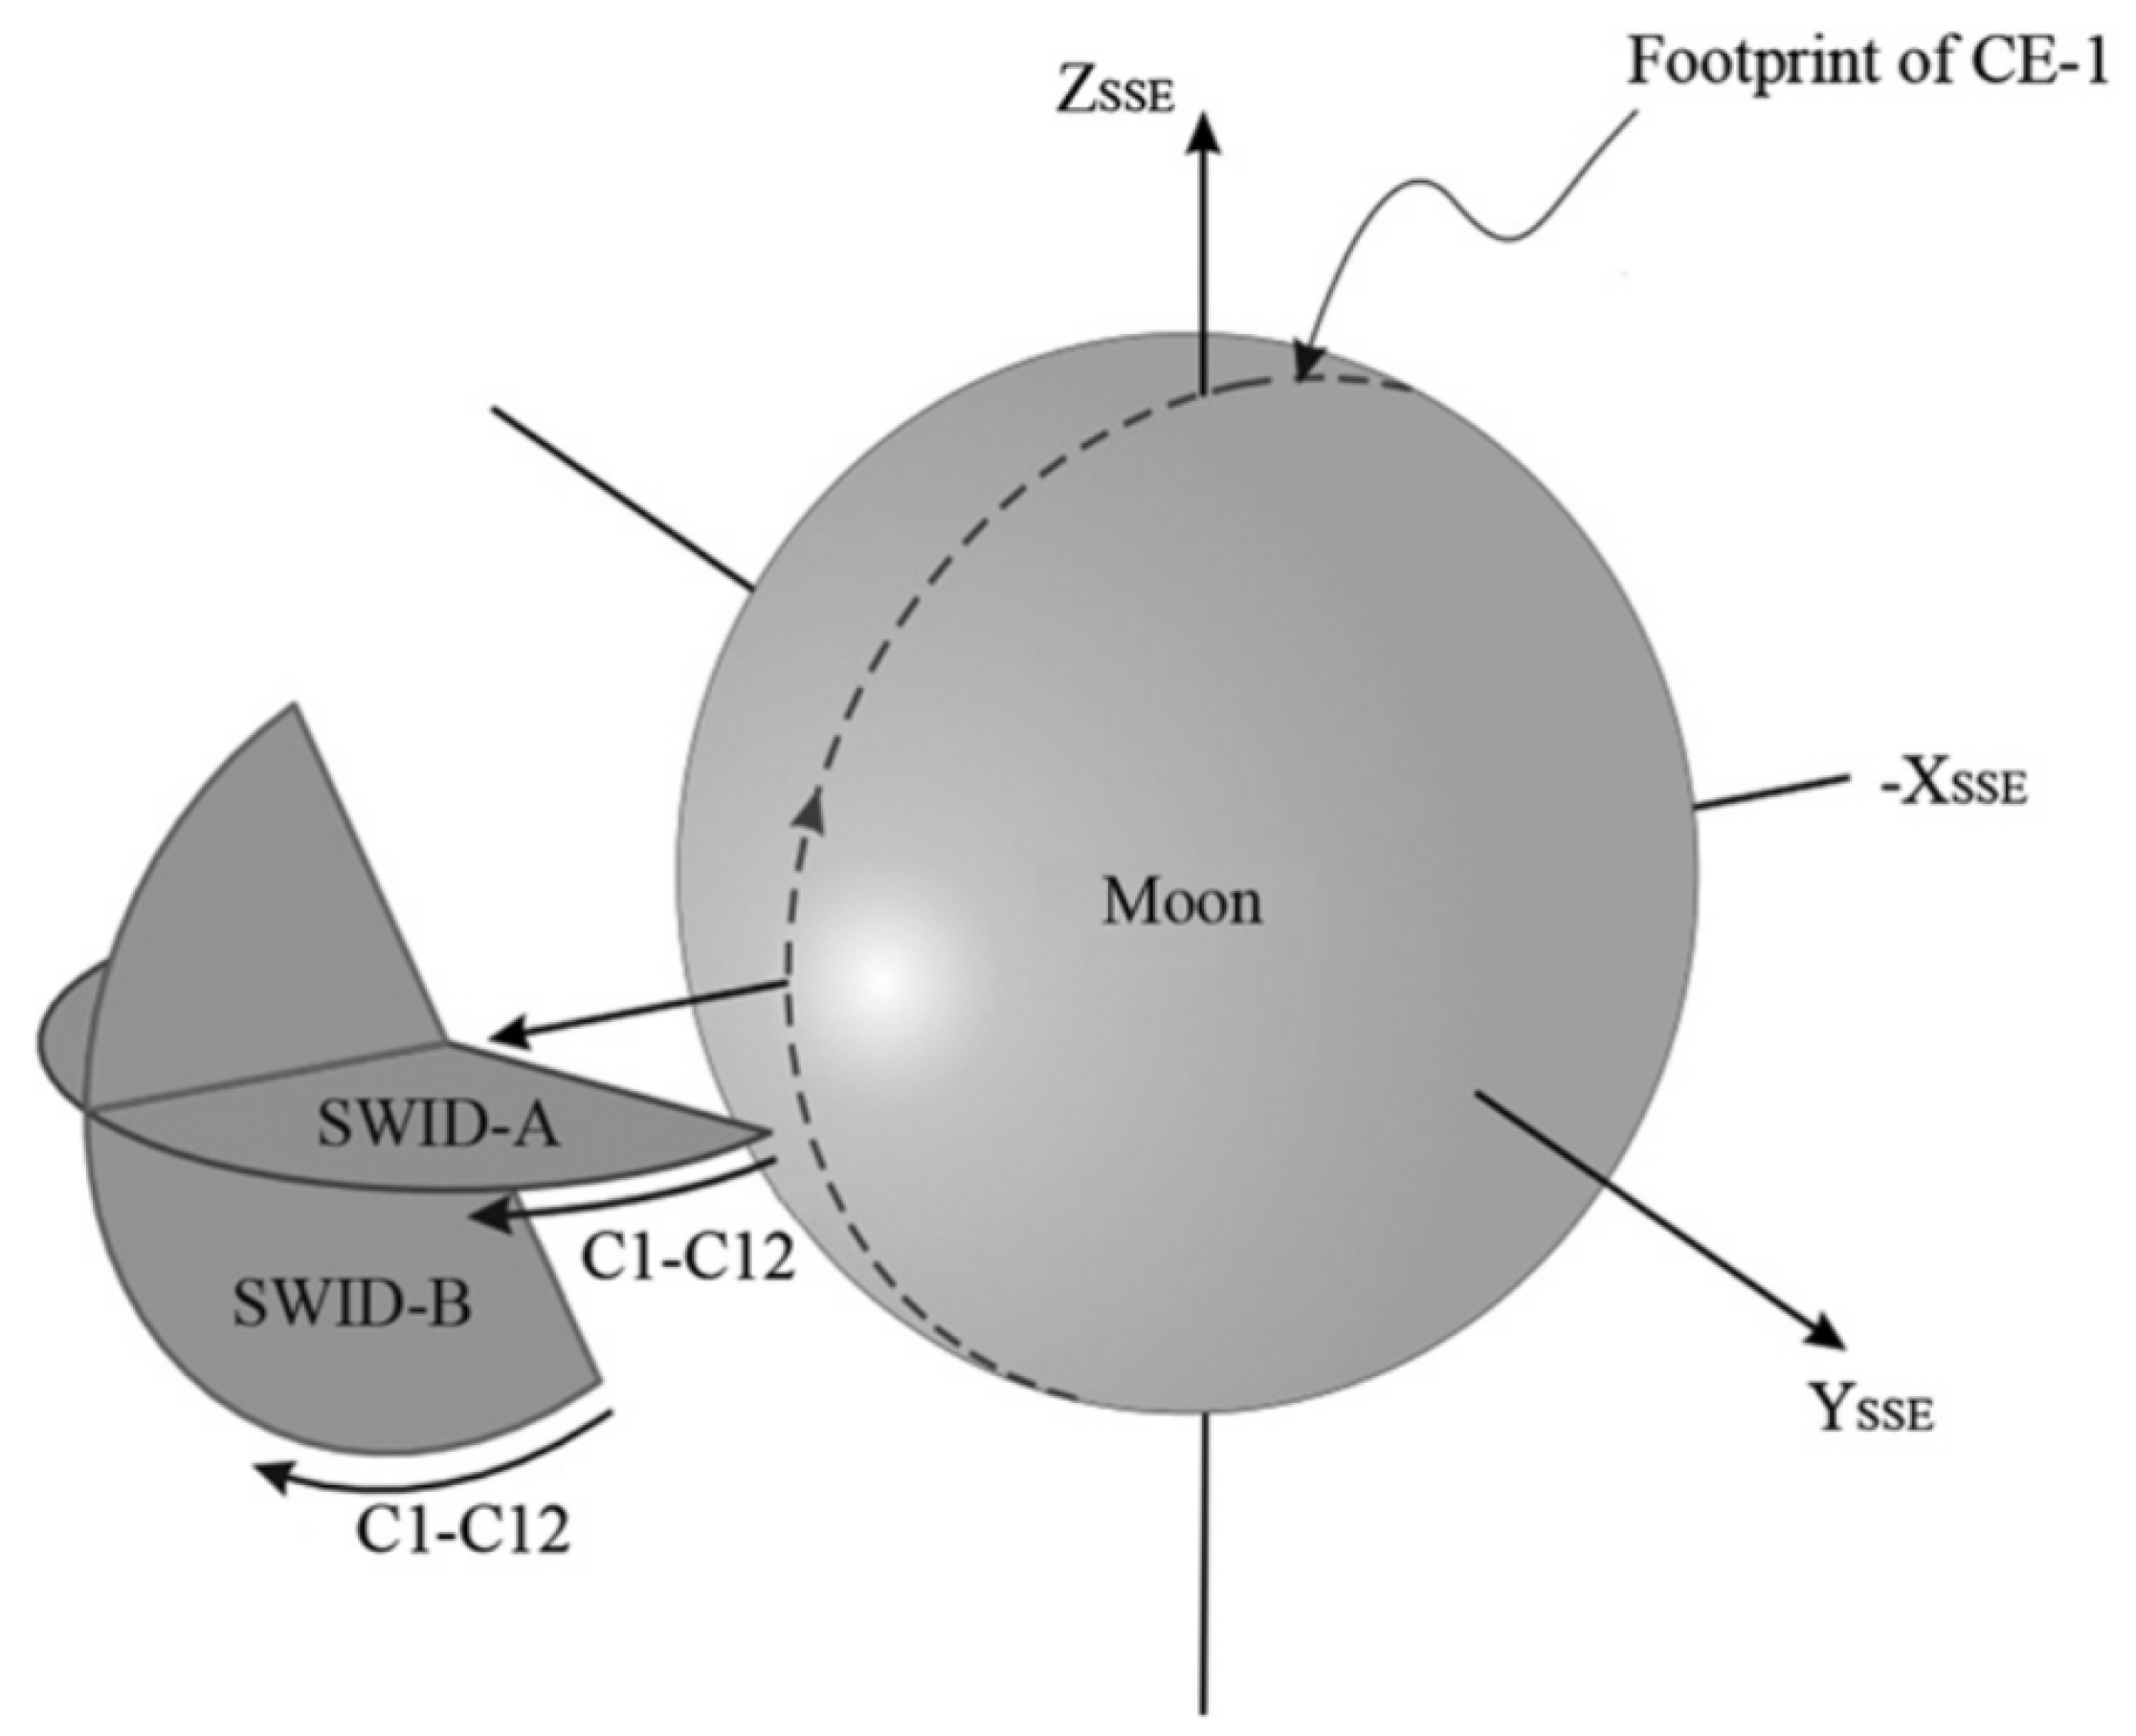
2. The Chang’e-1 SWID Detectors

The Solar Wind Ion Detector (SWID) of the Chang’E-1 orbiter is described by [13]. The field of view (FOV) of each SWID detector is approximately 6.7° × 180°, therefore mainly observing a plane. The SWID measures ion differential flux arriving from half (180°) of that plane, with a Micro Channel Plate (MCP) detector anode divided into 12 equal readouts, each has an angular view of 15° (see Figure 1).
Each SWID can measure ion differential flux distributed in 48 energy bins on a log-scale ranging from 40 eV/q to 17 keV/q with an energy resolution of 8%.
Two identical SWID detectors (SWIDA and SWIDB) were installed on Chang’E-1, they were mutually perpendicular to provide a large FOV, as illustrated in Figure 1 [14].

3. Data Sample

SWID data are stored in PDS (Planetary Data System) files. Each record consists of: time, a 48 × 12 array storing ion flux across the 48 energy bins and 12 directions. In the PDS file are stored also Geocentric Solar Ecliptic (GSE) coordinates and Moon Center Coordinate (MCC) of the orbiter, Quality state, and Instrument Sun Incidence Angle. A sample of data file from SWIDA is shown in Table 1. Detailed information on the data of SWID are in [15] and references therein. The flux measured by SWIDA and SWIDB is sampled each 3 s, data are stored in separate files for each orbit around the Moon (2 h). In the two different periods, December/2007 to February/2008 and May/2008 to July/2008 SWIDA and SWIDB collected about 5000 files (over 57 GB) of solar wind data preserved also in the ASI/SSDC data-hub [16].
A specially developed 3D visualization method to handle a single Chang’E-1 SWIDs data record is described in [15]. In the following, a global analysis of Chang’E-1 SWIDs data is considered.

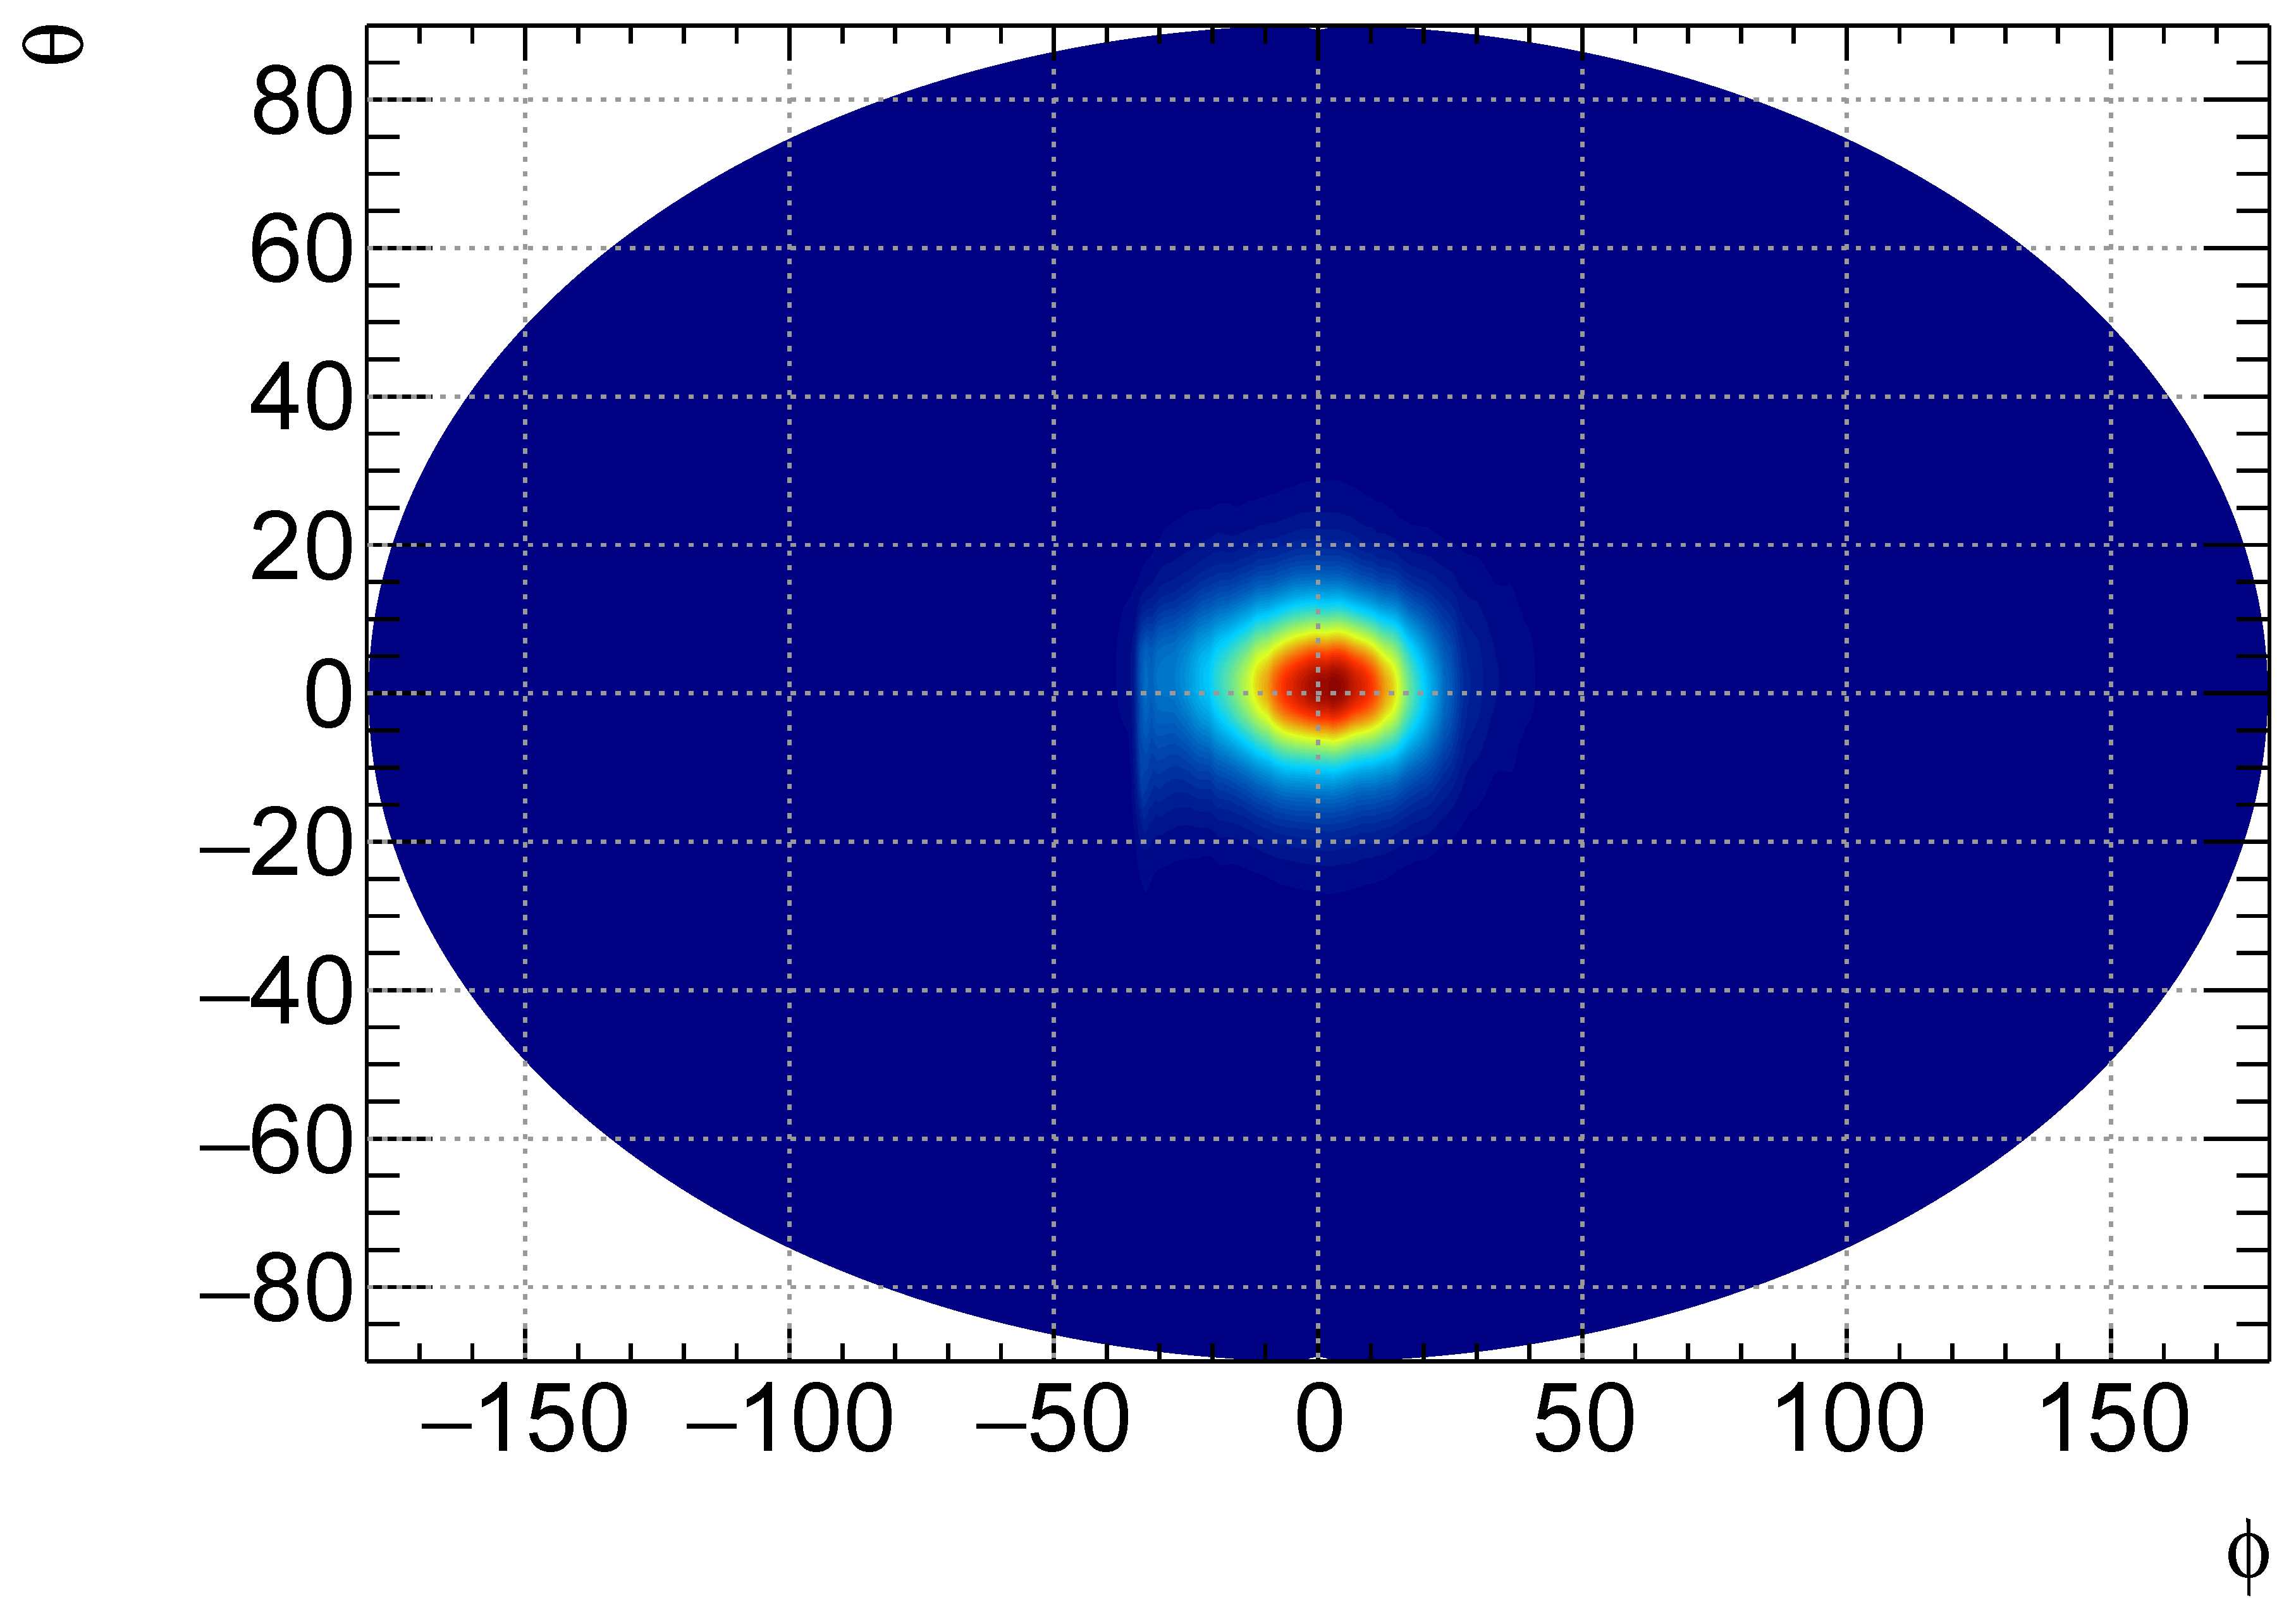
4. Solar Wind Distribution Map
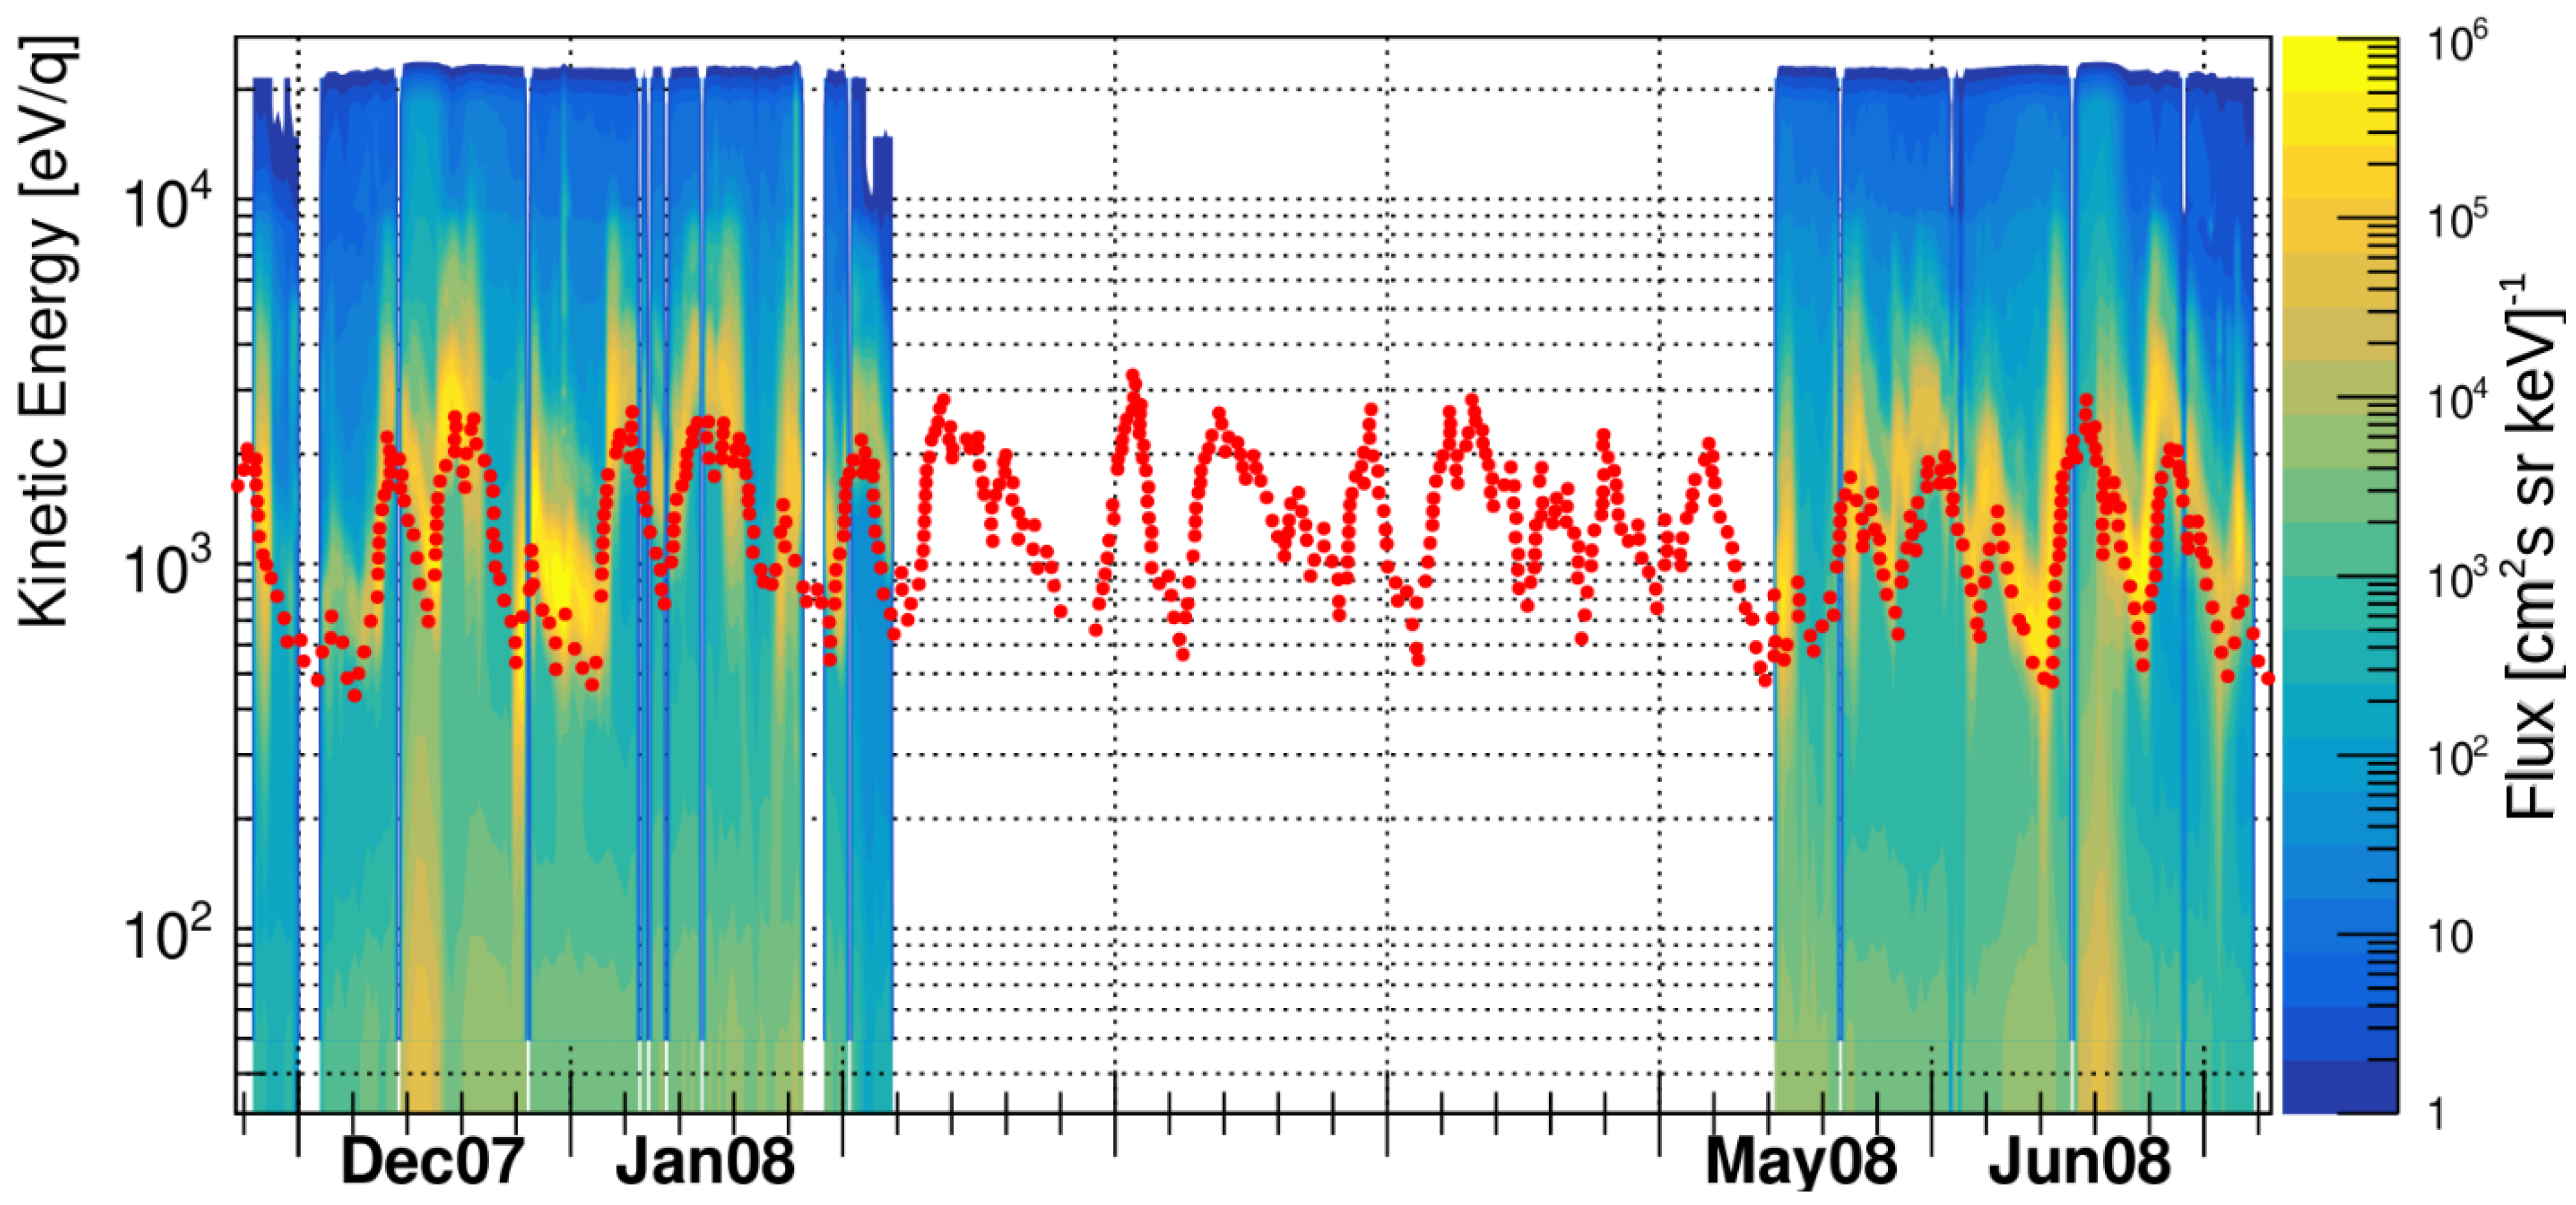
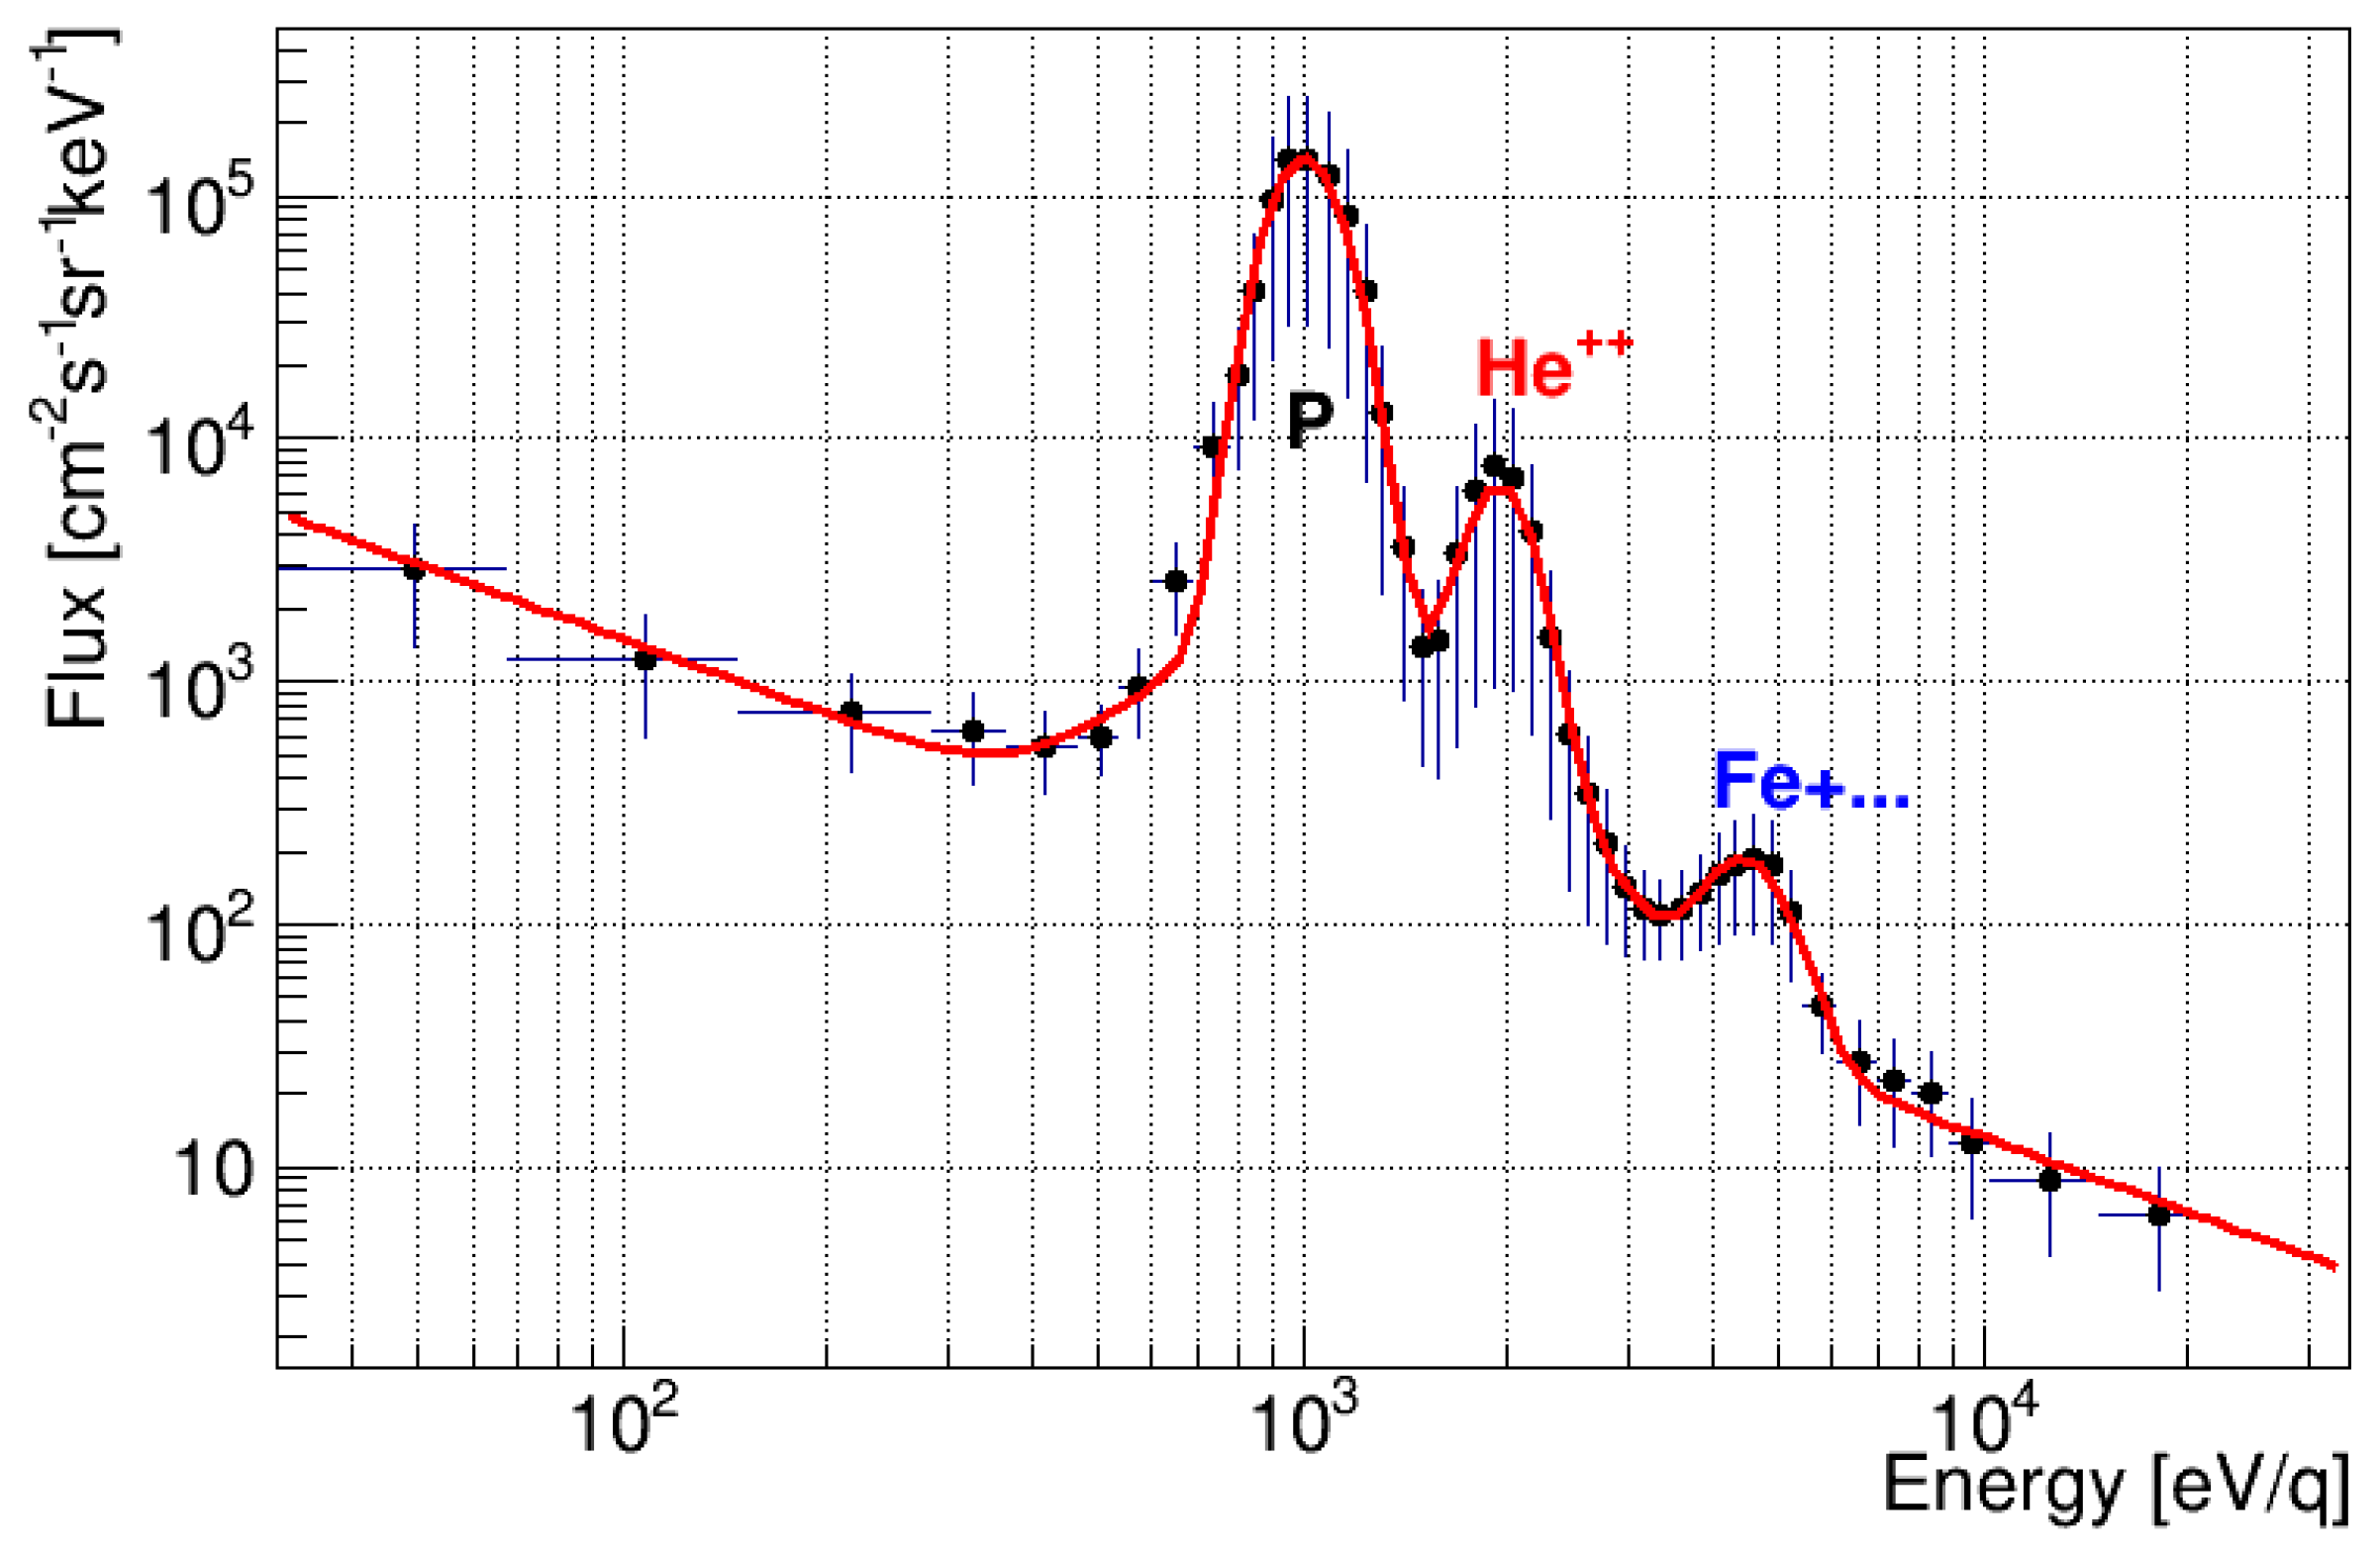
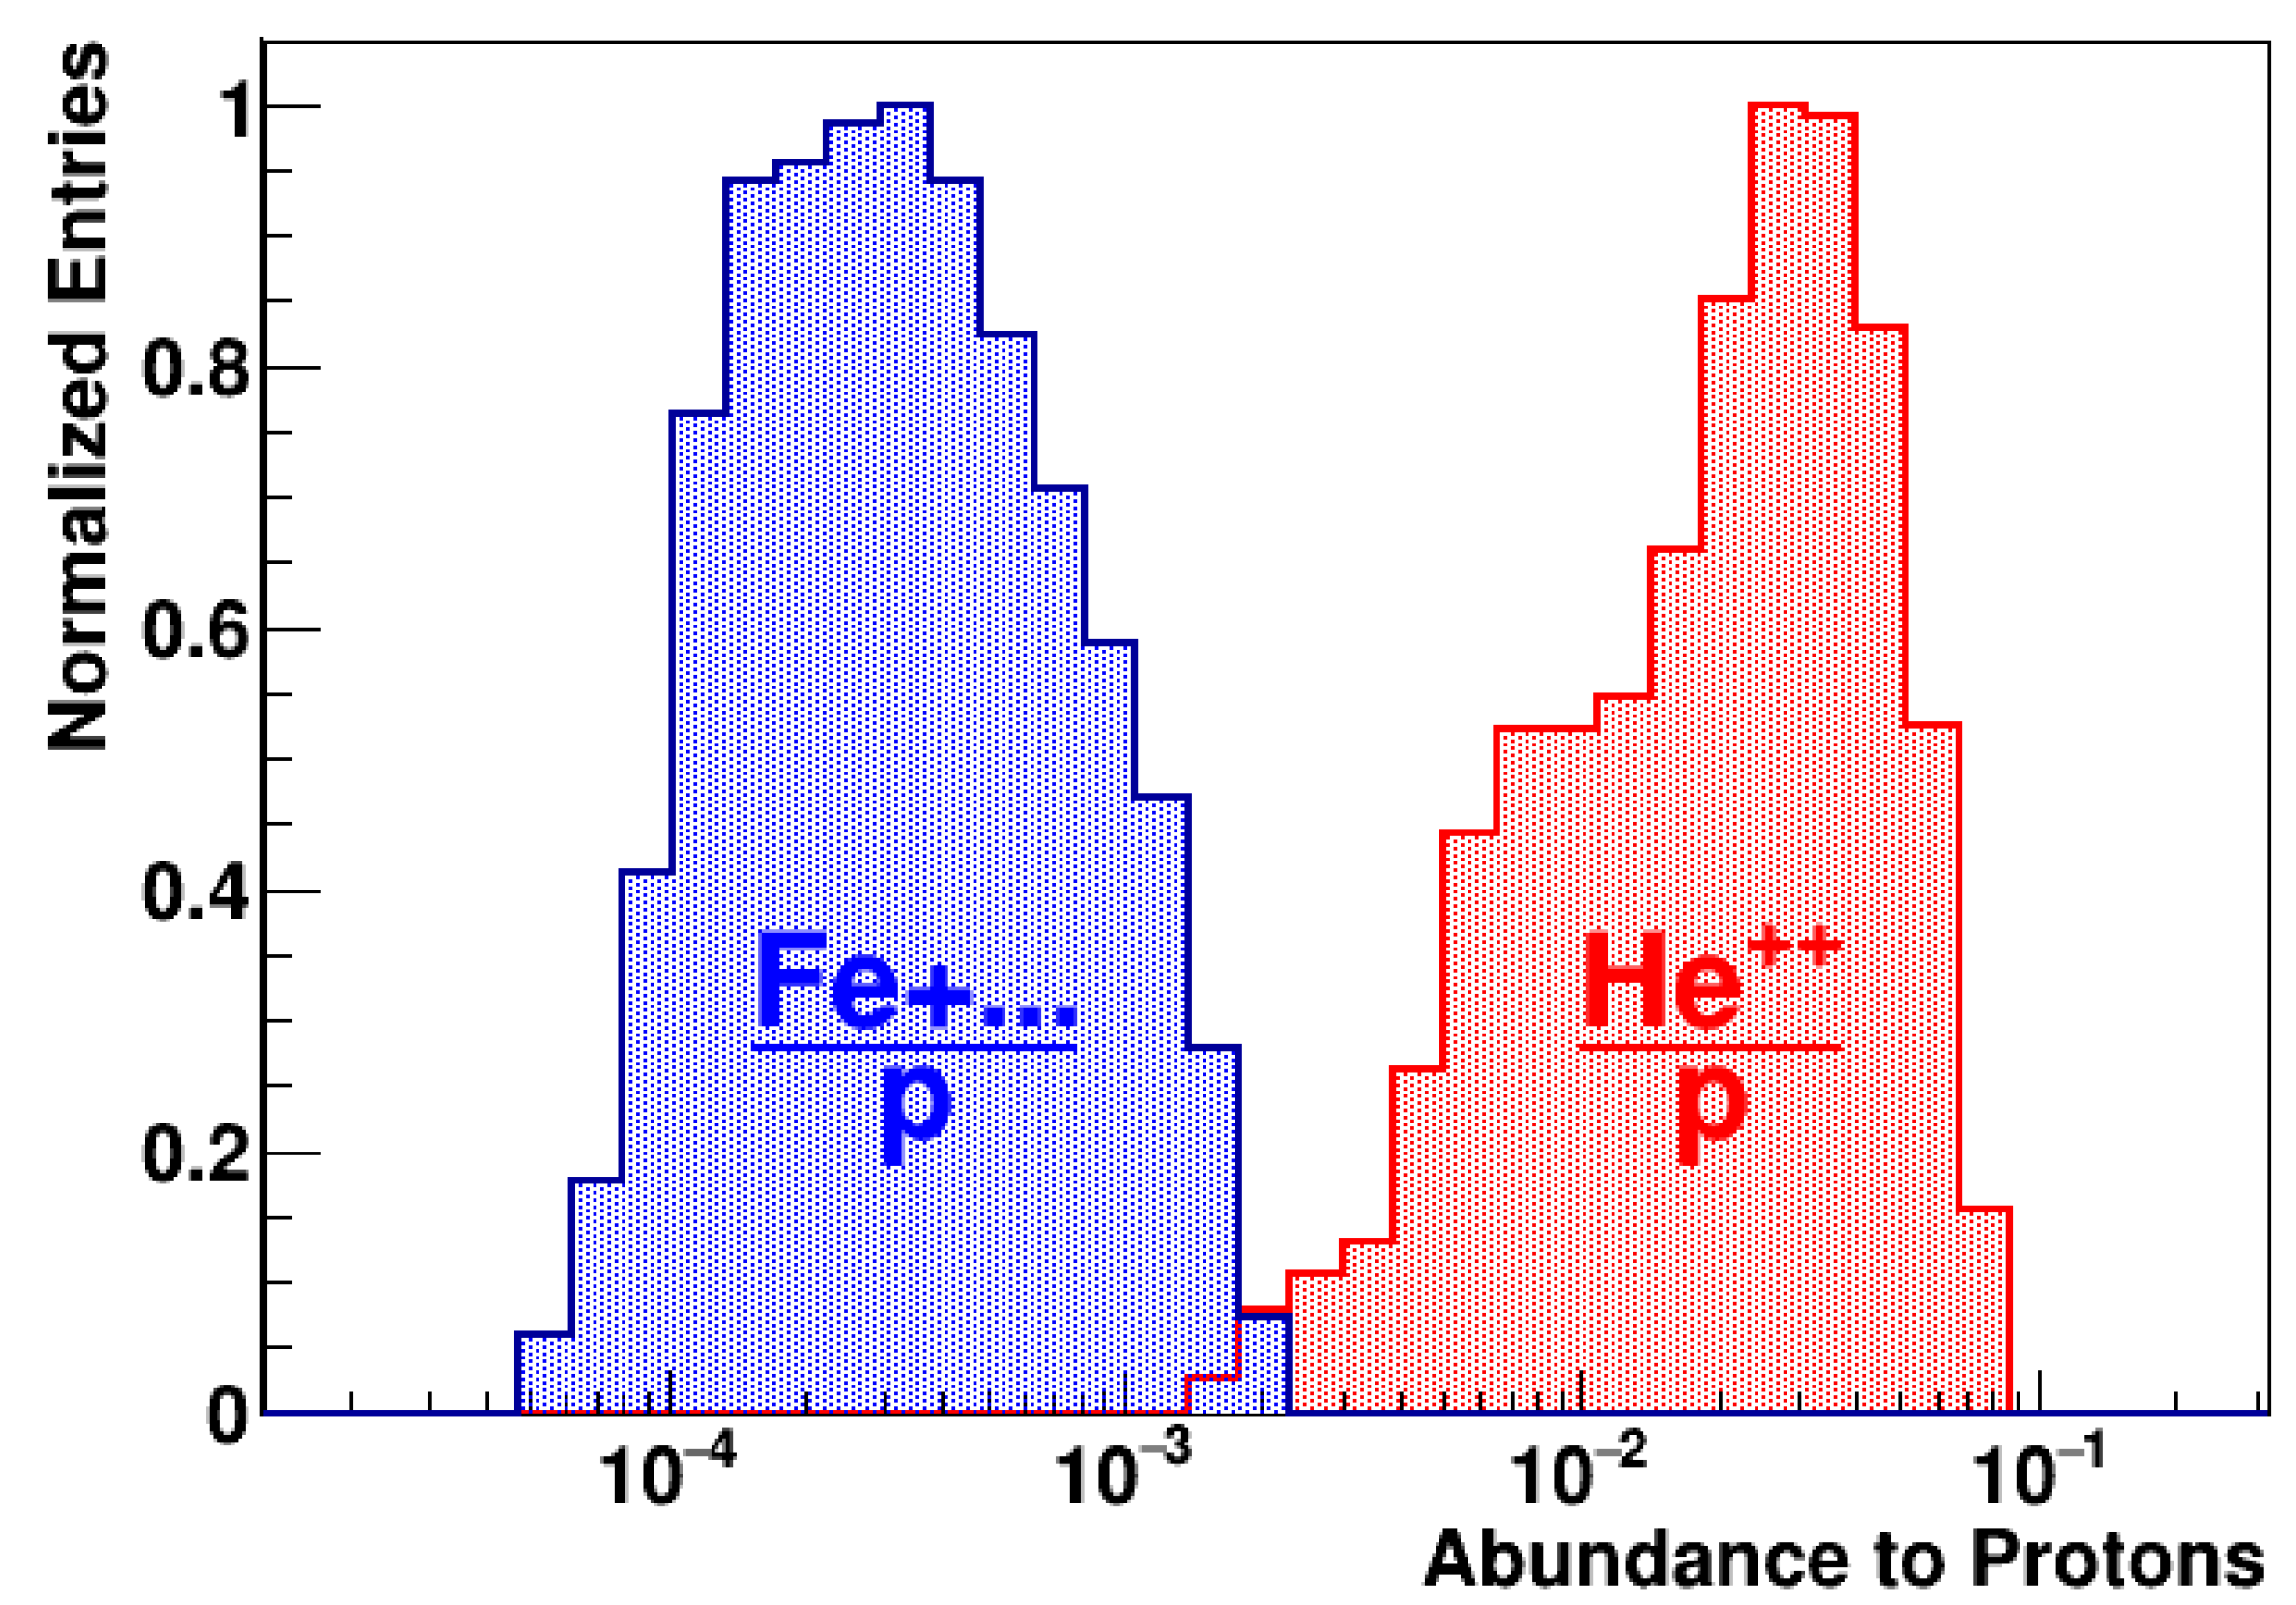
The solar wind flux, as measured by a specific SWID channel, is at maximum when the Sun lies in the FoV of that channel (cos θ s u n = 1). Considering the 6.7° × 15° FWHM distributions of each channel (Figure 1) the angular resolution of SWID channels is expected to be of the order of a few degrees. Such a modest resolution is not enough to detect the details of the Sun’s surface structure, but, thanks to the absence of a strong lunar magnetosphere, an image of the Sun in the sky as a source of the solar wind ions can be produced by stacking all the SWIDA/B measurements.
This is shown in Figure 2, a charged particle image of our star obtained by Chang’E-1 that can be compared with the other existing multimessenger images of the Sun, namely: gamma rays from Fermi-LAT [17] and neutrinos from Super-Kamiokande [18].
A similar image of the Sun cannot be obtained with a detector orbiting the Earth due to the deflection of slow charged particle in magnetic fields.

5. Solar Wind Flux

The Chang’E-1 solar wind flux measurement as a function of time shown in Figure 3, it is obtained by juxtaposing all the flux measurements for SWID channels that lies within 15° from the expected Sun position. During the Chang’E-1 SWIDs data taking: December/2007–February/2008 and May/2008–July/2008 the Sun was experiencing a Solar minimum activity, at the end of the cycle 23. Despite the minimum of Sun activity, variations in the number of sunspots and in the magnitude of solar flares was recorded. Such variations in Sun activity are confirmed by the variations of intensity and velocity of the flux measured by Chang’E-1, shown in Figure 3. In particular, there is a very good correlation of the average kinetic energy measured by Chang’E-1 with the one inferred by solar wind velocity measured by ACE [19] orbiting the Sun-Earth L1 Lagrange point in the same period (red dots).
Finally, also the solar wind chemical composition is known to vary with Sun activity. Typical energy distribution measured by Chang’E-1 is shown in top plot of Figure 4. The SWID spectrometers cannot identify the particle mass; however, three peaks can be recognized over the spectrometer background. The main peak is due to the abundant flux of protons.
The second peak is dominated by doubly ionized Helium, He + + , whereas the third small bump is a superposition of heavier ionized elements, mainly Oxygen, Silicon, and Iron [12]. In the bottom plot of Figure 4 the relative amplitude of these components during the Chang’E-1 data taking periods is shown. In particular, as expected, the He + + abundance in the solar wind is just a few % whereas the abundance of heavier elements is below ‰.

6. Conclusions

Solar Wind Ion Detectors were able to measure the solar wind and the plasma environment near the Moon, onboard the Chang’E-1 orbiter. SWIDs was able to provide an interesting picture of the Sun based on charged particles, enriching the collection of multimessenger information of our star. The correlation of the flux variability and spectrum as measured by Chang’E-1 with respect to the other existing solar activity indicators can be of large interest from the point of view of space weather studies and related applications.

Institutional Review Board Statement

Not applicable.

Informed Consent Statement

Not applicable.

Data Availability Statement

Moon Mapping data hub: https://solarsystem.ssdc.asi.it/moonmapping/ (accessed on 13 July 2021).

References

  1. Scaioni, M.; Giommi, P.; Brunetti, M.T.; Carli, C.; Cerroni, P.; Cremonese, G.; Forlani, G.; Gamba, P.; Lavagna, M.; Melis, M.T.; et al. The ‘moon mapping’ project to promote cooperation between students of italy and China. Int. Arch. Photogramm. Remote Sens. Spat. Inf. Sci. 2016, XLI-B6, 71–78. [Google Scholar] [CrossRef] [Green Version]
  2. Giommi, P.; Brunetti, M.T.; Carli, C.; Cerroni, P.; Cremonese, G.; Forlani, G.; Gamba, P.; Lavagna, M.; Melis, M.T.; Scaioni, M.; et al. Results from the Moon Mapping Project. 2018 Italy-China Science, Technology and Innovation Week. Available online: https://www.ssdc.asi.it/news/MoonMapping_textbook_ItalyChinaWeek2018.pdf (accessed on 13 July 2021).
  3. Domingo, V.; Fleck, B.; Poland, A.I. The SOHO Mission: An Overview. Sol. Phys. 1995, 162, 1–37. [Google Scholar] [CrossRef]
  4. Gloeckler, G.; Cain, J.; Ipavich, F.; Tums, E.; Bedini, P.; Fisk, L.; Zurbuchen, T.; Bochsler, P.; Fischer, J.; Wimmer-Schweingruber, R.; et al. Investigation of the composition of solar and interstellar matter using solar wind and pickup ion measurements with SWICS and SWIMS on the ACE spacecraft. Space Sci. Rev. 1998, 86, 497–539. [Google Scholar] [CrossRef]
  5. Ogilvie, K.W.; Chornay, D.J.; Fritzenreiter, R.J.; Hunsaker, F.; Keller, J.; Lobell, J.; Miller, G.; Scudder, J.D.; Sittler, E.C., Jr.; Torbert, R.B.; et al. SWE, a comprehensive plasma instrument for the WIND spacecraft. Space Sci. Rev. 1995, 71, 55–77. [Google Scholar] [CrossRef]
  6. Kaiser, M. The STEREO mission: An overview. Adv. Space Res. 2005, 36, 1483–1488. [Google Scholar] [CrossRef]
  7. Wenzel, K.P.; Marsden, R.G.; Page, D.E.; Smith, E.J. The ULYSSES Mission. Astron. Astrophys. Suppl. 1992, 92, 207. Available online: https://ui.adsabs.harvard.edu/abs/1992A&AS...92..207W (accessed on 13 July 2021).
  8. Carlson, C.W.; McFadden, J.P.; Ergun, R.E.; Temerin, M.; Peria, W.; Mozer, F.S.; Klumpar, D.M.; Shelley, E.G.; Peterson, W.K.; Moebius, E.; et al. FAST observations in the downward auroral current region: Energetic upgoing electron beams, parallel potential drops, and ion heating. Geophys. Res. Lett. 1998, 25, 2017–2020. [Google Scholar] [CrossRef]
  9. Reigber, C.; Lühr, H.; Schwintzer, P. CHAMP mission status. Adv. Space Res. 2002, 30, 129–134. [Google Scholar] [CrossRef]
  10. Kato, M.; Sasaki, S.; Takizawa, Y. The Kaguya Mission Overview. Space Sci. Rev. 2010, 154, 3–19. [Google Scholar] [CrossRef]
  11. Bhardwaj, A.; Barabash, S.; Futaana, Y.; Kazama, Y.; Asamura, K.; McCann, D.; Sridharan, R.; Holmstrom, M.; Wurz, P.; Lundin, R. Low energy neutral atom imaging on the Moon with the SARA instrument aboard Chandrayaan-1 mission. J. Earth Syst. Sci. 2005, 114, 749–760. [Google Scholar] [CrossRef] [Green Version]
  12. Bame, S.J. Spacecraft Observations of the Solar Wind Composition. NASA Spec. Publ. 1972, 308, 535. Available online: https://ui.adsabs.harvard.edu/abs/1972NASSP.308..535B (accessed on 13 July 2021).
  13. Huixian, S.; Shuwu, D.; Jianfeng, Y.; Ji, W.; Jingshan, J. Scientific objectives and payloads of Chang’E-1 lunar satellite. J. Earth Syst. Sci. 2005, 114, 789–794. [Google Scholar] [CrossRef]
  14. Kong, L.G.; Wang, S.J.; Wang, X.Y.; Zhang, A.B.; Zhu, G.W.; Yu, D.J.; Ren, Q.Y.; Reme, H.; Aoustin, C.; Zhang, X.G.; et al. In-flight performance and preliminary observational results of Solar Wind Ion Detectors (SWIDs) on Chang’E-1. Planet. Space Sci. 2012, 62, 23–30. [Google Scholar] [CrossRef]
  15. Zhang, T.; Sun, Y.; Tang, Z. 3D visualization of solar wind ion data from the Chang’E-1 exploration. Comput. Geosci. 2011, 37, 1711–1718. [Google Scholar] [CrossRef]
  16. ASI/SSDC Data Hub. Available online: https://solarsystem.ssdc.asi.it/moonmapping/ (accessed on 13 July 2021).
  17. Ajello, M.; Baldini, L.; Bastieri, D.; Bellazzini, R.; Berretta, A.; Bissaldi, E.; Blandford, R.D.; Bonino, R.; Bruel, P.; Buson, S.; et al. First Fermi-LAT Solar Flare Catalog. Astrophys. J. Suppl. Ser. 2021, 252, 13. [Google Scholar] [CrossRef]
  18. Super-Kamiokande Official Website. Available online: http://www-sk.icrr.u-tokyo.ac.jp/sk/sk/solar-e.html (accessed on 13 July 2021).
  19. King, J.H. Solar wind spatial scales in and comparisons of hourly Wind and ACE plasma and magnetic field data. J. Geophys. Res. 2005, 110. [Google Scholar] [CrossRef]
Figure 1. Basic principle diagram of SWID. The orbit of the Chang’E-1 spacecraft allows scaning a large fraction of the sky in the field of view of the SWIDs.
Psf 02 00016 g001aPsf 02 00016 g001b
Figure 2. Sun centered solar wind flux map as measured by Chang’E-1. The apparent angular size of the Sun in this map is compatible with the 15° FWHM angular aperture of the Chang’E-1 SWID channels.
Psf 02 00016 g002
Figure 3. Solar wind flux measured by Chang’E−1 as a function of time and kinetic energy. The time variation of the average kinetic energy are in good correlation with the measured solar wind velocity by ACE (red dots).
Psf 02 00016 g003
Figure 4. Top plot: typical solar wind energy distribution measured by SWIDs. Bottom plot: relative abundances of He + + (red) and heavier ions (blue) measured during Chang’E−1 mission.
Psf 02 00016 g004aPsf 02 00016 g004b
Table 1. Example of a record of a SWIDA data file.
Data ItemUnitSample
TimeTimestamp2007-11-26T21:10:40.893Z
Flux[keV cm 2 s sr] 1 a [48 × 12] matrix
GSE cooEarth radii−48.5635, −30.1448, 4.4484
MCC cookm−172.1049, −21.0871, 1945.3538
Sun angleDeg.84.2097, 158.3941, 110.7401
Quality stat.Bit-coded0 × 0000FF
Publisher’s Note: MDPI stays neutral with regard to jurisdictional claims in published maps and institutional affiliations.

