1. Introduction
The focus of medical care has shifted to health promotion and disease prevention rather than disease treatment, owing to the improvement of living standards and the development of medical technology. As a result, provider-oriented medical services have been rapidly converted to consumer-oriented medical services. As the demand for medical care increases, the demand for clinical decision support (CDS) is increasing in the health care sector since it allows medical personnel to treat patients safely and efficiently [
1]. In particular, in primary medical care, medical personnel need to make various decisions regarding what kind of examination should be used to diagnose patients and how to treat them. CDS is designed to help medical personnel working in the primary medical care setting make decisions on diagnosis or treatments [
2]. CDS means a support to improve the quality of medical services by applying evidence-based knowledge at the time of treatment based on accumulated clinical data [
2].
Meanwhile, in primary medical care, Parkinson’s disease is known as the second most common degenerative disease in old age after Alzheimer’s disease [
3]. Since the rate of aging in South Korea is the fastest in the world, it is expected that the prevalence of Parkinson’s disease will increase even further in the future [
4].
The symptoms of Parkinson’s disease can be divided into motor symptoms such as tremor and stiffness and non-motor symptoms such as cognitive impairment. Depression, among non-motor symptoms, occurs most frequently in patients with Parkinson’s disease, and it has been reported that one out of every two patients with Parkinson’s disease suffers from it [
5,
6]. Although depression was frequently reported in patients with Parkinson’s disorder, the Global Parkinson’s Disease Survey Steering Committee (2002) [
7] indicated that only 1% of them recognized that they had depression. To make it worse, depressive symptoms are similar to the symptoms of dementia such as apathy, as well as the symptoms of Parkinson’s disease such as attention deficit, lethargy, and sleep disorders. As a result, it is difficult for caregivers of Parkinson’s disease patients to detect depression early. Consequently, it is an important health issue in primary health care to detect and prevent depression in Parkinson’s disease patients as soon as possible.
Recently, machine learning such as SVM and random forest has been used as a method to identify predictors of Parkinson’s disease [
8,
9,
10]. Among them, the stacking ensemble machine, which improves the accuracy by combining two or more single machine learning with a meta-model, can reduce the risk of bias that a single machine learning model can have [
11]. Moreover, it has been confirmed that its accuracy is higher in predicting outcome variables [
11]. It uses a stacking ensemble machine algorithm to obtain better prediction performance than the performance obtained from a single algorithm. This stacking ensemble has been applied to various topics such as classification, regression, anomaly detection, and feature selection.
Nevertheless, there are still not enough studies that predicted a disease using the stacking ensemble machine and medical data. This preliminary study used the stacking ensemble to explore major factors that could predict depression in patients with Parkinson’s disease and presented baseline data for developing a nomogram prognostic index for predicting high-risk groups for depression among patients with Parkinson’s disease in the future.
2. Method
2.1. Data Source
This is a secondary data use study that analyzed Parkinson’s disease epidemiologic (PED) data after receiving approval (No. KBN-2019-1327) from the Distribution Committee and approval (No. KBN-2019-005) from the Research Ethics Review Committee of the National Biobank of Korea and Korea Centers for Disease Control and Prevention. The design and administration of PDE data are described in detail elsewhere [
8]. This study targeted 238 patients with Parkinson’s disease who were 65 years or older.
2.2. Measurement
Depression, an outcome variable, was divided into “with depression” and “without depression” using the Geriatric Depression Scale-30 (GDS-30). The explanatory variables were 35 variables including sociodemographic factors included in the PDE data, health behaviors (e.g., pack-years), environmental factors (e.g., pesticide exposure), medical history (e.g., diabetes), sleep behavior disorders, and motor symptoms related to Parkinson’s disease (e.g., late motor complications), and non-motor symptoms related to Parkinson’s disease (e.g., K-MoCA).
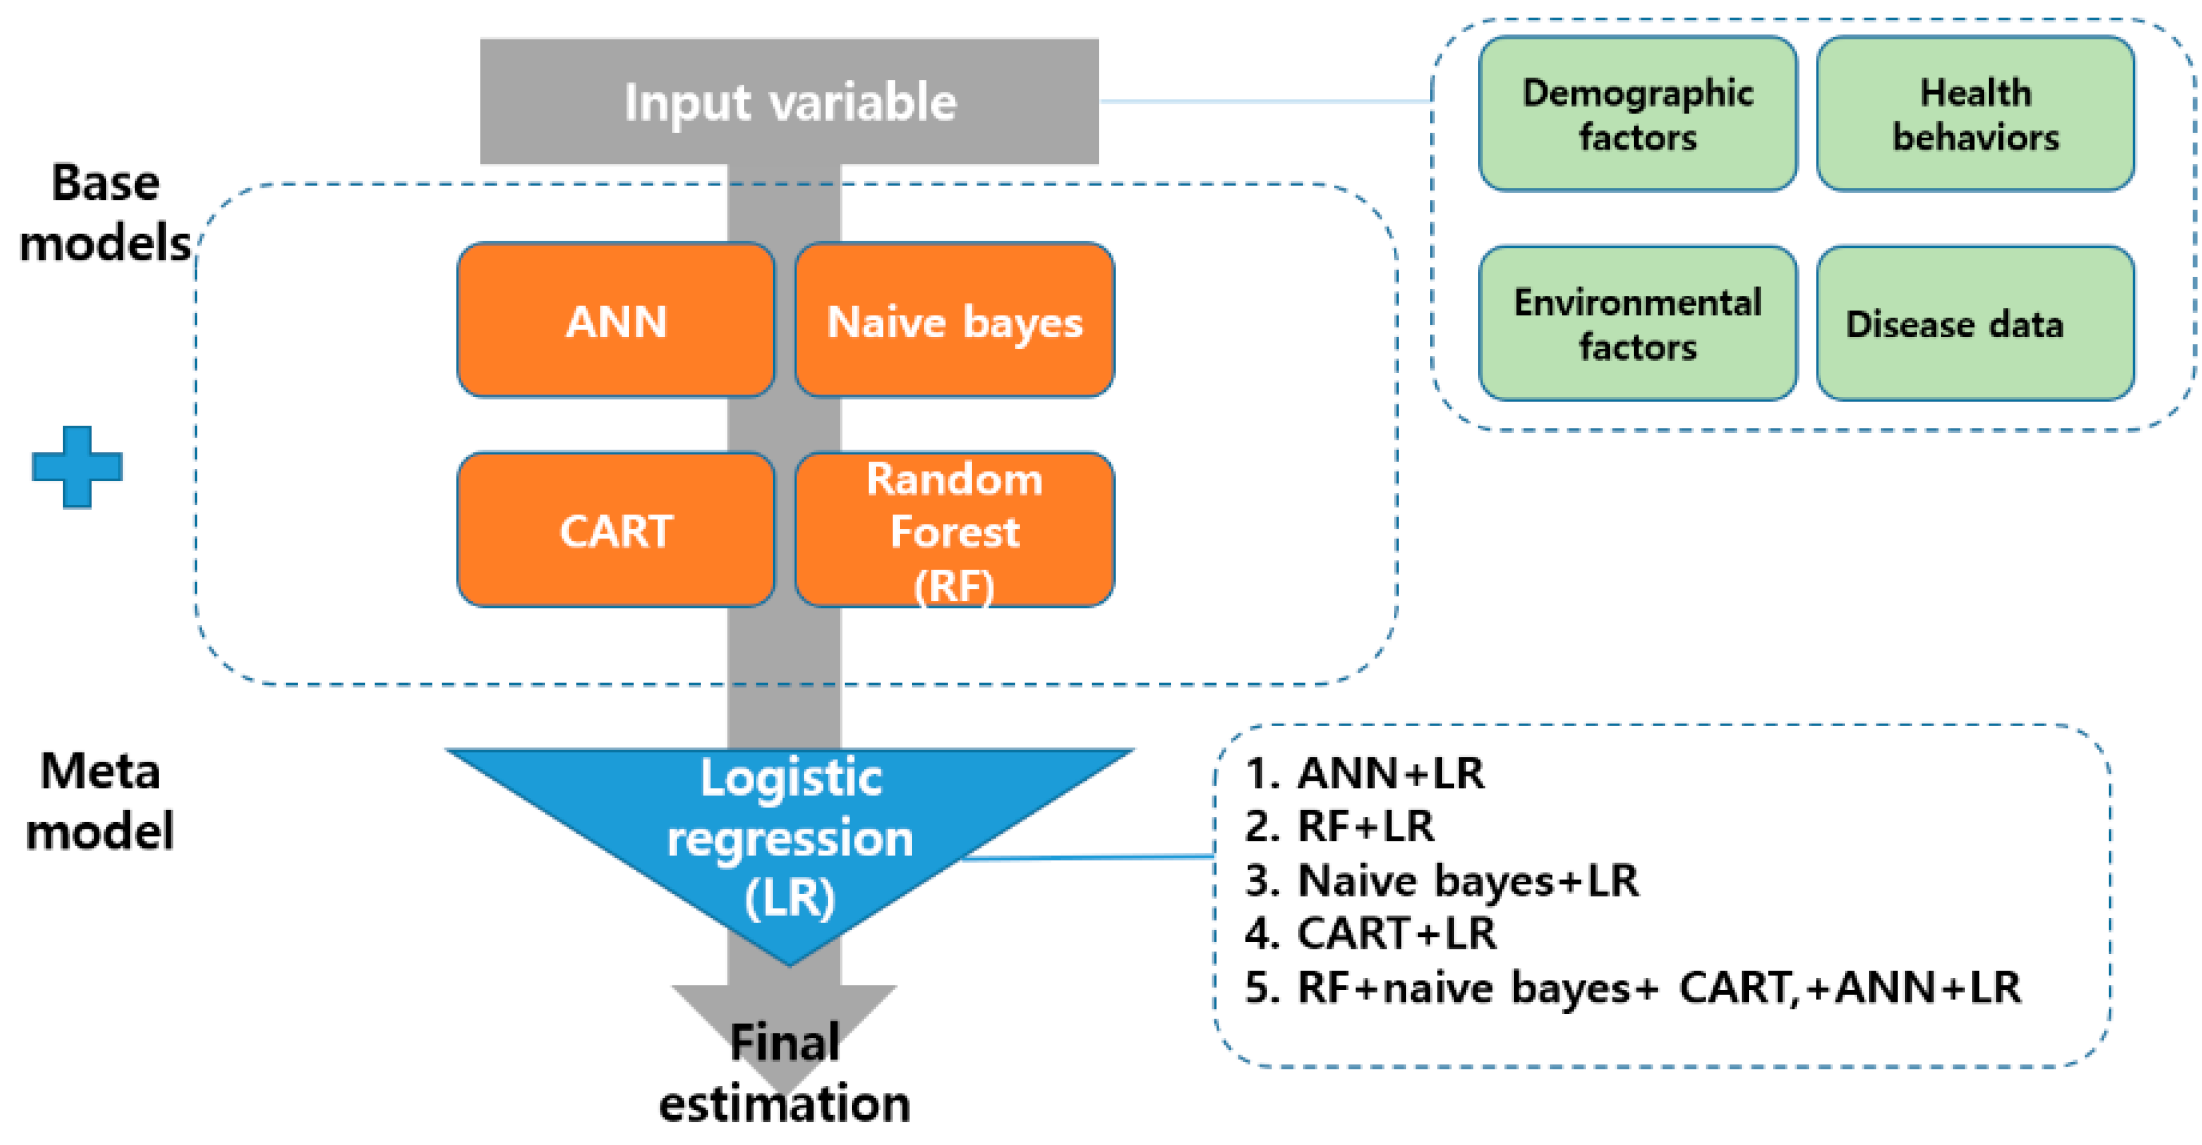
2.3. Stacking Ensemble
The stacking ensemble is a way to create a new model by combining different models as if stacking them in layers [
12]. It is composed of two phases, namely base and meta [
12]. This study used artificial neural network (ANN), random forest, naive bayes model, and classification and regression Trees (CART) as the base-model. The logistic regression (LR) algorithm was applied to the meta-model. The regression algorithm is the simplest way to increase the reliability of the base-model while maximizing the stability of the model. Previous studies [
11,
13] have reported that it is less likely to overfit the training data. This study developed nine machine learning models (ANN, random forest, naive bayes, CART, ANN+LR, random forest+LR, naive bayes+LR, CART+LR, and random forest+naive bayes+CART+ANN+LR). The structure of the stacking ensemble analyzed in this study is presented in
Figure 1.
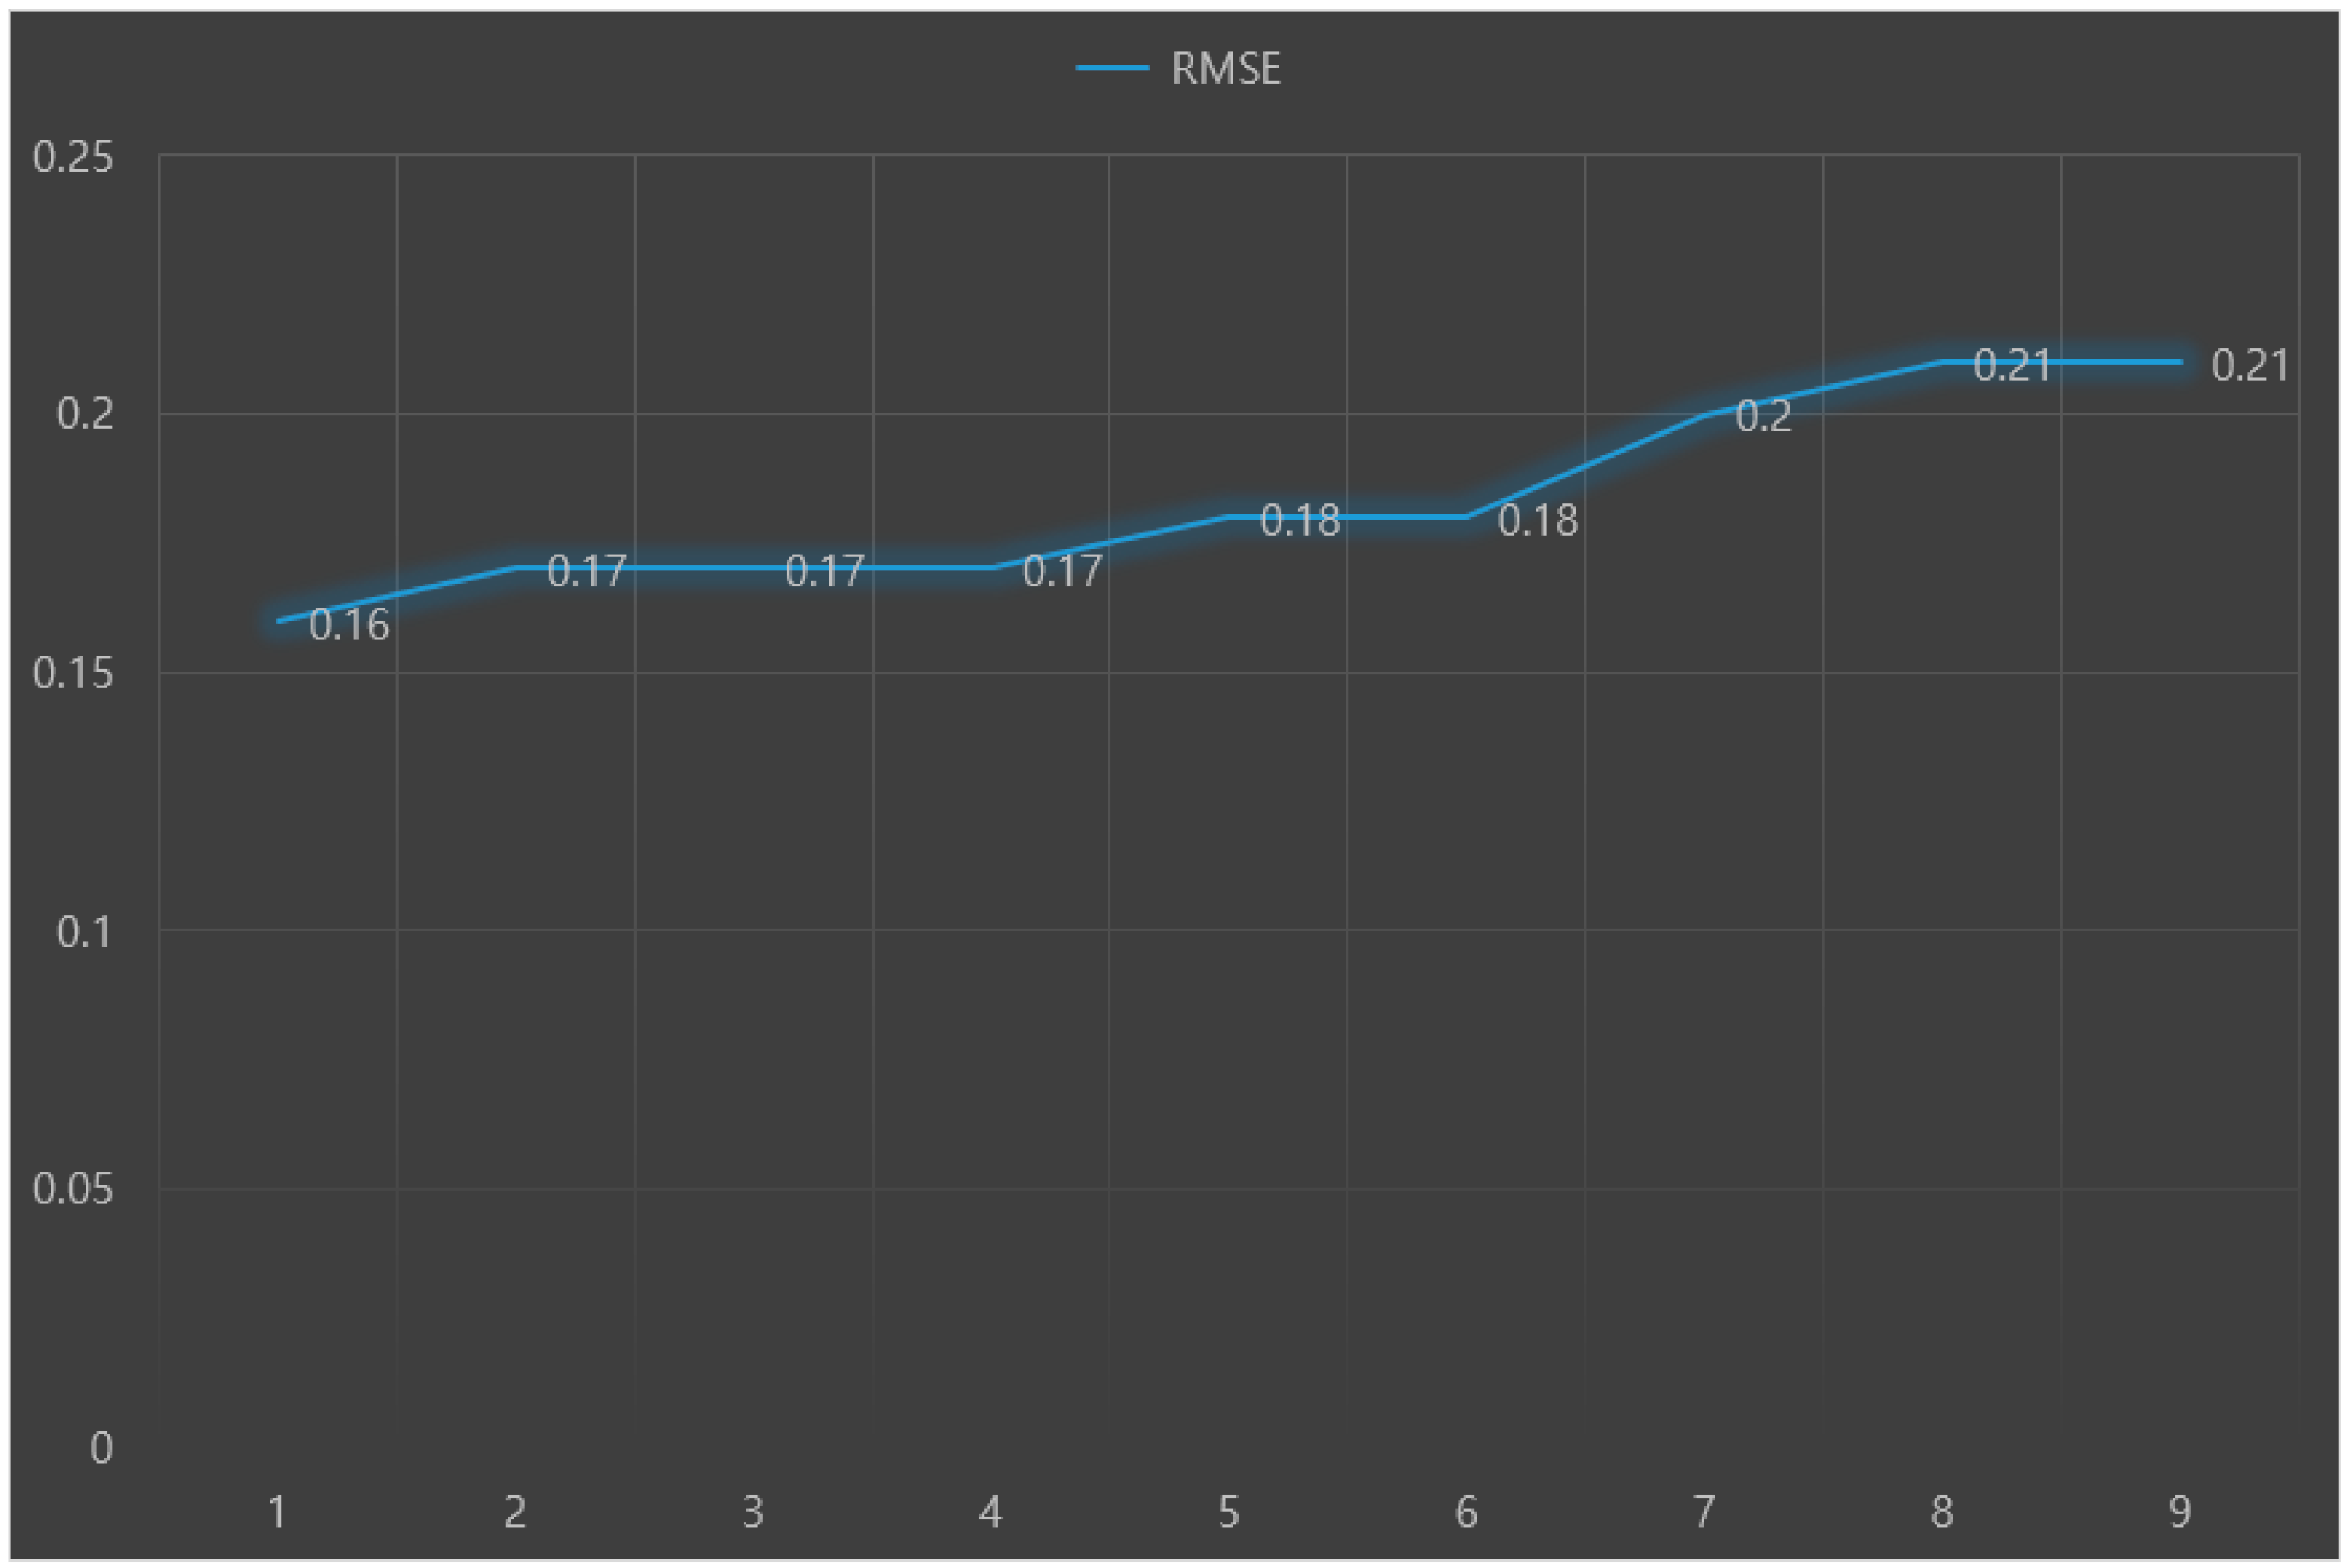
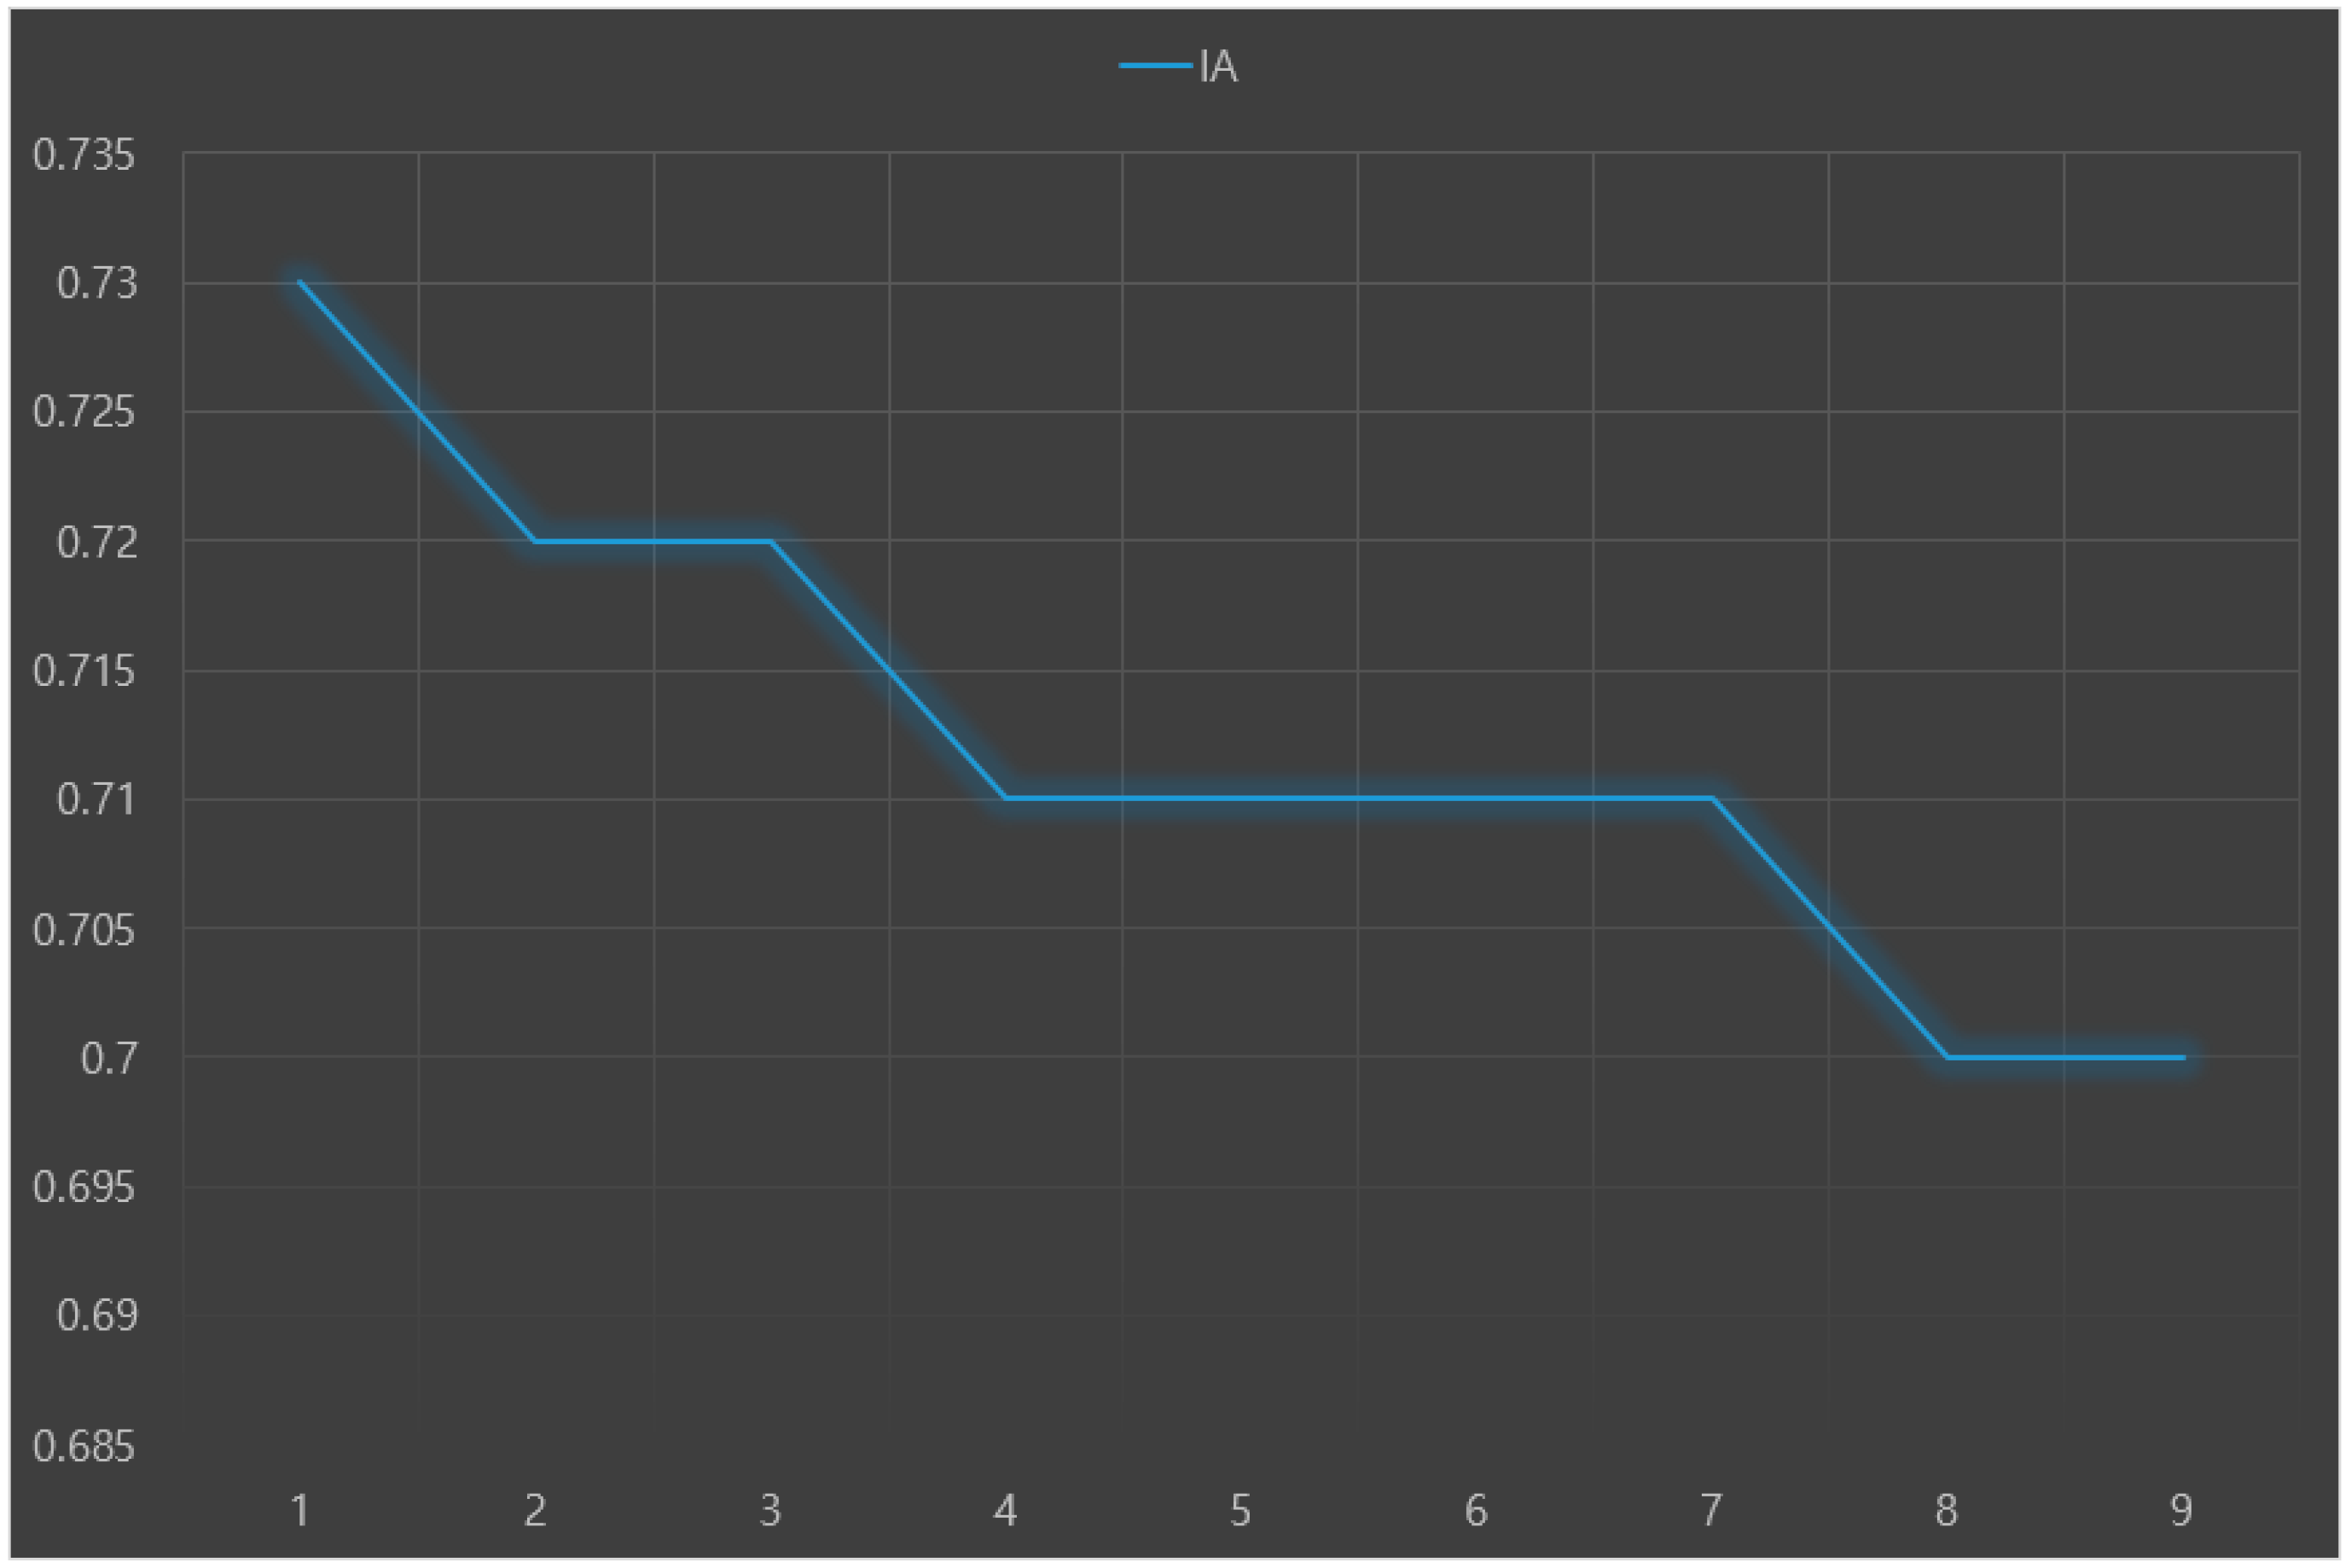
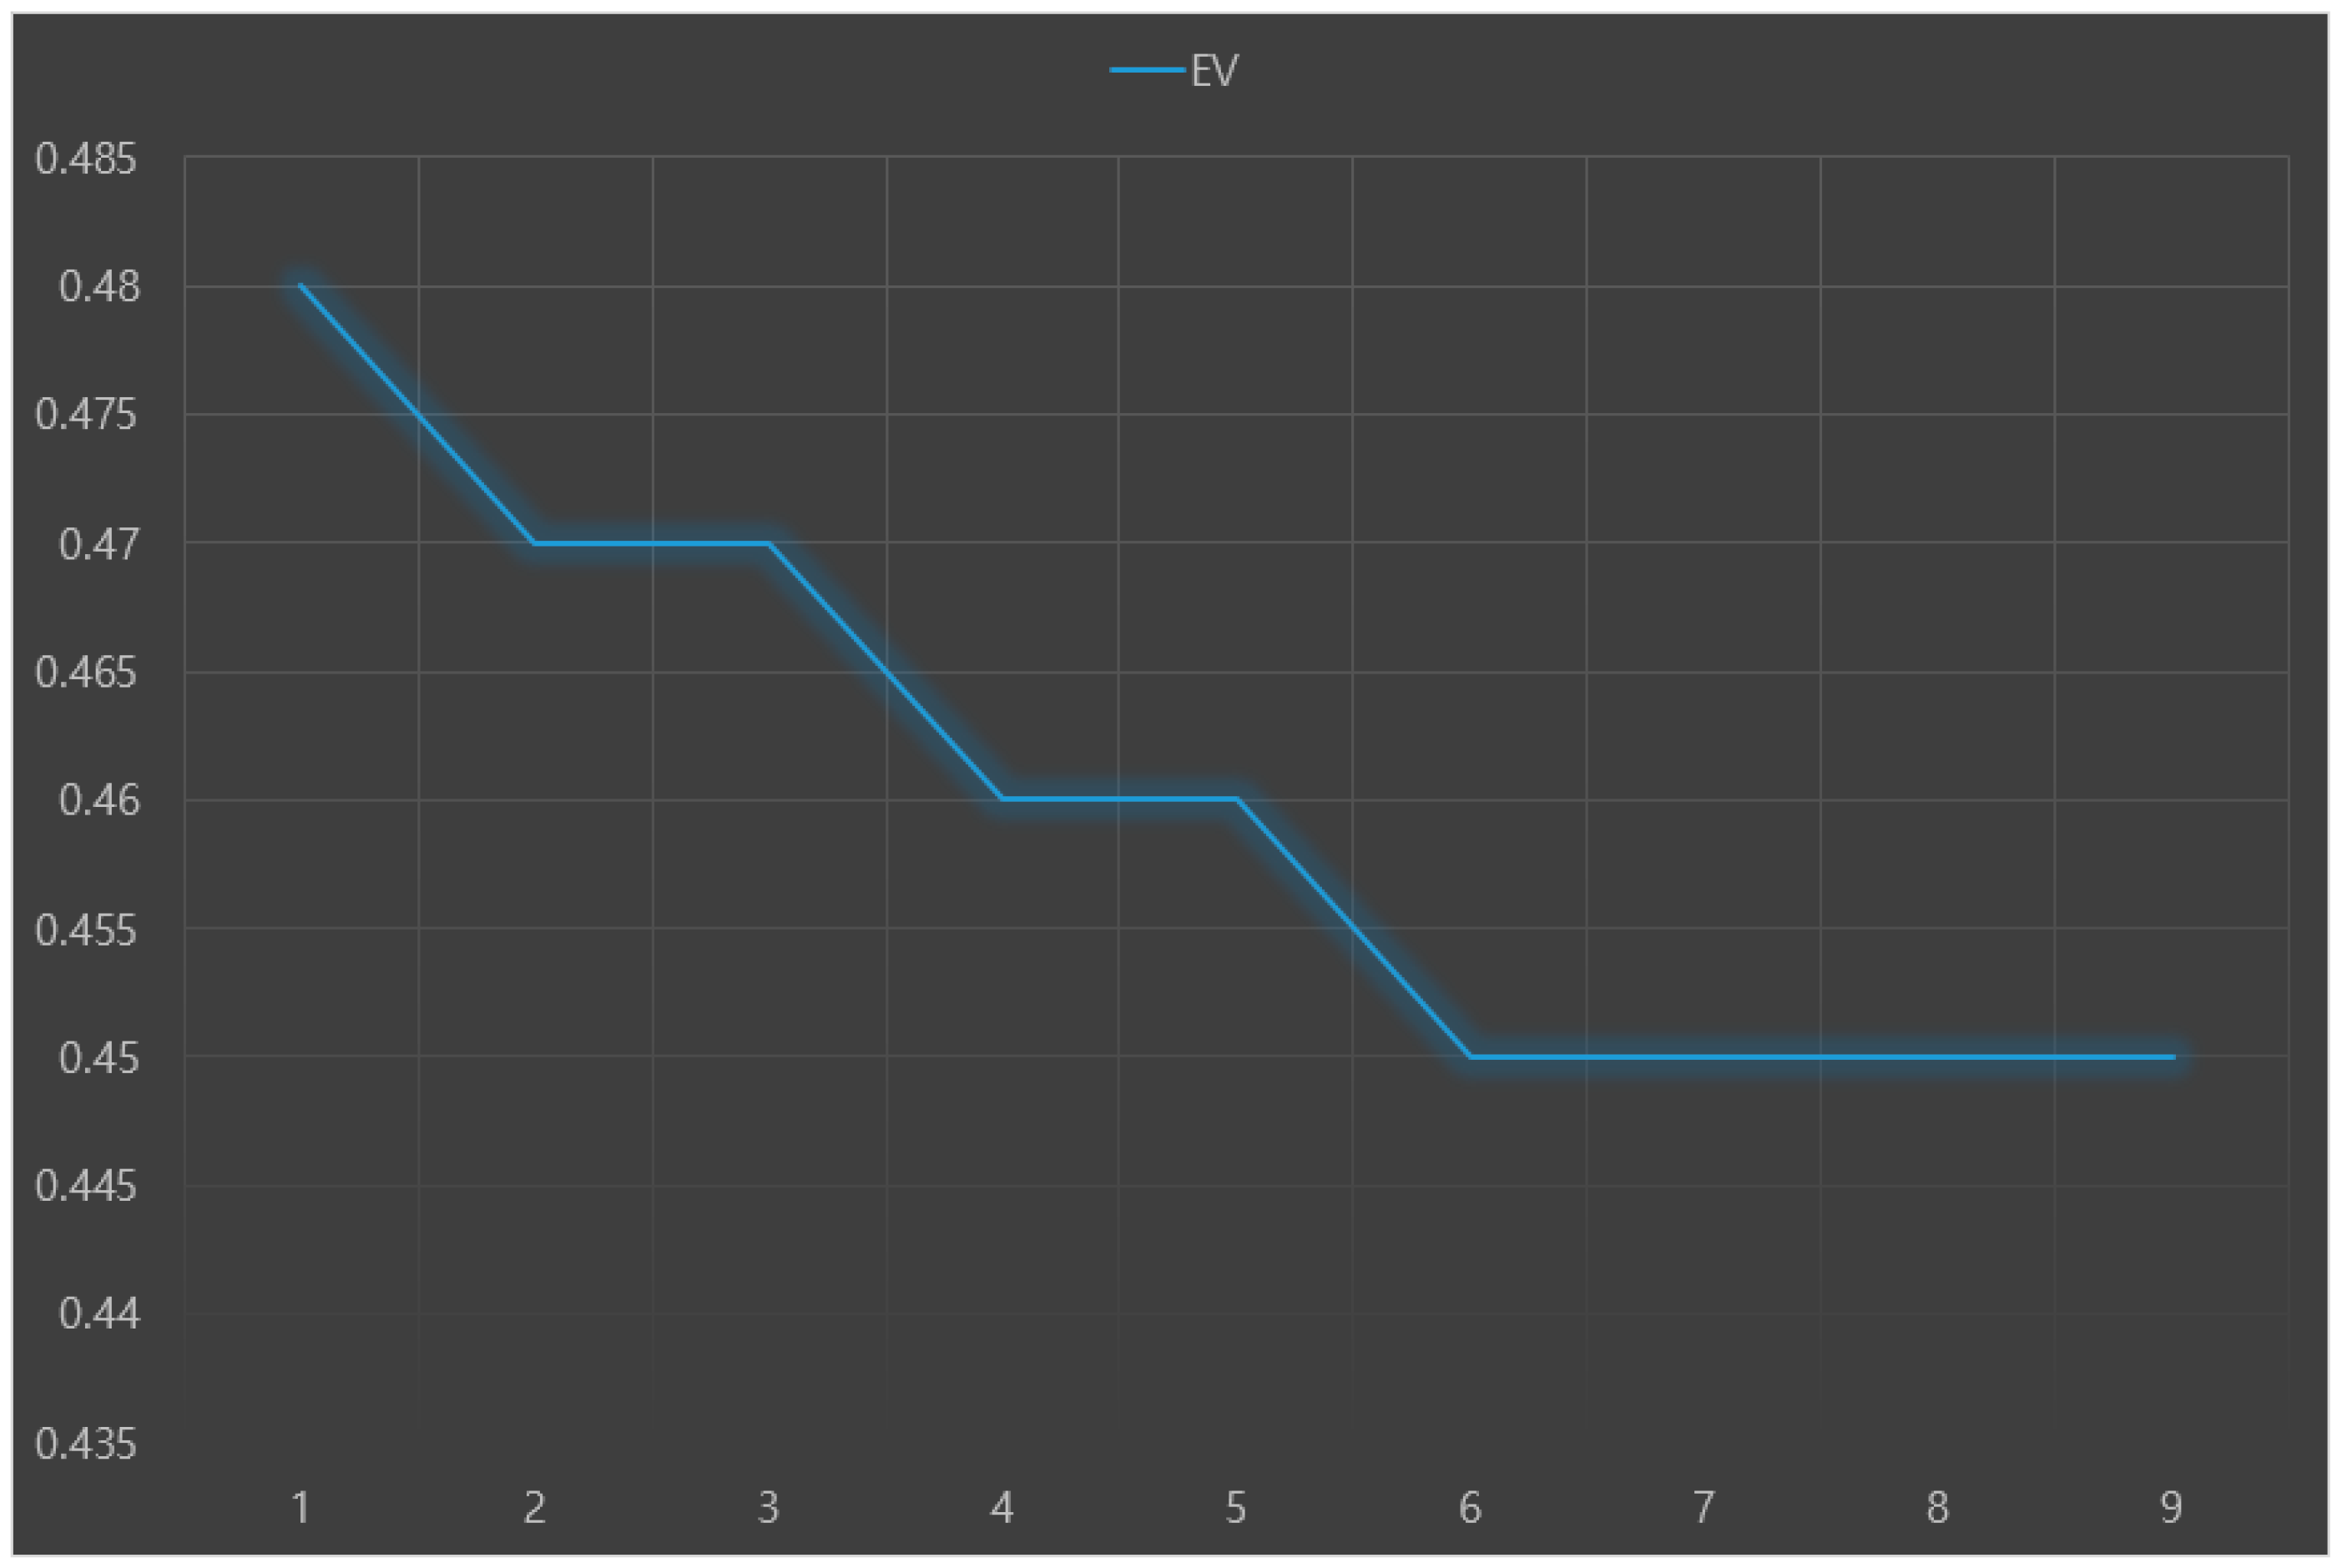
The predictive performance (e.g., accuracy) of each machine learning model was validated through 10-fold cross-validation. Root-mean-square-error (RMSE), index of agreement (IA), and variance of errors (Ev) were used as indices to evaluate predictive performance. A lower RMSE means a higher accuracy of the predictive model. When IA is closer to 1, the model is more stable. A lower Ev is interpreted as a more stable model.
3. Results
3.1. General Characteristics of Subjects
Among 238 subjects, 45.6% (108 subjects) had Parkinson’s disease and depression. The results of chi-square test showed that patients with Parkinson’s disease with depression and patients with Parkinson’s disease without depression had significantly (
p < 0.05) different REM and RBD, K-MMSE, K-MoCA, Global CDR, sum of boxes in CDR, total score of UPDRS, motor score of UPDRS, K-IADL, H and Y staging, and Schwab and England ADL.
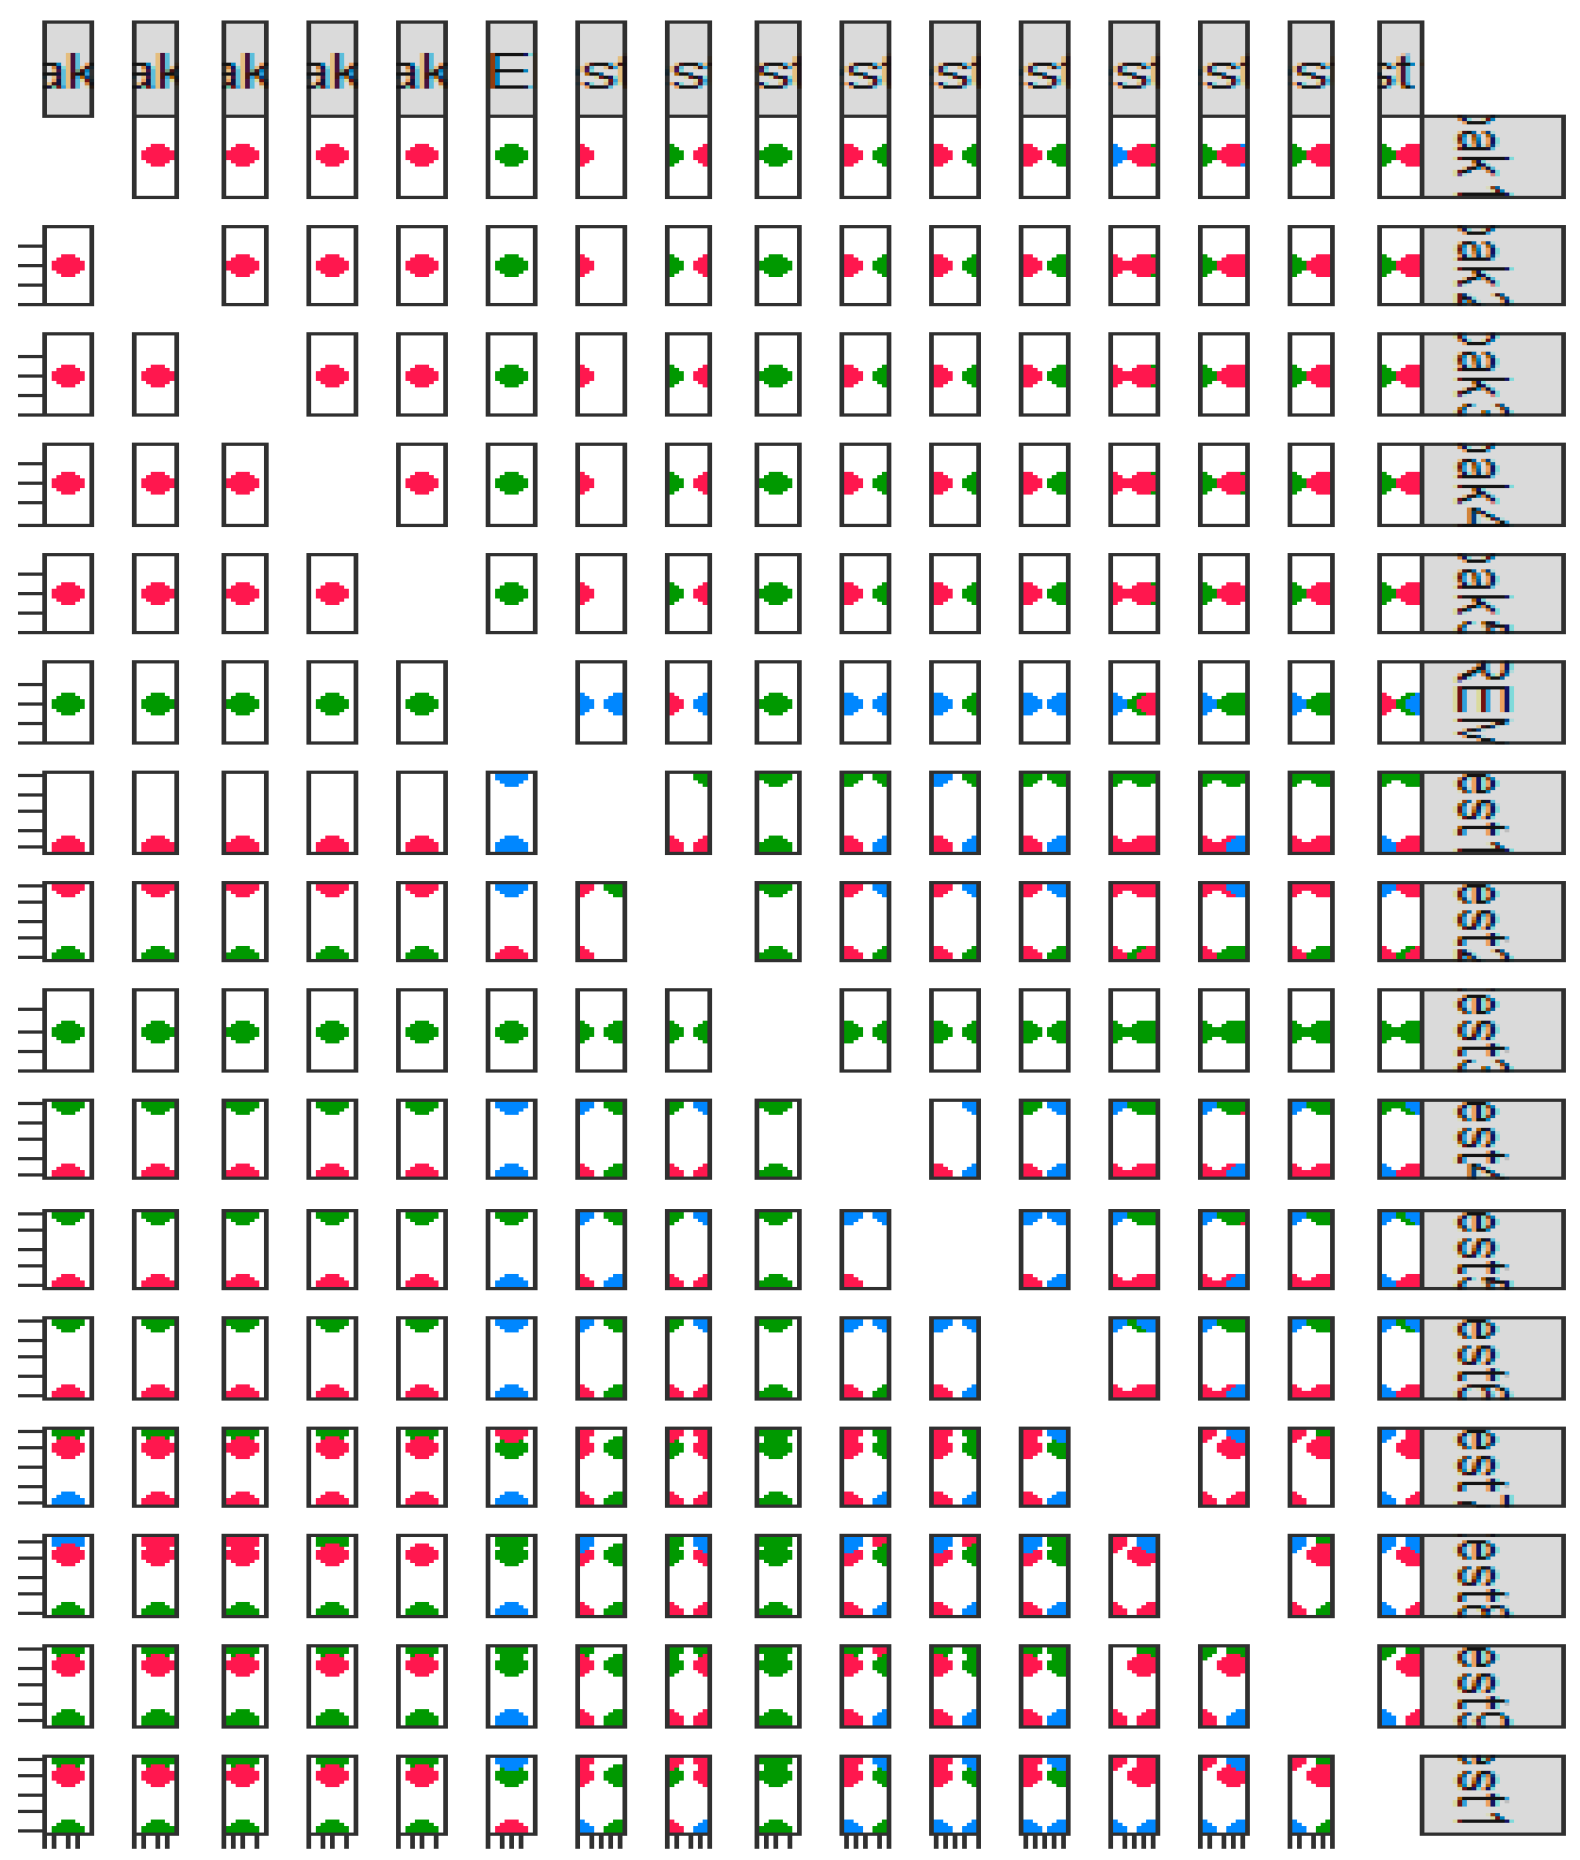
Figure 2 presents the scatterplot matrix of the motor symptom test and non-motor symptom test results of patients with Parkinson’s disease.
3.2. Comparing the Predictive Performance of Base Model and That of Stacking Ensemble Model
The predictive performance results (RMSE, IA, and Ev) of nine machine learning models for predicting Parkinson’s disease with depression are presented in
Figure 3,
Figure 4 and
Figure 5, respectively. The analysis results showed that the random forest+LR had the best predictive performance: RMSE = 0.16, IA = 0.73, and Ev = 0.48.
3.3. Exploring Major Predictors of Parkinson’s Disease with Depression
This study analyzed the normalized importance of the random forest+LR model’s variables (the final model) and confirmed that K-MMSE, K-MoCA, global CDR, sum of boxes in CDR, total score of UPDRS, motor score of UPDRS, K-IADL, H and Y staging, Schwab and England ADL, and REM and RBD were ten major variables with high weight among predictors of Parkinson’s disease with depression in South Korea. Among them, K-MMSE was the most important factor in the final model.
4. Discussion
This preliminary research was conducted to explore the major predictors of Parkinson’s disease with depression using the stacking ensemble to develop a nomogram prognostic index for predicting a high-risk group for Parkinson’s disease in the future. This study compared the accuracy of depression predictive models targeting patients with Parkinson’s disease in South Korea using base-models and the stacking ensemble model. The results showed that the random forest+LR model, a stacking ensemble model, had the best predictive performance.
In this study, the random forest+LR model showed higher accuracy than the random forest+naive bayes+CART+ANN+LR including all base-models. It is difficult to clearly explain why this result was drawn. However, one possible explanation is that overfitting might occur during the parallel stacking process when the base model and the meta-model did not go well. The stacking ensemble is an ensemble method to improve performance, and there is no specific algorithm [
14,
15,
16]. Therefore, more follow-up studies are needed on a specific algorithm of the stacking ensemble model which shows the best predictive performance.
Another finding of this study was K-MMSE, K-MoCA, Global CDR, sum of boxes in CDR, total score of UPDRS, motor score of UPDRS, K-IADL, H and Y staging, Schwab and England ADL, and REM and RBD were found as major variables with high weight in the ensemble model of this study among the predictors of Parkinson’s disease with depression in South Korea.
The limitations of this study are as follows. First, this study developed a stacking ensemble model based on binary classification. In the future, more meaningful conclusions can be reached for disease prediction by developing stacking ensemble models to classify multinomial categories. Second, this paper uses measures such as Ev, RMSE, and IA to evaluate model performance. These measures are commonly used measures for classification problems in stacking ensemble machines. However, absolute comparison in performance evaluation is difficult when the three measures have different trends. Future research will need to find new measures, such as Heidke’s skill score, that are suitable for the classification of specific diseases.
We will develop a nomogram prognostic index to predict high-risk groups for patients with Parkinson’s disease and depression based on the major predictors of Parkinson’s disease with depression derived from this preliminary study. Furthermore, it is necessary as well to develop interpretable machine learning to build a model for predicting depression in patients with Parkinson’s disease that can be used in the medical field.
Funding
This research was funded by Basic Science Research Program through the National Research Foundation of Korea (NRF) funded by the Ministry of Education, Grant Nos. 2018R1D1A1B07041091, 2021S1A5A8062526.
Institutional Review Board Statement
The study was conducted according to the guidelines of the Declaration of Helsinki, and approved by the Institutional Review Board (or Ethics Committee) of National Biobank of Korea under Korea Centers for Disease Control and Prevention (protocol code KBN-2019-1327).
Informed Consent Statement
Informed consent was obtained from all subjects involved in the study.
Conflicts of Interest
The author declares no conflict of interest.
Abbreviations
| RMSE | Root-mean-square-error |
| IA | index of agreement |
| Ev | variance of errors |
| ANN | artificial neural network |
| CART | Classification and Regression Trees |
| LR | Logistic regression |
| REM & RBD | Rapid Eye Movement Sleep Behavior Disorder |
| K-MMSE | Korean-Mini Mental Status Examination |
| K-MoCA | Korean version of Montreal Cognitive Assessment |
| CDR | Clinical Dementia Rating |
| UPDRS | Unified Parkinson’s Disease Rating Scale |
References
- Kilsdonk, E.; Peute, L.W.; Jaspers, M.W. Factors influencing implementation success of guideline-based clinical decision support systems: A systematic review and gaps analysis. Int. J. Med. Inform. 2017, 98, 56–64. [Google Scholar] [CrossRef] [PubMed]
- Pieterse, A.H.; Stiggelbout, A.M.; Montori, V.M. Shared decision making and the importance of time. JAMA 2019, 322, 25–26. [Google Scholar] [CrossRef] [PubMed]
- Rossi, A.; Berger, K.; Chen, H.; Leslie, D.; Mailman, R.B.; Huang, X. Projection of the prevalence of Parkinson’s disease in the coming decades: Revisited. Mov. Disord. 2018, 33, 156–159. [Google Scholar] [CrossRef] [PubMed]
- Baek, J.Y.; Lee, E.; Jung, H.W.; Jang, I.Y. Geriatrics fact sheet in Korea 2021. Ann. Geriatr. Med. Res. 2021, 25, 65–71. [Google Scholar] [CrossRef] [PubMed]
- Reijnders, J.S.; Ehrt, U.; Weber, W.E.; Aarsland, D.; Leentjens, A.F. A systematic review of prevalence studies of depression in Parkinson’s disease. Mov. Disord. 2008, 23, 183–189. [Google Scholar] [CrossRef] [PubMed] [Green Version]
- Wichowicz, H.M.; Slawek, J.; Derejko, M.; Cubala, W.J. Factors associated with depression in Parkinson’s disease: A cross-sectional in a polish population. Eur. Psychiatry 2006, 21, 516–520. [Google Scholar] [CrossRef] [PubMed]
- Global Parkinson’s Disease Survey Steering Committee. Factors impacting on quality of life in Parkinson’s disease: Results from an international survey. Mov. Disord. 2002, 17, 60–67. [Google Scholar] [CrossRef] [PubMed]
- Byeon, H. Predicting the severity of Parkinson’s disease dementia by assessing the neuropsychiatric symptoms with an SVM regression model. Int. J. Environ. Res. Public Health 2021, 18, 2551. [Google Scholar] [CrossRef] [PubMed]
- Avuçlu, E.; Elen, A. Evaluation of train and test performance of machine learning algorithms and Parkinson diagnosis with statistical measurements. Med. Biol. Eng. Comput. 2020, 58, 2775–2788. [Google Scholar] [CrossRef] [PubMed]
- Byeon, H. Comparing ensemble-based machine learning classifiers developed for distinguishing hypokinetic dysarthria from presbyphonia. Appl. Sci. 2021, 11, 2235. [Google Scholar] [CrossRef]
- Byeon, H. Exploring factors associated with the social discrimination experience of children from multicultural families in South Korea by using stacking with non-linear algorithm. Int. J. Adv. Comput. Sci. Appl. 2021, 12, 125–130. [Google Scholar] [CrossRef]
- Khraisat, A.; Gondal, I.; Vamplew, P.; Kamruzzaman, J.; Alazab, A. Hybrid intrusion detection system based on the stacking ensemble of c5 decision tree classifier and one class support vector machine. Electronics 2020, 9, 173. [Google Scholar] [CrossRef] [Green Version]
- Feng, L.; Li, Y.; Wang, Y.; Du, Q. Estimating hourly and continuous ground-level PM2.5 concentrations using an ensemble learning algorithm: The ST-stacking model. Atmos. Environ. 2020, 223, 117242. [Google Scholar] [CrossRef]
- Tan, Y.; Chen, H.; Zhang, J.; Tang, R.; Liu, P. Early Risk Prediction of Diabetes Based on GA-Stacking. Appl. Sci. 2022, 12, 632. [Google Scholar] [CrossRef]
- Komatsu, H.; Watanabe, E.; Fukuchi, M. Psychiatric Neural Networks and Precision Therapeutics by Machine Learning. Biomedicines 2021, 9, 403. [Google Scholar] [CrossRef] [PubMed]
- Yan, L.; Liu, Y. An Ensemble Prediction Model for Potential Student Recommendation Using Machine Learning. Symmetry 2020, 12, 728. [Google Scholar] [CrossRef]
| Publisher’s Note: MDPI stays neutral with regard to jurisdictional claims in published maps and institutional affiliations. |
© 2021 by the author. Licensee MDPI, Basel, Switzerland. This article is an open access article distributed under the terms and conditions of the Creative Commons Attribution (CC BY) license (https://creativecommons.org/licenses/by/4.0/).


