Proceeding Paper

Information System for Detecting Strawberry Fruit Locations and Ripeness Conditions in a Farm †

1
Department of Mechanical Engineering, University of Maryland, College Park, MD 20742, USA
2
Hampton Roads Agricultural Research and Extension Center, School of Plant and Environmental Sciences, Virginia Tech., Virginia Beach, VA 23455, USA
*
Author to whom correspondence should be addressed.
Presented at the 1st International Electronic Conference on Horticulturae, 16–30 April 2022; Available online: https://sciforum.net/event/IECHo2022.
Biol. Life Sci. Forum 2022, 16(1), 22; https://doi.org/10.3390/IECHo2022-12488
Published: 15 April 2022
(This article belongs to the Proceedings of The 1st International Electronic Conference on Horticulturae)

Abstract

:
Many strawberry growers in some areas of the United States rely on customers to pick the fruits during the peak harvest months. Unfavorable weather conditions such as high humidity and excessive rainfall can quickly promote fruit rot and diseases. This study establishes an elementary farm information system to demonstrate timely information on the farm and fruit conditions (ripe, unripe) to the growers. The information system processes a video clip or a sequence of images from a camera to provide a map which can be viewed to estimate quantities of strawberries at different stages of ripeness. The farm map is built by state-of-the-art vision-based simultaneous localization and mapping (SLAM) techniques, which can generate the map and track the motion trajectory using image features. In addition, the input images pass through a semantic segmentation process using a learning-based approach to identify the conditions. A set of labeled images first trains an encoder-decoder neural network model. Then, the trained model is used to determine the fruit conditions from the incoming images. Finally, the fruit in different conditions is estimated using the segmentation results and demonstrated in the system. Generating this information can aid the growers’ decision-making process. Specifically, it can help farm labor direct traffic to specific strawberry locations within a farm where fruits need to be picked, or where berries need to be removed. The obtained system can help reduce farm revenue loss and promote sustainable crop production.

1. Introduction

The rapid development of technology, especially in robotics and computer vision, has significantly influenced the future of agriculture. As addressed in detail in [1], the benefits of developing a robotic agriculture system are multifold, including but not limited to increasing production, reducing cost, and aiding environmental sustainability. Recently, robotic agricultural systems have been facilitated by the success of various machine learning (ML) algorithms. Comprehensive overviews of applications of ML algorithms in agriculture can be found in [2,3]. As reviewed, the application of ML algorithms in agriculture sees superior results in yield prediction, disease detection, weed detection, crop quantity estimation, species recognition, animal welfare, soil management, etc. Among the categories mentioned above, the research on crop quantity estimation receives much attention, which can bring economic benefits and support environmental welfare. For crop quantity estimation, the objective is usually the classification of the crop according to quality levels (e.g., [4,5]) and reporting its dimensions and mass for quality inspection (e.g., [6,7]).
This study proposes an elementary system that reports timely strawberry farm information in two categories (ripe, unripe) to the growers. The information system consists of a farm mapping module built by Simultaneous Localization and Mapping (SLAM) techniques. A fruit quality demonstration module is shown on the map, fulfilled by semantic segmentation algorithms using computer vision. It is worth noting that the system can be expanded to classify more fruit conditions or to monitor other crops without much effort.
SLAM has been applied for agricultural mapping in recent years. In [8], a SLAM solved by Extended Information Filter (EIF) is used to detect olive stems. The data is collected by a range sensor laser and a monocular vision system. The detection of olive stems from the environment is by a support vector machine (SVM). It is shown in [8] that the map construction is consistent with the natural environment, and the detection of the stems is robust. In [9], a tree and fruit detection algorithm is proposed with field mapping generated by a SLAM (Gmapping) algorithm. In this paper, the ORB-SLAM 3 [10] estimates the motion trajectory and builds the environment map using vision sensors. The ORB-SLAM 3 is one of the state-of-the-art visual SLAM algorithms and has been widely used in various kinds of autonomous system applications (e.g., [11,12]), and the main objective to employ this technique is to track the location of the data-collection system and build a map autonomously and efficiently.
Semantic segmentation of an image refers to the process of partitioning an input frame into various segments and objects with semantic labels. All the pixels in a frame are labeled to identify their corresponding categories. The results of this process can provide understandable information to analyze and utilize. During recent years, deep learning (DL) approaches have demonstrated significant improvements on such tasks. Several notable architectures have been developed, including Fully Convolutional Networks (FCN) [13], Segnet [14], Fast Regional Convolutional Neural Network (Fast RCNN) [15], Faster RCNN [16], Masked-RCNN [17], etc. This paper uses an encoder-decoder framework named U-Net [18] for the segmentation task. U-Net has found its application in precision agriculture (e.g., [19,20]) very recently. The main advantage of U-Net is the efficient usage of available data by data augmentation, so the network can be trained from a considerably small number of images, which adapts to the reality of limited data in some scenarios in agriculture.

2. Methods

This section presents the deep learning model for semantic segmentation of the fruit and the SLAM techniques for building the map of the field. A general flowchart of the system is shown in Figure 1. The primary sensor for collecting data is the camera sensor. The images are then utilized in the semantic segmentation and SLAM modules. A set of images is selected for the segmentation task for manual labeling as a training dataset. After the neural network model is trained, it is used to classify the fruit conditions in specific frames. For the SLAM task, the feature points are detected in the frames and used to estimate the camera motion and build the map. Note that some other types of sensor data (e.g., inertial measurement unit (IMU), depth, etc.) can also be collected to support the SLAM algorithm, depending on the configuration of the autonomous system. However, in this paper only image data is used. All images were from various experiments conducted in the strawberry fields at the Hampton Roads, Agricultural Research and Extension Center, Virginia Tech University.

2.1. Fruit Image Semantic Segmentation

The first task of the system is to develop a convolutional network model to accomplish semantic segmentation. The interest of object identification is to distinguish the fruit from other items and detect its conditions. First, a set of 30 photos are manually labeled by the open-source program ‘labelme’ [21]. Four classes are considered: (1) flag (red, only appears in one image), (2) ripe strawberries (green), (3) unripe strawberries (yellow), and (4) labels (blue). Figure 2 shows a sample photo and it’s corresponding manually labeled image. Although it is preferred to have accurately labeled images at the pixel-level precision to achieve the best training results, the labeled images do not need to be perfect for training a reasonably good semantic segmentation model.
An image augmentation step is performed to increase the size of the training dataset for the neural network, including flipping, rotating, and adding random noise to the existing images. In this step, the training dataset is expanded to contain 240 images. Next, a customized U-Net [18] model is trained for the segmentation. The architecture in general follows the original one, as shown in Figure 3. We changed the tensor sizes of the input and output layers so that the model fits for the input image size from the camera ( 960 × 704 ) and the number of classification classes (4 classes) of the output image. Compared with the original architecture, more convolution layers are also added to generate a better-trained network model.
It should be noted that there are some limitations to the training dataset. For example, the number of images is not very large, the manually labeled data are not pixel-wise precise, and only “ripe strawberries”, “unripe strawberries”, and “labels” are mainly segmented from the images in the current results. However, the same neural network model can be easily adapted when additional training images with more categories are labeled. This feature can help provide more detailed information for the growers from the images.

2.2. Farm Mapping by SLAM

The second task is to utilize the state-of-the-art SLAM algorithm to build a farm map. ORB-SLAM 3 [10] is applied in this paper. In each frame, the customized set of ORB feature points are detected. Then the feature points are used to estimate the camera motion and determine the keyframes to establish a graph (shown in green color). The blue rectangles represent the camera’s pose (i.e., position and orientation). Finally, the graph is optimized using g2o [22] to obtain the best estimation of the motion trajectory and the map.
Figure 4 presents the optimized trajectory of the camera and the environmental map by the sparse map points. The camera is moved to circle one ridge in the strawberry field in the test. The window on the right shows the current frame and the detected feature points in the green square. The window on the left shows the graph to estimate the camera’s trajectory and the map points (points of previous frames in black color, of the current frame in red color) in the world frame projected from feature points detected in the frames. Note that ORB-SLAM only reconstructs a sparse map for efficiency considerations, which is sometimes not intuitive to visualize the environment. However, useful information like the trajectory and density of feature points can be obtained to locate potential areas of interest. More details are explained in Section 3.

3. Results and Discussion

For the fruit semantic segmentation task, the model is trained using TensorFlow 2.4 in Google Colab. After the model is obtained, we test the trained model with two new images, and the prediction results are shown in Figure 5. Most ripe and unripe strawberries can be identified correctly in the images. The predictions can also identify parts of the ripe strawberries covered by the leaves. This feature provides information to the growers after the visible and accessible strawberries being picked by the visitors.
Next, a video clip of the strawberry field is processed using the ORB-SLAM 3 pipeline. The camera is close to a ridge and moves straightly in this test. Figure 6 shows a demo result of the whole system. From the ORB-SLAM result, it can be observed that there are more map points in the areas of the plants and fewer map points in the aisles. Therefore, the areas with dense map points (for example, the area circled in the purple rectangle in Figure 6) are potentially the areas of interest to be inspected more carefully. Given the trajectory estimation result, the exact time when the camera passes by the areas of interest can be obtained, and the frame at that timestamp can be extracted, as shown in Figure 6. Then the image is processed with the learned network model, and the segmentation result can provide the fruit condition information at this location. As the example in Figure 6, it can be seen that there are tens of strawberries in this area of interest, but most of them are unripe. By providing all results along the camera motion trajectory, the system can help the growers perform fewer manual inspections and get informed of the general conditions of the farm.

4. Conclusions

In this paper, we implemented an elementary information system for growers to get informed of the fruit conditions on a farm. The system consists of a semantic segmentation module and a visual SLAM module. By training and using an encoder-decoder neural network model, strawberries can be detected in an image, and different conditions can be classified. The state-of-the-art feature-based visual SLAM technique provides the motion trajectory of the camera as well as a brief farm map. The density of feature points can give information on potential areas to inspect. Finally, from the trajectory estimation, the input images at the specific times when the camera passes by the regions of interest can be checked and used in the segmentation module to provide detailed information of those areas. For future work, the cameras are preferred to be installed on a small mobile robot for scoping the crop farm autonomously, which will significantly save on labor for manually collecting the images and video clips of the environment.

Author Contributions

Conceptualization, T.L., N.C. and J.S.; methodology, T.L. and N.C.; software, T.L.; validation, T.L., N.C. and J.S.; formal analysis, T.L.; investigation, T.L.; resources, T.L., N.C. and J.S.; data curation, T.L.; writing—original draft preparation, T.L.; writing—review and editing, N.C. and J.S.; visualization, T.L.; supervision, N.C. and J.S.; project administration, N.C. and J.S.; funding acquisition, N.C. and J.S. All authors have read and agreed to the published version of the manuscript.

Funding

This research received no external funding.

Institutional Review Board Statement

Not applicable.

Informed Consent Statement

Not applicable.

Data Availability Statement

Not applicable.

Acknowledgments

The third author (J.S.) would like to thank the College of Agriculture and Life Sciences at Virginia Tech.

Conflicts of Interest

The authors declare no conflict of interest.

References

  1. King, A. Technology: The future of agriculture. Nature 2017, 544, S21–S23. [Google Scholar] [CrossRef] [PubMed]
  2. Liakos, K.G.; Busato, P.; Moshou, D.; Pearson, S.; Bochtis, D. Machine learning in agriculture: A review. Sensors 2018, 18, 2674. [Google Scholar] [CrossRef] [PubMed]
  3. Benos, L.; Tagarakis, A.C.; Dolias, G.; Berruto, R.; Kateris, D.; Bochtis, D. Machine learning in agriculture: A comprehensive updated review. Sensors 2021, 21, 3758. [Google Scholar] [CrossRef] [PubMed]
  4. Ramos, P.J.; Prieto, F.A.; Montoya, E.C.; Oliveros, C.E. Automatic fruit count on coffee branches using computer vision. Comput. Electron. Agric. 2017, 137, 9–22. [Google Scholar] [CrossRef]
  5. Papageorgiou, E.I.; Aggelopoulou, K.; Gemtos, T.A.; Nanos, G.D. Development and evaluation of a fuzzy inference system and a neuro-fuzzy inference system for grading apple quality. Appl. Artif. Intell. 2018, 32, 253–280. [Google Scholar] [CrossRef]
  6. Genze, N.; Bharti, R.; Grieb, M.; Schultheiss, S.J.; Grimm, D.G. Accurate machine learning-based germination detection, prediction and quality assessment of three grain crops. Plant Methods 2020, 16, 157. [Google Scholar] [CrossRef] [PubMed]
  7. Lee, J.; Nazki, H.; Baek, J.; Hong, Y.; Lee, M. Artificial intelligence approach for tomato detection and mass estimation in precision agriculture. Sustainability 2020, 12, 9138. [Google Scholar] [CrossRef]
  8. Cheein, F.A.; Steiner, G.; Paina, G.P.; Carelli, R. Optimized EIF-SLAM algorithm for precision agriculture mapping based on stems detection. Comput. Electron. Agric. 2011, 78, 195–207. [Google Scholar] [CrossRef]
  9. Habibie, N.; Nugraha, A.M.; Anshori, A.Z.; Ma’sum, M.A.; Jatmiko, W. Fruit mapping mobile robot on simulated agricultural area in Gazebo Simulator Using Simultaneous Localization and Mapping (SLAM). In Proceedings of the 2017 International Symposium on Micro-NanoMechatronics and Human Science (MHS), Nagoya, Japan, 1–4 December 2017; pp. 1–7. [Google Scholar]
  10. Campos, C.; Elvira, R.; Rodríguez, J.J.G.; Montiel, J.M.; Tardós, J.D. Orb-slam3: An accurate open-source library for visual, visual–inertial, and multimap slam. IEEE Trans. Robot. 2021, 37, 1874–1890. [Google Scholar] [CrossRef]
  11. Krul, S.; Pantos, C.; Frangulea, M.; Valente, J. Visual SLAM for indoor livestock and farming using a small drone with a monocular camera: A feasibility study. Drones 2021, 5, 41. [Google Scholar] [CrossRef]
  12. Chen, M.; Tang, Y.; Zou, X.; Huang, Z.; Zhou, H.; Chen, S. 3D global mapping of large-scale unstructured orchard integrating eye-in-hand stereo vision and SLAM. Comput. Agric. 2021, 187, 106237. [Google Scholar] [CrossRef]
  13. Long, J.; Shelhamer, E.; Darrell, T. Fully convolutional networks for semantic segmentation. In Proceedings of the IEEE Conference on Computer Vision and Pattern Recognition (CVPR), Boston, MA, USA, 8–10 June 2015; pp. 3431–3440. [Google Scholar]
  14. Badrinarayanan, V.; Kendall, A.; Cipolla, R. Segnet: A deep convolutional encoder-decoder architecture for image segmentation. IEEE Trans. Pattern Anal. Mach. Intell. 2017, 39, 2481–2495. [Google Scholar] [CrossRef] [PubMed]
  15. Girshick, R. Fast r-cnn. In Proceedings of the IEEE international conference on computer vision (ICCV), Santiago, Chile, 13–16 December 2015; pp. 1440–1448. [Google Scholar]
  16. Ren, S.; He, K.; Girshick, R.; Sun, J. Faster r-cnn: Towards real-time object detection with region proposal networks. IEEE Trans. Pattern Anal. Mach. Intell. 2017, 39, 1137–1149. [Google Scholar] [CrossRef]
  17. He, K.; Gkioxari, G.; Dollár, P.; Girshick, R. Mask r-cnn. In Proceedings of the IEEE International Conference on Computer Vision (ICCV), Venice, Italy, 22–29 October 2017; pp. 2961–2969. [Google Scholar]
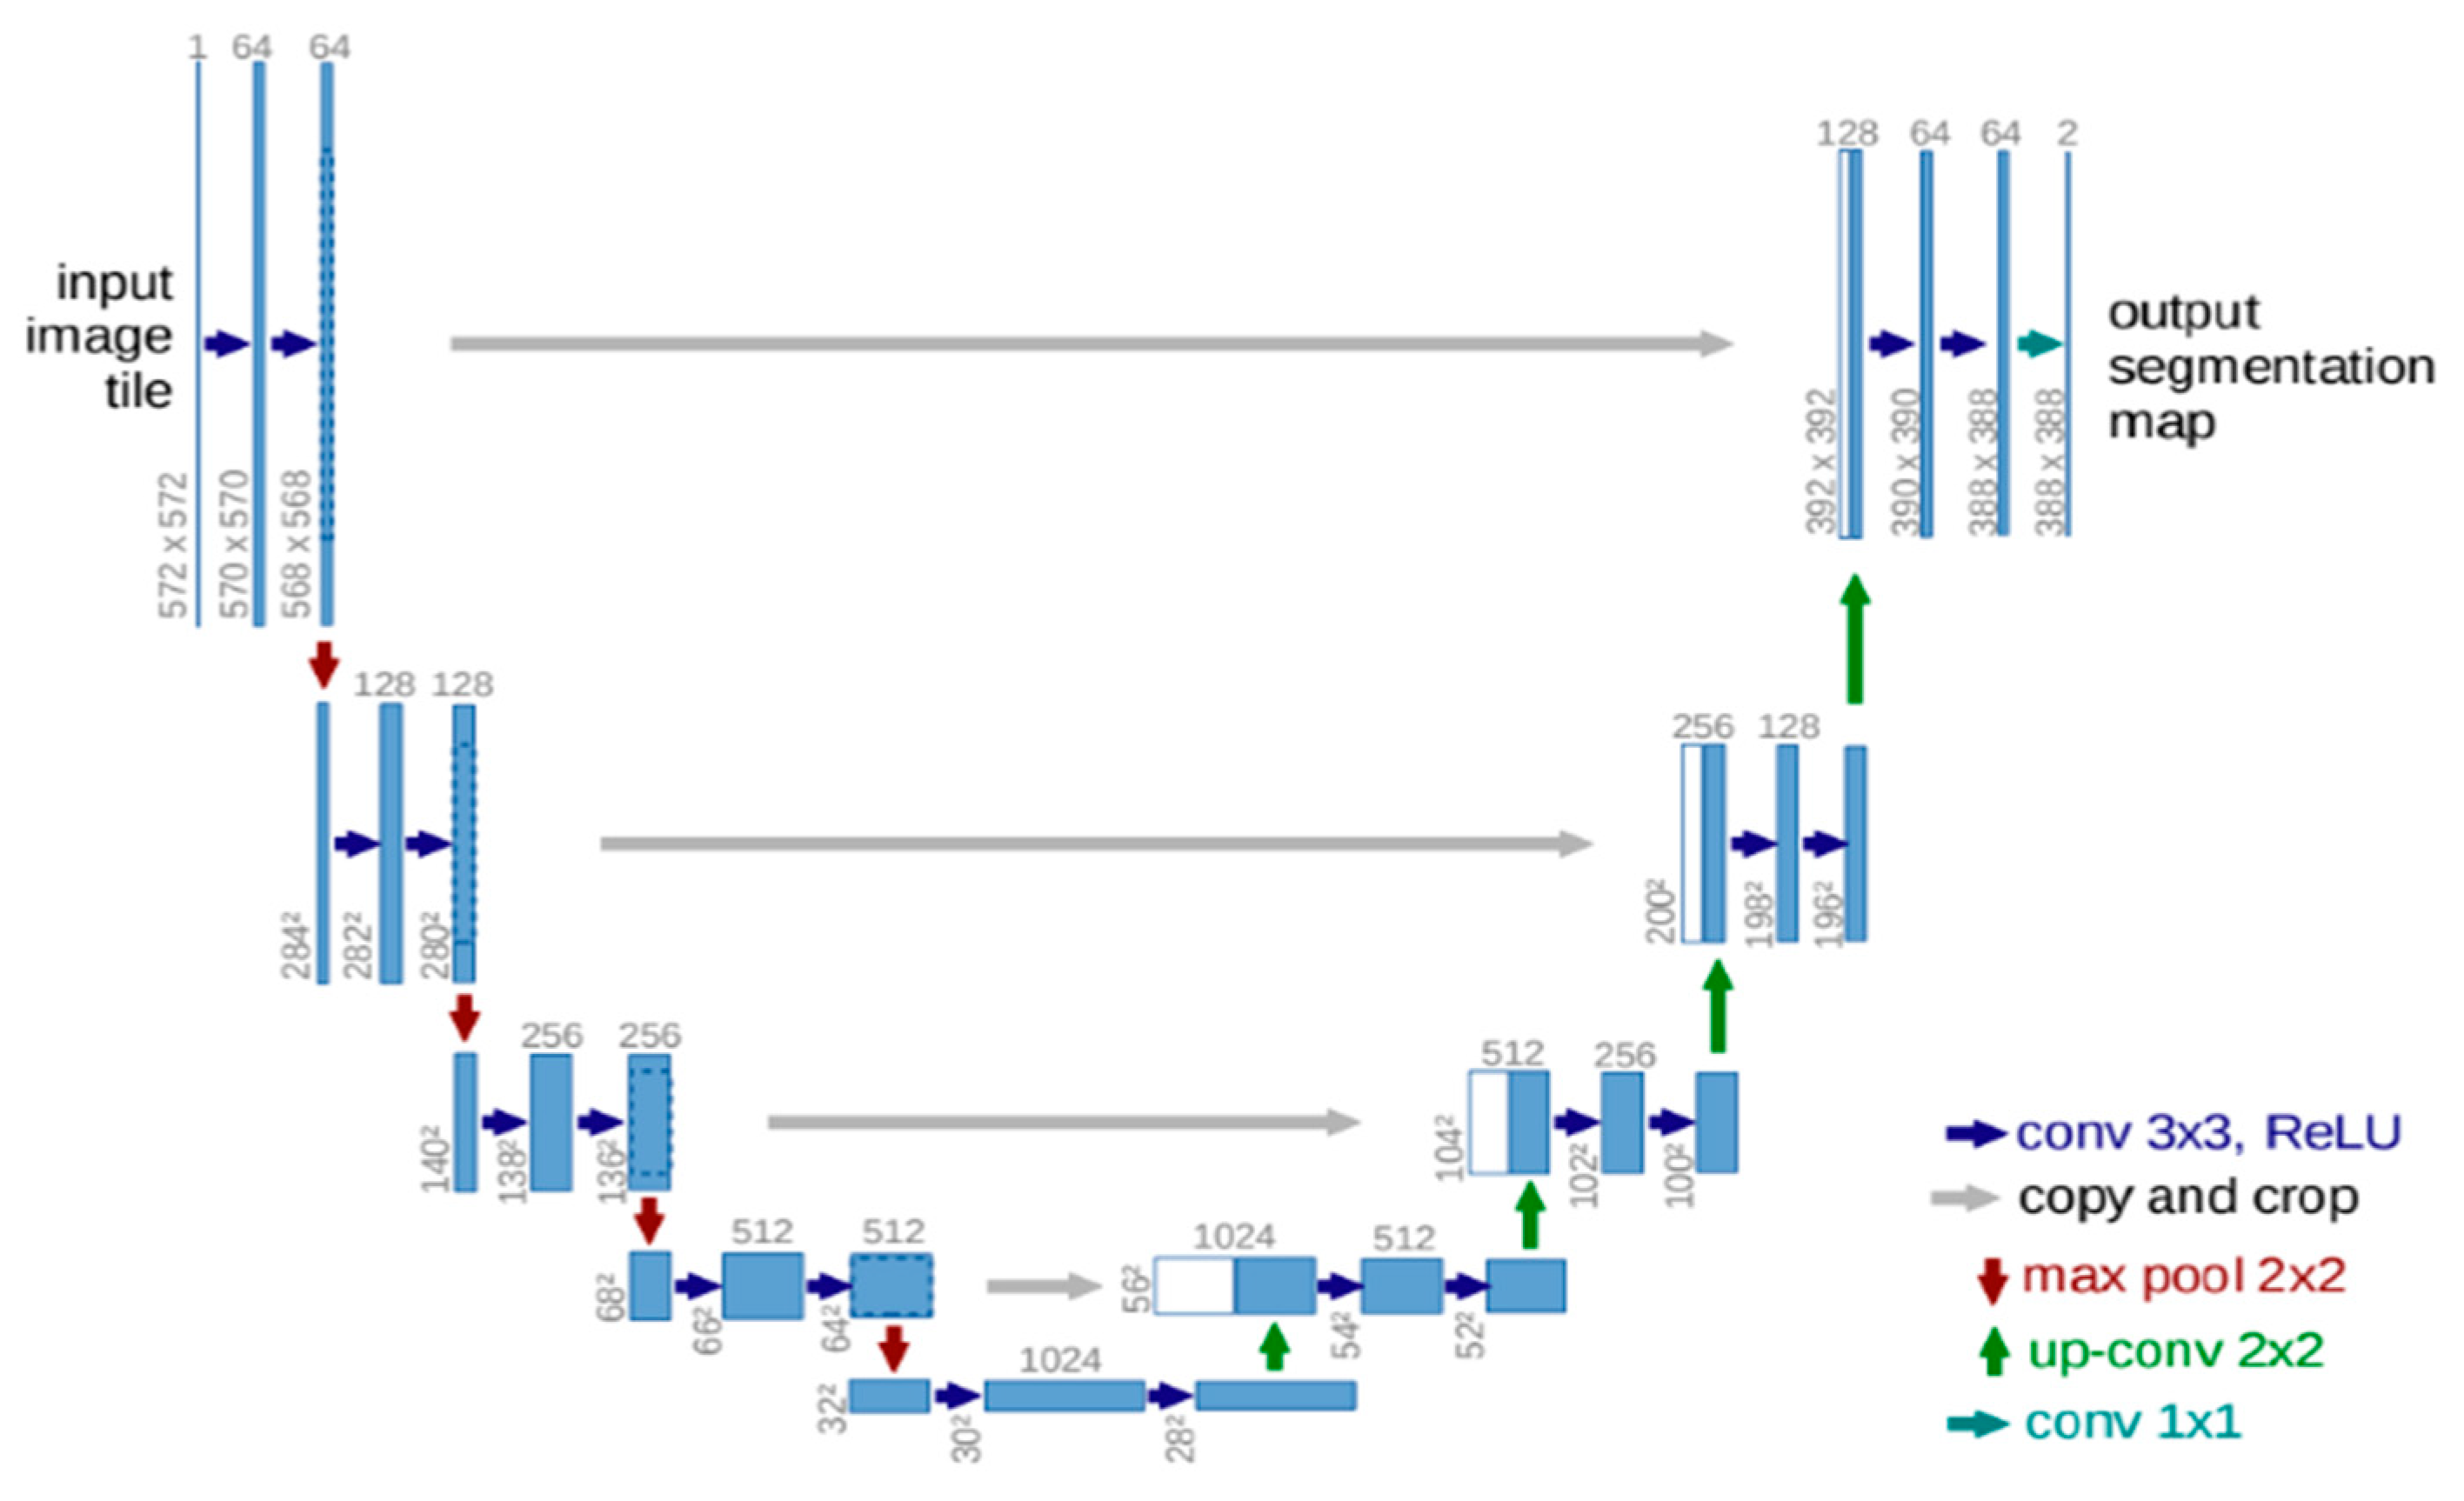
  18. Ronneberger, O.; Fischer, P.; Brox, T. U-net: Convolutional networks for biomedical image segmentation. In Lecture Notes in Computer Science, Proceedings of the International Conference on Medical Image Computing and Computer-Assisted Intervention, Munich, Germany, 5–9 October 2015; Springer: Cham, Switzerland, 2015; pp. 234–241. [Google Scholar]
  19. Hashemi-Beni, L.; Gebrehiwot, A. Deep learning for remote sensing image classification for agriculture applications. In Proceedings of the International Archives of Photogrammetry, Remote Sensing and Spatial Information Sciences, Virtual, 22–26 June 2020; pp. 51–54. [Google Scholar]
  20. Wang, C.; Du, P.; Wu, H.; Li, J.; Zhao, C.; Zhu, H. A cucumber leaf disease severity classification method based on the fusion of DeepLabV3+ and U-Net. Comput. Electron. Agric. 2021, 189, 106373. [Google Scholar] [CrossRef]
  21. Wada, K. Labelme: Image Polygonal Annotation with Python. Available online: https://github.com/wkentaro/labelme (accessed on 10 February 2022).
  22. Kümmerle, R.; Grisetti, G.; Strasdat, H.; Konolige, K.; Burgard, W. g2o: A general framework for graph optimization. In Proceedings of the 2011 IEEE International Conference on Robotics and Automation (ICRA), Shanghai, China, 9–13 May 2011; pp. 3607–3613. [Google Scholar]
Figure 1. System Flowchart.
Blsf 16 00022 g001
Figure 2. (a) strawberry field photo; (b) corresponding labeled image (ground truth).
Blsf 16 00022 g002
Figure 3. Original U-Net Architecture (adapted from [18]), numbers indicate the tensor sizes for each layer.
Blsf 16 00022 g003
Figure 4. Simultaneous Localization and Mapping (SLAM) Visualization Results.
Blsf 16 00022 g004
Figure 5. Learning model test results: (a) test strawberry field photos; (b) predicted labeled images.
Blsf 16 00022 g005
Figure 6. Information System Demonstration Result at an Area of Interest.
Blsf 16 00022 g006
Publisher’s Note: MDPI stays neutral with regard to jurisdictional claims in published maps and institutional affiliations.

