
Maximal Fat Metabolism Explained by Lactate-Carbohydrate Model

School of Health and Life Sciences, Teesside University, Middlesbrough TS1 3BX, UK
Physiologia 2022, 2(4), 121-131; https://doi.org/10.3390/physiologia2040011
Submission received: 3 October 2022
/
Revised: 20 October 2022
/
Accepted: 24 October 2022
/
Published: 27 October 2022
Abstract
:(1) Background: Maximal fat oxidation (MFO), its associated exercise intensity (Fatmax) and the cross-over point (COP) are known indirect calorimetry-based diagnostics for whole-body metabolic health and exercise. However, large inter- and intra-individual variability in determining their corresponding intensity makes their use inconsistent, whether the intensity is based on power output or oxygen uptake. Blood lactate concentration (BLC) has often reflected a range in MFO and COP, which may offer another non-indirect calorimetry dimension based on the near equilibrium between lactate and pyruvate at the molecular level, which biochemically determines an interchange between lactate and relative rate of carbohydrate (relCHO) and relative rate of fat utilization (relFAO). This paper proposes a new testing approach describing relCHO as a function of BLC, with an individualized half-maximal activation constant of relCHO (kel), to explain and predict the variability in MFO, Fatmax and COP. (2) Methods: Following ethical approval, twenty-one healthy males participated in the incremental cardiorespiratory maximal test, and capillary BLC was measured. Indirect calorimetry relCHO and relFAO were calculated, and a constant kel that reflected 50% of CHO saturation level was estimated as a sigmoid function of BLC (mmol·L−1): relCHO = 100/(1 + kel/BLC2). (3) Results: 86% of relCHO variability was explained by BLC levels. The individualized kel estimations, which were 1.82 ± 0.95 (min/max 0.54/4.4) (mmol·L−1)2 independently explained 55% MFO and 44% of COP variabilities. Multiple regression analysis resulted in kel as the highest independent predictor of Fatmax (adjusted r-square = 22.3%, p < 0.05), whilst classic intensity-based predictors (peak power, maximal oxygen uptake, fixed BLC at 4 mmol·L−1) were not significant predictors. (4) Conclusions: The BLC-relCHO model, with its predictor kel explains the inter- and intra-individual variability in MFO, its exercise intensity Fatmax and power outs at COP through dynamic changes in BLC, fat and carbohydrates regardless of the intensity at which exercise takes place. kel capability as a predictor of MFO, Fatmax and COP independently of their associated intensities provides a new diagnostic tool in physiological exercise testing for health and exercise performance.
1. Introduction
Determining changes in whole-body metabolism is essential in human health, disease prevention and sports performance. Fatty acid oxidation (FAO) and carbohydrate CHO oxidation (CHO) provide the main fuel supply for human energy production, whether in resting conditions or during exercise performance of various intensities [1]. Impairments in FAO or CHO are known predictors of long-term conditions such as obesity, diabetes and cardiometabolic diseases [1,2,3]. However, exercise or dietary lifestyle interventions have often measured “fat-burning” outcomes based on indirect calorimetry outcomes, which measure relative changes in FAO or CHO from the oxidizing amount of oxygen uptake () required for their combustion, the corresponding carbon dioxide production () and the respiratory exchange ratio (RER) [4,5]. While alternative theories explaining fat-loss have been recently proposed [6], it is important to develop a practical approach that considers additional levels of biochemical predictors dependent on blood-based biomarkers such as blood lactate concentration (BLC) [7]. Such an approach could be more sensitive to physiological characteristics influencing FAO metabolism, such as muscle fiber composition, glycogen content and activity, gender, diet, aerobic capacity, and exercise intensity and duration [8,9,10].
During incremental exercise, there is an increase in the reliance on FAO at lower exercise intensities, which shifts towards reliance on CHO at higher intensities until indirect calorimetry reaches its measuring limits. When RER reaches its limit (i.e., RER ≥ 1), indirect calorimetry would no longer account for excess produced via the buffering of lactate via the bicarbonate biochemical pathway, which makes measuring FAO at high exercise intensity difficult and requires prolonged exercise protocols [11]. Nonetheless, indirect calorimetry continues to be used repeatedly due to its practicality, and several metabolic indices have been derived from it. The most common whole-body exercise metabolic diagnostic tools based on indirect calorimetry are Fatmax, defined as the exercise intensity at which FAO is maximal [12,13], MFO, which is the amount of maximal FAO [14,15], and the cross-over point (COP), which is the power output at which energy from CHO-derived fuel predominates over that of FAO [16]. On the other hand, indirect calorimetry is often complemented by measuring blood lactate concentration (BLC), which is a whole-body marker of exercise intensity known for over a century [17]. Both blood-based and indirect calorimetry metabolic parameters can be assessed by performing a single graded exercise test with various intensity domains, especially in testing healthy and sedentary individuals [7,15,16,17,18]. Whether and how such discrepant metabolic tools could jointly be used for metabolic assessment is less known.
The large inter-individual and intra-individual variability in assessing Fatmax, MFO and COP are common confounders in measuring adaptations to a lifestyle dietary, exercise or a sport training intervention. MFO intensities or Fatmax have been reported to correspond to a wide range of 30–75% relative to maximal (%) [10,18,19,20,21], while COP has been found to correspond to exercise intensities of approximately 33–59 % [10,13,20]. Explaining such variability based on “fat-burning” via indirect calorimetry (i.e., and exchange) proved insufficient [6]. A large cross-sectional study found that only explained 12% of MFO variance [10], while studies reported a paradoxical relationship between MFO and [22,23,24]. When we analyzed various studies that measured MFO and a corresponding BLC, the authors reported that BLC at MFO ranged from 0.8 mmol·L−1 to 2.2 mmol·L−1 [19,23,24,25,26]. Therefore, it can be suggested that determining a single exercise intensity (i.e., Fatmax) to reflect complex metabolic responses of BLC, FAO and CHO may not sufficiently explain their dynamic biochemical interrelationship.
This study proposes a model to explain the inter- and intra-individual variability in COP, Fatmax and MFO based on BLC variability. The background of this model is based on a relationship between BLC and relative rates of CHO (relCHO) and FAO (relFAO) to jointly describe the inter-individual variability in BLC, FAO and CHO during exercise in human adults [27]. The proposed BLC-relCHO model describes relCHO as a sigmoid function of BLC with a constant (kel) representing 50% activation of pyruvate dehydrogenase (PDH) complex (i.e., CHO oxidation). The mathematical approximation of kel, where BLC and relCHO are measured, integrates metabolic FAO, CHO and BLC as a glycolytic dimension, and so it does not solely on a single intensity or a threshold such as Fatmax or COP, which may address previous limitations of the wide intensity range at MFO. Thus, estimating kel acts as an individualized predictor of relCHO and relFAO and the corresponding BLC levels under aerobic conditions regardless of where their corresponding intensities are. Although this approach has already been used to explain age development and exercise modality metabolic differences [28,29], it has never been tested to explain metabolic concepts such as MFO, Fatmax and COP, which have now become common diagnostics in metabolic health and sports performance [20,21,30].
Therefore, this study hypothesizes that the BLC-relCHO model with its individually estimated kel explains the inter- and intra-individual variability in MFO, Fatmax and COP independently of their associated intensities or power outputs and thus provides better predictability for these metabolic diagnostics.
2. Data, Model, Applications and Influences or Materials and Methods
2.1. Study Design and Participants
The study was approved by the institutional ethical committee, and all experimental procedures were carried out in accordance with the ethical guidelines of the World Medical Association Declaration of Helsinki. All study participants provided their informed written consent and were explained the purpose of the research and experimental procedures. The sample size calculation was based on achieving a large effect size based on previous studies involving FAO and BLC correlations [19,28]. The required sample size for a large effect size and a significance level at α = 0.05 and 90% power was 21 participants.
All tests were performed at similar laboratory environmental conditions (19 ± 0.8 °C, 1022 ± 11 mmHg and 55 ± 9.1% for air temperature, barometric pressure and relative humidity, respectively). All tests and analyses were performed by the same physiologist, and all tests were performed at a similar time of the day. Participants were familiarized with all testing procedures and ergometer settings (saddle height and handlebar distance) during a separate visit prior to the testing day. Participants were instructed to avoid any strenuous exercise or alcohol consumption and to arrive in a fully hydrated status (no fasting) without a heavy meal for at least two hours prior to the test.
2.2. Procedures and Protocol
Healthy male volunteers (n = 21, age = 26.3 ± 6.0 years, height = 179.4 ± 8.1 cm, body mass = 74.9 ± 12.5 kg) arrived at the laboratory approximately one hour before testing, and they were interviewed about exercise, sleep, and food and drink intake during the previous 24 h to exclude issues likely to affect the experimental results. All participants completed an incremental cycling protocol on an electromagnetically braked cycle ergometer (Lode, Excalibur Sport, Groningen, The Netherlands). The power output was initiated with 1 W·kg−1 and increased by 0.5 W·kg−1 every 2-min stage until volitional exhaustion, defined as the inability to maintain the required pedaling rate of 50 rpm for longer than 15 s following verbal encouragement, combined with reaching a heart rate (HR) within 10 beats per minute of the age predicted maximum (220 bpm—age).
2.3. Measurements
and were continuously measured breath-by-breath using an online gas analyzer (Oxycon Pro, Jaeger, Hoechberg, Germany). Subjects respired through a mouthpiece attached to a low resistance low dead space turbine volume transducer (Triple-V, Hans Rudolph, Kansas, MO, USA). The flow sensor and gas analyzers were calibrated using gases of known concentration (16% O2, 5% CO2) and volume (3 L syringe) prior to each test. The same gas analyzer instrument was used for all tests.
Capillary blood samples (20 µL) for BLC analysis were collected from the hyperaemic (Finalgon forte®, Thomae) earlobe during the final 15 s of each stage and every minute after test termination up to the fifth minute. All BLC samples were immediately analyzed utilizing the enzymatic amperometric method (Ebio Plus, Eppendorf, Hamburg, Germany). The lactate analyzer was calibrated by measuring 2 and 10 mmol·L−1 quality control samples using 10 mmol·L−1 standard system solution.
2.4. Data Processing, Analyses and Mathematical Modelling, Analyses and Statistics
Peak power (Ppeak) was calculated from the last completed workloads before participants’ exhaustion, plus the time spent in the final non-completed stage multiplied by the power increment [1]. Relative exercise intensities were defined as a percentage of Ppeak (%Ppeak) and percentage of peak (%).Peak and sub-maximal and were averaged for the last 30 s of every stage. RER was calculated as / and CHO and FAO were further estimated using stoichiometric indirect calorimetry (Equations (1) and (2)) [31]. Moreover, relCHO was individually approximated as a sigmoid function of BLC (Equation (3)), where kel is the activation constant of CHO [28,29]:
Absolute CHO and FAO were calculated based on the O2 required to oxidize glycogen (0.8251 L·g−1), and average fatty acid (C17.2702 H32.7142 O2), which requires 2.0093 L·g−1, and were used to estimate individuals’ MFO [4]. Energy expenditure (EE) was calculated based on EE derived from 1 g of fat as 9 kcal, and 1g of CHO as 4 kcal. COP was calculated as the power output (W) and relative intensity (%Ppeak) where EE from CHO-derived fuels predominate over EE from lipids [16].
, and BLC responses were each plotted as a function of %Ppeak and individually fitted using linear and nonlinear regression models. was fitted using a single linear regression model, and BLC were fitted using monoexponential models (Equations (4)–(6)). BLC thresholds were determined based on power (W) and relative intensities (%) at 2 (BLC2) and 4 mmol·L−1 (BLC4) [25,32].
2.5. Statistical Analyses
All data were described as mean ± standard (minimum/maximum) deviation. Effects of exercise intensity and power output on metabolism were tested using one-way ANOVA, with Tukey’s post-hoc test. Bivariate Pearson’s product-moment correlations were used between COP, MFO and Fatmax with the independent performance and physiological variables of Ppeak, , BLC2, and BLC4 and kel. Stepwise multiple regression analysis was applied to predict MFO, Fatmax and COP with all significant independent variables found in bivariate analyses. The results were analyzed using SPSS version 14. All statistical significance levels were set at p < 0.05.
3. Results
3.1. MFO, Fatmax and COP
MFO was Mean ± SD (Min/Max) 0.51 ± 0.14 (0.30/0.79) g·min−1 corresponding to Fatmax intensities of 47.2 ± 9.7 (30.1/63.9) % and to 40.2 ± 9.4 (25.0/55.0) %Ppeak and at BLC of 1.4 ± 0.4 (0.7/2.3) mmol·L−1. COP was 124.8 ± 39.9 (69.4/205) W corresponding to 42.1 ± 10.1 (25.0/60.0) %Ppeak and 49.6 ± 10.5 (39.1/75.7) % and BLC of 1.5 ± 0.4 (0.9/2.5) mmol·L−1. Fatmax, COP and the corresponding physiological characteristics at maximal and sub-maximal levels are presented below (Table 1 and Table 2).
Neither relative exercise intensities nor BLC levels associated with MFO were different from those of the COP. However, EE derived from FAO was significantly higher at Fatmax than at COP [4.81 ± 1.1 (3.1/7.1) vs. 4.2 ± 1.1 (2.8/6.5) kcal·min−1; (p < 0.01)].
3.2. BLC, relCHO, relFAO Responses and BLC-relCHO Model
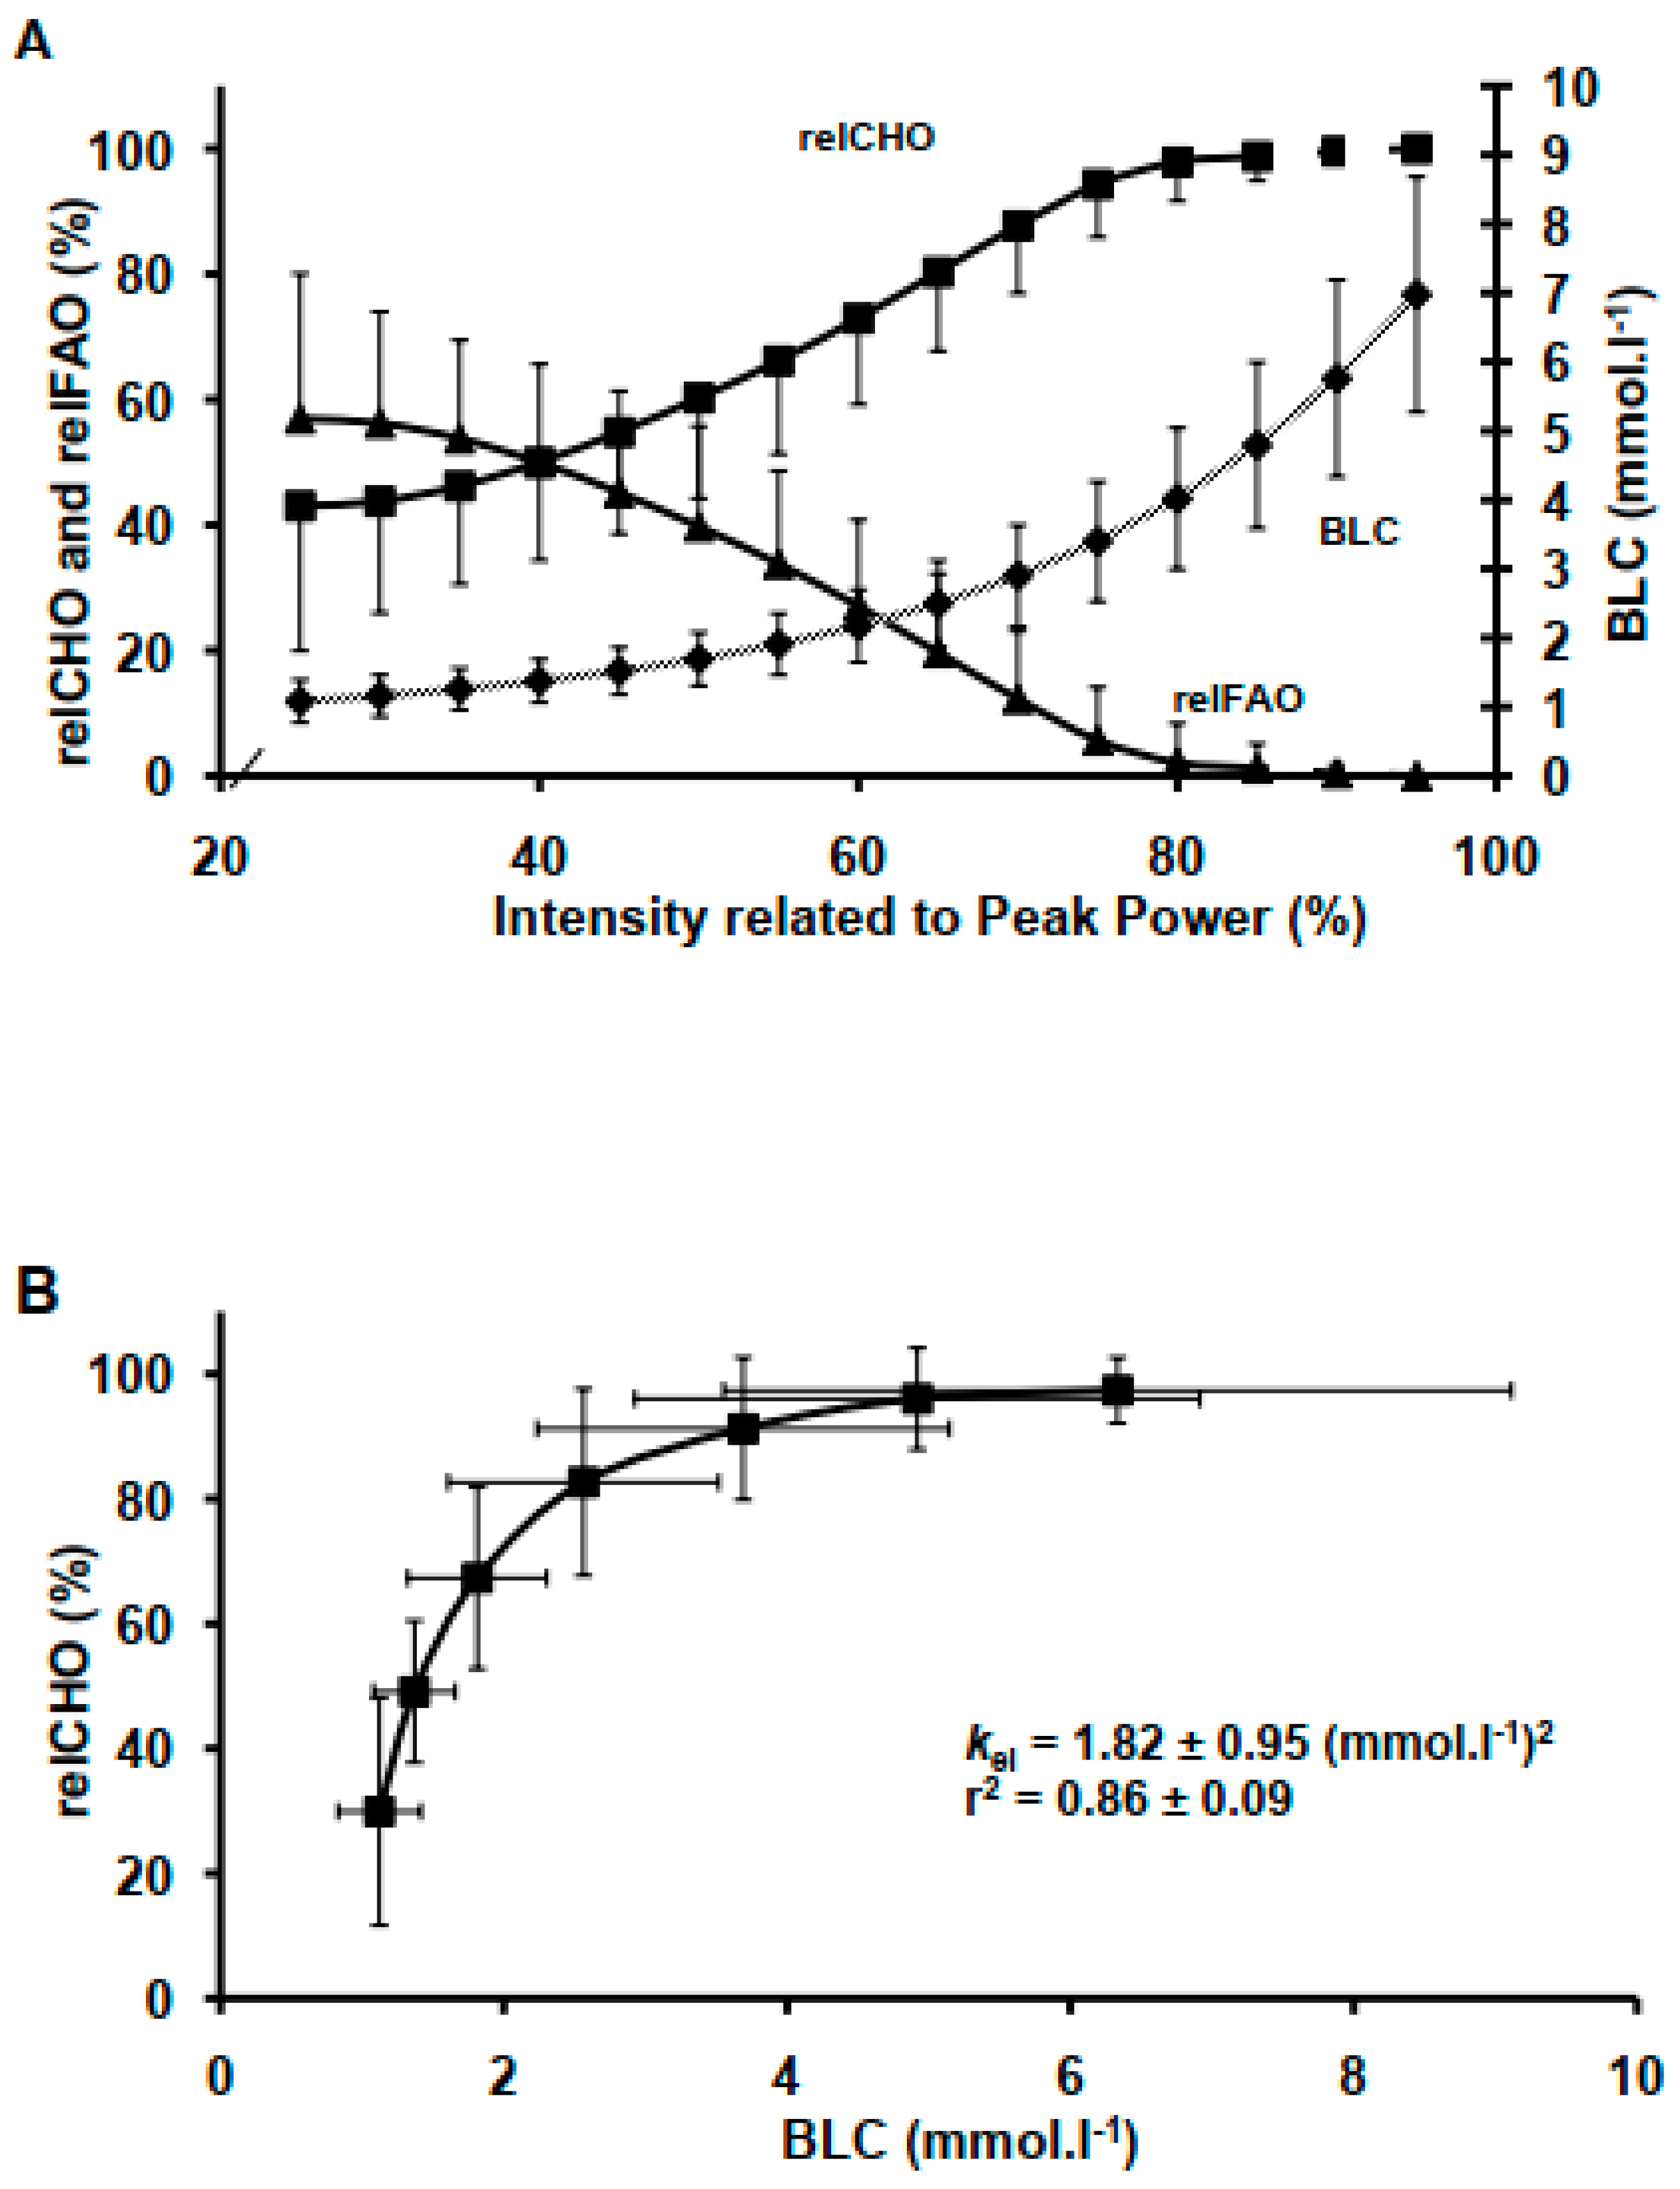
BLC and relCHO both increased (p < 0.05) as a function of increasing each power output up to 149 ± 25 (112/212) W where the increase in BLC and relCHO became progressively steeper (p < 0.05). Conversely, relFAO decreased inversely to the increase in relCHO (p < 0.05) (Figure 1). Moreover, relCHO reached its theoretical limit or saturation at RER = 1, which corresponded to BLC of 4.9 ± 2.0 (1.03/6.9) mmol·L−1. The BLC-relCHO model describing relCHO as a function of BLC showed that BLC explained 86 ± 0.09 % of relCHO variability (Figure 1). Estimates of individuals’ kel were 1.82 ± 0.95 (0.54/4.4 (mmol·L−1)2.
3.3. Bivariate Analysis: kel Correlation with MFO, COP and Associated Exercise Intensities
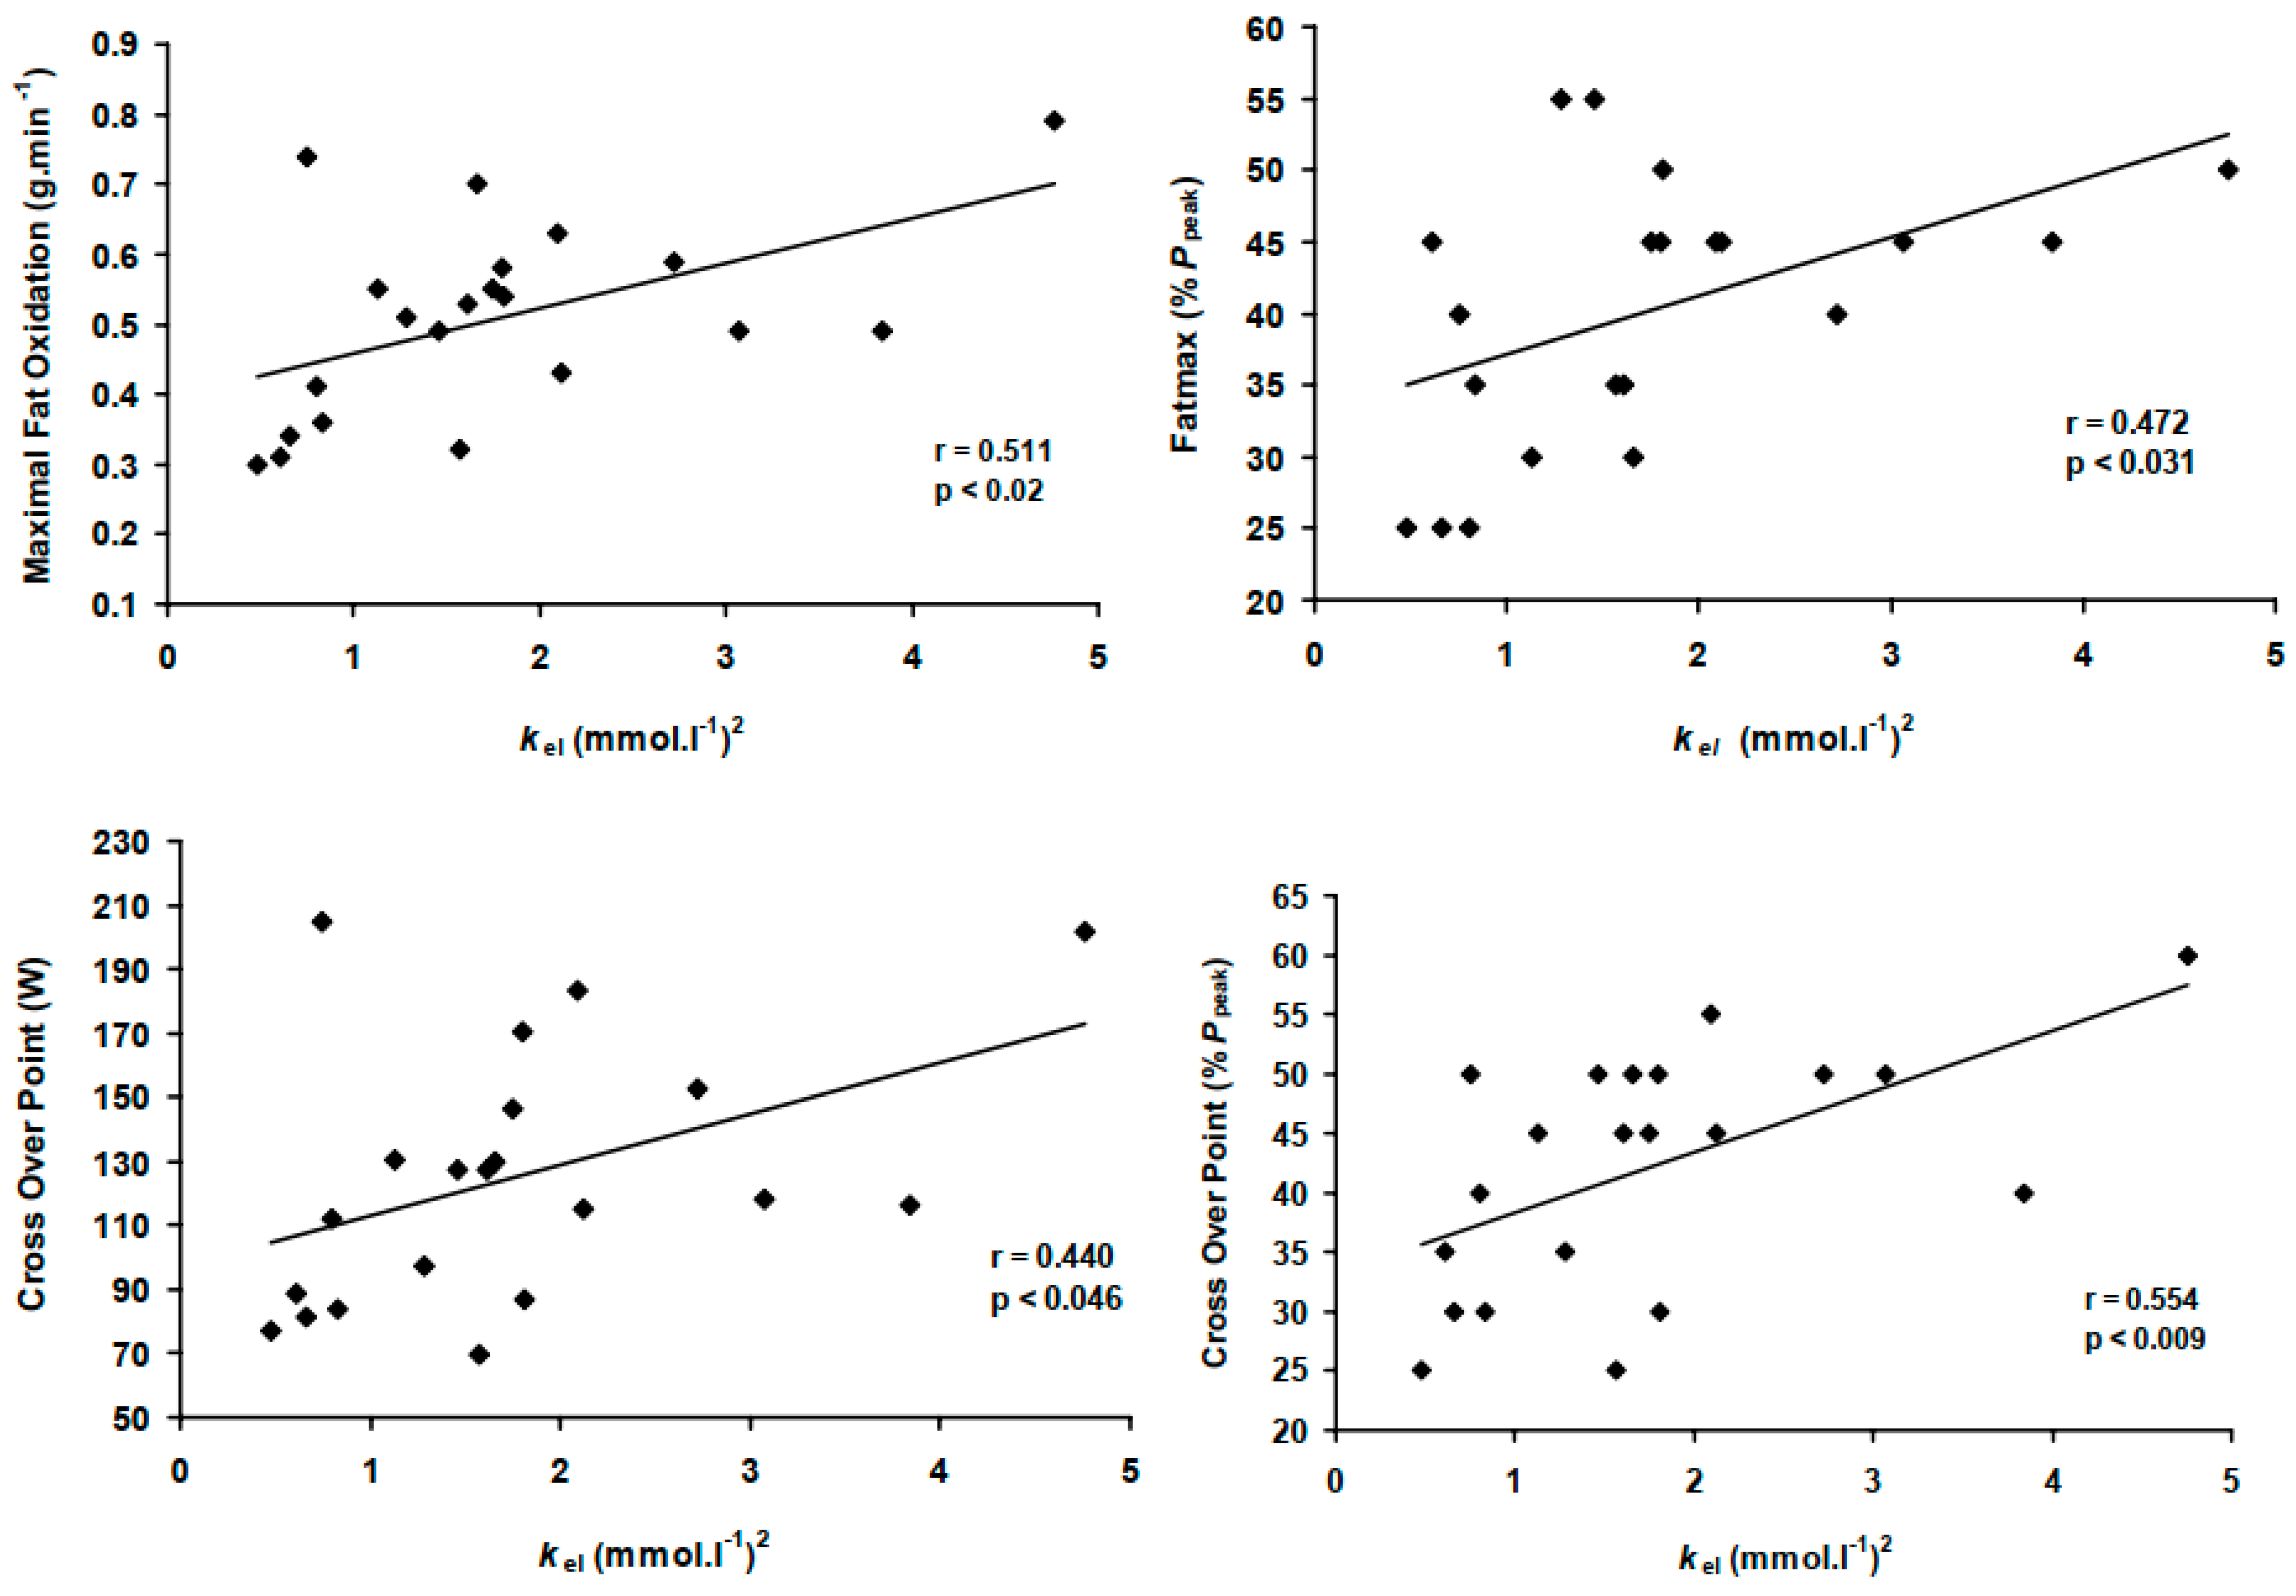
The model predictor kel correlated significantly with both absolute MFO rates, COP power and its associated relative exercise intensity, while explaining 50% of the variability in Fatmax and COP (all p < 0.05, Figure 2). Conversely, , Ppeak and BLC thresholds correlated only with absolute MFO rates and COP power outputs (Table 3).
3.4. The Variability in MFO, Fatmax and COP: Multivariate Analysis
The stepwise regression analyses were performed with the dependent variables being absolute MFO (g·min−1), Fatmax (%Ppeak) and COP (%Ppeak), and COP (W) and the independent variables (predictors) at peak (,Ppeak) and sub-maximal (BLC2, BLC4) levels, which were shown to be significantly correlated with the dependent variables in the bivariate analyses (Table 3). The results showed that kel was the only significant predictor of Fatmax (r-square = 0.223; adjusted r-square = 0.182, p < 0.05); (Equation (7), Table 4). Whereas, , Ppeak and BLC4 were not significant predictors. The model predictor kel alone explained 55% of MFO and 44% of COP (Table 3), which was extended to 80% and 88% when combined with BLC2 as joint predictors (all p < 0.001); (Equations (8)–(10), Table 4).
4. Discussion
The new finding of the present study is that the BLC-relCHO model, with its indicative parameter kel, is an independent predictor that represents metabolic FAO, CHO and BLC jointly, and is better than a single marker of metabolism whether based on indirect calorimetry alone or blood lactate alone. The BLC-relCHO relationship provides an explanation for the inter- and intra-individual variability in COP, MFO and Fatmax, through changes in BLC, regardless of the intensity at which exercise takes place. This approach provides a novel exercise testing diagnostic in metabolic health and human exercise performance.
Estimates of kel of 1.8 (mmol·L−1)2 found in the present study in human healthy adults are comparable with previous theoretical models proposed for human adults [33] and slightly higher than reported values in children and adolescents of 1.3 and 1.5 (mmol·L−1)2, respectively, using a similar incremental exercise protocol [28]. As such, this model builds on previous metabolic testing approaches in human adults, involving indirect calorimetry including MFO, Fatmax and COP by integrating BLC as a glycolytic dimension [12,13,14,15,16].
The BLC-relCHO explains metabolic FAO and CHO in relation to changes in lactate responses via BLC that do not rely solely on a single intensity such as Fatmax or COP, which addresses the limitation of a wide intensity range at MFO and related single point thresholds [34]. A major limitation in the previous indirect calorimetry-based markers is the adoption of a “fat-burning” model, which is only dependent on the amount of oxygen used at a given intensity and as such is limited in the heavy and severe exercise intensity domains, where elite endurance exercise is performed and high-intensity interval training is more effective for fat-loss and performance outcomes [6,11,35]. Instead, the present study proposes the use of kel as an independent evaluative predictor in human adults’ reliance on CHO and FAO during exercise through providing a functional link between BLC, CHO and FAO.
The BLC-relCHO model extends the suggested association between selected BLC thresholds with the exercise intensities at MFO and COP [19,23,24,25,26] by approximating the whole lactate curve to indicate changes in relCHO and relFAO irrespectively of the exercise intensity at which they occur (Figure 1). This idea dates back to proposed theories describing energy metabolism as a sigmoid function of glycolysis, oxidative rate and lactate availability [36], linking BLC accumulation glycolytic mechanisms with a shift towards the reliance on CHO at higher exercise intensities, which is reflected by changes in relCHO variations near the maximal lactate steady state [2,9,15,16].
4.1. kel Prediction of MFO, Fatmax and COP
MFO, Fatmax and COP were well explained by kel (Table 3, Figure 2), which suggests a new paradigm in explaining FAO negating its associated end point or intensity. Moreover, kel variability ranging from 0.54 to 4.4 (mmol·L−1)2 in the present study reflects the variability in MFO (0.3–0.8 g·min−1), the corresponding BLC levels (1–2.2 mmol·L−1) and exercise intensities 30–65% . This is in line with a similar range of BLC levels of 1–2.2 mmol·L−1 reported in studies corresponding to a similarly wide range of exercise intensities at MFO of 30–75% , [2,10,21,30,35]. However, kel does not rely on a fixed power, intensity end point to determine metabolic capacity, and hence it provides an independent predictor for the reliance on FAO, including MFO Fatmax or COP intensities. At a given BLC and , a higher kel characterizes a decreased relCHO and an increased FAO at the same intensities (Figure 1 and Figure 3). As such, higher kel characterizes a higher MFO and a delayed occurrence of Fatmax, shifting it towards a higher exercise intensity; conversely, lower kel indicates a lower MFO and a rapid occurrence of Fatmax (Figure 3).
Amongst several known predictors for exercise endurance performance at peak (, Ppeak) and sub-maximal (BLC2, BLC4) levels, kel was the only significant predictor of both Fatmax and COP variance in both relative and absolute terms; kel alone explained 55% of MFO and 44% of COP (Table 3), which was extended to 80% and 88% when combined with BLC2 as joint predictors (Table 4). Indeed, kel uses levels of BLC to indicate COP and MFO, irrespectively of their associated intensities. Instead, kel seems to provide an individualized whole-body metabolic prediction, which consider both glycolytic lactate (non-aerobic route) and carbohydrate utilization (aerobic combustion route), which may be more representative for predicting human adults exercise performance and metabolic health.
4.2. kel and the Intra-Individual Variability in COP and Fatmax
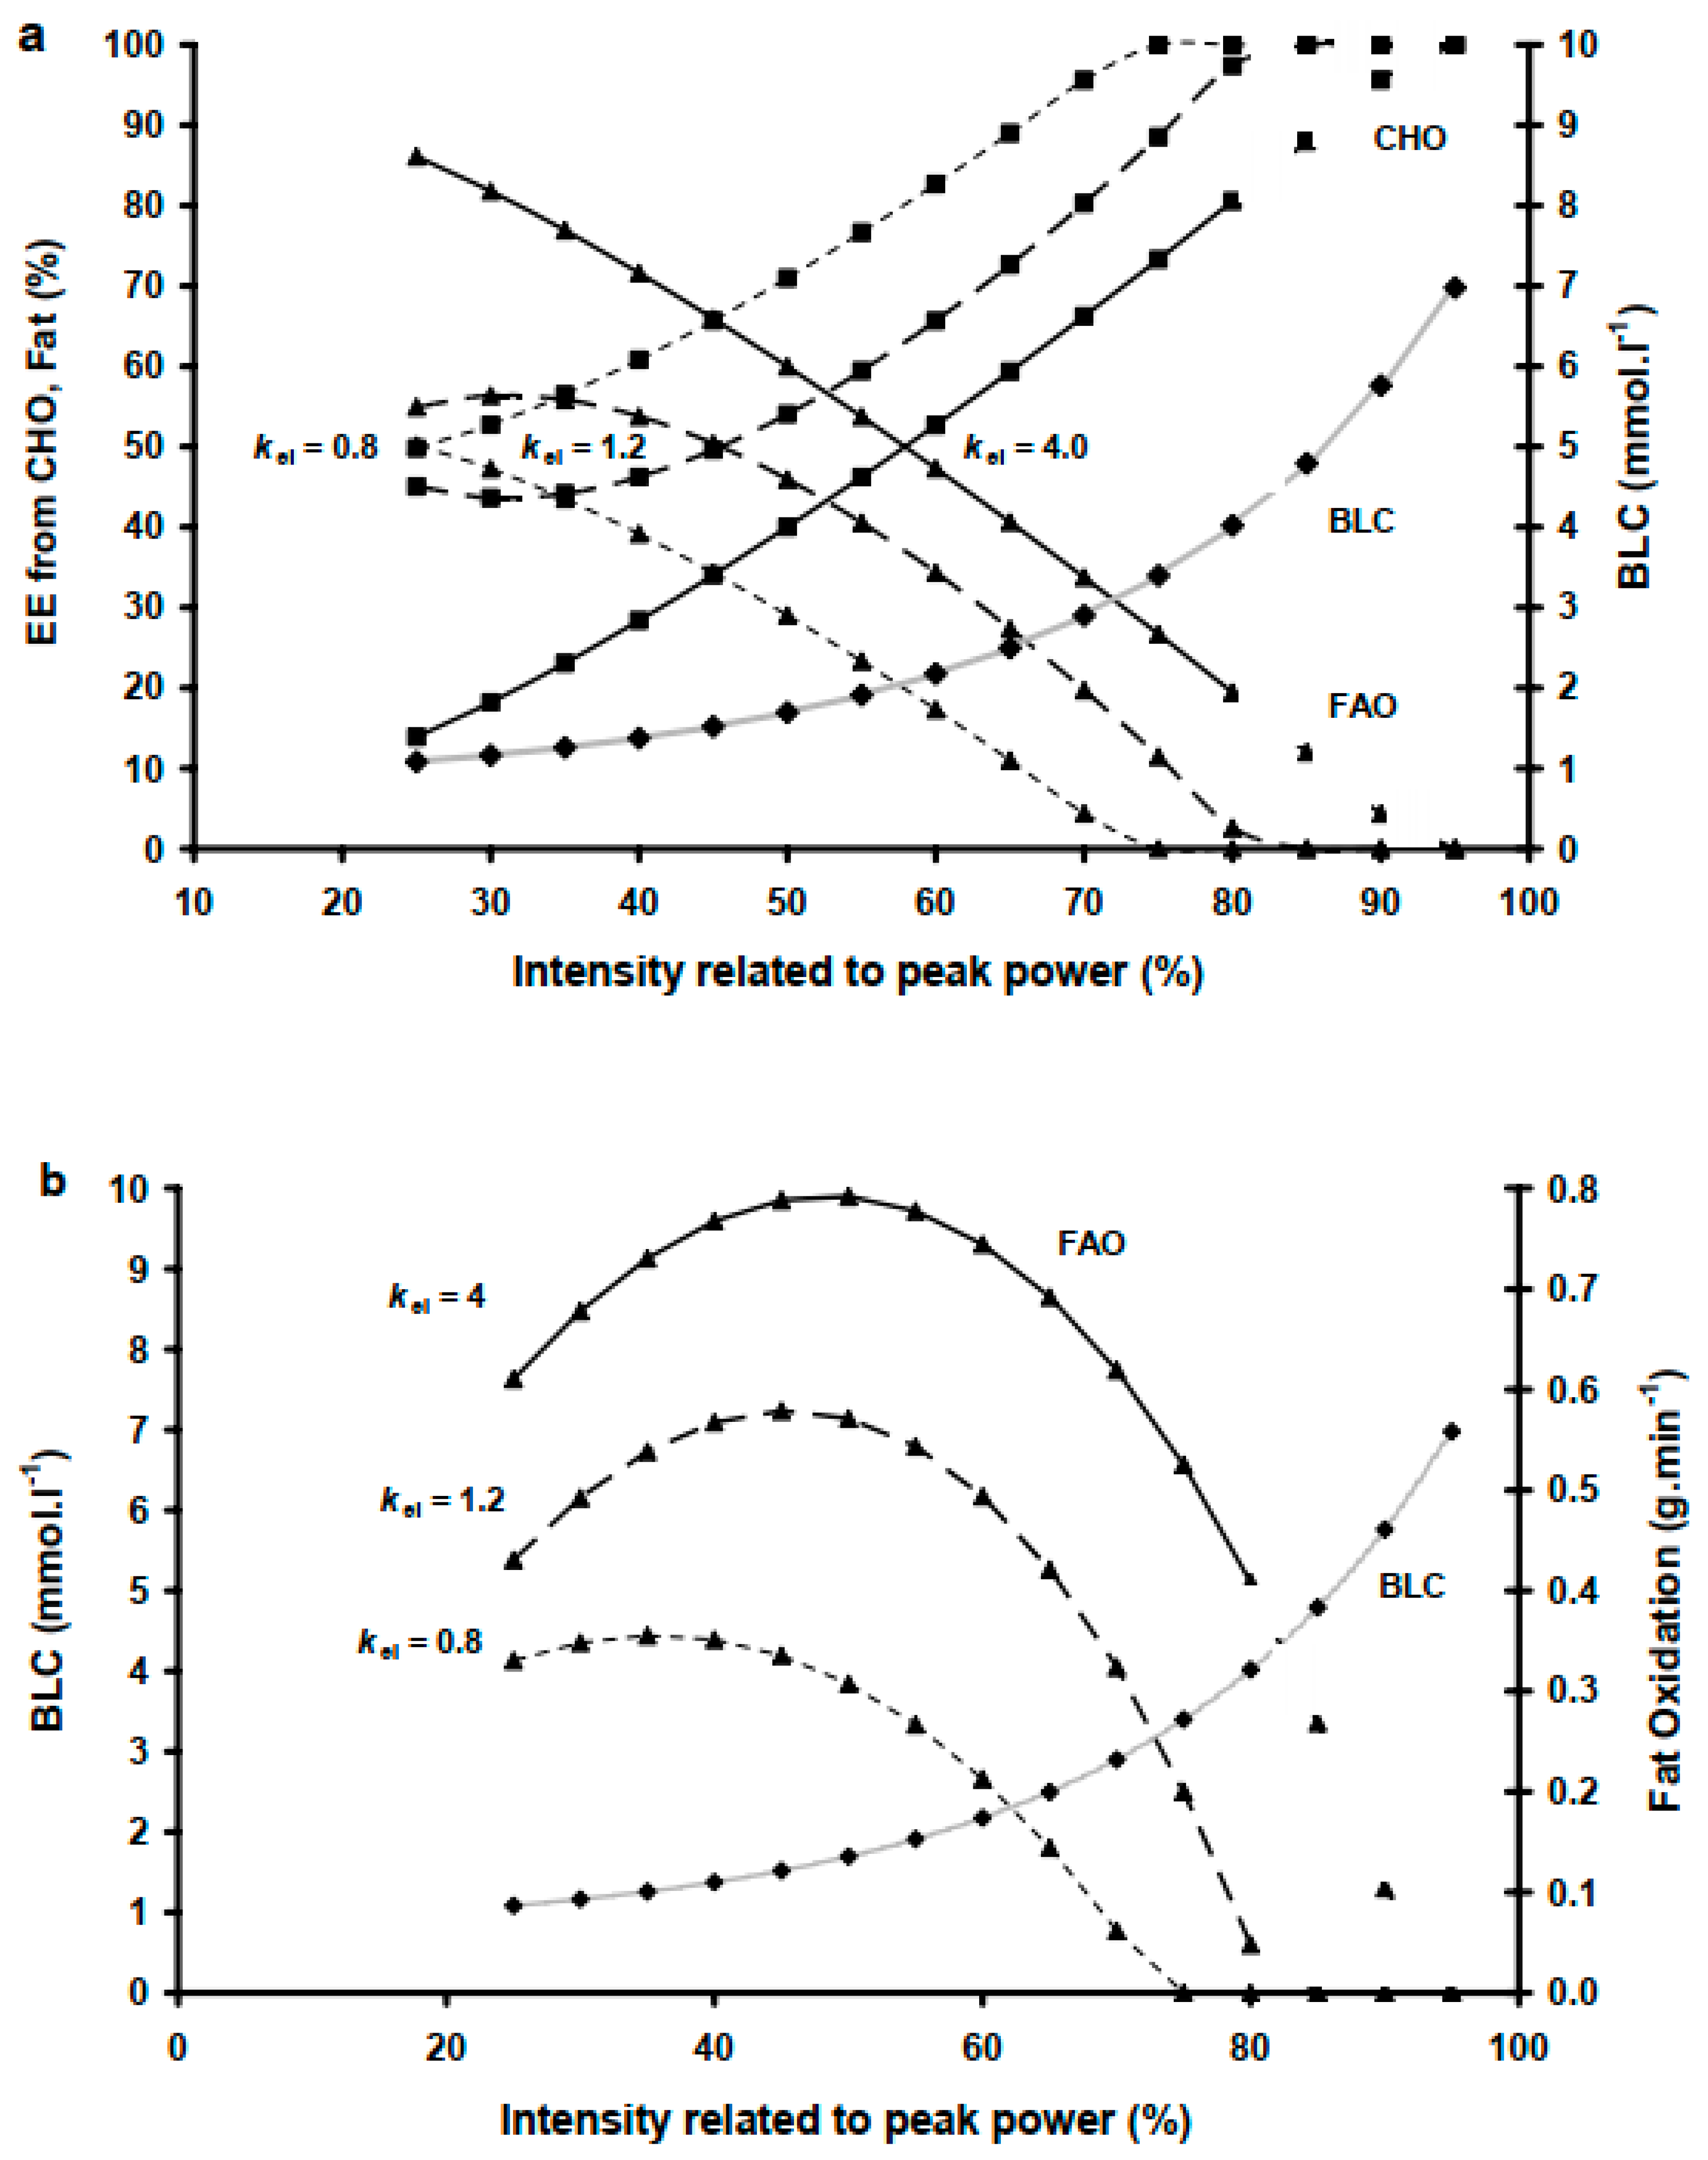
Our finding that COP intensity was not significantly different from Fatmax, which agrees with previously reported cross-sectional data [10] but not with others [20,23]. However, we also found that almost identical intensities of 40 ± 9.7 and 38.6 ± 9.5% Ppeak for Fatmax and COP, respectively, had elicited significantly higher EE (p < 0.01) from FAO and lower EE from CHO at Fatmax than at COP (4.81 ± 1.1 vs. 4.2 ± 1.1 kcal·min−1), respectively. These intra-individual-differences are reflected by the COP being a function of RER and relative substrate utilization, whereas MFO is the result of relative substrate utilization and the metabolic rate. Interestingly, such intra-individual variability can be explained by kel, which was the only significant predictor for both Fatmax and COP in both relative and absolute terms amongst all possible model predictors (Figure 2, Table 3 and Table 4). This suggests that kel can indicate the intra-individual difference through explaining the variance in MFO (indicating absolute FAO and CHO) and COP (indicating EE) and associated intensities at Fatmax and COP. The high steepness of the BLC-relCHO curve (Figure 1) reflects a BLC range where a small BLC increase reflects a large difference in relCHO and relFAO and corresponding intensities at Fatmax and COP. For example, a subject with a low kel of 0.8 (mmol·L−1)2 is likely to have COP at a very low intensity, which is lower than the intensity at Fatmax (Figure 3). Conversely, for a kel of 1.2 (mmol·L−1)2, Fatmax and the COP occur at similar intensities. A high kel of 4 (mmol·L−1)2 gives a lower exercise Fatmax intensity than that of COP. Given that neither relative exercise intensity nor BLC alone are useful in predicting individual COP or MFO conditions found in the present study, kel seems to serve as an indicator for the intensity differences between COP and Fatmax.
4.3. Limitations
The model predictor kel employs BLC levels to describe sub-maximal relCHO; therefore, potential predictive diagnostic applications of kel are limited beyond RER ≥ 1 where relCHO reaches a theoretical 100% (indirect calorimetry limitation) and an excess non-oxidative CO2 from bicarbonate buffering elevates , which possibly overestimates CHO and underestimates FAO. However, an increase in BLC levels at that point compensate for the assumed saturation relCHO level of 100%. Thus, limitations of indirect calorimetry, which remains a practical tool for estimating metabolic substrate utilization during exercise, may be compensated by joint measurements of BLC levels, which continue to increase exponentially. Another point from oxygen uptake kinetics is that ∼90–95% oxygen steady-state attainment is achieved after a 2-min loaded exercise, and this can be increased to 99% with longer durations [37]. The incremental exercise protocol with stage durations of 2 min used in this study is suitable for allowing a wide range of participants to complete several stages, but longer stage durations may be recommended when testing athletes who can sustain higher intensities longer to achieve better steady-state attainment of gas kinetics and consequent indirect calorimetry metabolic measurements. Nonetheless, steady-state protocols with various intensities especially in the heavy domain are required to confirm changes of relFAO and relCHO at given BLC levels. The study was statistically sufficiently powered for this type of complex analysis and mathematical modelling, though future metabolic studies may consider increasing the sample size.
5. Conclusions and Prospects
In human adults, the BLC-relCHO model explains the inter-individual and intra-individual variability in the reliance on CHO and FAO irrespectively of a fixed end point related to intensity, power output or BLC level. Individual kel can predict the inter-individual variability at COP, MFO and Fatmax, and the intra-individual intensity differences between COP and Fatmax. Thus, determining kel provides a complementary diagnostic tool in exercise testing diagnostics for metabolic health and human exercise performance. As such, the BLC-relCHO model, which characterizes an individual’s metabolic capacity based on multiple physiological systems, can be a relevant predictor for both athlete’s performance and a patient’s metabolic status.
Funding
This research received no external funding.
Institutional Review Board Statement
The study was conducted in accordance with the Declaration of Helsinki, and approved by the Institutional Ethics Committee of the University of Essex (Department of Biological Sciences Ethics committee approval date: 30 October 2004).
Informed Consent Statement
Informed consent was obtained from all subjects involved in the study.
Data Availability Statement
Data are available from the author on request.
Conflicts of Interest
The author declares no conflict of interest.
References
- Brooks, G.A.; Fahey, T.D.; Baldwin, K.M. Exercise Physiology. Human Bioenergetics and Its Adaptations, 3rd ed.; McGraw Hill: Boston, MA, USA, 2005; pp. 61–82. [Google Scholar]
- Spriet, L.L. New insights into the interaction of carbohydrate and fat metabolism during exercise. Sports Med. 2014, 44 (Suppl. 1), S87–S96. [Google Scholar] [CrossRef] [PubMed] [Green Version]
- Dilworth, L.; Facey, A.; Omoruyi, F. Diabetes Mellitus and Its Metabolic Complications: The Role of Adipose Tissues. Int. J. Mol. Sci. 2021, 22, 7644. [Google Scholar] [CrossRef] [PubMed]
- Jeukendrup, A.; Wallis, G. Measurements of substrate oxidation during exercise by means of gas exchange measurements. Int. J. Sports Med. 2005, 26, S28–S37. [Google Scholar] [CrossRef] [PubMed]
- Frayn, K.N. Calculation of substrate oxidation rates in vivo from gaseous exchange. J. Appl. Physiol. Respir. Environ. Exerc. Physiol. 1983, 55, 628–634. [Google Scholar] [CrossRef] [Green Version]
- Kuo, C.H.; Harris, M.B.; Jensen, J.; Alkhatib, A.; Ivy, J.L. Editorial: Possible Mechanisms to Explain Abdominal Fat Loss Effect of Exercise Training Other Than Fatty Acid Oxidation. Front. Physiol. 2021, 12, 789463. [Google Scholar] [CrossRef]
- Alkhatib, A. Predictors of exercise performance. In Trends in Human Performance Research; Duncan, M.J., Lyons, M., Eds.; NOVA Science Publisher: New York, NY, USA, 2010; pp. 168–183. [Google Scholar]
- Bergman, B.C.; Brooks, G.A. Respiratory gas-exchange ratios during graded exercise in fed and fasted trained and untrained men. J. Appl. Physiol. 1999, 86, 479–487. [Google Scholar] [CrossRef] [Green Version]
- Helge, J.W.; Fraser, A.M.; Kriketos, A.D.; Jenkins, A.B.; Calvert, G.D.; Ayre, K.J.; Storlien, L.H. Interrelationships between muscle fibre type, substrate oxidation and body fat. Int. J. Obes. Relat. Metab. Disord. 1999, 23, 986–991. [Google Scholar] [CrossRef] [Green Version]
- Venables, M.C.; Achten, J.; Jeukendrup, A.E. Determinants of fat oxidation during exercise in healthy men and women: A cross-sectional study. J. Appl. Physiol. 2005, 98, 160–167. [Google Scholar] [CrossRef] [Green Version]
- Romijn, J.A.; Coyle, E.F.; Sidossis, L.S.; Gastaldelli, A.; Horowitz, J.F.; Endert, E.; Wolfe, R.R. Regulation of endogenous fat and carbohydrate metabolism in relation to exercise intensity and duration. Am. J. Physiol. 1993, 265 Pt 1, E380–E391. [Google Scholar] [CrossRef] [Green Version]
- Achten, J.; Gleeson, M.; Jeukendrup, A.E. Determination of the exercise intensity that elicits maximal fat oxidation. Med. Sci. Sports Exerc. 2002, 34, 92–97. [Google Scholar] [CrossRef]
- Pérez-Martin, A.; Dumortier, M.; Raynaud, E.; Brun, J.F.; Fédou, C.; Bringer, J.; Mercier, J. Balance of substrate oxidation during submaximal exercise in lean and obese people. Diabetes Metab. 2001, 27 Pt 1, 466–474. [Google Scholar] [PubMed]
- Brun, J.F.; Jean, E.; Ghanassia, E.; Flavier, S.; Mercier, J. Metabolic training: New paradigms of exercise training for metabolic diseases with exercise calorimetry targeting individuals. Ann. Readapt. Med. Phys. 2007, 50, 528–534, 520–7. English, French. [Google Scholar] [CrossRef] [PubMed]
- Nordby, P.; Saltin, B.; Helge, J.W. Whole-body fat oxidation determined by graded exercise and indirect calorimetry: A role for muscle oxidative capacity? Scand. J. Med. Sci. Sports 2006, 16, 209–214. [Google Scholar] [CrossRef] [PubMed]
- Brooks, G.A.; Mercier, J. Balance of carbohydrate and lipid utilization during exercise: The “crossover” concept. J. Appl. Physiol. 1994, 76, 2253–2261. [Google Scholar] [CrossRef] [Green Version]
- Hill, A.V.; Long, C.N.H.; Lupton, H. Muscular exercise, lactic acid and the supply and utilisation of oxygen.—Parts VII–VIII. Proc. R. Soc. Lond. 1924, 97, 155–176. [Google Scholar] [CrossRef]
- Achten, J.; Jeukendrup, A.E. Maximal fat oxidation during exercise in trained men. Int. J. Sports Med. 2003, 24, 603–608. [Google Scholar] [CrossRef]
- Achten, J.; Jeukendrup, A.E. Relation between plasma lactate concentration and fat oxidation rates over a wide range of exercise intensities. Int. J. Sports Med. 2004, 25, 32–37. [Google Scholar] [CrossRef]
- Brandou, F.; Dumortier, M.; Garandeau, P.; Mercier, J.; Brun, J.F. Effects of a two-month rehabilitation program on substrate utilization during exercise in obese adolescents. Diabetes Metab. 2003, 29, 20–27. [Google Scholar] [CrossRef]
- Alkhatib, A.; Atcheson, R. Yerba Maté (Ilex paraguariensis) Metabolic, Satiety, and Mood State Effects at Rest and during Prolonged Exercise. Nutrients 2017, 9, 882. [Google Scholar] [CrossRef] [Green Version]
- Meyer, T.; Folz, C.; Rosenberger, F.; Kindermann, W. The reliability of fat. Scand. J. Med. Sci. Sports. 2009, 19, 213–221. [Google Scholar] [CrossRef]
- Michallet, A.S.; Tonini, J.; Regnier, J.; Guinot, M.; Favre-Juvin, A.; Bricout, V.; Halimi, S.; Wuyam, B.; Flore, P. Methodological aspects of crossover and maximum fat-oxidation rate point determination. Diabetes Metab. 2008, 34, 514–523. [Google Scholar] [CrossRef]
- Rynders, C.A.; Angadi, S.S.; Weltman, N.Y.; Gaesser, G.A.; Weltman, A. Oxygen uptake and ratings of perceived exertion at the lactate threshold and maximal fat oxidation rate in untrained adults. Eur. J. Appl. Physiol. 2011, 111, 2063–2068. [Google Scholar] [CrossRef] [PubMed] [Green Version]
- Bircher, S.; Knechtle, B.; Knecht, H. Is the intensity of the highest fat oxidation at the lactate concentration of 2 mmol L(-1)? A comparison of two different exercise protocols. Eur. J. Clin. Investig. 2005, 35, 491–498. [Google Scholar] [CrossRef] [PubMed]
- González-Haro, C. Maximal fat oxidation rate and cross-over point with respect to lactate thresholds do not have good agreement. Int. J. Sports Med. 2011, 32, 379–385. [Google Scholar] [CrossRef]
- Alkhatib, A. Lactate, Carbohydrate, and Fat Utilisation during Exercise: Interrelationship, and Applications in Exercise Testing; Lambert Academic Publishing: Hamburg, Germany, 2010. [Google Scholar]
- Beneke, R.; Hütler, M.; Leithäuser, R.M. Carbohydrate and fat metabolism related to blood lactate in boys and male adolescents. Eur. J. Appl. Physiol. 2009, 105, 257–263. [Google Scholar] [CrossRef] [PubMed]
- Beneke, R.; Alkhatib, A. High cycling cadence reduces carbohydrate oxidation at given low intensity metabolic rate. Biol. Sport 2015, 32, 27–33. [Google Scholar] [CrossRef] [Green Version]
- Cao, J.; Lei, S.; Zhao, T.; Xie, Y.; Zhou, Z.; Cheng, S.; Wang, X. Changes in Fat Oxidation and Body Composition after Combined Exercise Intervention in Sedentary Obese Chinese Adults. J. Clin. Med. 2022, 11, 1086. [Google Scholar] [CrossRef]
- Péronnet, F.; Massicotte, D. Table of nonprotein respiratory quotient: An update. Can. J. Sport Sci. 1991, 16, 23–29. [Google Scholar]
- Faude, O.; Kindermann, W.; Meyer, T. Lactate threshold concepts: How valid are they? Sports Med. 2009, 39, 469–490. [Google Scholar] [CrossRef]
- Beneke, R. Maximal lactate steady state concentration (MLSS): Experimental and modelling approaches. Eur. J. Appl. Physiol. 2003, 88, 361–369. [Google Scholar] [CrossRef]
- Peric, R.; Nikolovski, Z.; Meucci, M.; Tadger, P.; Ferri Marini, C.; Amaro-Gahete, F.J. A Systematic Review and Meta-Analysis on the Association and Differences between Aerobic Threshold and Point of Optimal Fat Oxidation. Int. J. Environ. Res. Public Health 2022, 19, 6479. [Google Scholar] [CrossRef] [PubMed]
- Billat, V.; Sirvent, P.; Lepretre, P.M.; Koralsztein, J.P. Training effect on performance, substrate balance and blood lactate concentration at maximal lactate steady state in master endurance-runners. Pflug. Arch. 2004, 447, 875–883. [Google Scholar] [CrossRef] [PubMed]
- Mader, A.; Heck, H. A theory of the metabolic origin of “anaerobic threshold”. Int. J. Sports Med. 1986, 7 (Suppl. 1), 45–65. [Google Scholar] [CrossRef] [PubMed]
- Poole, D.C.; Jones, A.M. Oxygen uptake kinetics. Compr. Physiol. 2012, 2, 933–996. [Google Scholar] [CrossRef] [PubMed]
Figure 1.
Relative rate of carbohydrate oxidation (relCHO), relative rate of fat oxidation (relFAO) and blood lactate concentration (BLC) responses at given exercise intensities (A). Sigmoid interrelationship describing relCHO as function of BLC (B).
Figure 1.
Relative rate of carbohydrate oxidation (relCHO), relative rate of fat oxidation (relFAO) and blood lactate concentration (BLC) responses at given exercise intensities (A). Sigmoid interrelationship describing relCHO as function of BLC (B).

Figure 2.
Positive correlations between the BLC-relCHO model predictor constant (kel) and maximal fat oxidation (MFO), its corresponding exercise intensity (Fatmax) and the cross-over point (COP).
Figure 2.
Positive correlations between the BLC-relCHO model predictor constant (kel) and maximal fat oxidation (MFO), its corresponding exercise intensity (Fatmax) and the cross-over point (COP).

Figure 3.
Example of the effects of the BLC-relCHO model predictor constant (kel) inter-individual variation on the cross-over point, COP ((a) top figure), maximal fat oxidation (MFO), its corresponding exercise intensity (Fatmax) ((b) bottom figure). Higher kel induces a rightward shift in COP and Fatmax shift and increases the intra-individual intensity difference between Fatmax and COP.


Table 1.
Peak performance and physiological data (mean ± standard deviation (minimum/maximum).
| Ppeak (W) | relPpeak (W·kg−1) | (mL·kg−1·min−1) | (mL·min−1) | BLCpeak (mmol·L−1) | RERpeak |
|---|---|---|---|---|---|
| 293.3 ± 39.4 (236.3/410.0) | 4.0 ± 0.6 (2.8/5.2) | 52.7 ± 7.6 (43.2/70.7) | 4505 ± 598 (3378/6213) | 9.4 ± 2.2 (4.9/13.4) | 1.16 ± 0.07 (1.10/1.29) |
Table 2.
Blood lactate concentration (BLC) thresholds at 2 (BLC2) and 4 (BLC4) mmol·L−1. Data are presented as mean ± standard deviation (minimum/maximum).
Table 2.
Blood lactate concentration (BLC) thresholds at 2 (BLC2) and 4 (BLC4) mmol·L−1. Data are presented as mean ± standard deviation (minimum/maximum).
| BLC2 (W) | BLC2 | BLC4 (W) | BLC4 |
|---|---|---|---|
| 169.3 ± 43.8 (101.8/307.5) | 62.8 ± 9.7 (41.5/82.6) | 235.2 ± 42.7 (177.2/369) | 82.8 ± 7.8 (72.9/100) |
Table 3.
Pearson correlations between independent predictors: peak power output (Ppeak), peak oxygen uptake (), blood lactate concentration (BLC) thresholds at 2 mmol·L−1 (BLC2) and 4 mmol·L−1 (BLC4) and exercise metabolism indices; dependent metabolic variables: maximal fat oxidation (MFO), MFO corresponding intensity (Fatmax) and the cross-over point (COP) as the power outputs (Watts) and relative to Ppeak (%Ppeak).
| Dependent Variables | |||||
|---|---|---|---|---|---|
(mL·kg−1·min−1) | Ppeak (W) | BLC2 (W) | BLC4 (W) | kel (mmol·L−1)2 | |
| MFO (g·min−1) | 0.622 * | 0.570 * | 0.620 * | 0.660 * | 0.510 † |
| Fatmax (%Ppeak) | - | - | - | - | 0.472 † |
| COP (W) | 0.531 † | 0.720 ** | 0.720 ** | 0.760 ** | 0.440 † |
| COP (%Ppeak) | - | - | 0.480 † | 0.470 † | 0.554 * |
(† p < 0.05; * p < 0.001 ** p < 0.001; all others are >0.05).
Table 4.
Stepwise multiple regression analyses of maximal fat oxidation (MFO), the cross-over point (COP) and corresponding intensities at COP and MFO (Fatmax) relative to peak power (%Ppeak).
Table 4.
Stepwise multiple regression analyses of maximal fat oxidation (MFO), the cross-over point (COP) and corresponding intensities at COP and MFO (Fatmax) relative to peak power (%Ppeak).
| Coefficients | Correlations | ||||||||
|---|---|---|---|---|---|---|---|---|---|
| Dependant Variables | Independent Variables | R | R2 | Adjusted R2 | ß | Sig. | Zero Order | Partial | Part |
| MFO (g·min−1) | kel | 0.897 | 0.804 | 0.783 | 0.663 | <0.001 | 0.510 | 0.826 | 0.649 |
| BLC2 | 0.754 | <0.001 | 0.619 | 0.858 | 0.738 | ||||
| Fatmax (%Ppeak) | kel | 0.472 | 0.223 | 0.182 | 0.472 | <0.05 | 0.472 | 0.472 | 0.472 |
| COP (W) | kel | 0.936 | 0.875 | 0.861 | 0.611 | <0.001 | 0.439 | 0.861 | 0.598 |
| BLC2 | 0.844 | <0.001 | 0.719 | 0.919 | 0.826 | ||||
| COP (%Ppeak) | kel | 0.819 | 0.671 | 0.634 | 0.680 | <0.001 | 0.554 | 0.757 | 0.665 |
| BLC2 | 0.616 | <0.001 | 0.478 | 0.725 | 0.603 | ||||
Publisher’s Note: MDPI stays neutral with regard to jurisdictional claims in published maps and institutional affiliations. |
© 2022 by the author. Licensee MDPI, Basel, Switzerland. This article is an open access article distributed under the terms and conditions of the Creative Commons Attribution (CC BY) license (https://creativecommons.org/licenses/by/4.0/).
Share and Cite
MDPI and ACS Style
Alkhatib, A. Maximal Fat Metabolism Explained by Lactate-Carbohydrate Model. Physiologia 2022, 2, 121-131. https://doi.org/10.3390/physiologia2040011
AMA Style
Alkhatib A. Maximal Fat Metabolism Explained by Lactate-Carbohydrate Model. Physiologia. 2022; 2(4):121-131. https://doi.org/10.3390/physiologia2040011
Chicago/Turabian StyleAlkhatib, Ahmad. 2022. "Maximal Fat Metabolism Explained by Lactate-Carbohydrate Model" Physiologia 2, no. 4: 121-131. https://doi.org/10.3390/physiologia2040011