

Skeletal Muscle Transcriptome Alterations Related to Declining Physical Function in Older Mice
 ,
,  ,
,
Abstract
:1. Introduction
2. Methodology
2.1. Mice
2.2. Functional Testing
2.3. Tissue Collection and Handling
2.4. NGS RNAseq
3. Data Analysis
3.1. General
3.2. Further Data Analysis of RNAseq Data and CFAB Data
3.3. Transcription Factor Analyses
4. Results
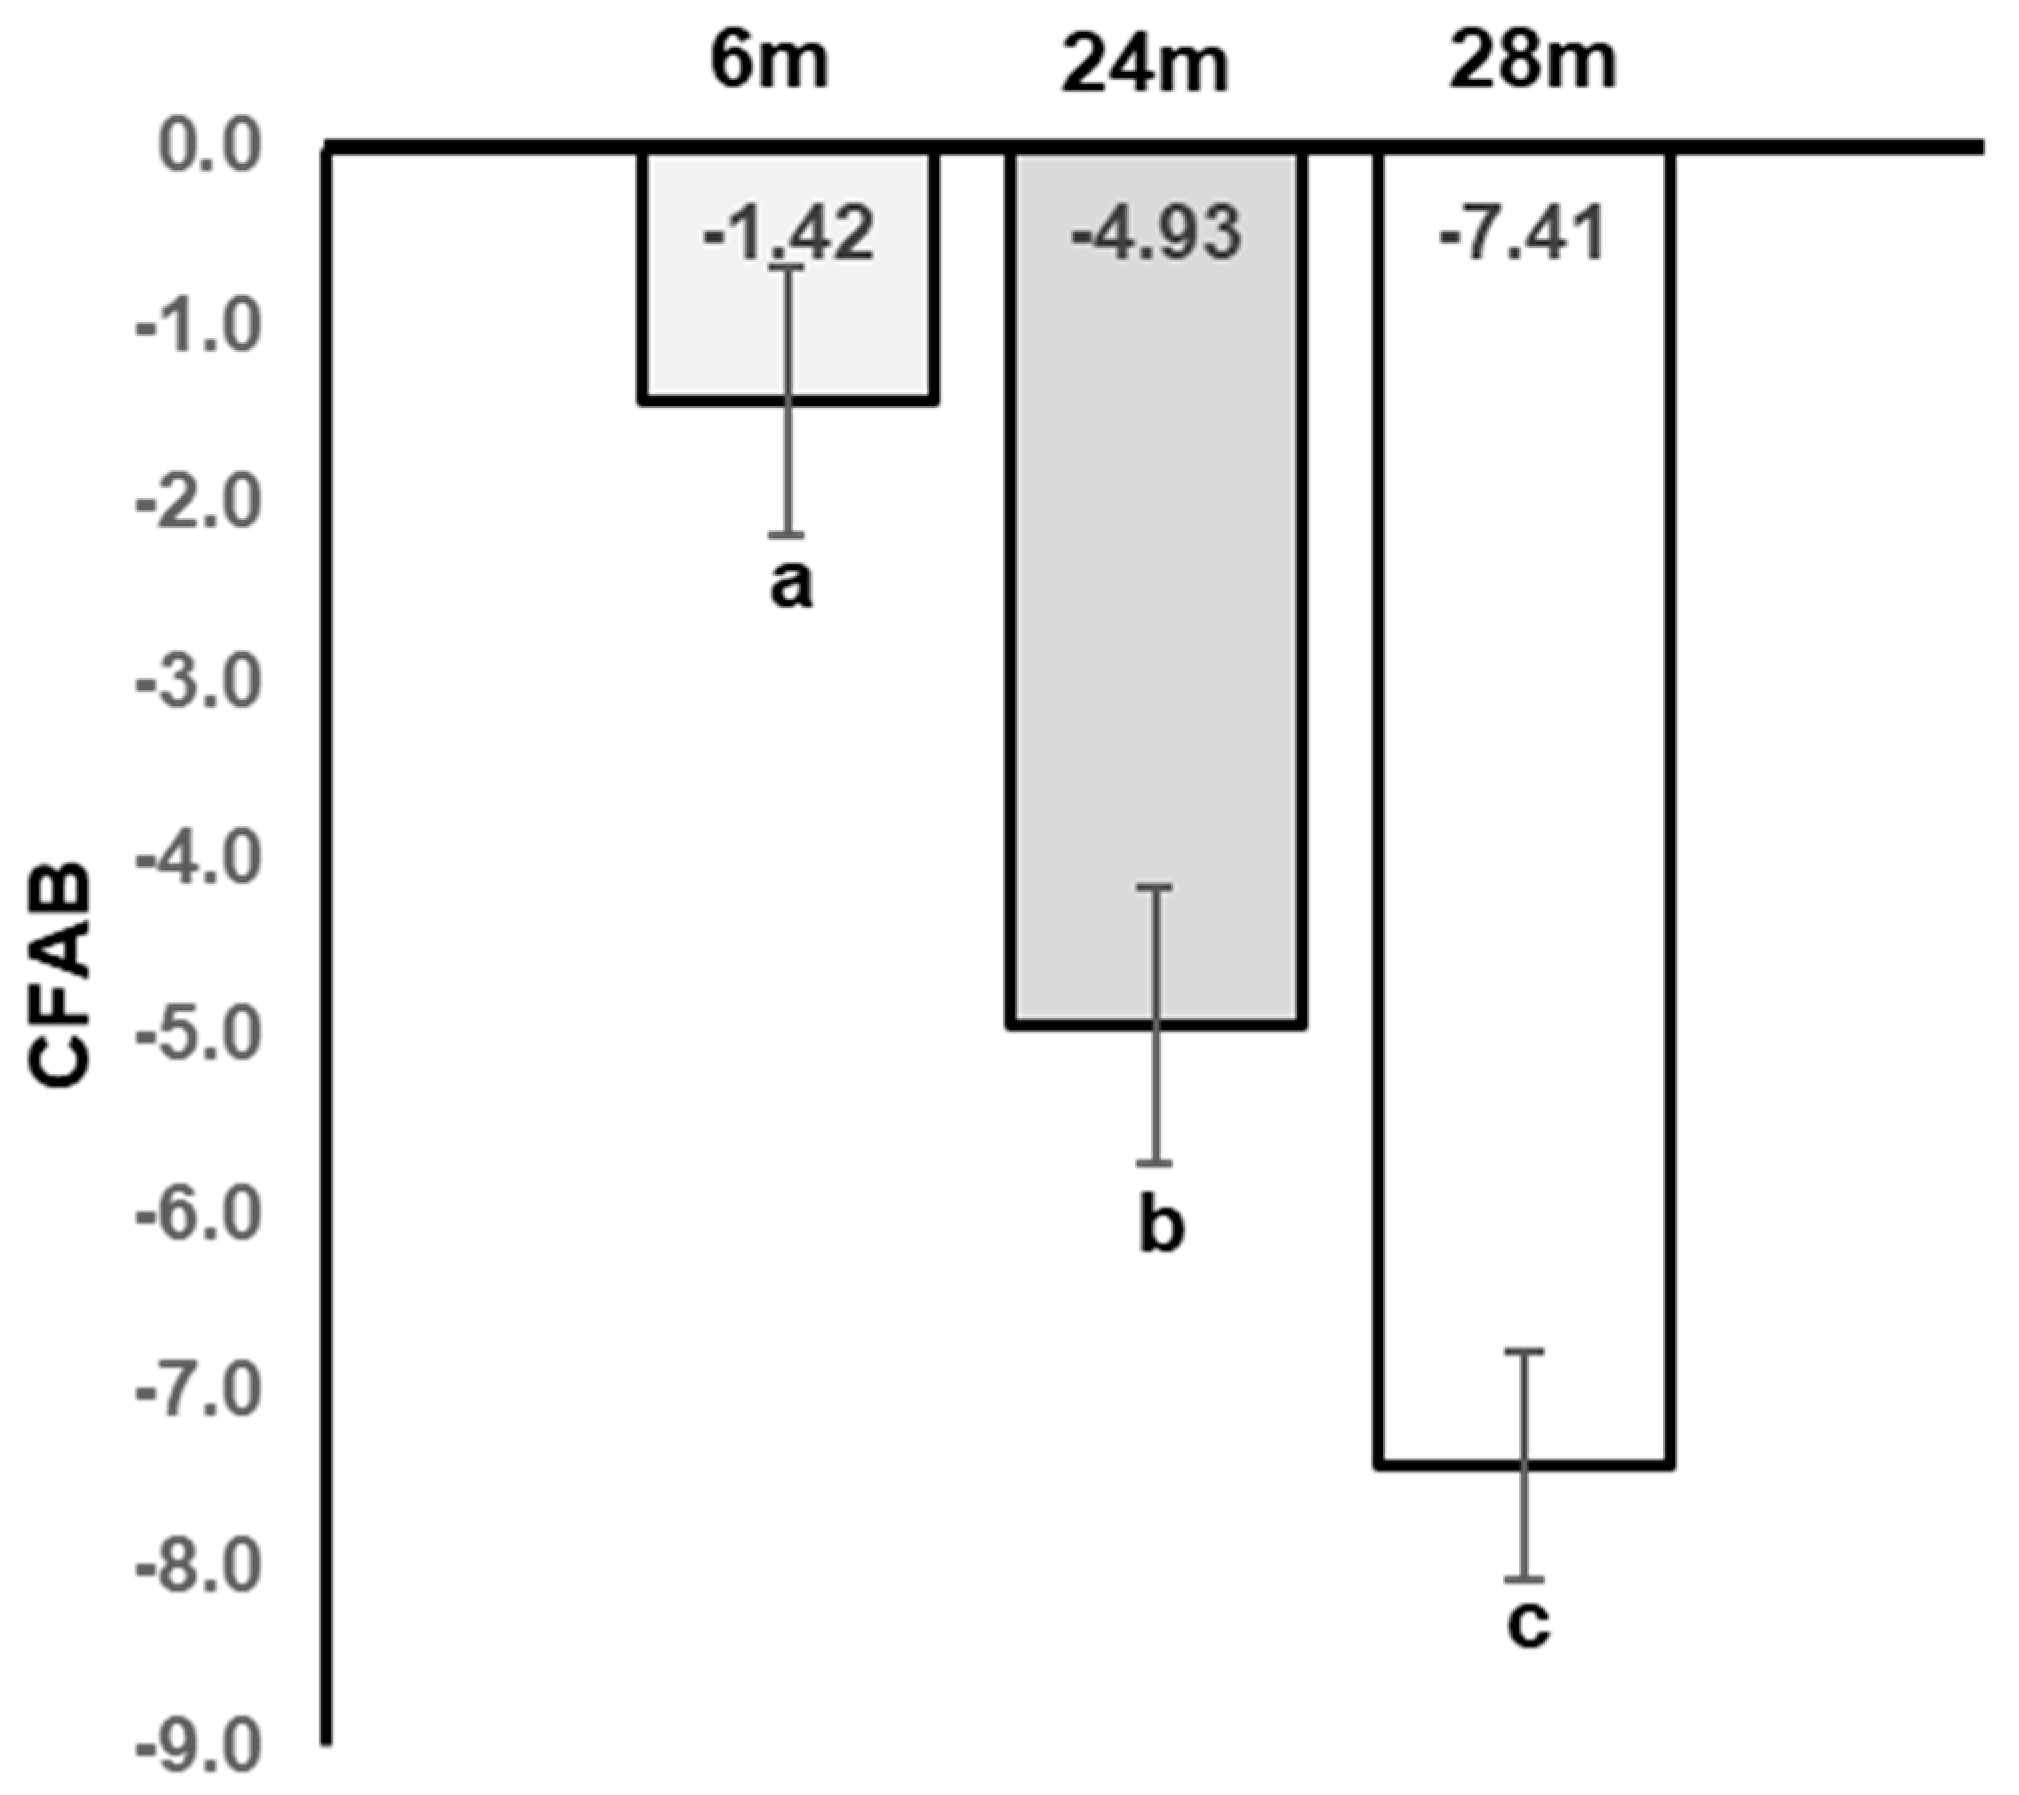
4.1. CFAB
4.1.1. NGS RNAseq: (See the Full Raw Dataset on GEO at GSE152133)
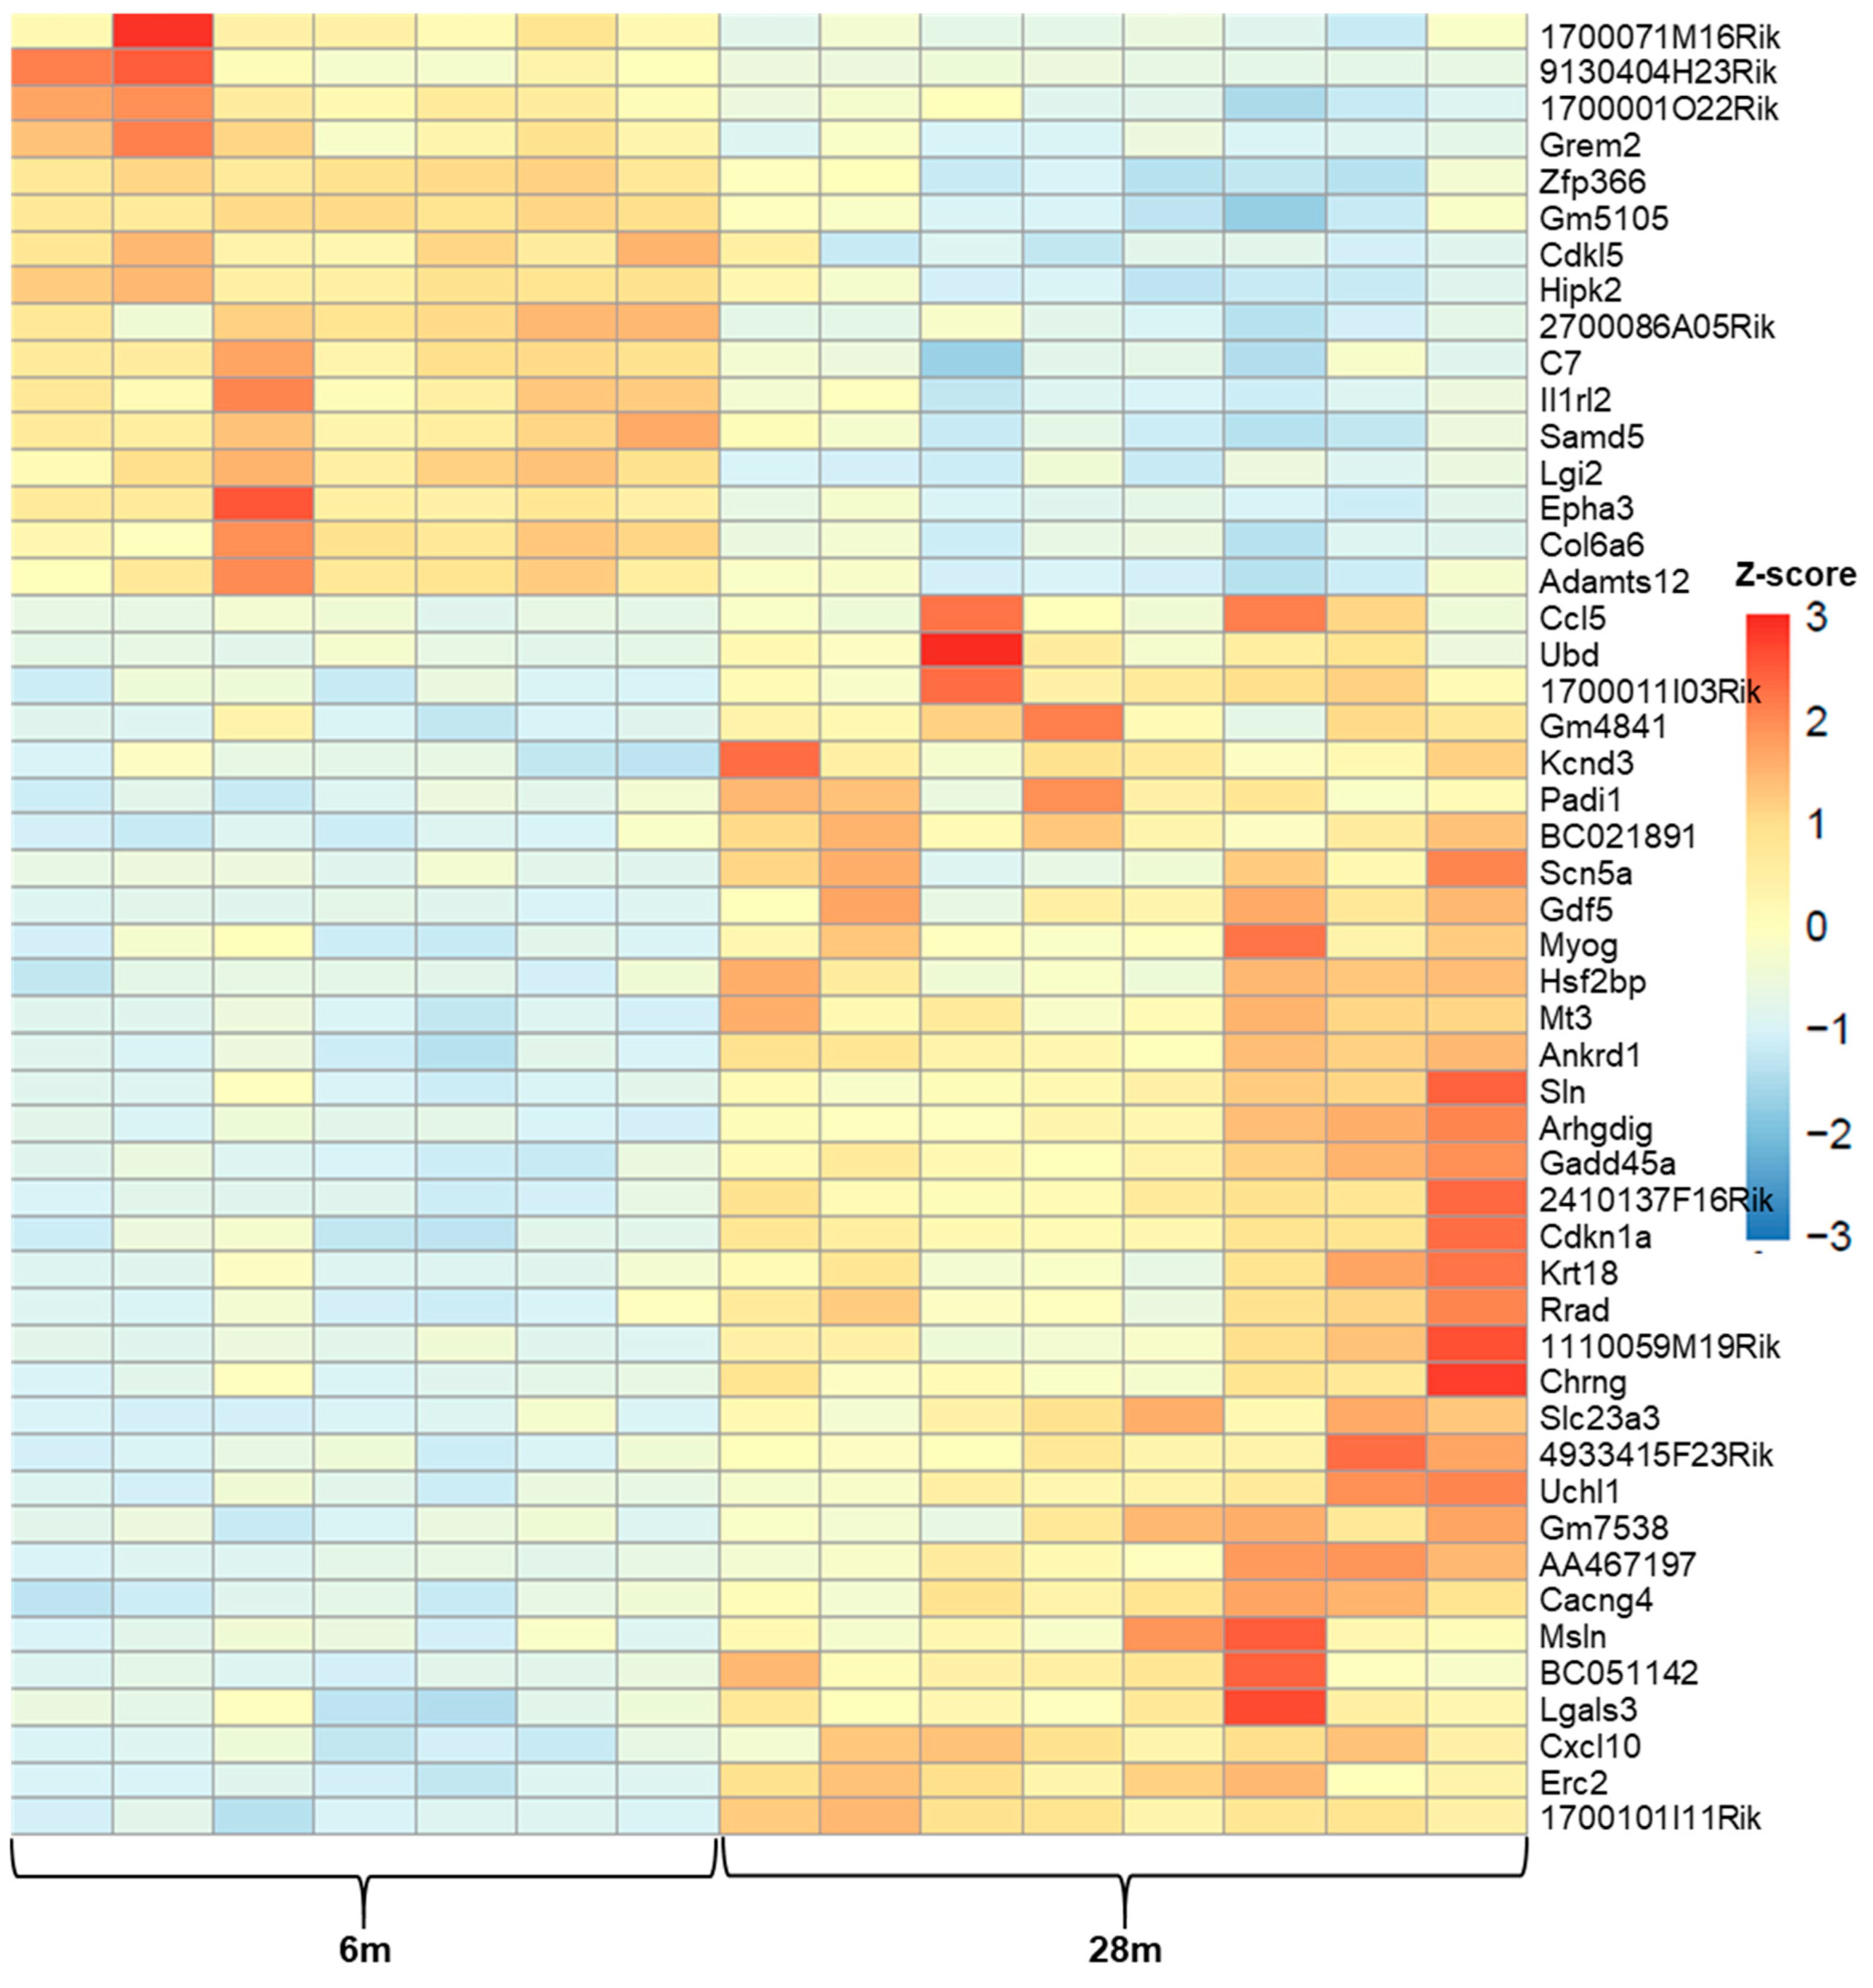
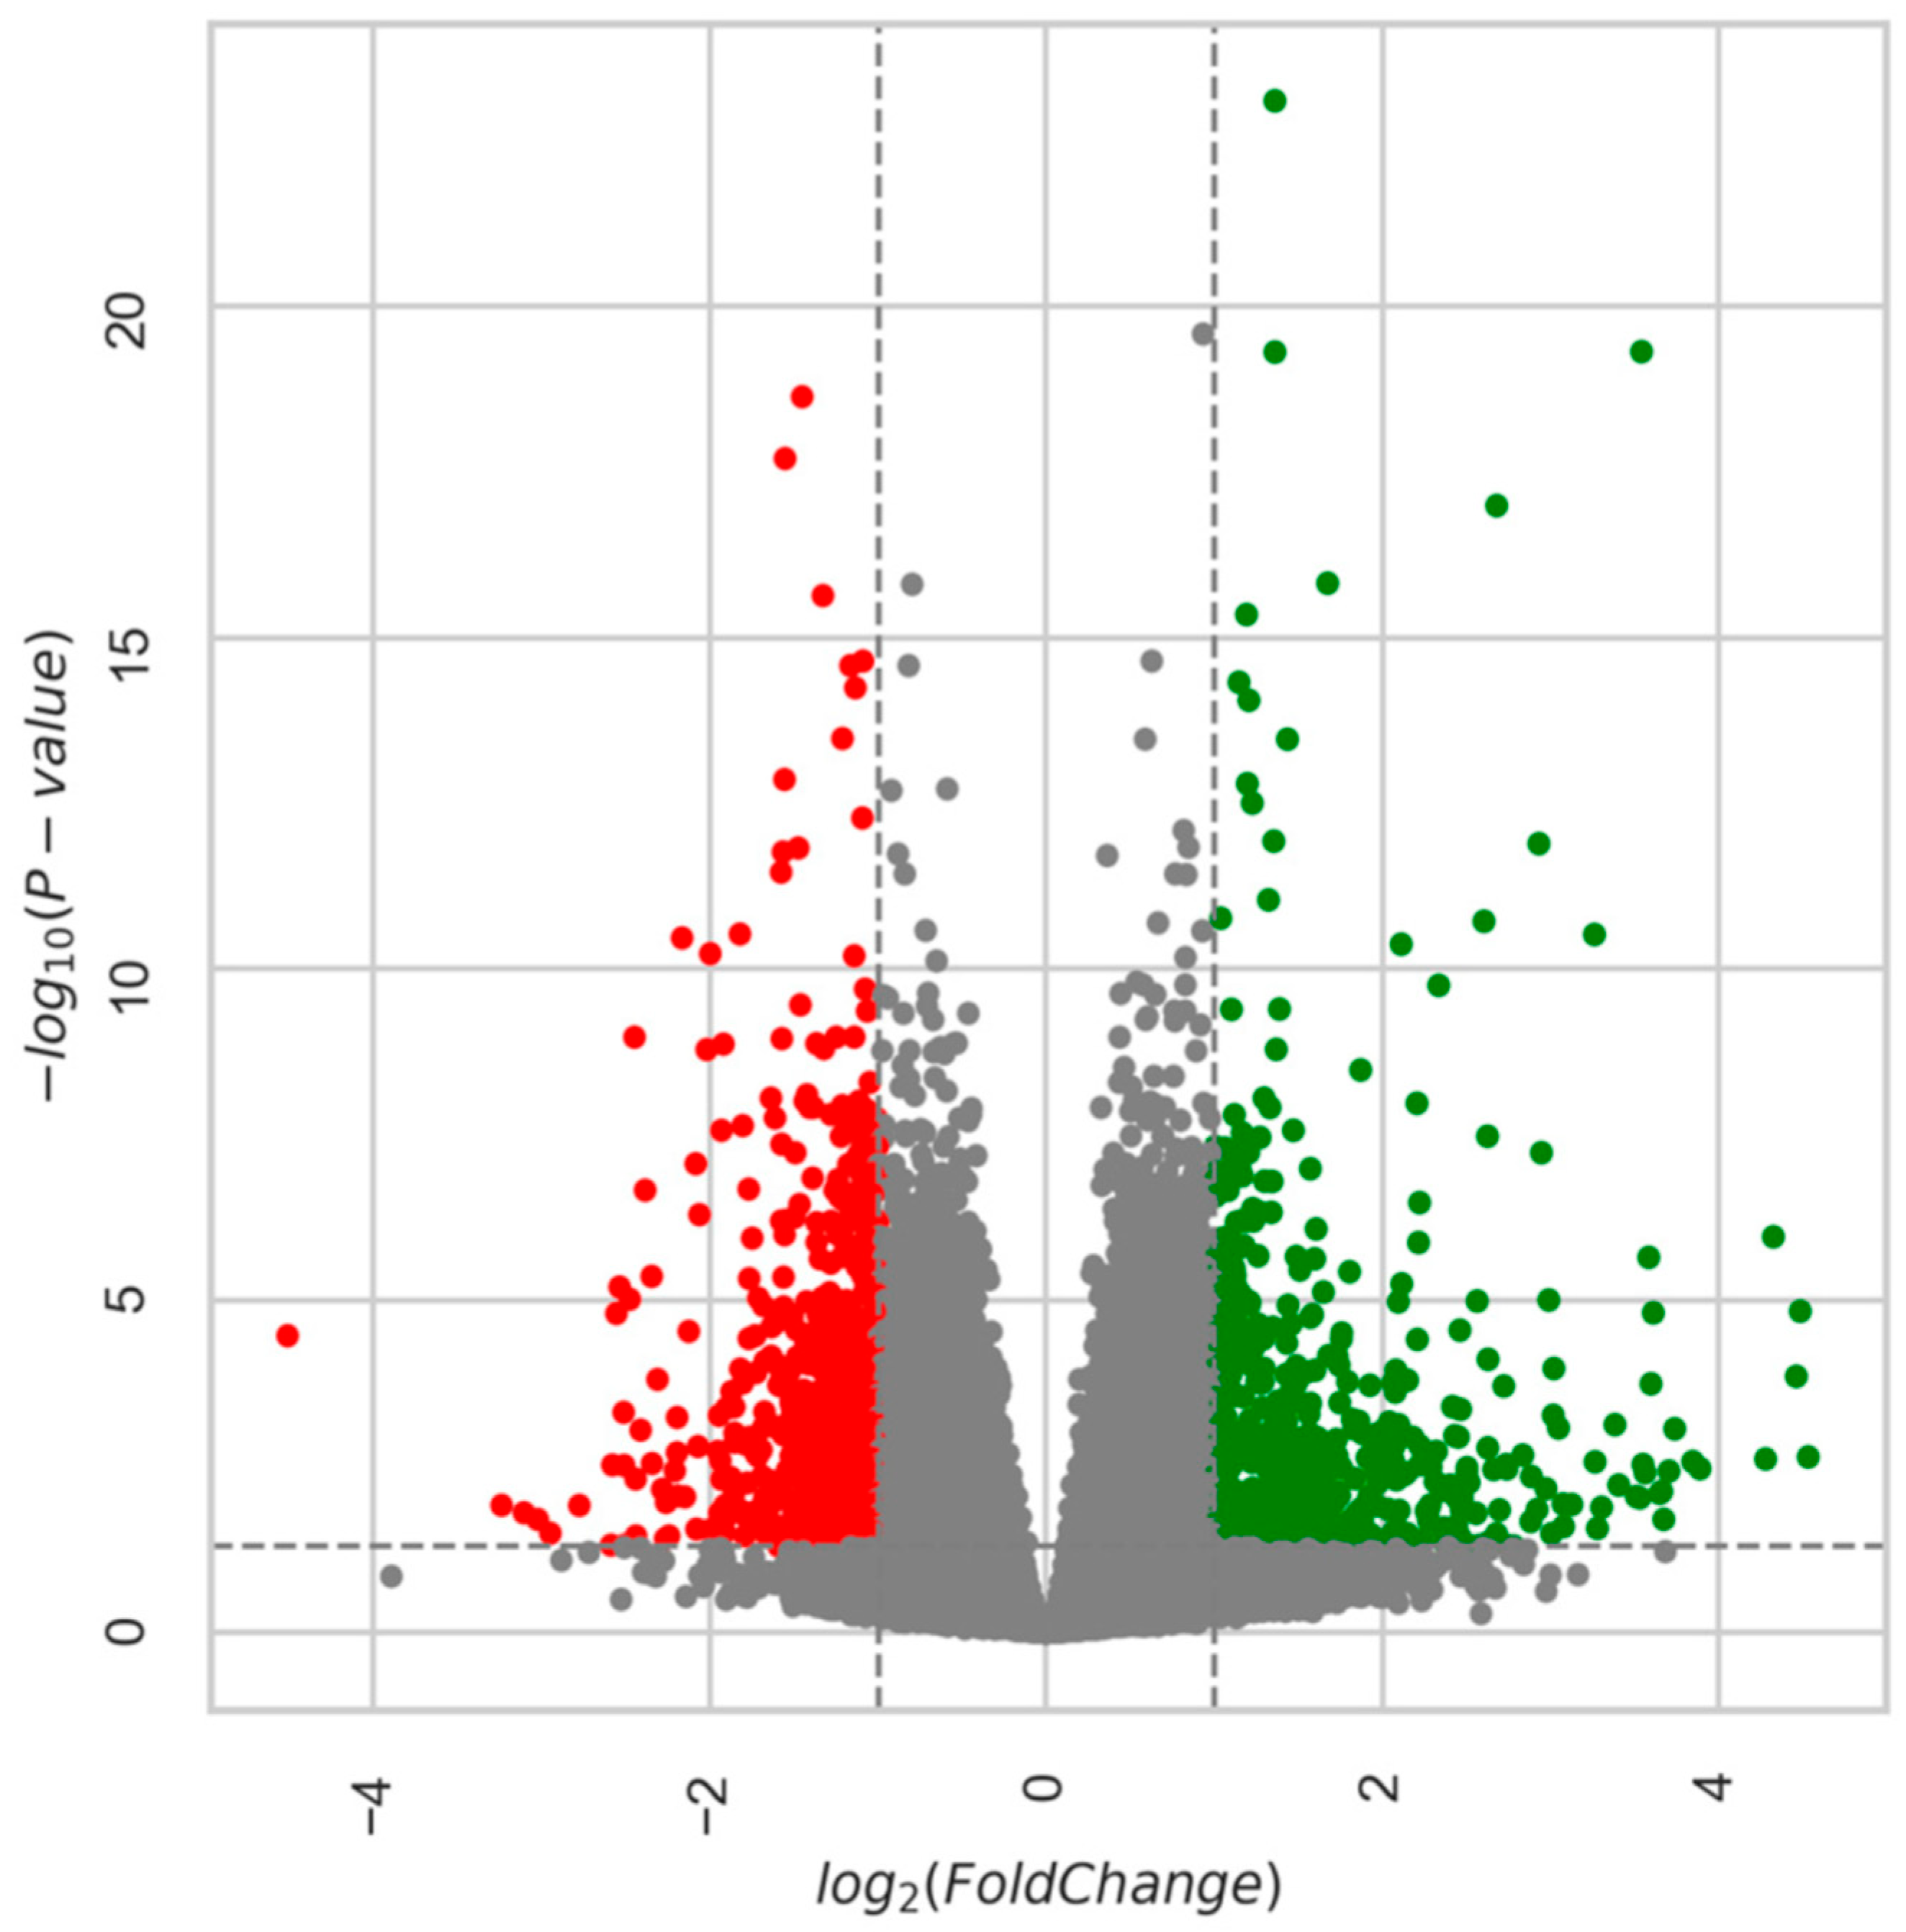
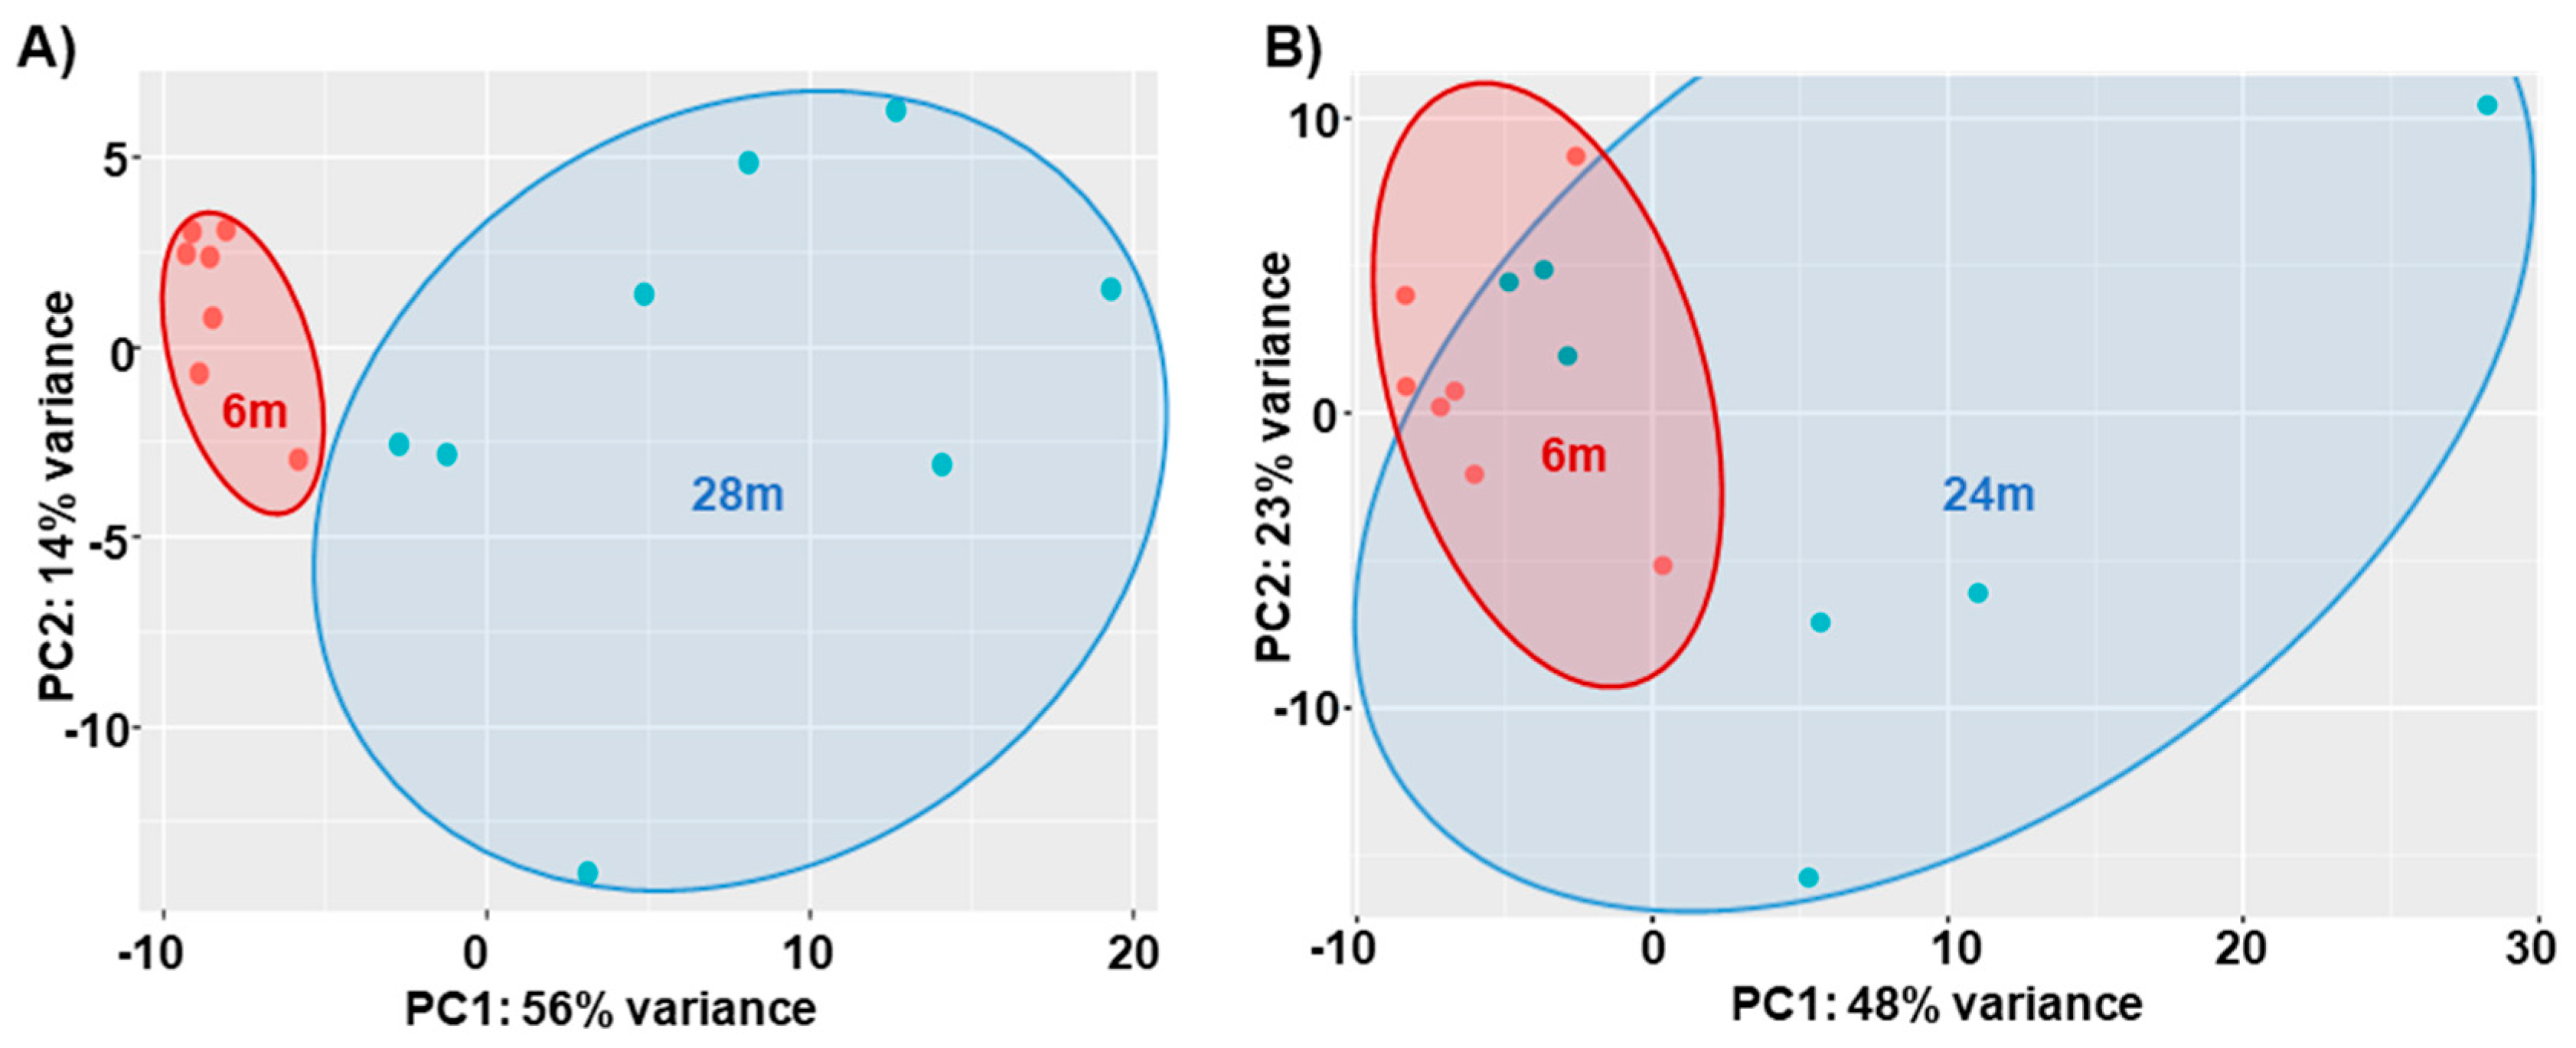
Age-Related DEGs: 28m Compared to 6m
Age-Related DEGs: 24m Compared to 6m Mice
4.2. Regressions of DEGs with CFAB
5. Discussion
5.1. Physical Function Declines with Aging
5.2. Age-Related Gene Expression Relationship with CFAB
5.3. Potential Mechanisms of Functional Age
5.4. Transcription Factor Gene Expression with Aging
5.5. Denervation and Neuromuscular Junction Degradation
5.6. DEGs Analysis
5.7. Temporal Signatures in Gene Expression
5.8. Bedrest, Disuse Atrophy, and Exercise
5.9. Caveats
6. Conclusions
Supplementary Materials
Author Contributions
Funding
Institutional Review Board Statement
Data Availability Statement
Acknowledgments
Conflicts of Interest
References
- Aversa, Z.; Zhang, X.; Fielding, R.A.; Lanza, I.; LeBrasseur, N.K. The clinical impact and biological mechanisms of skeletal muscle aging. Bone 2019, 127, 26–36. [Google Scholar] [CrossRef] [PubMed]
- Tsekoura, M.; Kastrinis, A.; Katsoulaki, M.; Billis, E.; Gliatis, J. Sarcopenia and Its Impact on Quality of Life. Adv. Exp. Med. Biol. 2017, 987, 213–218. [Google Scholar] [CrossRef] [PubMed]
- Billot, M.; Calvani, R.; Urtamo, A.; Sánchez-Sánchez, J.L.; Ciccolari-Micaldi, C.; Chang, M.; Roller-Wirnsberger, R.; Wirnsberger, G.; Sinclair, A.; Vaquero-Pinto, M.N.; et al. Preserving Mobility in Older Adults with Physical Frailty and Sarcopenia: Opportunities, Challenges, and Recommendations for Physical Activity Interventions. Clin. Interv. Aging 2020, 15, 1675–1690. [Google Scholar] [CrossRef] [PubMed]
- Pratt, J.; De Vito, G.; Narici, M.; Boreham, C. Neuromuscular Junction Aging: A Role for Biomarkers and Exercise. J. Gerontol. Ser. A 2021, 76, 576–585. [Google Scholar] [CrossRef]
- Deschenes, M.R. Motor Unit and Neuromuscular Junction Remodeling with Aging. Curr. Aging Sci. 2011, 4, 209–220. [Google Scholar] [CrossRef] [PubMed]
- Thompson, L.V. Age-related muscle dysfunction. Exp. Gerontol. 2009, 44, 106–111. [Google Scholar] [CrossRef]
- Coen, P.M.; Musci, R.V.; Hinkley, J.M.; Miller, B.F. Mitochondria as a Target for Mitigating Sarcopenia. Front. Physiol. 2019, 9, 1883. [Google Scholar] [CrossRef]
- Narici, M.V.; Maffulli, N. Sarcopenia: Characteristics, mechanisms and functional significance. Br. Med. Bull. 2010, 95, 139–159. [Google Scholar] [CrossRef]
- Graber, T.G.; Maroto, R.; Fry, C.S.; Brightwell, C.R.; Rasmussen, B.B. Measuring Exercise Capacity and Physical Function in Adult and Older Mice. J. Gerontol. Ser. A 2021, 76, 819–824. [Google Scholar] [CrossRef]
- Graber, T.G.; Ferguson-Stegall, L.; Liu, H.; Thompson, L.V. Voluntary Aerobic Exercise Reverses Frailty in Old Mice. J. Gerontol. Ser. A Biol. Sci. 2015, 70, 1045–1058. [Google Scholar] [CrossRef]
- Graber, T.G.; Kim, J.-H.; McLoon, L.K.; Grange, R.W.; Thompson, L.V. C57BL/6 Lifespan Study: Age-Related Declines in Muscle Power Production and Contractile Velocity. Age 2015, 37, 36. [Google Scholar] [CrossRef]
- Graber, T.G.; Ferguson-Stegall, L.; Kim, J.H.; Thompson, L.V. C57BL/6 neuromuscular healthspan scoring system. J. Gerontol. Ser. A 2013, 68, 1326–1336. [Google Scholar] [CrossRef]
- Graber, T.G.; Rawls, B.L.; Tian, B.; Durham, W.J.; Brightwell, C.R.; Brasier, A.R.; Rasmussen, B.B.; Fry, C.S. Repetitive TLR3 activation in the lung induces skeletal muscle adaptations and cachexia. Exp. Gerontol. 2018, 106, 88–100. [Google Scholar] [CrossRef]
- Graber, T.G.; Fry, C.S.; Brightwell, C.R.; Moro, T.; Maroto, R.; Bhattarai, N.; Porter, C.; Wakamiya, M.; Rasmussen, B.B. Skeletal muscle-specific knockout of DEP domain containing 5 protein increases mTORC1 signaling, muscle cell hypertrophy, and mitochondrial respiration. J. Biol. Chem. 2019, 294, 4091–4102. [Google Scholar] [CrossRef]
- Schaum, N.; Lehallier, B.; Hahn, O.; Pálovics, R.; Hosseinzadeh, S.; Lee, S.E.; Lee, D.P.; Losada, P.M.; Zardeneta, M.E.; Fehlmann, T.; et al. Ageing hallmarks exhibit organ-specific temporal signatures. Nature 2020, 583, 596–602. [Google Scholar] [CrossRef]
- Shavlakadze, T.; Morris, M.; Fang, J.; Wang, S.X.; Zhu, J.; Zhou, W.; Tse, H.W.; Mondragon-Gonzalez, R.; Roma, G.; Glass, D.J. Age-Related Gene Expression Signature in Rats Demonstrate Early, Late, and Linear Transcriptional Changes from Multiple Tissues. Cell Rep. 2019, 28, 3263–3273. [Google Scholar] [CrossRef]
- Zhuang, J.; Zhang, L.; Dai, S.; Cui, L.; Guo, C.; Sloofman, L.; Yang, J. Comparison of multi-tissue aging between human and mouse. Sci. Rep. 2019, 9, 6220. [Google Scholar] [CrossRef]
- Melov, S.; Tarnopolsky, M.A.; Beckman, K.; Felkey, K.; Hubbard, A. Resistance exercise reverses aging in human skeletal muscle. PLoS ONE 2007, 2, e465. [Google Scholar] [CrossRef]
- Kulkarni, A.S.; Peck, B.D.; Walton, R.G.; Kern, P.A.; Mar, J.C.; Windham, S.T.; Bamman, M.M.; Barzilai, N.; Peterson, C.A. Metformin alters skeletal muscle transcriptome adaptations to resistance training in older adults. Aging 2020, 12, 19852–19866. [Google Scholar] [CrossRef]
- Eden, E.; Navon, R.; Steinfeld, I.; Lipson, D.; Yakhini, Z. GOrilla: A tool for discovery and visualization of enriched GO terms in ranked gene lists. BMC Bioinform. 2009, 10, 48. [Google Scholar] [CrossRef]
- Subramanian, A.; Tamayo, P.; Mootha, V.K.; Mukherjee, S.; Ebert, B.L.; Gillette, M.A.; Paulovich, A.; Pomeroy, S.L.; Golub, T.R.; Lander, E.S.; et al. Gene set enrichment analysis: A knowledge-based approach for interpreting genome-wide expression profiles. PNAS 2005, 102, 15545–15550. [Google Scholar] [CrossRef] [PubMed]
- Graber, T.G.; Borack, M.S.; Reidy, P.T.; Volpi, E.; Rasmussen, B.B. Essential amino acid ingestion alters expression of genes associated with amino acid sensing, transport, and mTORC1 regulation in human skeletal muscle. Nutr. Metab. 2017, 14, 35. [Google Scholar] [CrossRef] [PubMed]
- Dobin, A.; Davis, C.A.; Schlesinger, F.; Drenkow, J.; Zaleski, C.; Jha, S.; Batut, P.; Chaisson, M.; Gingeras, T.R. STAR: Ultrafast universal RNA-seq aligner. Bioinformatics 2013, 29, 15–21. [Google Scholar] [CrossRef] [PubMed]
- Love, M.I.; Huber, W.; Anders, S. Moderated estimation of fold change and dispersion for RNA-seq data with DESeq2. Genome Biol. 2014, 15, 550. [Google Scholar] [CrossRef]
- R Core Team. R: A Language and Environment for Statistical Computing; R Foundation for Statistical Computing: Vienna, Austria, 2022; Available online: https://www.R-project.org/ (accessed on 22 October 2022).
- Chen, E.Y.; Tan, C.M.; Kou, Y.; Duan, Q.; Wang, Z.; Meirelles, G.V.; Clark, N.R.; Ma’ayan, A. Enrichr: Interactive and collaborative HTML5 gene list enrichment analysis tool. BMC Bioinform. 2013, 14, 128. [Google Scholar] [CrossRef] [PubMed]
- Kuleshov, M.V.; Jones, M.R.; Rouillard, A.D.; Fernandez, N.F.; Duan, Q.; Wang, Z.; Koplev, S.; Jenkins, S.L.; Jagodnik, K.M.; Lachmann, A.; et al. Enrichr: A comprehensive gene set enrichment analysis web server 2016 update. Nucleic Acids Res. 2016, 44, W90–W97. [Google Scholar] [CrossRef]
- Xie, Z.; Bailey, A.; Kuleshov, M.V.; Clarke, D.J.B.; Evangelista, J.E.; Jenkins, S.L.; Lachmann, A.; Wojciechowicz, M.L.; Kropiwnicki, E.; Jagodnik, K.M.; et al. Gene set knowledge discovery with Enrichr. Curr. Protoc. 2021, 1, e90. [Google Scholar] [CrossRef]
- Lachmann, A.; Xu, H.; Krishnan, J.; Berger, S.I.; Mazloom, A.R.; Ma’ayan, A. ChEA: Transcription factor regulation inferred from integrating genome-wide ChIP-X experiments. Bioinformatics 2010, 26, 2438–2444. [Google Scholar] [CrossRef]
- Maden-Wilkinson, T.M.; McPhee, J.S.; Jones, D.A.; Degens, H. Age-Related Loss of Muscle Mass, Strength, and Power and Their Association With Mobility in Recreationally-Active Older Adults in the United Kingdom. J. Aging Phys. Act. 2015, 23, 352–360. [Google Scholar] [CrossRef]
- Ganse, B.; Degens, H. Current Insights in the Age-related Decline in Sports Performance of the Older Athlete. Int. J. Sport. Med. 2021, 42, 879–888. [Google Scholar] [CrossRef]
- Wu, R.; De Vito, G.; Delahunt, E.; Ditroilo, M. Age-related Changes in Motor Function (I). Mechanical and Neuromuscular Factors. Int. J. Sport. Med. 2020, 41, 709–719. [Google Scholar] [CrossRef]
- Rahemi, H.; Nigam, N.; Wakeling, J.M. The effect of intramuscular fat on skeletal muscle mechanics: Implications for the elderly and obese. J. R. Soc. Interface 2015, 12, 20150365. [Google Scholar] [CrossRef]
- Wiedmer, P.; Jung, T.; Castro, J.P.; Pomatto, L.C.D.; Sun, P.Y.; Davies, K.J.A.; Grune, T. Sarcopenia—Molecular mechanisms and open questions. Ageing Res. Rev. 2021, 65, 101200. [Google Scholar] [CrossRef]
- Prochniewicz, E.; Thompson, L.V.; Thomas, D.D. Age-related decline in actomyosin structure and function. Exp. Gerontol. 2007, 42, 931–938. [Google Scholar] [CrossRef]
- Ko, J.; Na, M.; Kim, S.; Lee, J.R.; Kim, E. Interaction of the ERC family of RIM-binding proteins with the liprin-alpha family of multidomain proteins. J. Biol. Chem. 2003, 278, 42377–42385. [Google Scholar] [CrossRef]
- Chen, J.; Billings, S.E.; Nishimune, H. Calcium channels link the muscle-derived synapse organizer laminin β2 to Bassoon and CAST/Erc2 to organize presynaptic active zones. J. Neurosci. 2011, 31, 512–525. [Google Scholar] [CrossRef]
- Sleiman, M.B.; Jha, P.; Houtkooper, R.; Williams, R.W.; Wang, X.; Auwerx, J. The gene-regulatory footprint highlights conserved central regulators. Cell Rep. 2020, 32, 108203. [Google Scholar] [CrossRef]
- National Library of Medicine. National Center for Biotechnology Information. Available online: https://www.ncbi.nlm.nih.gov/gene?Db=gene&Cmd=ShowDetailView&TermToSearch=1052 (accessed on 8 February 2023).
- Hartl, L.; Maarschalkerweerd, P.A.; Butler, J.M.; Manz, X.D.; Thijssen, V.L.; Bijlsma, M.F.; Duitman, J.; Spek, C.A. C/EBPδ Suppresses Motility-Associated Gene Signatures and Reduces PDAC Cell Migration. Cells 2022, 11, 3334. [Google Scholar] [CrossRef]
- Ma, J.; Shen, J.; Lee, C.A.; Elsaidi, G.A.; Smith, T.L.; Walker, F.O.; Rushing, J.T.; Tan, K.H.; Koman, L.A.; Smith, B.P. Gene expression of nAChR, SNAP-25 and GAP-43 in skeletal muscles following botulinum toxin A injection: A study in rats. J. Orthop. Res. 2005, 23, 302–309. [Google Scholar] [CrossRef]
- Adams, L.; Carlson, B.M.; Henderson, L.; Goldman, D. Adaptation of nicotinic acetylcholine receptor, myogenin, and MRF4 gene expression to long-term muscle denervation. J. Cell Biol. 1995, 131, 1341–1349. [Google Scholar] [CrossRef]
- Hepple, R.T.; Rice, C.L. Innervation and neuromuscular control in ageing skeletal muscle. J. Physiol. 2016, 594, 1965–1978. [Google Scholar] [CrossRef] [PubMed]
- Coletti, C.; Acosta, G.F.; Keslacy, S.; Coletti, D. Exercise-mediated reinnervation of skeletal muscle in elderly people: An update. Eur. J. Transl. Myol. 2022, 32, 10416. [Google Scholar] [CrossRef] [PubMed]
- Dimitropoulou, A.; Bixby, J.L. Motor neurite outgrowth is selectively inhibited by cell surface MuSK and agrin. Mol. Cell. Neurosci. 2005, 28, 292–302. [Google Scholar] [CrossRef] [PubMed]
- Swenarchuk, L.E. Nerve, Muscle, and Synaptogenesis. Cells 2019, 8, 1448. [Google Scholar] [CrossRef]
- Berti, C.; Messali, S.; Ballabio, A.; Reymond, A.; Meroni, G. TRIM9 is specifically expressed in the embryonic and adult nervous system. Mech. Dev. 2002, 113, 159–162. [Google Scholar] [CrossRef]
- Plooster, M.; Menon, S.; Winkle, C.C.; Urbina, F.L.; Monkiewicz, C.; Phend, K.D.; Weinberg, R.J.; Gupton, S.L. TRIM9-dependent ubiquitination of DCC constrains kinase signaling, exocytosis, and axon branching. Mol. Biol. Cell 2017, 28, 2374–2385. [Google Scholar] [CrossRef]
- Ferrandi, P.J.; Khan, M.M.; Paez, H.G.; Pitzer, C.R.; Alway, S.E.; Mohamed, J.S. Transcriptome Analysis of Skeletal Muscle Reveals Altered Proteolytic and Neuromuscular Junction Associated Gene Expressions in a Mouse Model of Cerebral Ischemic Stroke. Genes 2020, 11, 726. [Google Scholar] [CrossRef]
- Barns, M.; Gondro, C.; Tellam, R.L.; Radley-Crabb, H.G.; Grounds, M.D.; Shavlakadze, T. Molecular analyses provide insight into mechanisms underlying sarcopenia and myofibre denervation in old skeletal muscles of mice. Int. J. Biochem. Cell Biol. 2014, 53, 174–185. [Google Scholar] [CrossRef]
- Kang, Y.K.; Min, B.; Eom, J.; Park, J.S. Different phases of aging in mouse old skeletal muscle. Aging 2022, 14, 143–160. [Google Scholar] [CrossRef]
- Mahmassani, Z.S.; Reidy, P.T.; McKenzie, A.I.; Stubben, C.; Howard, M.T.; Drummond, M.J. Age-dependent skeletal muscle transcriptome response to bed rest-induced atrophy. J. Appl. Physiol. 2019, 126, 894–902. [Google Scholar] [CrossRef]
- Fisher, A.G.; Seaborne, R.A.; Hughes, T.M.; Gutteridge, A.; Stewart, C.; Coulson, J.M.; Sharples, A.P.; Jarvis, J.C. Transcriptomic and epigenetic regulation of disuse atrophy and the return to activity in skeletal muscle. FASEB J. 2017, 31, 5268–5282. [Google Scholar] [CrossRef]
- Fiatarone, M.A.; Marks, E.C.; Ryan, N.D.; Meredith, C.N.; Lipsitz, L.A.; Evans, W.J. High-intensity strength training in nonagenarians. Effects on skeletal muscle. JAMA 1990, 263, 3029–3034. [Google Scholar] [CrossRef]
- Wu, Z.J.; Wang, Z.Y.; Gao, H.E.; Zhou, X.F.; Li, F.H. Impact of high-intensity interval training on cardiorespiratory fitness, body composition, physical fitness, and metabolic parameters in older adults: A meta-analysis of randomized controlled trials. Exp. Gerontol. 2021, 150, 111345. [Google Scholar] [CrossRef]
- Izquierdo, M.; Merchant, R.A.; Morley, J.E.; Anker, S.D.; Aprahamian, I.; Arai, H.; Aubertin-Leheudre, M.; Bernabei, R.; Cadore, E.L.; Cesari, M.; et al. International Exercise Recommendations in Older Adults (ICFSR): Expert Consensus Guidelines. J. Nutr. Health Aging 2021, 25, 824–853. [Google Scholar] [CrossRef]
- Pillon, N.J.; Gabriel, B.M.; Dollet, L.; Smith, J.A.B.; Puig, L.S.; Botella, J.; Bishop, D.J.; Krook, A.; Zierath, J.R. Transcriptomic profiling of skeletal muscle adaptations to exercise and inactivity. Nat. Commun. 2020, 11, 470. [Google Scholar] [CrossRef]
- Anderson, D.M.; Anderson, K.M.; Chang, C.L.; Makarewich, C.A.; Nelson, B.R.; McAnally, J.R.; Kasaragod, P.; Shelton, J.M.; Liou, J.; Bassel-Duby, R.; et al. A micropeptide encoded by a putative long noncoding RNA regulates muscle performance. Cell 2015, 160, 595–606. [Google Scholar] [CrossRef]
- Lin, I.H.; Chang, J.L.; Hua, K.; Huang, W.C.; Hsu, M.T.; Chen, Y.F. Skeletal muscle in aged mice reveals extensive transformation of muscle gene expression. BMC Genet. 2018, 19, 55. [Google Scholar] [CrossRef]
- Anderson, D.M.; Makarewich, C.A.; Anderson, K.M.; Shelton, J.M.; Bezprozvannaya, S.; Bassel-Duby, R.; Olson, E.N. Widespread control of calcium signaling by a family of SERCA-inhibiting micropeptides. Sci. Signal. 2016, 9, ra119. [Google Scholar] [CrossRef]
- Sopariwala, D.H.; Pant, M.; Shaikh, S.A.; Goonasekera, S.A.; Molkentin, J.D.; Weisleder, N.; Ma, J.; Pan, Z.; Periasamy, M. Sarcolipin overexpression improves muscle energetics and reduces fatigue. J. Appl. Physiol. 2015, 118, 1050–1058. [Google Scholar] [CrossRef]
- Bal, N.C.; Maurya, S.K.; Sopariwala, D.H.; Sahoo, S.K.; Gupta, S.C.; Shaikh, S.A.; Pant, M.; Rowland, L.A.; Bombardier, E.; Goonasekera, S.A.; et al. Sarcolipin is a newly identified regulator of muscle-based thermogenesis in mammals. Nat. Med. 2012, 18, 1575–1579. [Google Scholar] [CrossRef] [PubMed]
- Voit, A.; Patel, V.; Pachon, R.; Shah, V.; Bakhutma, M.; Kohlbrenner, E.; McArdle, J.J.; Dell’Italia, L.J.; Mendell, J.R.; Xie, L.-H.; et al. Reducing sarcolipin expression mitigates Duchenne muscular dystrophy and associated cardiomyopathy in mice. Nat Commun. 2017, 8, 1068. [Google Scholar] [CrossRef] [PubMed]
- Tupling, A.R.; Bombardier, E.; Gupta, S.C.; Hussain, D.; Vigna, C.; Bloemberg, D.; Quadrilatero, J.; Trivieri, M.G.; Babu, G.J.; Backx, P.H.; et al. Enhanced Ca2+ transport and muscle relaxation in skeletal muscle from sarcolipin-null mice. Am. J. Physiol. Cell Physiol. 2011, 301, C841–C849. [Google Scholar] [CrossRef]
- Fajardo, V.A.; Rietze, B.A.; Chambers, P.J.; Bellissimo, C.; Bombardier, E.; Quadrilatero, J.; Tupling, A.R. Effects of sarcolipin deletion on skeletal muscle adaptive responses to functional overload and unload. Am. J. Physiol. Cell Physiol. 2017, 313, C154–C161. [Google Scholar] [CrossRef] [PubMed]
- Maurya, S.K.; Bal, N.C.; Sopariwala, D.H.; Pant, M.; Rowland, L.A.; Shaikh, S.A.; Periasamy, M. Sarcolipin Is a Key Determinant of the Basal Metabolic Rate, and Its Overexpression Enhances Energy Expenditure and Resistance against Diet-induced Obesity. J. Biol. Chem. 2015, 290, 10840–10849. [Google Scholar] [CrossRef]
- Tupling, A.R.; Asahi, M.; MacLennan, D.H. Sarcolipin overexpression in rat slow twitch muscle inhibits sarcoplasmic reticulum Ca2+ uptake and impairs contractile function. J. Biol. Chem. 2002, 277, 44740–44746. [Google Scholar] [CrossRef]


| Age | n | Body Mass | Total Muscle | TA |
|---|---|---|---|---|
| months | g | mg | mg | |
| 6 | 8 | 33.04 ± 0.42 | 286.75 ± 6.97 | 58.39 ± 1.30 |
| 24 | 8 | 33.71 ± 0.67 | 254.52 ± 7.27 a | 50.14 ± 1.96 a |
| 28 | 8 | 31.01 ± 1.05 | 206.13 ± 5.75 b | 43.48 ± 0.96 b |
| Gene_Id | AKA | NCIB Gene # | MGI # | log2fc | padj | Type |
|---|---|---|---|---|---|---|
| Bpifb1 | LPLUNC1 | 228801 | 2137431 | 4.53 | 2.26 × 10⁻³ | pc |
| Krt18 | CK18, Endo B | 16668 | 96692 | 4.49 | 1.43 × 10⁻⁵ | pc |
| Ubd | Diubiquitin, FAT10 | 24108 | 1344410 | 4.46 | 1.38 × 10⁻⁴ | pc |
| Sln | 2310045A07Rik | 66402 | 1913652 | 4.33 | 1.08 × 10⁻⁶ | pc |
| Tac4 | HK-1 | 93670 | 193,130 | 4.28 | 2.42 × 10⁻³ | pc |
| Sprr1a | SPR1a | 20753 | 106660 | 3.89 | 3.38 × 10⁻³ | pc |
| Syt4 | SytIV | 20983 | 101759 | 3.85 | 2.65 × 10⁻³ | pc |
| Dntt | Tdt | 21673 | 98659 | 3.74 | 8.49 × 10⁻⁴ | pc |
| Atp13a4 | 4631413J11Rik | 224079 | 1924456 | 3.71 | 3.68 × 10⁻³ | pc |
| Hamp2 | HEPC2 | 66438 | 2153530 | 3.68 | 6.02 × 10⁻² | pc |
| 1300002K09Rik | Stra6l, Rbpr2 | 74152 | 1921402 | 3.67 | 1.97 × 10⁻² | pc |
| 4930558C23Rik | Ctxnd2 | 67654 | 1914904 | 3.66 | 7.45 × 10⁻³ | pc |
| Ccl17 | Scya17, TARC | 20295 | 1329039 | 3.65 | 7.98 × 10⁻³ | pc |
| 1110059M19Rik | Prr32 | 68800 | 1916050 | 3.61 | 1.52 × 10⁻⁵ | pc |
| Chrng | Achr-3, Acrg | 11449 | 87895 | 3.60 | 1.78 × 10⁻⁴ | pc |
| AA467197 | NMES1 | 433470 | 3034182 | 3.59 | 2.21 × 10⁻⁶ | pc |
| Neil3 | C85903 | 234258 | 2384588 | 3.56 | 3.90 × 10⁻³ | pc |
| Nppb | BNP, BNF | 18158 | 97368 | 3.55 | 2.93 × 10⁻³ | pc |
| Erc2 | CAST, ELKS | 238988 | 1098749 | 3.54 | 4.92 × 10⁻²⁰ | pc |
| Orm2 | Orm-2, Agp1 | 18406 | 97444 | 3.53 | 9.31 × 10⁻³ | pc |
| C130026I21Rik | 4930565N07Rik | 620078 | 3612702 | 3.51 | 8.89 × 10⁻³ | pc |
| Olig1 | Bhlhb6 | 50914 | 1355334 | 3.41 | 5.99 × 10⁻³ | pc |
| F10 | Cf10, Al1947 | 14058 | 103107 | 3.38 | 7.35 × 10⁻⁴ | pc |
| Igfbp2 | IBP-2 | 16008 | 96437 | 3.30 | 1.30 × 10⁻² | pc |
| Gbp1 | Gbp2b, Mpa1 | 14468 | 95666 | 3.28 | 2.69 × 10⁻² | pc |
| Gm7609 | EG665378 | 665378 | 3644536 | 3.27 | 2.67 × 10⁻³ | pc |
| Gdf5 | brp, CDMP-1 | 14563 | 95688 | 3.26 | 3.01 × 10⁻¹¹ | pc |
| Cd5l | AIM, Api6 | 11801 | 1334419 | 3.16 | 1.33 × 10⁻¹ | pc |
| Krt8 | Card2, EndoA | 16691 | 96705 | 3.13 | 1.17 × 10⁻² | pc |
| Cdca5 | Sororin p35 | 67849 | 1915099 | 3.08 | 2.52 × 10⁻² | pc |
| Gene_Id | AKA | NCIB Gene | MGI | log2fc | padj | Type |
|---|---|---|---|---|---|---|
| 9130404H23Rik | Themis3 | 74556 | 1921806 | −4.51 | 3.35 × 10⁻⁵ | pc |
| 5330417C22Rik | Elapor1 | 229722 | 1923930 | −3.24 | 1.21 × 10⁻² | pc |
| Nlrp1c-ps | Nalp1c | 627984 | 3582962 | −3.11 | 1.56 × 10⁻² | pseudo |
| Oxct2a | Scot-t1 | 64059 | 1891061 | −3.02 | 1.97 × 10⁻² | pc |
| 1700001K23Rik | 69319 | 1916569 | −2.95 | 3.18 × 10⁻² | lncRNA | |
| Kcng1 | AW536275 | 241794 | 3616086 | −2.78 | 1.21 × 10⁻² | pc |
| Gpr165 | 6530406P05Rik | 76206 | 1923456 | −2.59 | 4.81 × 10⁻² | pc |
| Fbxo48 | A630050E13Rik | 319701 | 2442569 | −2.58 | 2.98 × 10⁻³ | pc |
| 1700071M16Rik | 73504 | 1920754 | −2.56 | 1.55 × 10⁻⁵ | lncRNA | |
| 1700001O22Rik | 1700113K14Rik | 73598 | 1923631 | −2.54 | 6.18 × 10⁻⁶ | pc |
| Prap1 | Upa | 22264 | 893573 | −2.51 | 4.80 × 10⁻⁴ | pc |
| E130008D07Rik | 545207 | 3584523 | −2.51 | 3.02 × 10⁻³ | lncRNA | |
| Hrh4 | H4R | 225192 | 2429635 | −2.51 | 5.20 × 10⁻² | pc |
| Trim9 | mKIAA0282 | 94090 | 2137354 | −2.51 | 4.82 × 10⁻² | pc |
| Zfp366 | DC-SCRIPT | 238803 | 2178429 | −2.48 | 9.45 × 10⁻⁶ | pc |
| Grem2 | Prdc | 23893 | 1344367 | −2.45 | 1.06 × 10⁻⁹ | pc |
| Rgag1 | Rtl9, Mar9 | 209540 | 2685231 | −2.44 | 4.84 × 10⁻³ | pc |
| Duox2 | LNOX2 | 214593 | 3036280 | −2.44 | 3.50 × 10⁻² | pc |
| Nos1 | bNOS, nNOS | 18125 | 97360 | −2.41 | 8.87 × 10⁻⁴ | pc |
| 4932411E22Rik | Ankfn1, nmf9 | 382543 | 2686021 | −2.41 | 5.31 × 10⁻² | pc |
| Epha3 | Cek4, End3 | 13837 | 99612 | −2.38 | 2.15 × 10⁻⁷ | pc |
| Il1rl2 | IL-1Rrp2 | 107527 | 1913107 | −2.35 | 4.27 × 10⁻⁶ | pc |
| Nptxr | NPCD, NPR | 73340 | 1920590 | −2.34 | 2.83 × 10⁻³ | pc |
| 2700086A05Rik | Hoxaas3 | 72628 | 1919878 | −2.31 | 1.53 × 10⁻⁴ | anti-IncRNA |
| Gm16982 | 100036523 | 4439906 | −2.28 | 6.93 × 10⁻³ | IncRNA | |
| Nrk | Nesk | 27206 | 1351326 | −2.27 | 3.87 × 10⁻² | pc |
| Hist1h2af | H2ac10, H2a-22 | 319173 | 2448309 | −2.26 | 1.09 × 10⁻² | pc |
| Tll2 | 24087 | 1346044 | −2.24 | 3.50 × 10⁻² | pc | |
| Igsf9b | AI414108 | 235086 | 2685354 | −2.21 | 3.63 × 10⁻³ | pc |
| Necab1 | Efcbp1, STIP-1 | 69352 | 1916602 | −2.20 | 1.95 × 10⁻³ | pc |
| Gene_Id | Slope | R | R2 | Intercept | pval | log2fc | padj |
|---|---|---|---|---|---|---|---|
| Dclk3 | 0.041 | 0.899 | 0.809 | 3.864 | 5.073 × 10⁻⁶ | −1.025 | 6.75 × 10⁻⁴ |
| Plekhg1 | 0.085 | 0.896 | 0.803 | 7.093 | 6.124 × 10⁻⁶ | −1.141 | 6.29 × 10⁻¹¹ |
| Zfp750 | 0.078 | 0.895 | 0.801 | 4.812 | 6.525 × 10⁻⁶ | −1.571 | 1.12 × 10⁻⁹ |
| Gabrd | −0.053 | −0.886 | 0.784 | 3.839 | 1.125 × 10⁻⁵ | 1.201 | 4.12 × 10⁻⁵ |
| Erc2 | −0.172 | −0.882 | 0.778 | 4.290 | 1.357 × 10⁻⁵ | 3.543 | 4.92 × 10⁻²⁰ |
| Ier3 | −0.092 | −0.881 | 0.777 | 7.172 | 1.405 × 10⁻⁵ | 1.227 | 3.14 × 10⁻¹³ |
| P2ry1 | 0.086 | 0.881 | 0.776 | 8.163 | 1.456 × 10⁻⁵ | −1.076 | 2.00 × 10⁻¹⁰ |
| Kdr | 0.114 | 0.880 | 0.775 | 10.616 | 1.506 × 10⁻⁵ | −1.280 | 1.55 × 10⁻⁸ |
| Pde4a | 0.099 | 0.877 | 0.770 | 10.901 | 1.731 × 10⁻⁵ | −1.211 | 3.34 × 10⁻¹⁴ |
| Zyg11a | 0.057 | 0.875 | 0.765 | 4.134 | 1.973 × 10⁻⁵ | −1.329 | 1.51 × 10⁻⁵ |
| Pcdh12 | 0.112 | 0.873 | 0.762 | 7.446 | 2.161 × 10⁻⁵ | −1.273 | 2.35 × 10⁻⁵ |
| Lynx1 | 0.096 | 0.873 | 0.762 | 12.112 | 2.162 × 10⁻⁵ | −1.052 | 5.13 × 10⁻⁷ |
| Lhfpl4 | −0.047 | −0.855 | 0.731 | 4.098 | 4.851 × 10⁻⁵ | 1.015 | 9.99 × 10⁻⁵ |
| Tspan18 | 0.080 | 0.855 | 0.731 | 5.875 | 4.912 × 10⁻⁵ | −1.120 | 4.08 × 10⁻⁵ |
| Kcng4 | 0.104 | 0.853 | 0.728 | 10.729 | 5.212 × 10⁻⁵ | −1.327 | 2.34 × 10⁻¹⁶ |
| BC051142 | −0.061 | −0.850 | 0.723 | 2.516 | 5.983 × 10⁻⁵ | 2.462 | 2.77 × 10⁻⁵ |
| Cacna2d4 | 0.118 | 0.849 | 0.721 | 8.663 | 6.176 × 10⁻⁵ | −1.435 | 9.73 × 10⁻⁹ |
| Spint2 | −0.097 | −0.844 | 0.712 | 6.437 | 7.667 × 10⁻⁵ | 1.436 | 3.42 × 10⁻¹⁴ |
| Cyp1a1 | −0.076 | −0.842 | 0.709 | 4.882 | 8.145 × 10⁻⁵ | 1.211 | 1.04 × 10⁻⁵ |
| Mmp15 | 0.088 | 0.841 | 0.707 | 9.482 | 8.653 × 10⁻⁵ | −1.069 | 1.31 × 10⁻⁸ |
| Vwa3a | 0.066 | 0.841 | 0.707 | 4.803 | 8.676 × 10⁻⁵ | −1.184 | 1.32 × 10⁻⁴ |
| Frem1 | 0.055 | 0.839 | 0.704 | 4.218 | 9.120 × 10⁻⁵ | −1.214 | 1.40 × 10⁻⁴ |
| Gm5105 | 0.153 | 0.839 | 0.704 | 7.955 | 9.232 × 10⁻⁵ | −1.930 | 2.69 × 10⁻⁸ |
| Mfap3l | 0.078 | 0.838 | 0.703 | 7.795 | 9.483 × 10⁻⁵ | −1.089 | 2.27 × 10⁻¹⁵ |
| Dnmt3a | 0.090 | 0.837 | 0.701 | 10.929 | 9.949 × 10⁻⁵ | −1.163 | 2.66 × 10⁻¹⁵ |
| Rbm3 | −0.104 | −0.837 | 0.700 | 9.704 | 1.000 × 10⁻⁴ | 1.355 | 1.18 × 10⁻¹² |
| Akap12 | 0.082 | 0.836 | 0.698 | 8.347 | 1.050 × 10⁻⁴ | −1.048 | 5.10 × 10⁻⁹ |
| Col4a3 | 0.072 | 0.835 | 0.697 | 5.853 | 1.075 × 10⁻⁴ | −1.081 | 7.96 × 10⁻⁶ |
| Psd3 | 0.094 | 0.833 | 0.695 | 9.824 | 1.134 × 10⁻⁴ | −1.119 | 6.34 × 10⁻⁸ |
| Atp2b4 | 0.085 | 0.833 | 0.695 | 8.714 | 1.137 × 10⁻⁴ | −1.134 | 5.74 × 10⁻¹⁵ |
Disclaimer/Publisher’s Note: The statements, opinions and data contained in all publications are solely those of the individual author(s) and contributor(s) and not of MDPI and/or the editor(s). MDPI and/or the editor(s) disclaim responsibility for any injury to people or property resulting from any ideas, methods, instructions or products referred to in the content. |
© 2023 by the authors. Licensee MDPI, Basel, Switzerland. This article is an open access article distributed under the terms and conditions of the Creative Commons Attribution (CC BY) license (https://creativecommons.org/licenses/by/4.0/).
Share and Cite
Graber, T.G.; Maroto, R.; Thompson, J.K.; Widen, S.G.; Man, Z.; Pajski, M.L.; Rasmussen, B.B. Skeletal Muscle Transcriptome Alterations Related to Declining Physical Function in Older Mice. J. Ageing Longev. 2023, 3, 159-178. https://doi.org/10.3390/jal3020013
Graber TG, Maroto R, Thompson JK, Widen SG, Man Z, Pajski ML, Rasmussen BB. Skeletal Muscle Transcriptome Alterations Related to Declining Physical Function in Older Mice. Journal of Ageing and Longevity. 2023; 3(2):159-178. https://doi.org/10.3390/jal3020013
Chicago/Turabian StyleGraber, Ted G., Rosario Maroto, Jill K. Thompson, Steven G. Widen, Zhaohui Man, Megan L. Pajski, and Blake B. Rasmussen. 2023. "Skeletal Muscle Transcriptome Alterations Related to Declining Physical Function in Older Mice" Journal of Ageing and Longevity 3, no. 2: 159-178. https://doi.org/10.3390/jal3020013