Article

Association between Malnutrition Risk Factors and Physical Function in Community-Dwelling Adults ≥80 Years

1
Research Unit of General Practice, Department of Public Health, University of Southern Denmark, J. B. Winsløws Vej 9A, 5000 Odense C, Denmark
2
Department of Health, Culture and Development, Municipality of Tonder, Wegners Plads 2, 6270 Tonder, Denmark
3
Center for Active and Healthy Ageing, Department of Sports Science and Biomechanics, University of Southern Denmark, Campusvej 55, 5230 Odense M, Denmark
*
Author to whom correspondence should be addressed.
J. Ageing Longev. 2023, 3(1), 33-45; https://doi.org/10.3390/jal3010003
Submission received: 29 November 2022 / Revised: 13 December 2022 / Accepted: 22 December 2022 / Published: 6 January 2023

Abstract

:
Malnutrition is associated with accelerated loss of physical function in old adults, but the assessment of malnutrition in primary prevention is challenging. This study aimed to investigate if malnutrition risk factors; poor appetite, dysphagia, and poor dental state, were associated with reduced physical function in community-dwelling adults ≥80 years. The study is based on data from two cross-sectional studies. Physical function was assessed by the Short Physical Performance Battery (score ≤ 9 indicate reduced physical function) and poor appetite, dysphagia and poor dental status was assessed by single questions. A total of 900 participants were included (age 85.1 ± 3.7 years; 60.9% females; 62.8% had reduced physical function). Participants with reduced physical function were older, had a higher BMI, more polypharmacy, more falls, and lower quality of life. Poor appetite was reported by 10.8% and associated with reduced physical function (adjusted-OR 1.93, 95%CI 1.18–3.15). No association was identified between dysphagia, poor dental state and reduced physical function (adjusted-OR 0.96, 95%CI 0.53–1.75 and adjusted-OR 0.99, 95%CI 0.41–2.35, respectively). The assessment of appetite during primary preventive strategies was feasible and may offer an opportunity for identification of very old community-dwelling adults at risk of reduced physical function.

1. Introduction

The European population of adults ≥80 years is projected to undergo a dramatic two-and-a-half-fold increase by year 2100 [1]. Older age is associated with reduced physical function and increased risk of functional dependency [2,3], which translates into greater need for external support [4] and health care costs [5]. To limit the consequences of the ageing population on health care systems, prevention of loss of physical function in community-dwelling adults is a target of primary preventive strategies. Malnutrition, defined as insufficient intake or uptake of nutrition (energy and/or nutrients, e.g., protein), plays a central role in the accelerated decline in physical and mental function with ageing [6]. Malnutrition leads to altered body composition with loss of fat free mass and is associated with multiple negative health outcomes including increased risk of falls, frequent hospitalizations, longer recovery, increased need for in-home services, and reduced quality of life [7,8,9]. In addition, malnutrition may increase risk of geriatric syndromes such as sarcopenia, sarcopenic obesity and physical frailty [10,11,12,13]. In a recent systematic review, the pooled prevalence rate of malnutrition was 8.5% in European community-dwelling adults ≥65 years and the prevalence increased with increasing age [14]. Malnutrition has a multifactorial etiology and is characterized by multiple risk factors that may affect the desire or ability to eat an adequate diet, increase the risk of unintentional weight loss and ultimately translate into malnutrition [15,16,17]. Preventing or even reversing malnutrition is possible at an early stage [8] and may reduce the risk of accelerated loss of physical function in older adults. However, assessing the risk of malnutrition, especially at a population level is challenging. Self-reported unintentional weight loss is often used in national primary preventive services as an indicator of malnutrition and elevated risk of functional loss and dependency [18]. Regardless, self-reported unintentional weight loss may (i) be insufficient to identify inadequate intake of macro- or micronutrients which may affect body composition without reducing weight, and (ii) be detected relatively late in the progression of malnutrition and only where energy imbalance occurs. We previously reported that the prevalence of unintentional weight loss was relatively low in ≥80 years community-dwelling adults (6.9–13.2%) while prevalence of protein malnutrition was much greater (54%) [19]. In addition, we reported that different risk factors such as poor appetite, mouth dryness, and pain, and in particular the combination of such risk factors was associated with greater odds of protein malnutrition [19]. Poor appetite, dysphagia and poor dental state have previously been identified as malnutrition risk factors that may decrease the desire to eat, the enjoyments of meals or the ability to eat specific food items [15,16] and they are often reported in older adults [20,21,22,23,24]. Evaluating malnutrition risk factors such as poor appetite, dysphagia, poor dental state at population level through simple, inexpensive, and easy to administer questionnaires embedded in an existing nationally regulated primary preventive service seems feasible [25]. This may offer a potential for early identification of older adults at risk of malnutrition which may contribute to deteriorate physical function in community-dwelling adults. Regardless, the association between such malnutrition risk factors and reduced physical function in older adults and especially in the oldest old (≥80 years-old) is currently unknown. The aim of the present study is therefore to investigate the association between important risk factors for malnutrition (poor appetite, dysphagia, and poor dental state) and reduced physical function in community-dwelling adults ≥80 years. Malnutrition risk factors are assessed by a simple set of questions and embedded in the national primary preventive services. Results will indicate if assessment of further nutritional aspects, besides unintentional weight loss, may improve the early identification of older community-dwelling adults who are at risk of loss of physical function.

2. Materials and Methods

2.1. Study Design

This study was based on cross-sectional data from two Danish studies in old community-dwelling adults: (i) the Welfare Innovation in Primary Prevention (WIPP) study, and (ii) the I’m Still Standing (ISS) study.
Details of the WIPP-study has previously been described [25]. In brief, the WIPP study aimed to promote active and healthy ageing. One initiative was to test an innovative screening model during the preventive home visits which is a nationally regulated service offered to older adults who are on retirement and do not rely on in-home health care services. Data were collected from June 2017 to September 2019 in the Municipalities of Odense, Slagelse, and Esbjerg, Denmark. A total of 784 participants ≥80 years were included.
Detailed description of the ISS study has previously been published [19]. Briefly, the ISS study aimed to characterize the nutritional intake, physical function, and health status in the group of community-dwelling adults ≥80 years that are offered preventive home visits in the Municipality of Odense, Denmark. A total of 141 participants were included in the study. Data were collected from January 2017 to August 2018. The handling of data agreed with the legislation on protection of personal data as instructed by the Danish Data Protection Agency (WIPP: reg. no. 10.583; ISS: reg. no. 18/12126). Reporting of the present study followed the Strengthening of Reporting of Observational Studies in Epidemiology (STROBE) guidelines for cross-sectional studies [26].

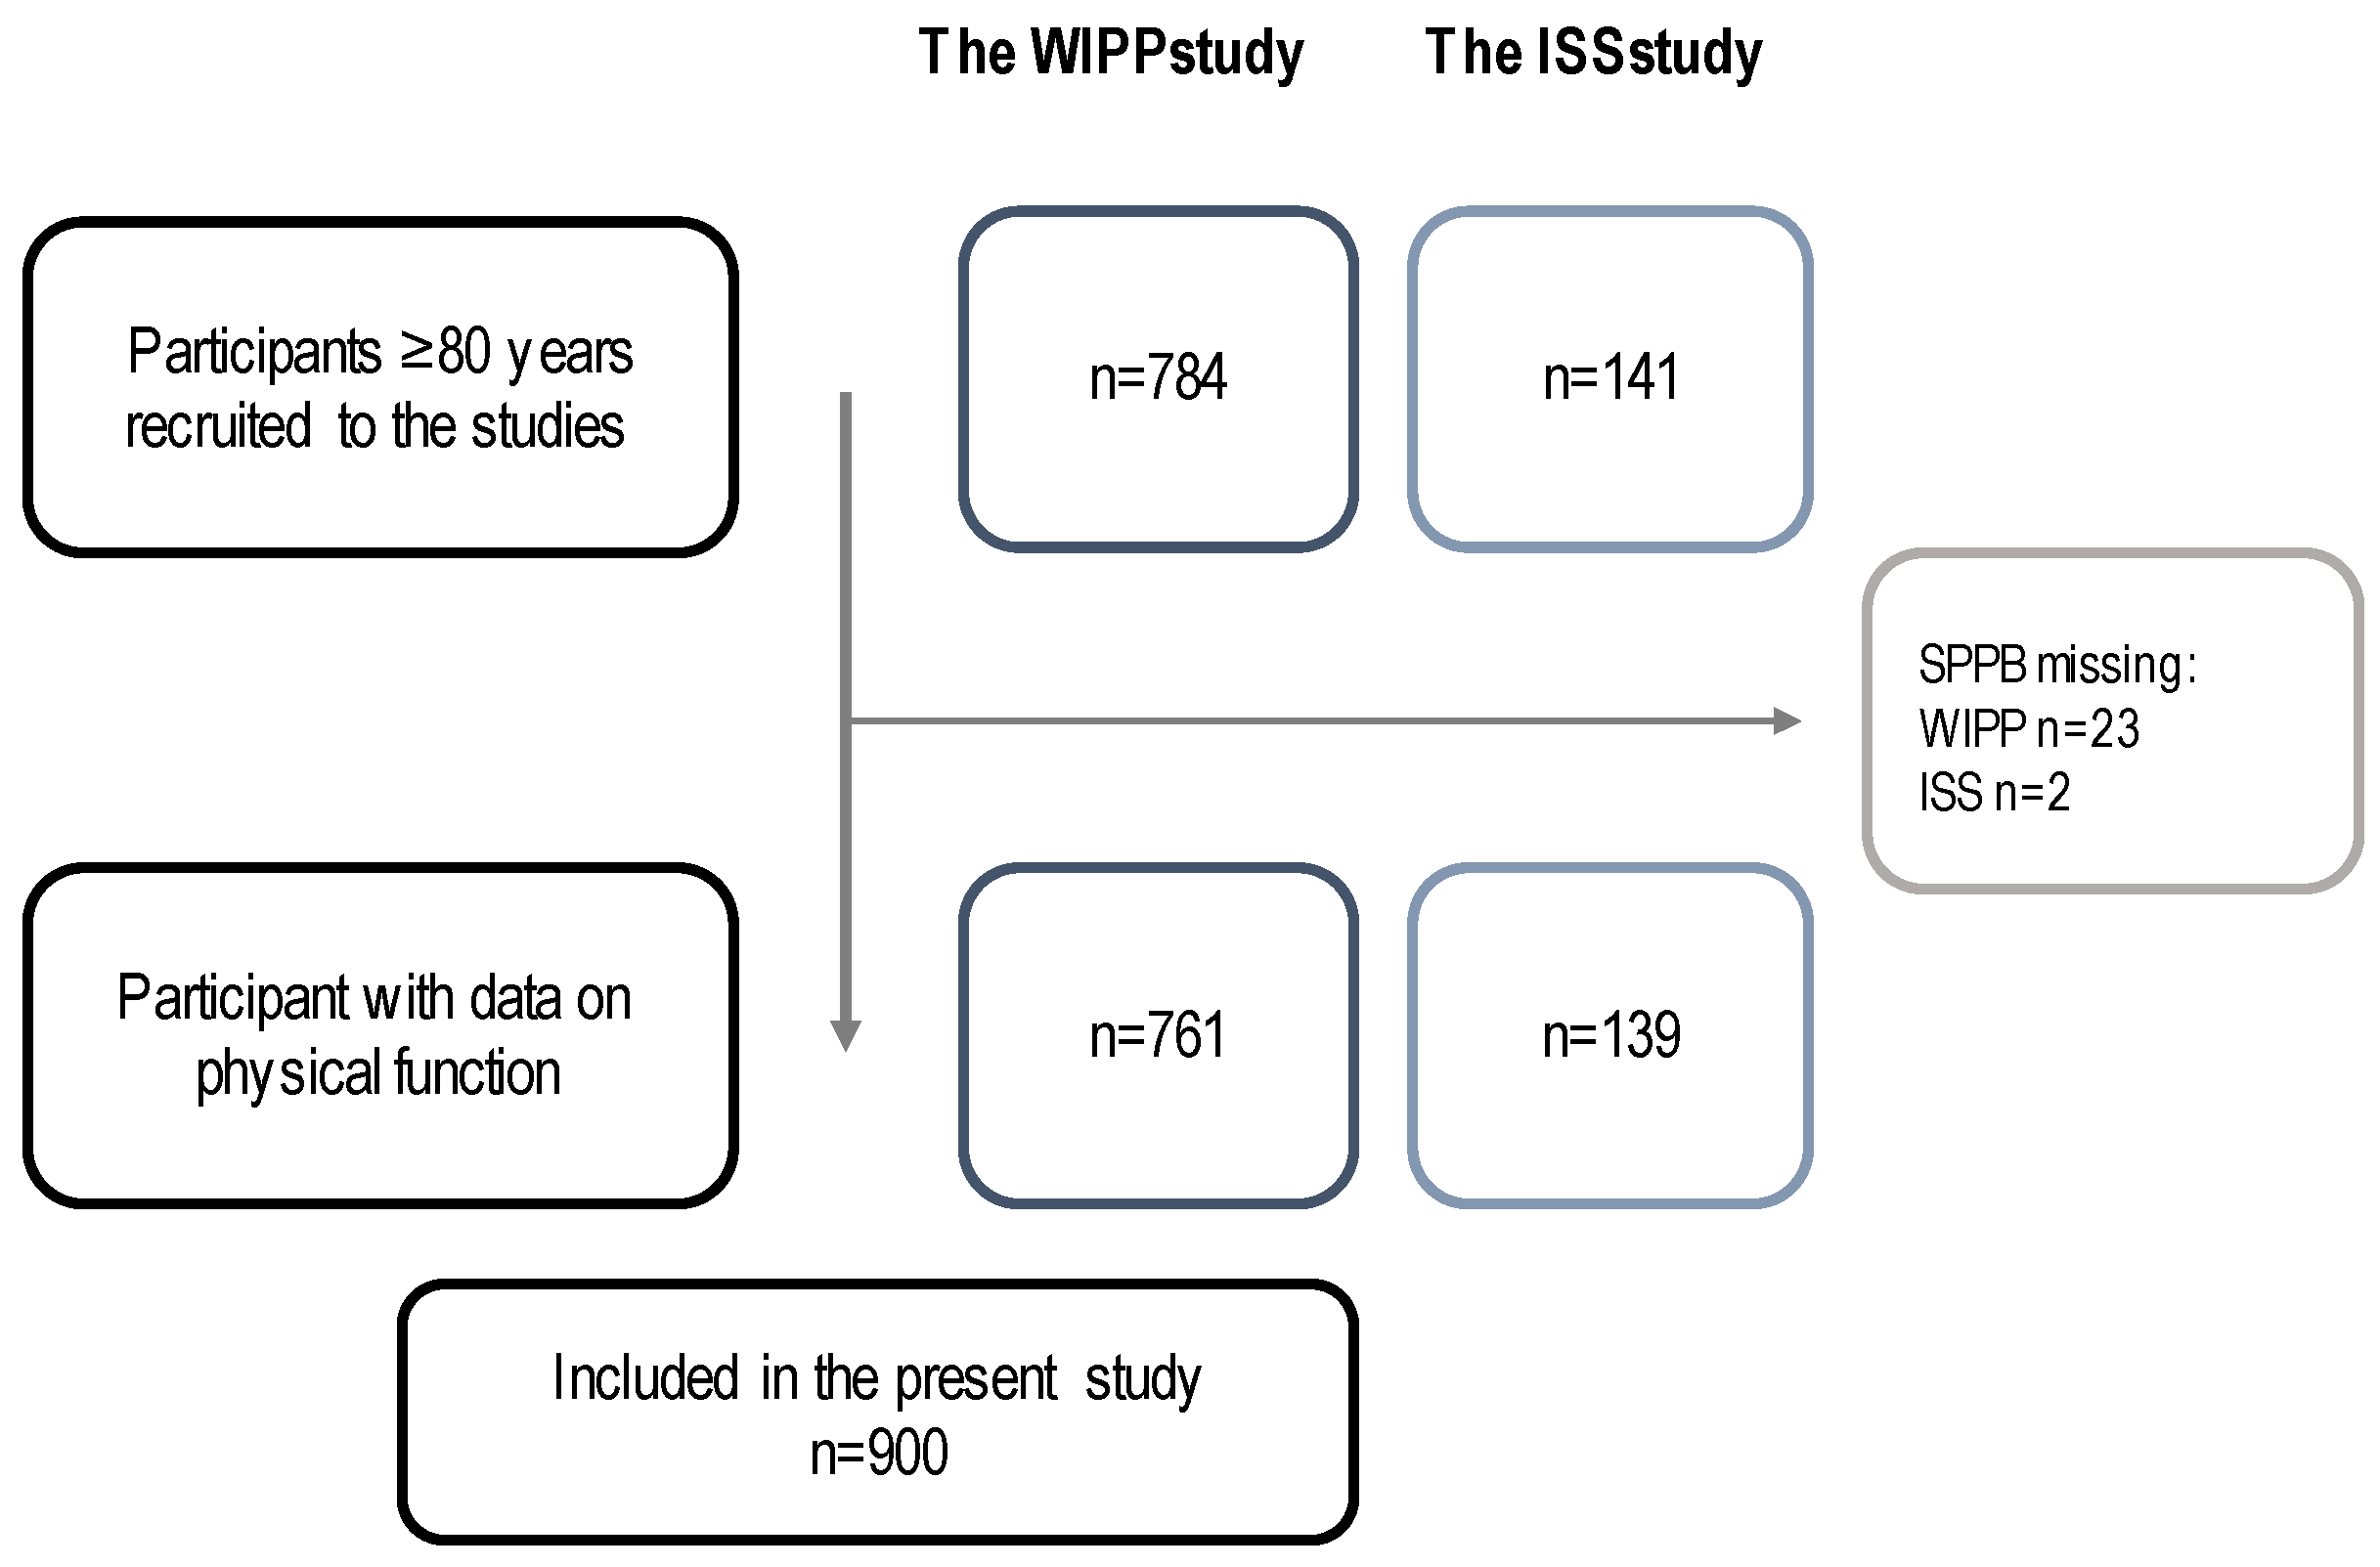
2.2. Study Population

Inclusion criteria for participants in the present study were: (i) ≥80 years community-dwelling adults, with (ii) available data on the Short Physical Performance Battery (SPPB).

2.3. Data Collection

In the WIPP study, the collection of data was carried out through interviews led by health care personnel employed in the municipality. In the ISS study trained research assistants from the University of Southern Denmark collected data in the homes of the participants. In addition, participants were instructed to fill-out questionnaires. (Supplementary Table S1 for details).

2.3.1. Reduced Physical Function

The SPPB is an objective measure of physical function based on three tests: balance (side-by-side, semi-tandem and tandem), gait (3 m walk at usual pace) and chair rise (5 chair stand as quickly as possible). Scores ranges from 0 (worst performance) to 12 (best performance) [27]. In the present study, a SPPB score ≤ 9 was used to classify participants with reduced physical function. SPPB has previously been thoroughly validated in community-dwelling adults as a measure of physical function and indicator of independence in activities of daily living as well as a predictor of loss of mobility, and use of in-home services [28,29,30,31]. The applied cut-off of ≤9 has previously been verified as an indicator of mobility limitations and limited ability to perform activities of daily living [29,30].

2.3.2. Poor Appetite

Appetite was assessed from the appetite domain in the SHARE-FI75+ frailty assessment tool [32] which includes two questions. Participants were asked: “What has your appetite been like?” with response categories being (i) “diminution in desire for food”, (ii) “no change in desire for food and/or eating the same as usual” or (iii) “increase in desire for food and/or eating more than usual”. Reduced appetite was operationalized by the answer: “diminution in desire for food”. In case of a non-specific answer to the first question participants were asked: “Have you been eating more or less than usual?”. Reduced appetite was identified by the response “less” to the second question.

2.3.3. Dysphagia

Dysphagia was assessed by asking: “Do you have any difficulties swallowing foods or drinks, or do you cough while eating?”. Response categories were “yes”, “no”, and “do not know”. Participants replying “yes” were categorized as having dysphagia.

2.3.4. Poor Dental State

Poor dental state was assessed by asking: “Is it difficult or painful to eat due to your dental state?”. Response categories were “yes”, “no”, and “do not know”. Participants replying “yes” were categorized as having poor dental state.

2.3.5. Descriptive Characteristics

Age and sex were obtained by interview in both studies. Body weight and height were self-reported in the WIPP study. In the ISS study, weight was measured on a transportable scale (Tanita BC 420 SMA, Frederiksberg Vægtfabrik, Søborg, Denmark). Participant wore light clothing and no shoes. To take the weight of clothes into consideration 0.5 kg were subtracted from the measured weight. Height was measured standing against a wall barefooted. BMI was calculated by dividing weight (kg) with height (m2). Participants were categorized with low, normal, or high BMI using the cut-points of <22 kg/m2, ≥22–27 kg/m2, and >27, respectively [17,33,34]. Unintentional weight loss was in both studies assessed by the question “Have you had an unintentional weight loss during the last month?” (“yes”, “no”, and “do not know”). Participants replying “yes” were categorized as having an unintentional weight loss.
Chronic conditions were in WIPP assessed by the questions: “Are you diagnosed with one or more chronic conditions (e.g., diabetes, arthritis, chronic obstructive pulmonary disease)?” If participants answered yes, then “How many?”. In ISS participants were asked to report if they have been diagnosed with chronic conditions from a list of seventeen medical conditions. Recent acute illness was assessed by the question: “Have you been ill within the last month (e.g., pneumonia, fever, diarrhea, vomiting)?”. For the ISS study assessment of acute illness or exacerbation of chronic conditions were performed as part of the nutritional screening, using the Eating Validation Scheme [35]. Answers were dichotomized into recent acute illness (yes or no).
Polypharmacy was addressed by the question: “Do you have a daily intake of 5 or more medications, or do you use sleeping pills?” in the WIPP study. In the ISS study polypharmacy was obtained from the Mini Nutritional Assessment tool by the question: “takes more than 3 prescription drugs per day” [36]. Questions were dichotomized into polypharmacy (yes or no).
Health-related quality of life was assessed by the EQ-5D-3L [37] in both studies. The EQ-5D-3L is composed of (i) a descriptive part that can be converted into a health state index score, and (ii) a visual analogue scale [37,38]. In the present study, the visual analogue scale was used. It ranges from 100 (best imaginable health state) to 0 (worst imaginable health state) and participants were asked to mark their health today between the two endpoints.
Falls were assessed by the question “Have you experienced a fall within the last year?” Response categories were “no”, “once”, and “more than once” for the WIPP study, and “yes” and “no” for the ISS study (dichotomized into falls yes or no).

2.3.6. Statistical Methods

Descriptive statistics was performed to summarize participants characteristics. The distribution of data was checked, and continuous variables were presented as mean ± standard deviations (SD) or median, interquartile range (IQR), as appropriate. Categorical variables were presented as number of respondents (n), percentage of total. Differences between participants with normal and reduced physical function were tested by Student’s t-test, Mann–Whitney U-test and Chi-squared test, as appropriate. Multivariable logistic regression analyses were conducted to test if the risk factors for inadequate nutritional intake (poor appetite, poor dental state, and dysphagia) were associated with physical function (model I). Analyses were adjusted for age and sex (Model II) and additionally adjusted for recent illness and BMI-categories (Model III). Model assumptions were validated, by investigating linearity of the continuous variables, variance inflation factor analysis, the link test, and the Hosmer and Lemeshow goodness of fit test (groups of 5, 10 and 15). If continuous variables failed to meet the assumption of linearity of the log odds the variables were categorized. Accordingly, BMI was categorized as low, normal, and high using the cut-points <22 kg/m2, ≥22–27 kg/m2, and >27, respectively, as previously applied in older adults [17,33,34]. Analyses were repeated in weight stable only (without participants who reported an unintentional weight loss). Lastly, a sensitivity analysis was performed where participants who answered “do not know” to the question about unintentional weight loss were also removed. Results were presented as Odds Ratio (OR) and 95% Confidence Interval (95%CI). Missing data were not imputed. Number of participants included in each variable and analysis was added to the tables. The present study was an secondary explorative analysis of cross-sectional data from the WIPP and the ISS studies. Sample size calculations were performed on the studies primary aims. Statistical significance level was p < 0.05. Statistical analysis was performed in the Stata Statistical Software (Release 17, StataCorp 2021).

3. Results

A total of 900 participants fulfilled the inclusion criteria for the present study (Figure 1). Mean age was 85.1 ± 3.7 years, 60.9% were female, 6.2% reported an unintentional weight loss, 54% had ≥one chronic condition, and 45.7% of the population had reduced physical function. For more characteristics of the study population, see Table 1.
Participants with reduced physical function were older and had a higher BMI compared to participants with normal physical function. Furthermore, more participants with reduced physical function reported polypharmacy and falls during the last year and they reported lower health-related quality of life (Table 1). There were no significant differences in the prevalence of unintentional weight loss between participants with normal and reduced physical function (Table 1).

3.1. Prevalence of Malnutrition Risk Factors

Prevalence rates for poor appetite, dysphagia, and poor dental state are presented in Table 2 for the entire group and separately for participants with normal and reduced physical function. Participants with reduced physical function had a higher prevalence of poor appetite compared to participants with normal physical function.
Results on the accumulation of malnutrition risk factors showed that the prevalence varies between participants with normal and reduced physical function, respectively (Table 2).

3.2. Associations between Low Physical Function and Malnutrition Risk Factors

Participants who reported poor appetite had increased odds of reduced physical function in all models of the logistic regression analyses (model III, OR 1.97). However, no associations between dysphagia or dental state and reduced physical function were identified (Table 3). Fifty-six participants reported an unintentional weight loss during the last month. Within this sub-group 46.4% reported poor appetite (n = 26), 18.0% reported dysphagia (n = 9) and 8.0% reported poor dental state (n = 4). Further, 46.4% reported one of these risk factors (n = 26) and 10.7% reported that they had ≥2 risk factors (n = 6). The logistic regression analyses were repeated in weight stable patients only (n = 792). Results from these analyses are presented in Table 4. Conclusions from the analyses in the full sample were reproduced.

3.3. Sensitivity Analysis

Eleven participants were unaware if they had an unintentional weight loss during the last month. Analyses in weight stable participants (Table 4) were repeated without these participants (included participants n = 733). The OR were not markedly affected and conclusions from the initial analyses were reproduced (data not shown).

4. Discussion

The primary findings of this study were that poor appetite reported by 10.8% of the participants was independently associated with odds of reduced physical function (OR 1.93, p = 0.008) (Table 2 and Table 3). In comparison, self-reported unintentional weight loss had a lower prevalence (6.2%) and was evenly distributed in the normal and reduced physical function groups (Table 1). Additionally, self-reported unintentional weight loss did not alter the association between poor appetite and reduced physical function (Table 4). Finally, dysphagia and poor dental state were less frequently reported (6.3% and 3.2%, respectively) and were not associated with odds of reduced physical function (Table 3). Participants with reduced physical function were older, had a higher BMI, higher prevalence of polypharmacy, experienced more falls during the last year and reported poorer health-related quality of life (Table 1).
Unintentional weight loss is included as a phenotypic criteria of malnutrition by the international nutritional societies included in the Global Leadership Initiative on Malnutrition, GLIM [17] and self-reported unintentional weight loss is recommended as one of the early indicators of malnutrition in community-dwelling older adults [18]. Unintentional weight loss (>5% of body weight) has previously been associated with a two-fold increased risk of mobility limitations in community-dwelling women (mean age 80 years) [39]. Regardless, in the present study we did not find any significant differences in the prevalence of unintentional weight loss between participants with normal and reduced physical function (5.5% and 7.1%, respectively, p = 0.328). The results may potentially be affected by the methodology of this study as self-report of unintentional weight loss may underestimate actual weight changes. However, previous studies have documented that self-reported weight is a reliable measure in patients living with diabetes and in older adults [40,41] and conclusions from the present study were not changed in the sensitivity analysis where participants unaware of any unintentional weight loss during the last month were excluded. Further, in the framework of primary prevention reliance on self-reported variables is a premise. Importantly, pronounced unintentional weight losses often represents severity of disease or is a symptom of undiagnosed illness [42] and in this population of very old adults, would most likely result in demands for health care services. This would make such participants ineligible for the preventive home visit and thereby exclude them from taking part of this study. Regardless, in our population the unintentional weight loss was not a sensitive indicator of reduced physical function.
Age-related decline in appetite (often referred to as anorexia of ageing) is a well-known condition. However, it is often overlooked by clinicians or accepted as an inevitable part of the ageing process [43]. Results from the present study showed that 10.8% of very old community-dwelling adults experienced poor appetite and that poor appetite was independently associated with increased odds of low physical function (Table 2 and Table 3). Poor appetite has previously been associated with risk of malnutrition [15,44], lower muscle mass and reduced muscle strength [45], sarcopenia [46,47] and physical frailty [46] which support the identified association with physical function.
The association between poor appetite and reduced physical function was maintained when participants with unintentional weight loss were removed from the analyses (Table 4). Different scenarios may explain this finding; (i) poor appetite precede unintentional weight loss, (ii) the reduction in energy intake resulting from declines in appetite is compensated by a reduction in physical activity whereby weight is stable, or (iii) poor appetite results in inadequate intake of nutrient, independent from energy balance. Poor appetite has been associated with reduced energy intake in older adults which over time may result in unintentional weight loss [48]. However, ageing is also associated with declining levels of physical activity [48] and high levels of sedentary behavior [49] which decrease energy requirements and thereby may translate in energy balance and explain why body weight is maintained despite appetite is reduced. Lastly, poor appetite may reduce the quality of the diet resulting in an inadequate intake of nutrients, e.g., due to age-related changes in the perception and enjoyment of protein-rich foods [20,50,51] which over time may accelerate loss of muscle mass despite weight stability. This is supported by findings from a previous study in community-dwelling adults aged 70–79 years where participants with poor appetite had a lower consumption of protein and dietary fibers compared to older adults with normal appetite (adjusted for energy intake) [52]. Further, in community-dwelling adults ≥80 years poor appetite was associated with inadequate intake of protein, even though most participants did not report unintentional weight loss [19]. Our results indicate that assessment of appetite is potentially an opportunity for early detection of older adults at risk of loss of physical function. Nevertheless, the cross-sectional design of the present study does not allow us to investigate the order of events.
Dysphagia describes difficulties moving food from the mouth to the stomach [53] and is associated with multiple negative health outcomes, such as malnutrition, dehydration, pneumonia, frailty, functional impairments, reduced quality of life, and mortality [21,22,53]. Nevertheless, no association between dysphagia and reduced physical function was found in the present study (Table 3 and Table 4). This is most likely explained by the low prevalence of dysphagia in the present study (6.3% in the entire group, Table 1). In contrast, prevalence rates of 30–40% have been reported in self-reliant community-dwelling adults [22] and rates of 50% in older adults at the time of an acute hospital admission [21]. Previous studies have demonstrated that prevalence rates of dysphagia vary considerably by assessment method (5–72%) [54] e.g., among very old community-dwelling women an objective test of swallowing ability identified 72% of very old community-dwelling women with dysphagia compared to 15% identified by the self-report [55].
Previous studies highlight that with increasing age the importance of daily oral care increase while the ability to manage oral hygiene often decrease [56] and that poor dental state is associated with unintentional weight loss [57,58] and malnutrition [59]. Further, dental state was previously associated with functional measures (e.g., leg power, stepping-rate and balance) in Japanese community-dwelling adults [60]. Nevertheless, reduced physical function was not associated with self-reported poor dental state in the present study (Table 3 and Table 4). These findings may partially be explained by the sensitivity of the screening question. In the applied question chewing ability and oral pain was addressed. Recent studies have highlighted that mouth dryness is a frequent symptom of reduced oral health in older adults in primary setting [19] and at time of hospital admission [61] and has been associated with low protein intake and malnutrition [19,61]. The variables assessed in the present study have different time perspectives, which may add to the explanation of results (Supplementary Table S1). Deterioration of physical function may have happened over weeks, months or years and is objectively tested, whereas poor dental state and dysphagia reflect a current self-reported status and may only affect physical function over time. More methodological research is needed on the assessment of dental state in primary care setting.

4.1. Strengths

Screening was performed during the nationally regulated primary preventive home visits and performed by heath care personnel (WIPP study). This highlights the ecological validity of the study as this strategy improved representativeness of the sample, generalizability of results and allowed testing of the feasibility of the questionnaires in primary prevention. Additionally, the study has a large sample of community-dwelling adults ≥80 years who are generally underrepresented in the literature. Furthermore, it is a strength that physical function was objectively assessed by the SPPB. This assessment battery has previously been demonstrated to be a predictor of loss of mobility [30], functional disability [29,62], institutionalization [27,62] and use of health care services [31] in older community-dwelling adults and hence, is a very relevant reference in primary prevention.

4.2. Limitations

The cross-sectional design of the study did not allow us to investigate causal relations or directions of actions. In ageing, loss of physical function and reduction in appetite are complex multifactorial conditions, and we were not able to conclude if the most likely scenario is that consequences of poor appetite over time deteriorate physical function, or if limitations following reduced physical function negatively impact appetite. Longitudinal studies are required to understand the consequences of malnutrition risk factors on physical function over time in this population. In addition, using simple self-reported questions and test without specialized equipment may be a limitation in terms of establishing prevalence of risk factors, such as previously discussed on unintentional weight loss, dysphagia, and poor dental state. However, physical examination and specialized equipment are not feasible in large-scale screening such as the nationally regulated primary preventive home visits. More methodological research is needed to establish the agreement between self-reported and measured malnutrition risk factors, and to develop and validate simple, time-effective, and feasible screening questions for dysphagia and poor dental state in the oldest old population.

5. Conclusions

In conclusion, poor appetite was associated with reduced physical function in community-dwelling adults ≥80 years whereas self-reported unintentional weight loss was not. Appetite was assessed with a simple and easy to administer questionnaire which was embedded in a nationally regulated service (preventive home visit). This indicates that introducing the assessment of appetite during preventive strategies is not only feasible but may offer an opportunity for early detection of older adults at risk of malnutrition and functional limitations. Regardless, the causal relationship between poor appetite and physical function should be further investigated.

Supplementary Materials

The following supporting information can be downloaded at: https://www.mdpi.com/article/10.3390/jal3010003/s1, Table S1: Collection of self-reported data.

Author Contributions

Conceptualization, S.F.B., P.C., P.Ø.O. and T.T.; Methodology, P.C. and S.F.B.; Software, S.F.B.; Validation, S.F.B., P.Ø.O., T.T. and P.C.; Formal Analysis, S.F.B.; Investigation, S.F.B., P.Ø.O. and P.C.; Resources, P.C.; Data Curation, S.F.B., P.Ø.O. and P.C.; Writing—Original Draft Preparation, S.F.B., P.C., T.T. and P.Ø.O.; Writing—Review and Editing, S.F.B., T.T., P.Ø.O. and P.C.; Visualization, S.F.B.; Supervision, P.C. and T.T.; Project Administration, S.F.B. and P.C.; Funding Acquisition, P.C. All authors have read and agreed to the published version of the manuscript.

Funding

WIPP was funded by Interreg 5A Deutschland-Danmark with grants from the European Fund for Regional Development (grant no. 38-1.0-16). The ISS study was funded by the Danish Dairy Research Foundation with co-funding from the involved partners: the University of Southern Denmark, University College Copenhagen, and Arla Foods amba. The funding body did not have any role in the design, methods, subject recruitment, data collections, analysis, and preparation of the article.

Institutional Review Board Statement

The ISS study was conducted in accordance with the Declaration of Helsinki and followed the legislation from the Regional Ethical Committee (Project-ID: S-20170105). For the WIPP study the Regional Ethical Committee in Southern Denmark evaluated the requirement for an ethical review and approval. The committee waived this due to the applied research methodology of the study, where data collection was performed by the municipalities during the national regulated preventive home visits.

Informed Consent Statement

Informed consent was obtained from all subjects involved in the ISS study. For the WIPP study, data were collected by health care personnel as part of the nationally regulated preventive home visits. Participants were verbally informed about the study by the personnel who visited them during the routinely preventive home visit. Data were collected only after verbal consent by each individual participant was provided.

Data Availability Statement

The data underlying this article will be shared on reasonable request to the corresponding author with permission of the WIPP Consortium and partners of the ISS study.

Acknowledgments

Firstly: we would like to thank participants from the ISS and WIPP studies for their engagement in research. We would like to acknowledge all involved staff from the Municipalities of Odense, Slagelse and Esbjerg for their participation and contribution to the WIPP project and the Municipality of Odense for their contribution to the ISS study. We would like to acknowledge Jonathan Vaarst for his contribution to the data management on the WIPP project and Anne Marie Beck and Britt Christensen for their contribution to the ISS study.

Conflicts of Interest

The authors declare no conflict of interest. The funders had no role in the design of the study; in the collection, analyses, or interpretation of data; in the writing of the manuscript; or in the decision to publish the results.

References

  1. Eurostat. Population Structure and Ageing. Statistics Explained. 2022. Available online: https://ec.europa.eu/eurostat/statistics-explained/index.php?title=Population_structure_and_ageing#The_share_of_elderly_people_continues_to_increase (accessed on 7 October 2022).
  2. Portela, D.; Almada, M.; Midão, L.; Costa, E. Instrumental Activities of Daily Living (iADL) Limitations in Europe: An Assessment of SHARE Data. Int. J. Environ. Res. Public Health 2020, 17, 7387. [Google Scholar] [CrossRef] [PubMed]
  3. Wahrendorf, M.; Reinhardt, J.; Siegrist, J. Relationships of disability with age among adults aged 50 to 85: Evidence from the United States, England and continental europe. PLoS ONE 2013, 8, e71893. [Google Scholar] [CrossRef] [PubMed] [Green Version]
  4. Eurostat. Disability Statistics-Elderly Needs for Help or Assistance. Statistics Explained. 2022. Available online: https://ec.europa.eu/eurostat/statistics-explained/index.php?oldid=456538#Need_for_help_with_personal_care_or_household_activities (accessed on 28 November 2022).
  5. Commission, E. Economic and budgetary projections for the 28 EU Member States (2013–2060). In European Economy; The 2015 Ageing Report; European Commission: Brussels, Belgium, 2015. [Google Scholar]
  6. Cederholm, T.; Barazzoni, R.; Austin, P.; Ballmer, P.; Biolo, G.; Bischoff, S.C.; Compher, C.; Correia, I.; Higashiguchi, T.; Holst, M.; et al. ESPEN guidelines on definitions and terminology of clinical nutrition. Clin. Nutr. 2017, 36, 49–64. [Google Scholar] [CrossRef] [PubMed]
  7. Deutz, N.E.; Bauer, J.M.; Barazzoni, R.; Biolo, G.; Boirie, Y.; Bosy-Westphal, A.; Cederholm, T.; Cruz-Jentoft, A.; Krznariç, Z.; Nair, K.S.; et al. Protein intake and exercise for optimal muscle function with aging: Recommendations from the ESPEN Expert Group. Clin. Nutr. 2014, 33, 929–936. [Google Scholar] [CrossRef] [Green Version]
  8. Laur, C.V.; McNicholl, T.; Valaitis, R.; Keller, H.H. Malnutrition or frailty? Overlap and evidence gaps in the diagnosis and treatment of frailty and malnutrition. Appl. Physiol. Nutr. Metab. 2017, 42, 449–458. [Google Scholar] [CrossRef] [Green Version]
  9. Agarwal, E.; Miller, M.; Yaxley, A.; Isenring, E. Malnutrition in the elderly: A narrative review. Maturitas 2013, 76, 296–302. [Google Scholar] [CrossRef] [Green Version]
  10. Morley, J.E.; Vellas, B.; van Kan, G.A.; Anker, S.D.; Bauer, J.M.; Bernabei, R.; Cesari, M.; Chumlea, W.C.; Doehner, W.; Evans, J.; et al. Frailty consensus: A call to action. J. Am. Med. Dir. Assoc. 2013, 14, 392–397. [Google Scholar] [CrossRef] [Green Version]
  11. Fried, L.P.; Tangen, C.M.; Walston, J.; Newman, A.B.; Hirsch, C.; Gottdiener, J.; Seeman, T.; Tracy, R.; Kop, W.J.; Burke, G.; et al. Frailty in older adults: Evidence for a phenotype. J. Gerontol. A Biol. Sci. Med. Sci. 2001, 56, M146–M156. [Google Scholar] [CrossRef]
  12. Sieber, C.C. Malnutrition and sarcopenia. Aging Clin. Exp. Res. 2019, 31, 793–798. [Google Scholar] [CrossRef]
  13. Donini, L.M.; Busetto, L.; Bischoff, S.C.; Cederholm, T.; Ballesteros-Pomar, M.D.; Batsis, J.A.; Bauer, J.M.; Boirie, Y.; Cruz-Jentoft, A.J.; Dicker, D.; et al. Definition and Diagnostic Criteria for Sarcopenic Obesity: ESPEN and EASO Consensus Statement. Obes. Facts 2022, 15, 321–335. [Google Scholar] [CrossRef]
  14. Leij-Halfwerk, S.; Verwijs, M.H.; van Houdt, S.; Borkent, J.W.; Guaitoli, P.R.; Pelgrim, T.; Heymans, M.W.; Power, L.; Visser, M.; Corish, C.A.; et al. Prevalence of protein-energy malnutrition risk in European older adults in community, residential and hospital settings, according to 22 malnutrition screening tools validated for use in adults ≥65 years: A systematic review and meta-analysis. Maturitas 2019, 126, 80–89. [Google Scholar] [CrossRef] [PubMed]
  15. O’Keeffe, M.; Kelly, M.; O’Herlihy, E.; O’Toole, P.W.; Kearney, P.M.; Timmons, S.; O’Shea, E.; Stanton, C.; Hickson, M.; Rolland, Y.; et al. Potentially modifiable determinants of malnutrition in older adults: A systematic review. Clin. Nutr. 2019, 38, 2477–2498. [Google Scholar] [CrossRef] [PubMed] [Green Version]
  16. Volkert, D.; Kiesswetter, E.; Cederholm, T.; Donini, L.M.; Eglseer, D.; Norman, K.; Schneider, S.M.; Ströbele-Benschop, N.; Torbahn, G.; Wirth, R.; et al. Development of a Model on Determinants of Malnutrition in Aged Persons: A MaNuEL Project. Gerontol. Geriatr. Med. 2019, 5, 2333721419858438. [Google Scholar] [CrossRef] [PubMed]
  17. Cederholm, T.; Jensen, G.L.; Correia, M.; Gonzalez, M.C.; Fukushima, R.; Higashiguchi, T.; Baptista, G.; Barazzoni, R.; Blaauw, R.; Coats, A.; et al. GLIM criteria for the diagnosis of malnutrition—A consensus report from the global clinical nutrition community. Clin. Nutr. 2019, 38, 1–9. [Google Scholar] [CrossRef] [Green Version]
  18. Authority, D.H. Underernæring: Opsporing, Behandling og Opfølgning af Borgere og Patienter i Ernæringsrisiko. Vejledning Til Kommune, Sygehus og Almen Praksis; Danish Health Authority: Copenhagen, Denmark, 2022; pp. 1–152.
  19. Buhl, S.F.; Beck, A.M.; Christensen, B.; Kock, G.; Boyle, E.; Caserotti, P. Prevalence of low protein intake in 80+-year-old community-dwelling adults and association with dietary patterns and modifiable risk factors: A cross-sectional study. Br. J. Nutr. 2022, 127, 266–277. [Google Scholar] [CrossRef]
  20. Landi, F.; Calvani, R.; Tosato, M.; Martone, A.M.; Ortolani, E.; Savera, G.; Sisto, A.; Marzetti, E. Anorexia of Aging: Risk Factors, Consequences, and Potential Treatments. Nutrients 2016, 8, 69. [Google Scholar] [CrossRef]
  21. Melgaard, D.; Rodrigo-Domingo, M.; Mørch, M.M. The Prevalence of Oropharyngeal Dysphagia in Acute Geriatric Patients. Geriatrics 2018, 3, 15. [Google Scholar] [CrossRef] [Green Version]
  22. Baijens, L.W.; Clavé, P.; Cras, P.; Ekberg, O.; Forster, A.; Kolb, G.F.; Leners, J.C.; Masiero, S.; Mateos-Nozal, J.; Ortega, O.; et al. European Society for Swallowing Disorders-European Union Geriatric Medicine Society white paper: Oropharyngeal dysphagia as a geriatric syndrome. Clin. Interv. Aging 2016, 11, 1403–1428. [Google Scholar] [CrossRef] [Green Version]
  23. Woo, J.; Tong, C.; Yu, R. Chewing Difficulty Should be Included as a Geriatric Syndrome. Nutrients 2018, 10, 1997. [Google Scholar] [CrossRef] [Green Version]
  24. Iwasaki, M.; Yoshihara, A.; Sato, M.; Minagawa, K.; Shimada, M.; Nishimuta, M.; Ansai, T.; Yoshitake, Y.; Miyazaki, H. Dentition status and frailty in community-dwelling older adults: A 5-year prospective cohort study. Geriatr. Gerontol. Int. 2018, 18, 256–262. [Google Scholar] [CrossRef]
  25. Buhl, S.F.; Beck, A.M.; Olsen, P.; Kock, G.; Christensen, B.; Wegner, M.; Vaarst, J.; Caserotti, P. Relationship between physical frailty, nutritional risk factors and protein intake in community-dwelling older adults. Clin. Nutr. ESPEN 2022, 49, 449–458. [Google Scholar] [CrossRef] [PubMed]
  26. Vandenbroucke, J.P.; von Elm, E.; Altman, D.G.; Gøtzsche, P.C.; Mulrow, C.D.; Pocock, S.J.; Poole, C.; Schlesselman, J.J.; Egger, M. Strengthening the Reporting of Observational Studies in Epidemiology (STROBE): Explanation and elaboration. PLoS Med. 2007, 4, e297. [Google Scholar] [CrossRef] [PubMed] [Green Version]
  27. Guralnik, J.M.; Simonsick, E.M.; Ferrucci, L.; Glynn, R.J.; Berkman, L.F.; Blazer, D.G.; Scherr, P.A.; Wallace, R.B. A short physical performance battery assessing lower extremity function: Association with self-reported disability and prediction of mortality and nursing home admission. J. Gerontol. 1994, 49, M85–M94. [Google Scholar] [CrossRef] [PubMed]
  28. Freiberger, E.; de Vreede, P.; Schoene, D.; Rydwik, E.; Mueller, V.; Frändin, K.; Hopman-Rock, M. Performance-based physical function in older community-dwelling persons: A systematic review of instruments. Age Ageing 2012, 41, 712–721. [Google Scholar] [CrossRef] [Green Version]
  29. Guralnik, J.M.; Ferrucci, L.; Pieper, C.F.; Leveille, S.G.; Markides, K.S.; Ostir, G.V.; Studenski, S.; Berkman, L.F.; Wallace, R.B. Lower extremity function and subsequent disability: Consistency across studies, predictive models, and value of gait speed alone compared with the short physical performance battery. J. Gerontol. A Biol. Sci. Med. Sci. 2000, 55, M221–M231. [Google Scholar] [CrossRef] [Green Version]
  30. Vasunilashorn, S.; Coppin, A.K.; Patel, K.V.; Lauretani, F.; Ferrucci, L.; Bandinelli, S.; Guralnik, J.M. Use of the Short Physical Performance Battery Score to predict loss of ability to walk 400 meters: Analysis from the InCHIANTI study. J. Gerontol. A Biol. Sci. Med. Sci. 2009, 64, 223–229. [Google Scholar] [CrossRef]
  31. Vaarst, J.; Boyle, E.; Vestergaard, S.; Hvid, L.G.; Strotmeyer, E.S.; Glynn, N.W.; Caserotti, P. Does physical performance and muscle strength predict future personal and nursing care services in community-dwelling older adults aged 75+? Scand. J. Public Health 2021, 49, 441–448. [Google Scholar] [CrossRef]
  32. Romero-Ortuno, R.; Soraghan, C. A Frailty Instrument for primary care for those aged 75 years or more: Findings from the Survey of Health, Ageing and Retirement in Europe, a longitudinal population-based cohort study (SHARE-FI75+). BMJ Open 2014, 4, e006645. [Google Scholar] [CrossRef] [Green Version]
  33. Wijnhoven, H.A.H.; Elstgeest, L.E.M.; de Vet, H.C.W.; Nicolaou, M.; Snijder, M.B.; Visser, M. Development and validation of a short food questionnaire to screen for low protein intake in community-dwelling older adults: The Protein Screener 55+ (Pro55+). PLoS ONE 2018, 13, e0196406. [Google Scholar] [CrossRef] [Green Version]
  34. Berner, L.A.; Becker, G.; Wise, M.; Doi, J. Characterization of dietary protein among older adults in the United States: Amount, animal sources, and meal patterns. J. Acad. Nutr. Diet. 2013, 113, 809–815. [Google Scholar] [CrossRef]
  35. Beck, A.M.; Beermann, T.; Kjær, S.; Rasmussen, H.H. Ability of different screening tools to predict positive effect on nutritional intervention among the elderly in primary health care. Nutrition 2013, 29, 993–999. [Google Scholar] [CrossRef] [PubMed]
  36. Vellas, B.; Guigoz, Y.; Garry, P.J.; Nourhashemi, F.; Bennahum, D.; Lauque, S.; Albarede, J.L. The Mini Nutritional Assessment (MNA) and its use in grading the nutritional state of elderly patients. Nutrition 1999, 15, 116–122. [Google Scholar] [CrossRef] [PubMed]
  37. EuroQol--a new facility for the measurement of health-related quality of life. Health Policy 1990, 16, 199–208. [CrossRef]
  38. Rabin, R.; Gudex, C.; Selai, C.; Herdman, M. From translation to version management: A history and review of methods for the cultural adaptation of the EuroQol five-dimensional questionnaire. Value Health 2014, 17, 70–76. [Google Scholar] [CrossRef] [Green Version]
  39. Launer, L.J.; Harris, T.; Rumpel, C.; Madans, J. Body mass index, weight change, and risk of mobility disability in middle-aged and older women. The epidemiologic follow-up study of NHANES I. JAMA 1994, 271, 1093–1098. [Google Scholar] [CrossRef]
  40. Imeraj, A.; Olesen, T.B.; Laursen, D.H.; Søndergaard, J.; Brandt, C.J. Agreement Between Clinically Measured Weight and Self-reported Weight Among Patients With Type 2 Diabetes Through an mHealth Lifestyle Coaching Program in Denmark: Secondary Analysis of a Randomized Controlled Trial. JMIR Form. Res. 2022, 6, e40739. [Google Scholar] [CrossRef] [PubMed]
  41. Dahl, A.K.; Hassing, L.B.; Fransson, E.I.; Pedersen, N.L. Agreement between self-reported and measured height, weight and body mass index in old age--a longitudinal study with 20 years of follow-up. Age Ageing 2010, 39, 445–451. [Google Scholar] [CrossRef] [PubMed] [Green Version]
  42. Alibhai, S.M.; Greenwood, C.; Payette, H. An approach to the management of unintentional weight loss in elderly people. CMAJ 2005, 172, 773–780. [Google Scholar] [CrossRef] [PubMed] [Green Version]
  43. Jadczak, A.D.; Visvanathan, R. Anorexia of Aging—An Updated Short Review. J. Nutr. Health Aging 2019, 23, 306–309. [Google Scholar] [CrossRef]
  44. van der Pols-Vijlbrief, R.; Wijnhoven, H.A.; Schaap, L.A.; Terwee, C.B.; Visser, M. Determinants of protein-energy malnutrition in community-dwelling older adults: A systematic review of observational studies. Ageing Res. Rev. 2014, 18, 112–131. [Google Scholar] [CrossRef]
  45. İlhan, B.; Bahat, G.; Erdoğan, T.; Kılıç, C.; Karan, M.A. Anorexia Is Independently Associated with Decreased Muscle Mass and Strength in Community Dwelling Older Adults. J. Nutr. Health Aging 2019, 23, 202–206. [Google Scholar] [CrossRef] [PubMed]
  46. Martone, A.M.; Onder, G.; Vetrano, D.L.; Ortolani, E.; Tosato, M.; Marzetti, E.; Landi, F. Anorexia of aging: A modifiable risk factor for frailty. Nutrients 2013, 5, 4126–4133. [Google Scholar] [CrossRef] [PubMed] [Green Version]
  47. Landi, F.; Liperoti, R.; Russo, A.; Giovannini, S.; Tosato, M.; Barillaro, C.; Capoluongo, E.; Bernabei, R.; Onder, G. Association of anorexia with sarcopenia in a community-dwelling elderly population: Results from the ilSIRENTE study. Eur. J. Nutr. 2013, 52, 1261–1268. [Google Scholar] [CrossRef] [PubMed]
  48. Clegg, M.E.; Godfrey, A. The relationship between physical activity, appetite and energy intake in older adults: A systematic review. Appetite 2018, 128, 145–151. [Google Scholar] [CrossRef]
  49. Giné-Garriga, M.; Sansano-Nadal, O.; Tully, M.A.; Caserotti, P.; Coll-Planas, L.; Rothenbacher, D.; Dallmeier, D.; Denkinger, M.; Wilson, J.J.; Martin-Borràs, C.; et al. Accelerometer-Measured Sedentary and Physical Activity Time and Their Correlates in European Older Adults: The SITLESS Study. J. Gerontol. A Biol. Sci. Med. Sci. 2020, 75, 1754–1762. [Google Scholar] [CrossRef] [Green Version]
  50. Honnens de Lichtenberg Broge, E.; Wendin, K.; Rasmussen, M.A.; Bredie, W.L.P. Changes in perception and liking for everyday food odors among older adults. Food Qual. Prefer. 2021, 93, 104254. [Google Scholar] [CrossRef]
  51. Fluitman, K.S.; Hesp, A.C.; Kaihatu, R.F.; Nieuwdorp, M.; Keijser, B.J.F.; RG, I.J.; Visser, M. Poor Taste and Smell Are Associated with Poor Appetite, Macronutrient Intake, and Dietary Quality but Not with Undernutrition in Older Adults. J. Nutr. 2021, 151, 605–614. [Google Scholar] [CrossRef]
  52. van der Meij, B.S.; Wijnhoven, H.A.H.; Lee, J.S.; Houston, D.K.; Hue, T.; Harris, T.B.; Kritchevsky, S.B.; Newman, A.B.; Visser, M. Poor Appetite and Dietary Intake in Community-Dwelling Older Adults. J. Am. Geriatr. Soc 2017, 65, 2190–2197. [Google Scholar] [CrossRef] [Green Version]
  53. Yang, R.Y.; Yang, A.Y.; Chen, Y.C.; Lee, S.D.; Lee, S.H.; Chen, J.W. Association between Dysphagia and Frailty in Older Adults: A Systematic Review and Meta-Analysis. Nutrients 2022, 14, 1812. [Google Scholar] [CrossRef]
  54. Madhavan, A.; LaGorio, L.A.; Crary, M.A.; Dahl, W.J.; Carnaby, G.D. Prevalence of and Risk Factors for Dysphagia in the Community Dwelling Elderly: A Systematic Review. J. Nutr. Health Aging 2016, 20, 806–815. [Google Scholar] [CrossRef]
  55. González-Fernández, M.; Humbert, I.; Winegrad, H.; Cappola, A.R.; Fried, L.P. Dysphagia in old-old women: Prevalence as determined according to self-report and the 3-ounce water swallowing test. J. Am. Geriatr. Soc. 2014, 62, 716–720. [Google Scholar] [CrossRef] [PubMed] [Green Version]
  56. Strömberg, E.; Hagman-Gustafsson, M.L.; Holmén, A.; Wårdh, I.; Gabre, P. Oral status, oral hygiene habits and caries risk factors in home-dwelling elderly dependent on moderate or substantial supportive care for daily living. Community Dent. Oral Epidemiol. 2012, 40, 221–229. [Google Scholar] [CrossRef] [PubMed]
  57. BERKHOUT, A.M.M.; COOLS, H.J.M.; VAN HOUWELINGEN, H.C. The relationship between difficulties in feeding oneself and loss of weight in nursing-home patients with dementia. Age Ageing 1998, 27, 637–641. [Google Scholar] [CrossRef] [Green Version]
  58. Sullivan, D.H.; Martin, W.; Flaxman, N.; Hagen, J.E. Oral health problems and involuntary weight loss in a population of frail elderly. J. Am. Geriatr. Soc. 1993, 41, 725–731. [Google Scholar] [CrossRef]
  59. Ástvaldsdóttir, Á.; Boström, A.M.; Davidson, T.; Gabre, P.; Gahnberg, L.; Sandborgh Englund, G.; Skott, P.; Ståhlnacke, K.; Tranaeus, S.; Wilhelmsson, H.; et al. Oral health and dental care of older persons-A systematic map of systematic reviews. Gerodontology 2018, 35, 290–304. [Google Scholar] [CrossRef]
  60. Yamaga, T.; Yoshihara, A.; Ando, Y.; Yoshitake, Y.; Kimura, Y.; Shimada, M.; Nishimuta, M.; Miyazaki, H. Relationship Between Dental Occlusion and Physical Fitness in an Elderly Population. J. Gerontol. Ser. A 2002, 57, M616–M620. [Google Scholar] [CrossRef] [PubMed] [Green Version]
  61. Andersen, A.L.; Nielsen, R.L.; Houlind, M.B.; Tavenier, J.; Rasmussen, L.J.H.; Jørgensen, L.M.; Treldal, C.; Beck, A.M.; Pedersen, M.M.; Andersen, O.; et al. Risk of Malnutrition upon Admission and after Discharge in Acutely Admitted Older Medical Patients: A Prospective Observational Study. Nutrients 2021, 13, 2757. [Google Scholar] [CrossRef]
  62. Gawel, J.; Vengrow, D.; Collins, J.; Brown, S.; Buchanan, A.; Cook, C. The short physical performance battery as a predictor for long term disability or institutionalization in the community dwelling population aged 65 years old or older. Phys. Ther. Rev. 2012, 17, 37–44. [Google Scholar] [CrossRef]
Figure 1. Participant Flow Chart. WIPP—Welfare Innovation in Primary Prevention, ISS—I’m Still Standing, SPPB—Short Physical Performance Battery.
Jal 03 00003 g001
Table 1. Characteristics of study population.
VariablesAllnNormal Physical Function *nReduced Physical Function **np-Value
Age, years85.1 ± 3.790084.4 ± 3.348985.9 ± 4.0411p < 0.001
Females, n (%)548 (60.9%)900290 (59.3%)489258 (62.8%)411p = 0.288
Physical function9.1 ± 2.790011.1 ± 0.84896.7 ± 2.3411p < 0.001
BMI, kg/m225.9 ± 4.185025.5 ± 3.847026.3 ± 4.4380p = 0.006
BMI categories, n (%) 850 470 380p = 0.002
Low151 (17.8%) 93 (19.8%) 58 (15.3%)
Normal401 (47.2%) 236 (50.2%) 165 (43.4%)
High298 (35.1%) 141 (30%) 157 (41.3%)
Unintentional weight loss, n (%)56 (6.2%)89727 (5.5%)48929 (7.1%)408p = 0.328
Chronic conditions, n (%) 875 480 395p = 0.295
None403 (46.1%) 229 (47.7%) 174 (44%)
One210 (24%) 120 (25%) 90 (22.8%)
Two123 (14.1%) 63 (13.1%) 60 (15.2%)
Three or more139 (15.9%) 68 (14.2%) 71 (18%)
Recent illness68 (7.6%)89636 (7.4%)48832 (7.8%)408p = 0.529
Polypharmacy323 (36%)897160 (32.8%)488163 (39.9%)409p = 0.028
Quality of life, VAS76 (60–90)87380 (70–90)48170 (50–80)392p < 0.001
Fall during the last year, n (%)262 (29.3%)895122 (25%)488140 (34.4%)407p = 0.002
Continuous variables are presented as mean ± SD and median (IQR), as appropriate. Categorical variables were presented as n (%). Differences between participants with normal and low physical function were tested by Student’s t-test, Mann–Whitney U-test and Chi-squared test, as appropriate. * Normal physical function: SPPB score > 9. ** Reduced physical function: SPPB score ≤ 9. BMI—Body Mass Index; SPPB—Short Physical Performance Battery; VAS—Visual Analogue Scale.
Table 2. Prevalence and combination of malnutrition risk factors.
AllnNormal Physical Function *nReduced Physical Function **np-Value
Poor appetite97 (10.8%)89936 (7.4%)48961 (14.9%)410p < 0.001
Dysphagia53 (6.3%)84328 (6.1%)45725 (6.5%)386p = 0.835
Poor dental state27 (3.2%)84613 (2.8%)45914 (3.6%)387p = 0.517
No risk factors694 (82.3%)843388 (84.9%)457306 (79.3%)386p = 0.034
Any risk factor132 (15.7%) 64 (14.0%) 68 (17.6%)
Two or more risk factors17 (2.0%) 5 (1%) 12 (3.1%)
Malnutrition risk factors include poor appetite, dysphagia, and poor dental state. * Normal physical function: SPPB score > 9. ** Reduced physical function: SPPB score ≤ 9. SPPB—Short Physical Performance Battery. Data are presented as number of participants and percentage of the total number of participants within the given group. Differences between participants with normal and low physical function were tested by Chi-squared test.
Table 3. Associations between reduced physical function and malnutrition risk factors.
Logistic Regression Analyses
Reduced Physical Function #
(Ref. Normal Physical Function ##)
Model I *Model II **Model III ***
n = 843OR (95%CI)p-Valuen = 843OR (95%CI)p-Valuen = 789OR (95%CI)p-Value
Poor appetite 2.01 (1.27–3.16)0.003 1.80 (1.13–2.86)0.014 1.93 (1.18–3.15)0.008
Dysphagia 1.01 (0.58–1.78)0.964 1.01 (0.57–1.80)0.971 0.96 (0.53–1.75)0.900
Poor dental state 1.15 (0.53–2.52)0.723 1.05 (0.47–2.37)0.898 0.99 (0.41–2.35)0.978
Logistic regression analyses with normal physical function as reference category. # Reduced physical function: SPPB score ≤ 9. ## Normal physical function: SPPB score > 9. * Model I is unadjusted. ** Model II is adjusted for age and sex. *** Model III is adjusted for age, sex, recent illness, polypharmacy, and BMI categories (low, normal, high). OR—Odds Ratio, 95% CI—95% Confidence Interval. SPPB—Short Physical Performance Battery.
Table 4. Associations between reduced physical function and malnutrition risk factors in weight stable participants only.
Logistic Regression Analyses
Reduced Physical Function #
(ref. Normal physical function ##)
Model I *Model II **Model III ***
n = 792OR (95%CI)p-Valuen = 792OR (95%CI)p-Valuen = 744OR (95%CI)p-Value
Poor appetite 2.36 (1.39–4.02)0.002 2.24 (1.30–3.86)0.004 2.21 (1.26–3.87)0.006
Dysphagia 0.76 (0.40–1.42)0.383 0.78 (0.41–1.47)0.439 0.73 (0.38–1.41)0.370
Poor dental state 0.98 (0.42–2.31)0.964 0.90 (0.37–2.16)0.809 0.84 (0.33–2.13)0.719
Logistic regression analyses with weight stable participants only and normal physical function as reference category. # Reduced physical function: SPPB score ≤ 9. ## Normal physical function: SPPB score > 9. * Model I is unadjusted. ** Model II is adjusted for age and sex. *** Model III is adjusted for age, sex, recent illness, polypharmacy, and BMI categories (low, normal, high). OR—Odds Ratio, 95%CI—95% Confidence Interval, SPPB—Short Physical Performance Battery.
Disclaimer/Publisher’s Note: The statements, opinions and data contained in all publications are solely those of the individual author(s) and contributor(s) and not of MDPI and/or the editor(s). MDPI and/or the editor(s) disclaim responsibility for any injury to people or property resulting from any ideas, methods, instructions or products referred to in the content.

