
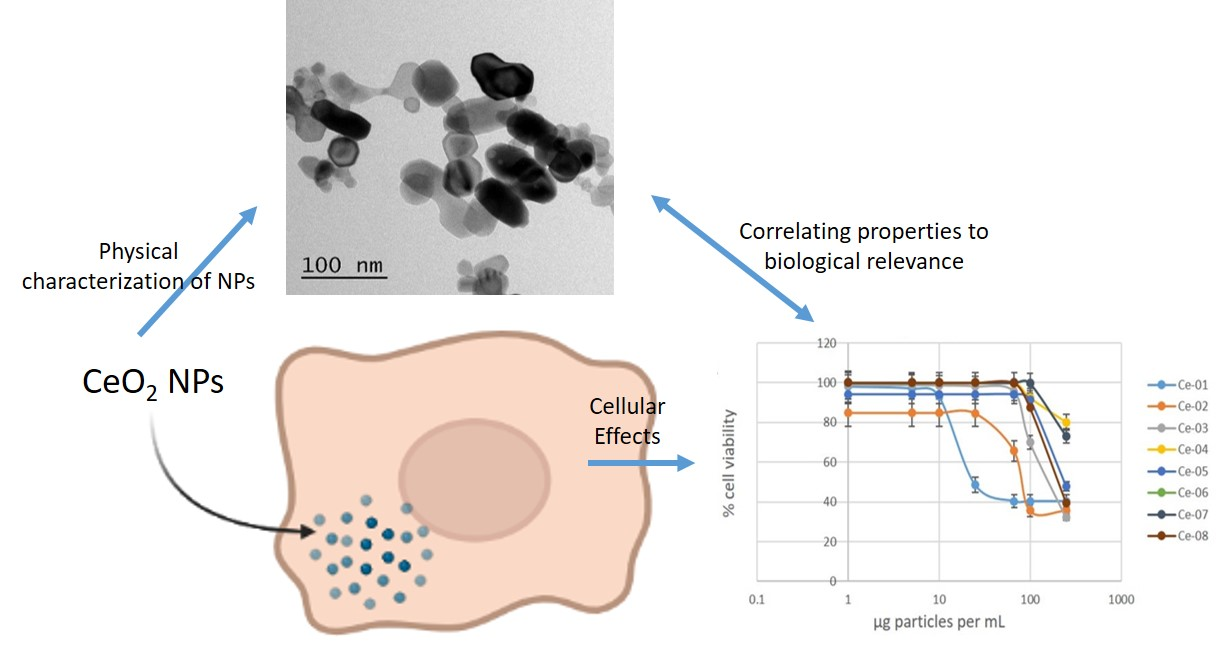
Characterization of Engineered Cerium Oxide Nanoparticles and Their Effects on Lung and Macrophage Cells

 and
and
Abstract
:
1. Introduction
2. Experimental
2.1. Materials
2.2. Cerium Oxide Nanoparticle Dispersion Optimization
2.3. Dynamic Light Scattering (DLS)
2.4. Transmission Electron Microscopy (TEM)
2.5. Thermogravimetric Analysis (TGA)
2.6. Specific Surface Area (SSA) Determination
2.7. Cell Culture
2.8. MTT Assay
2.9. Lactate Dehydrogenase (LDH) Assay
2.10. Dichlorodihydrofluorescein Diacetate (DCFDA) Assay
3. Results and Discussion
3.1. Nanoparticle Characterization
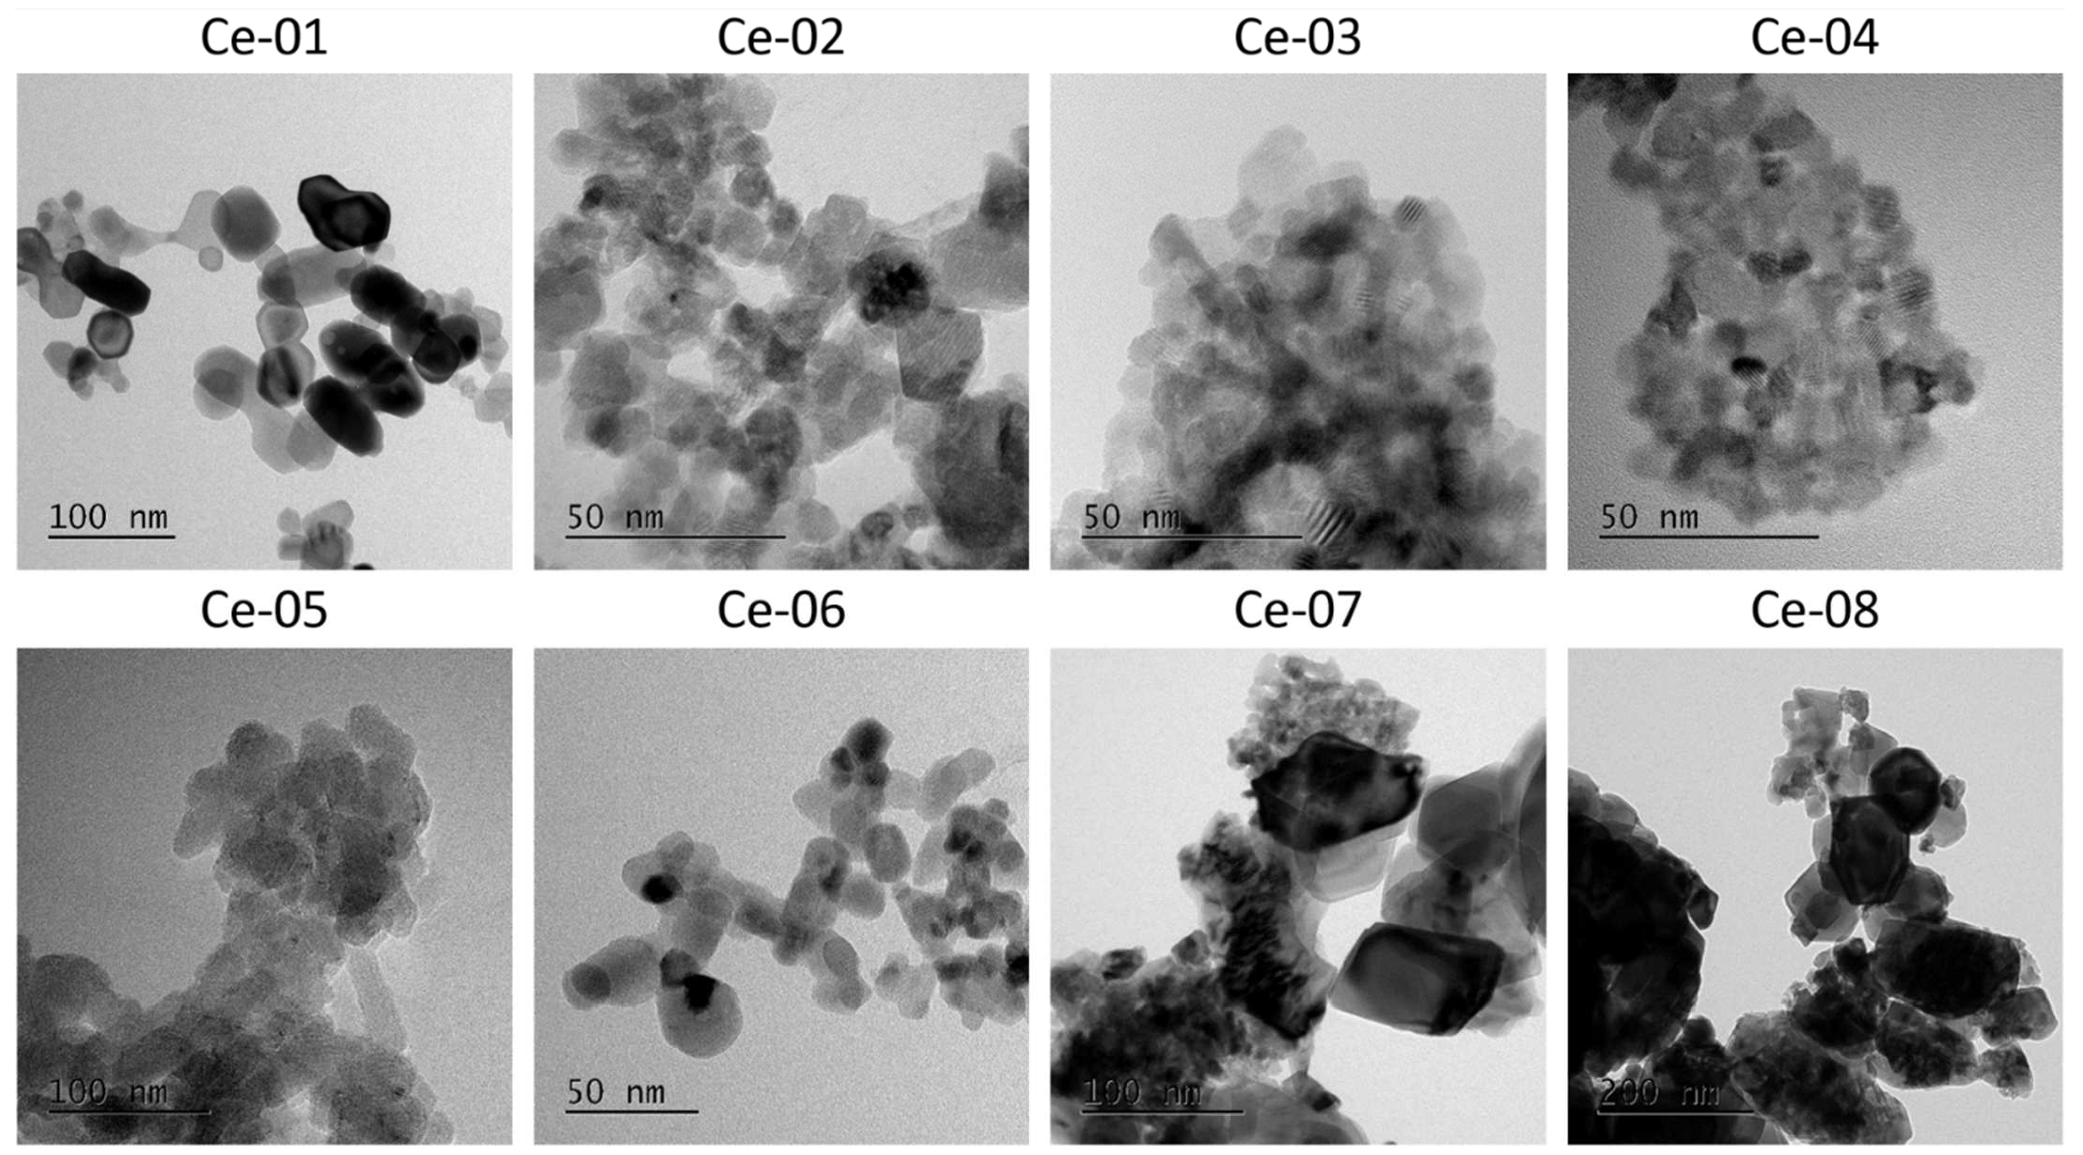
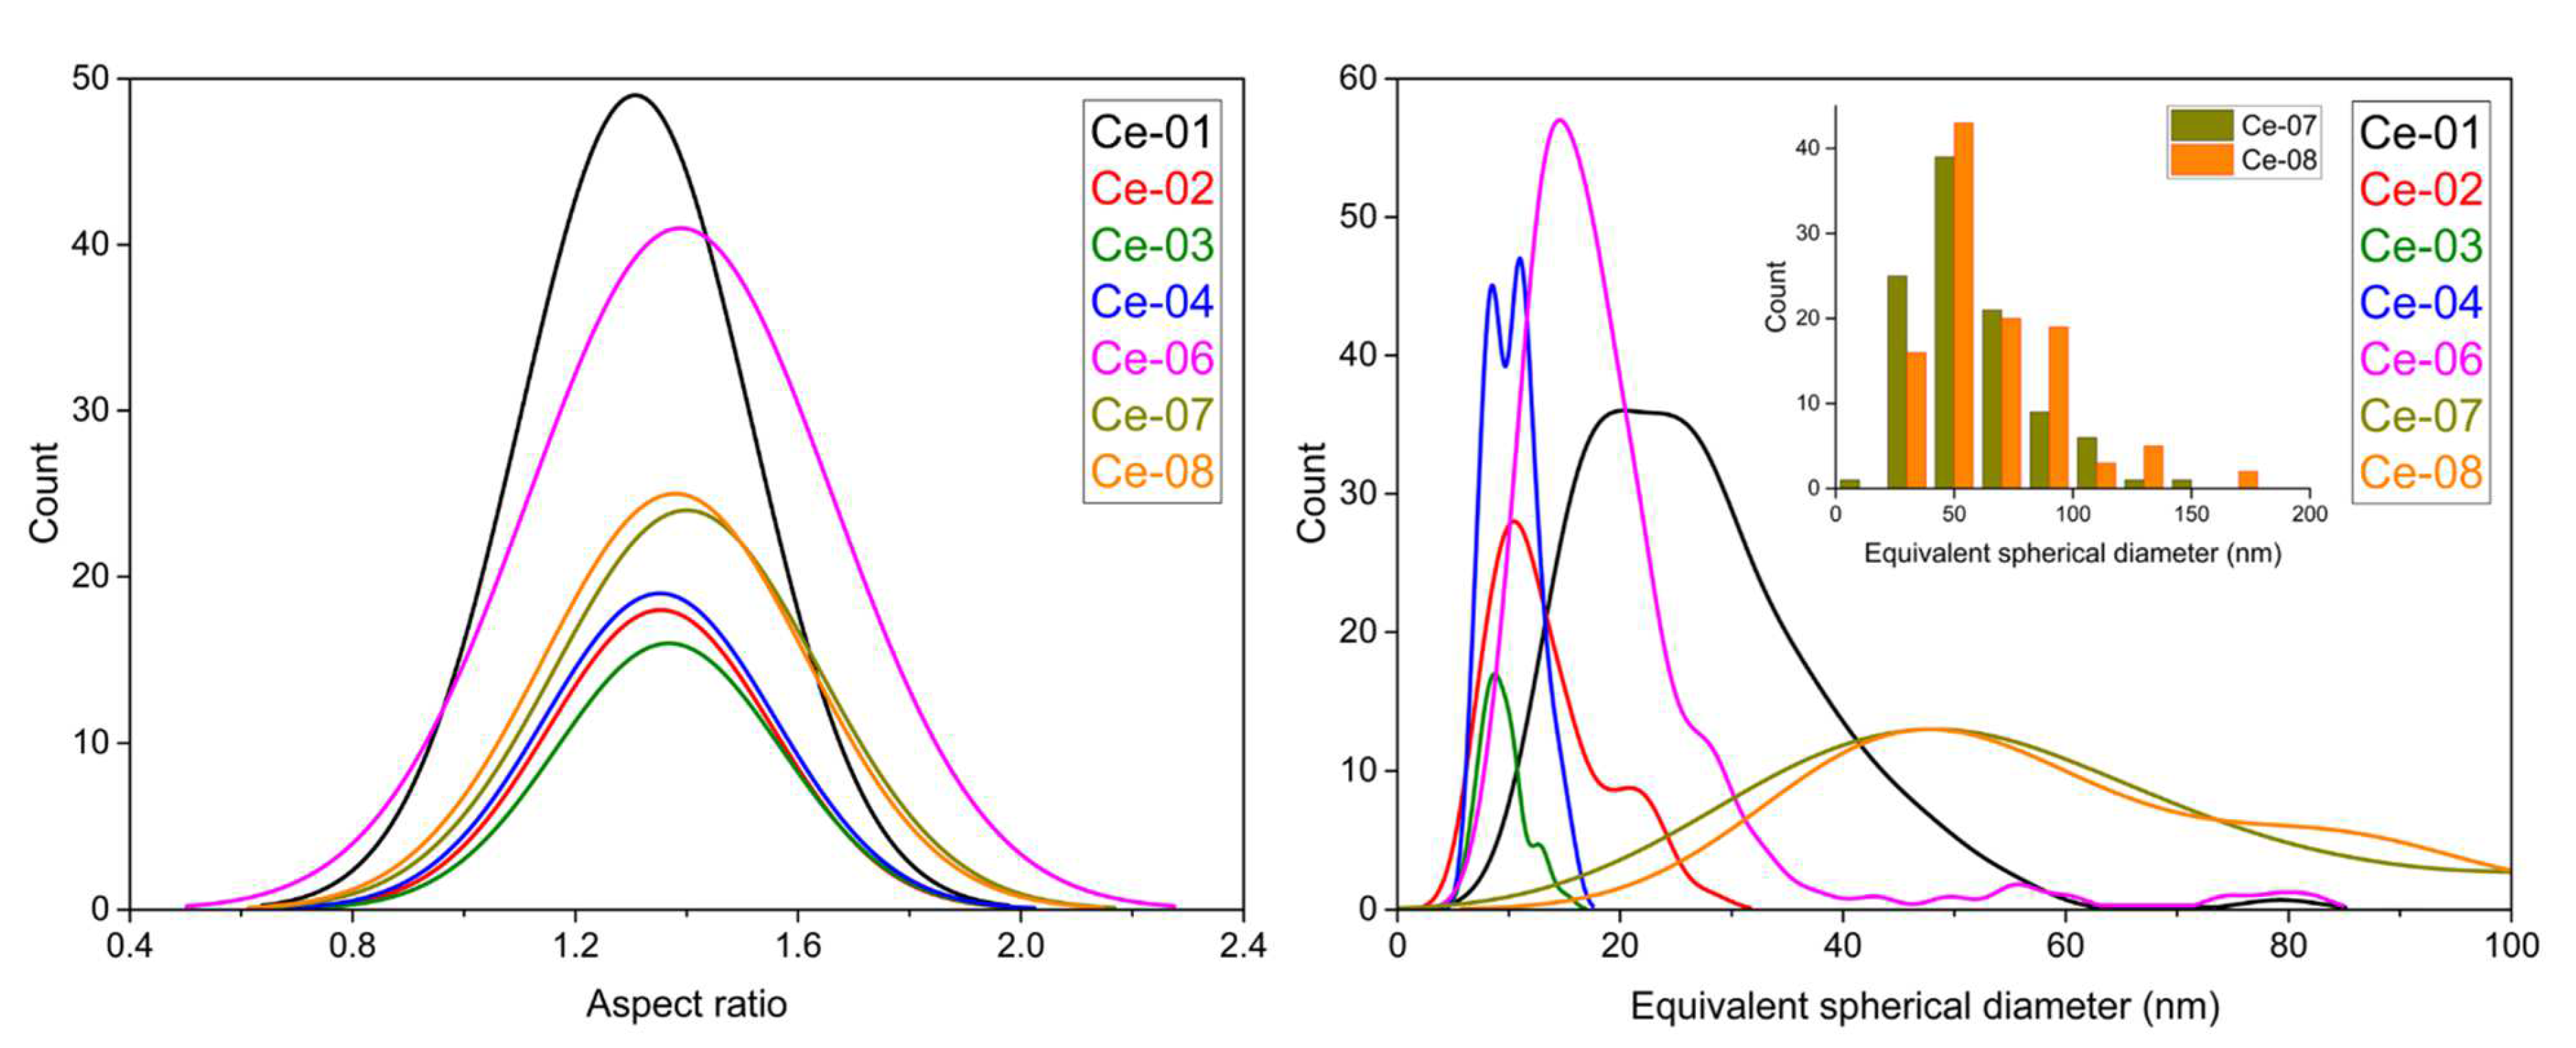
3.1.1. TEM Analysis
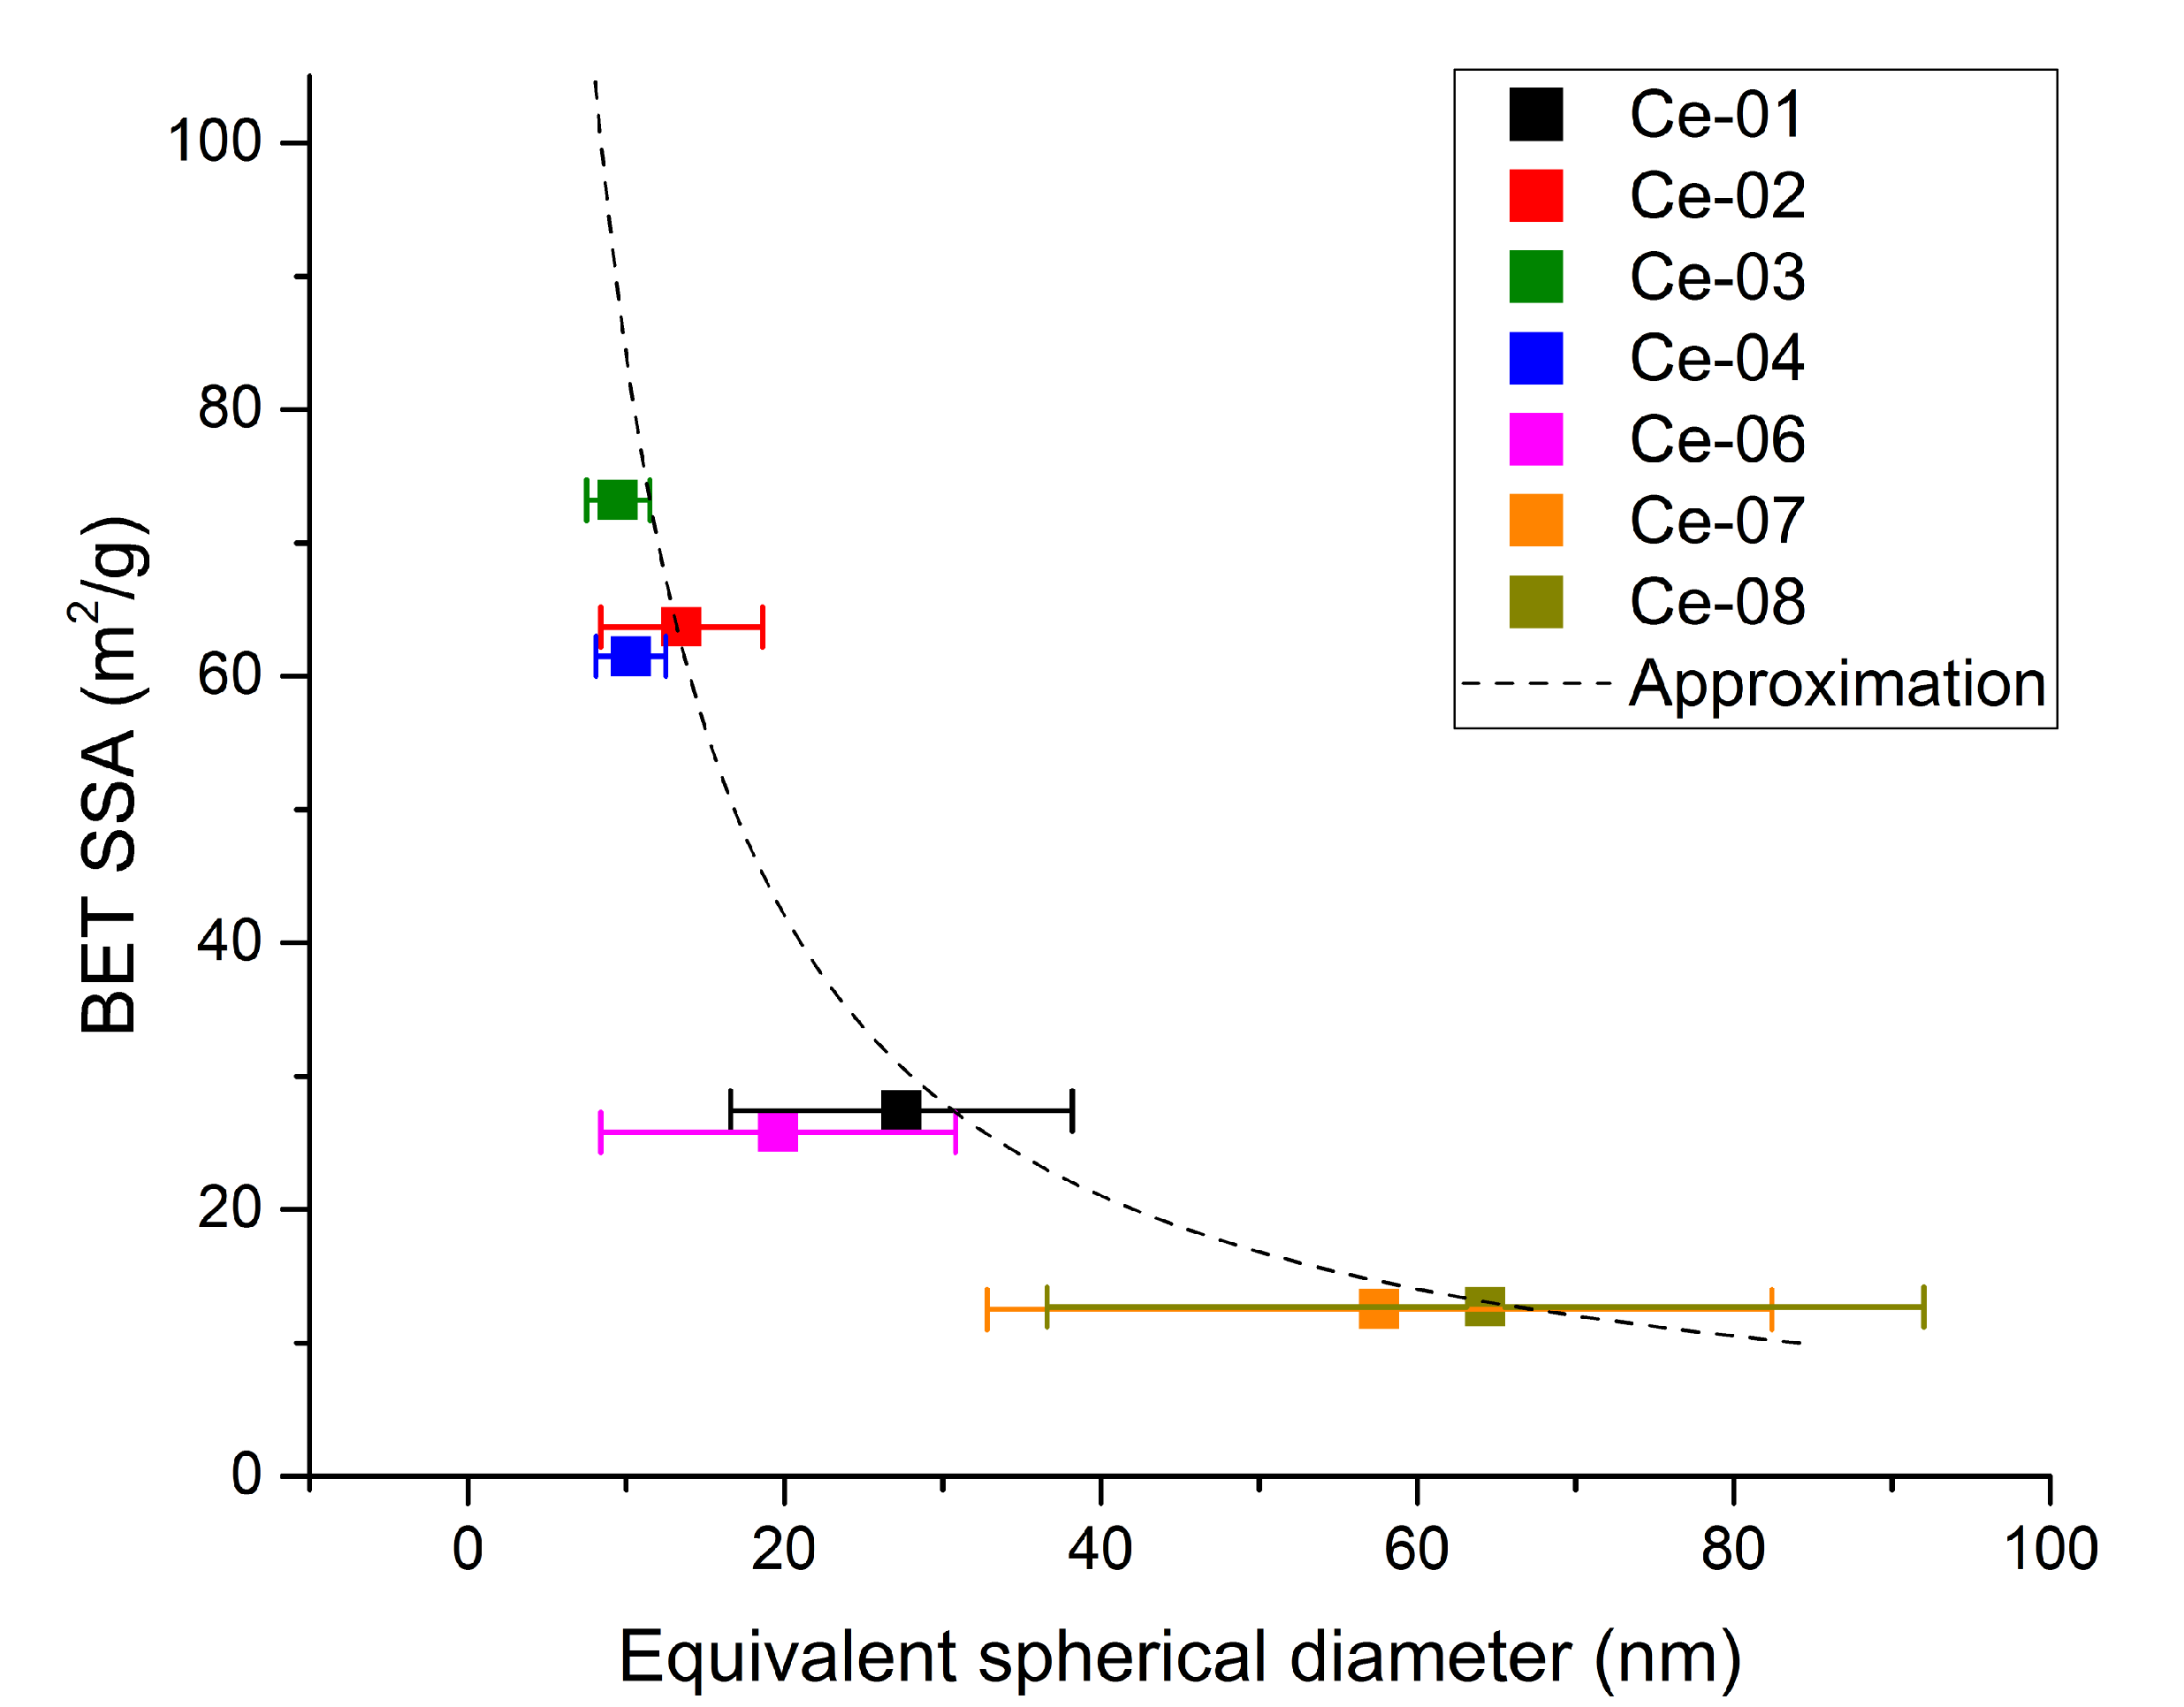
3.1.2. BET Analysis
3.1.3. Quantification of Surface Coatings TGA
3.1.4. Dispersion of Particles in Water and Stability in Cell Culture Medium
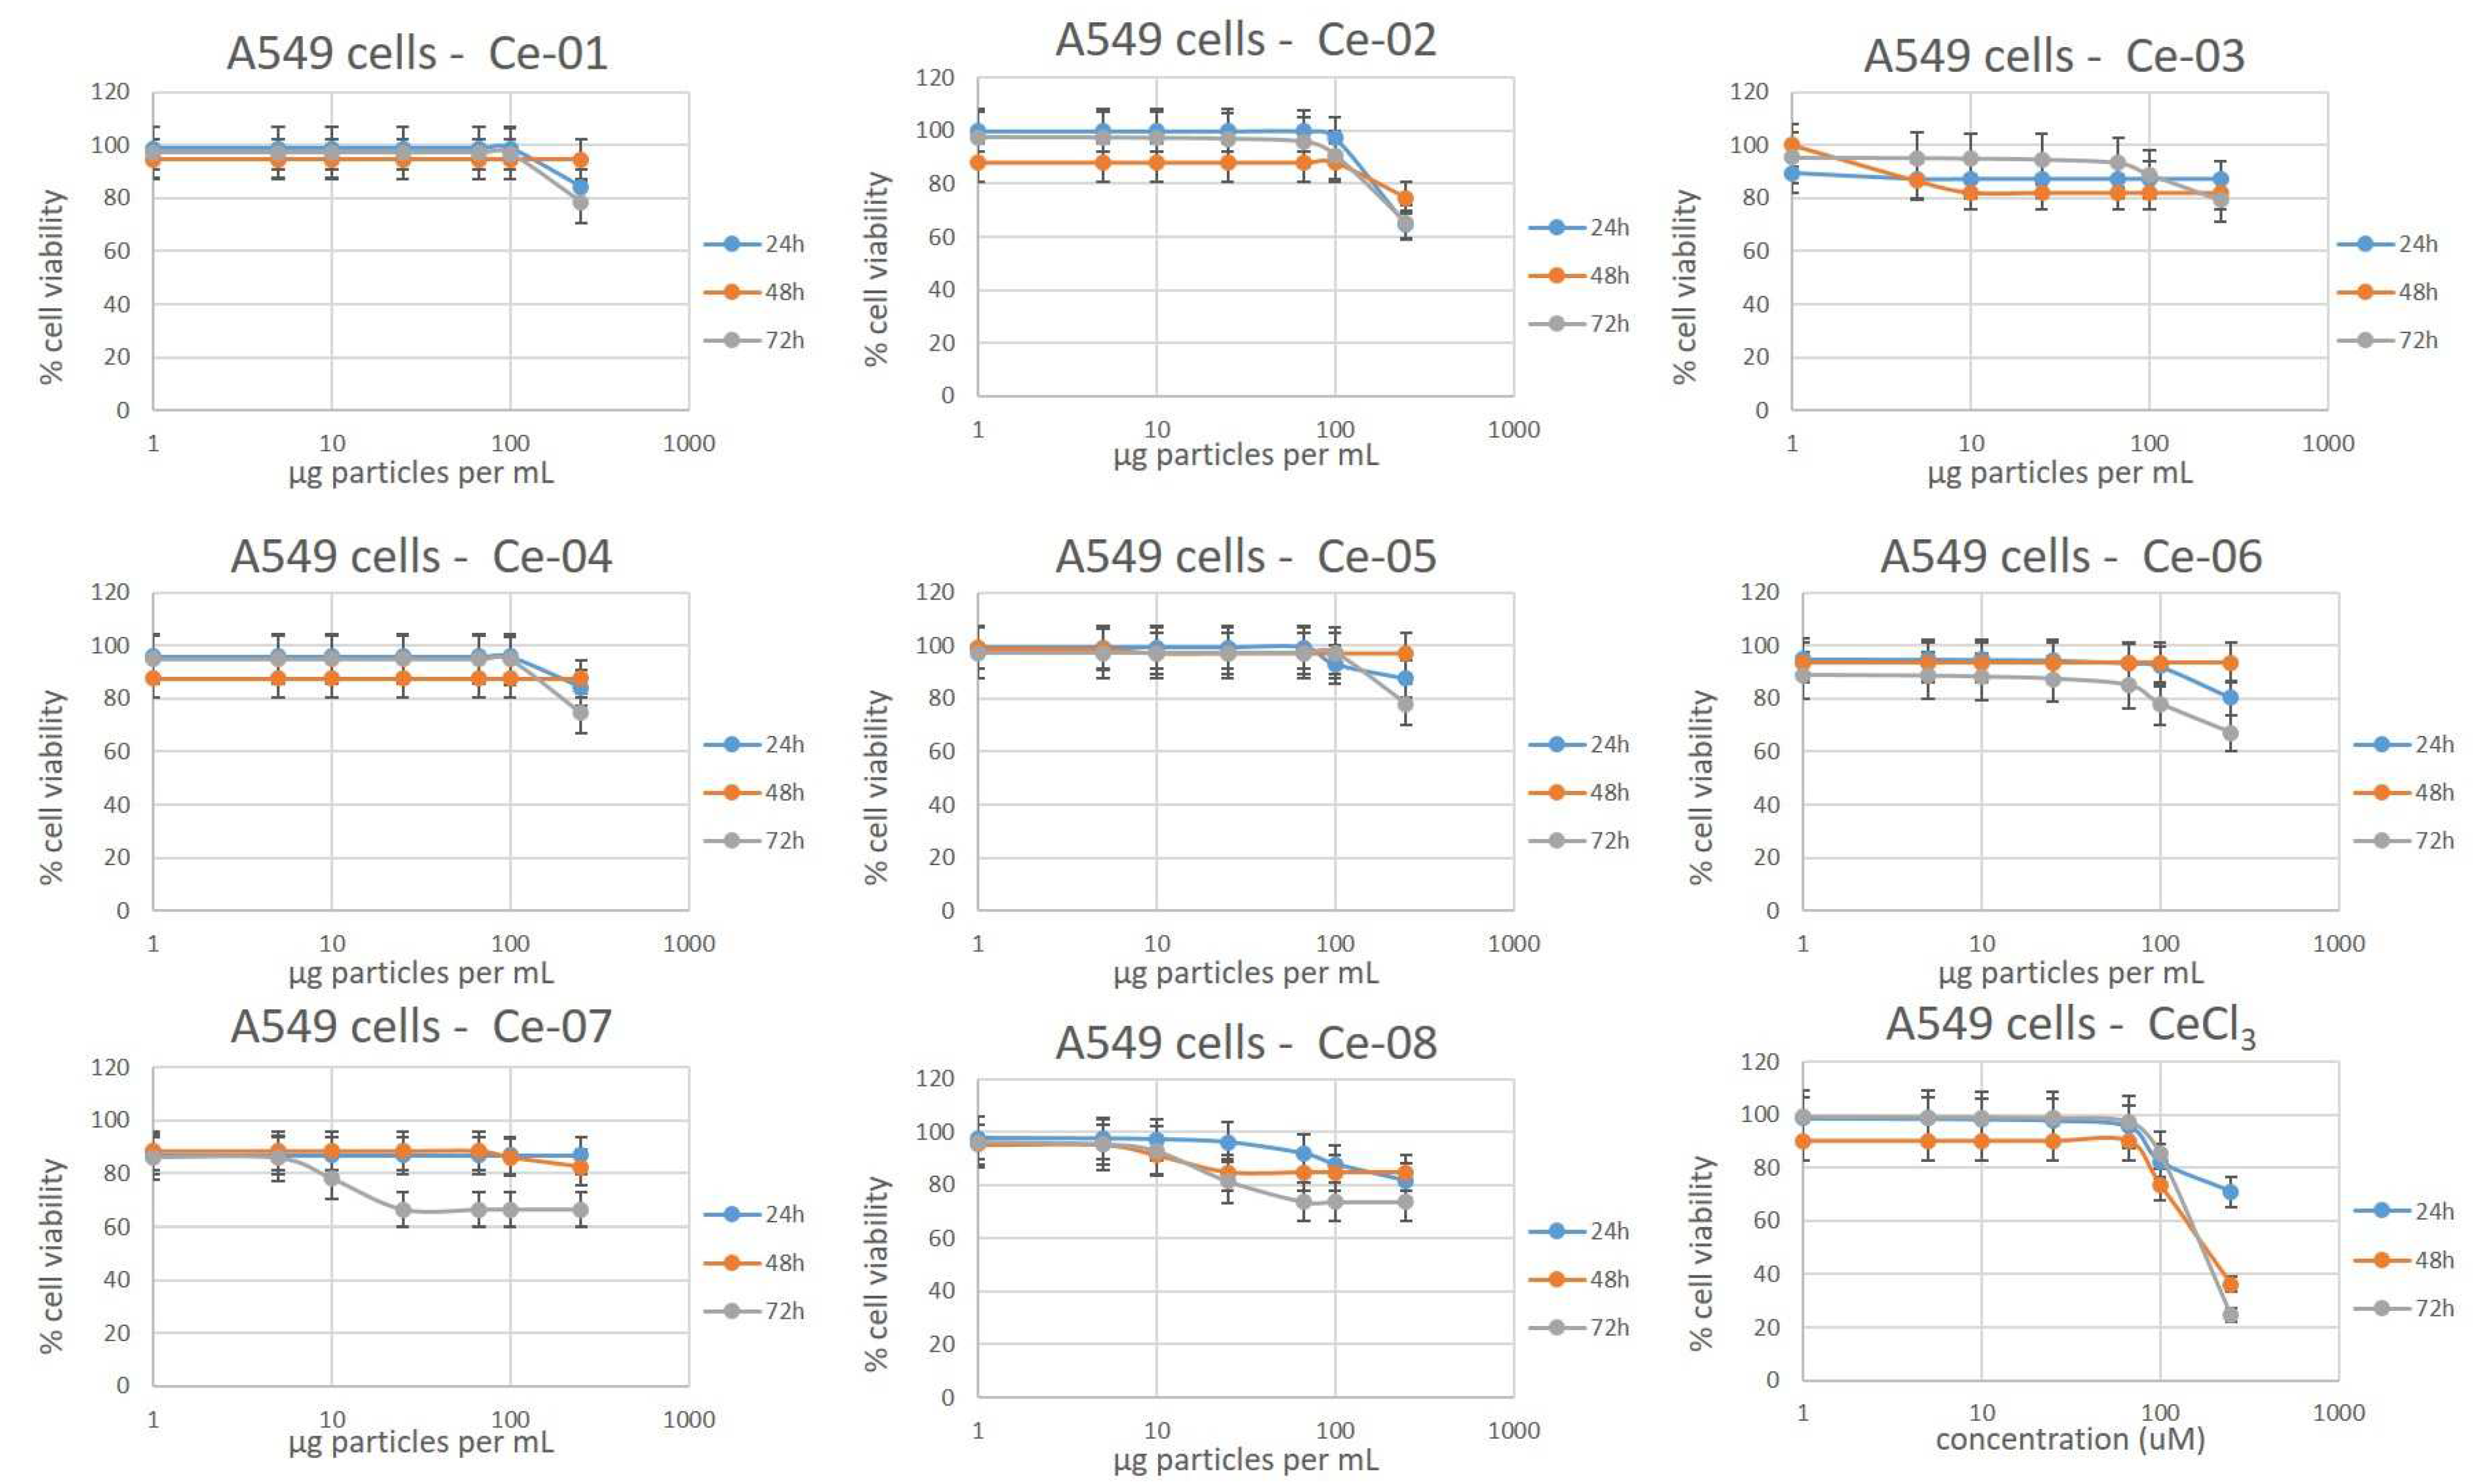
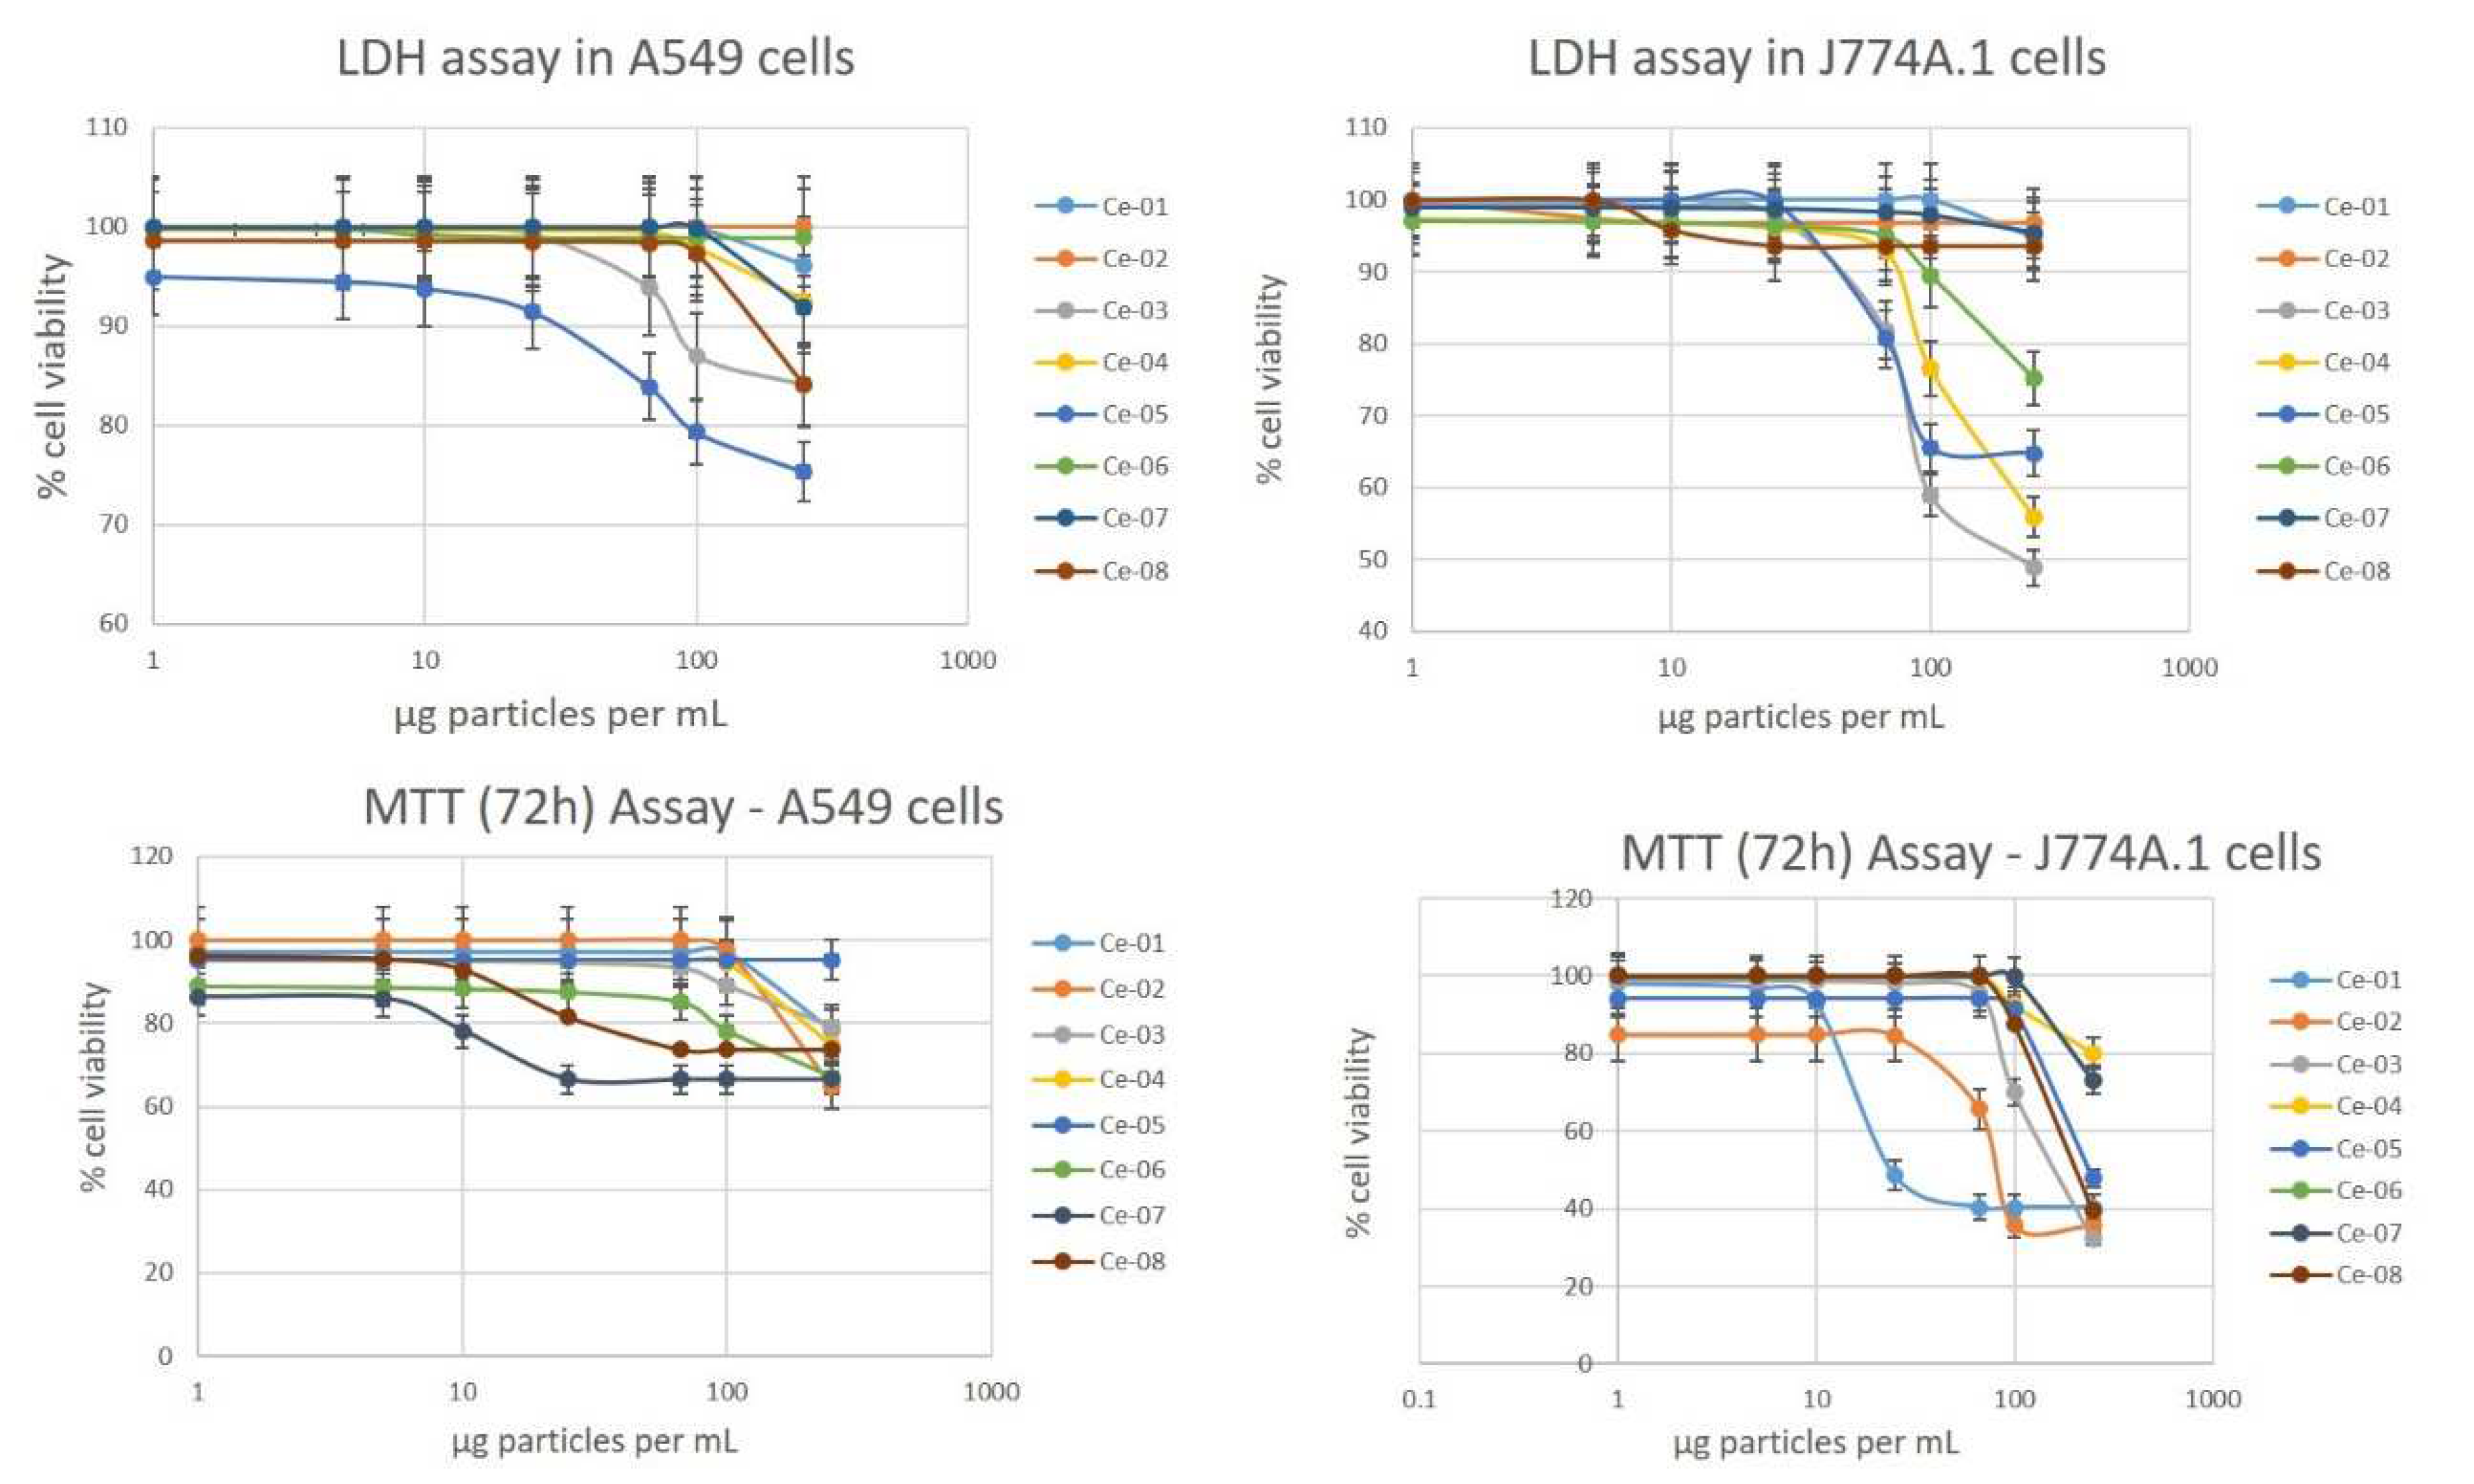
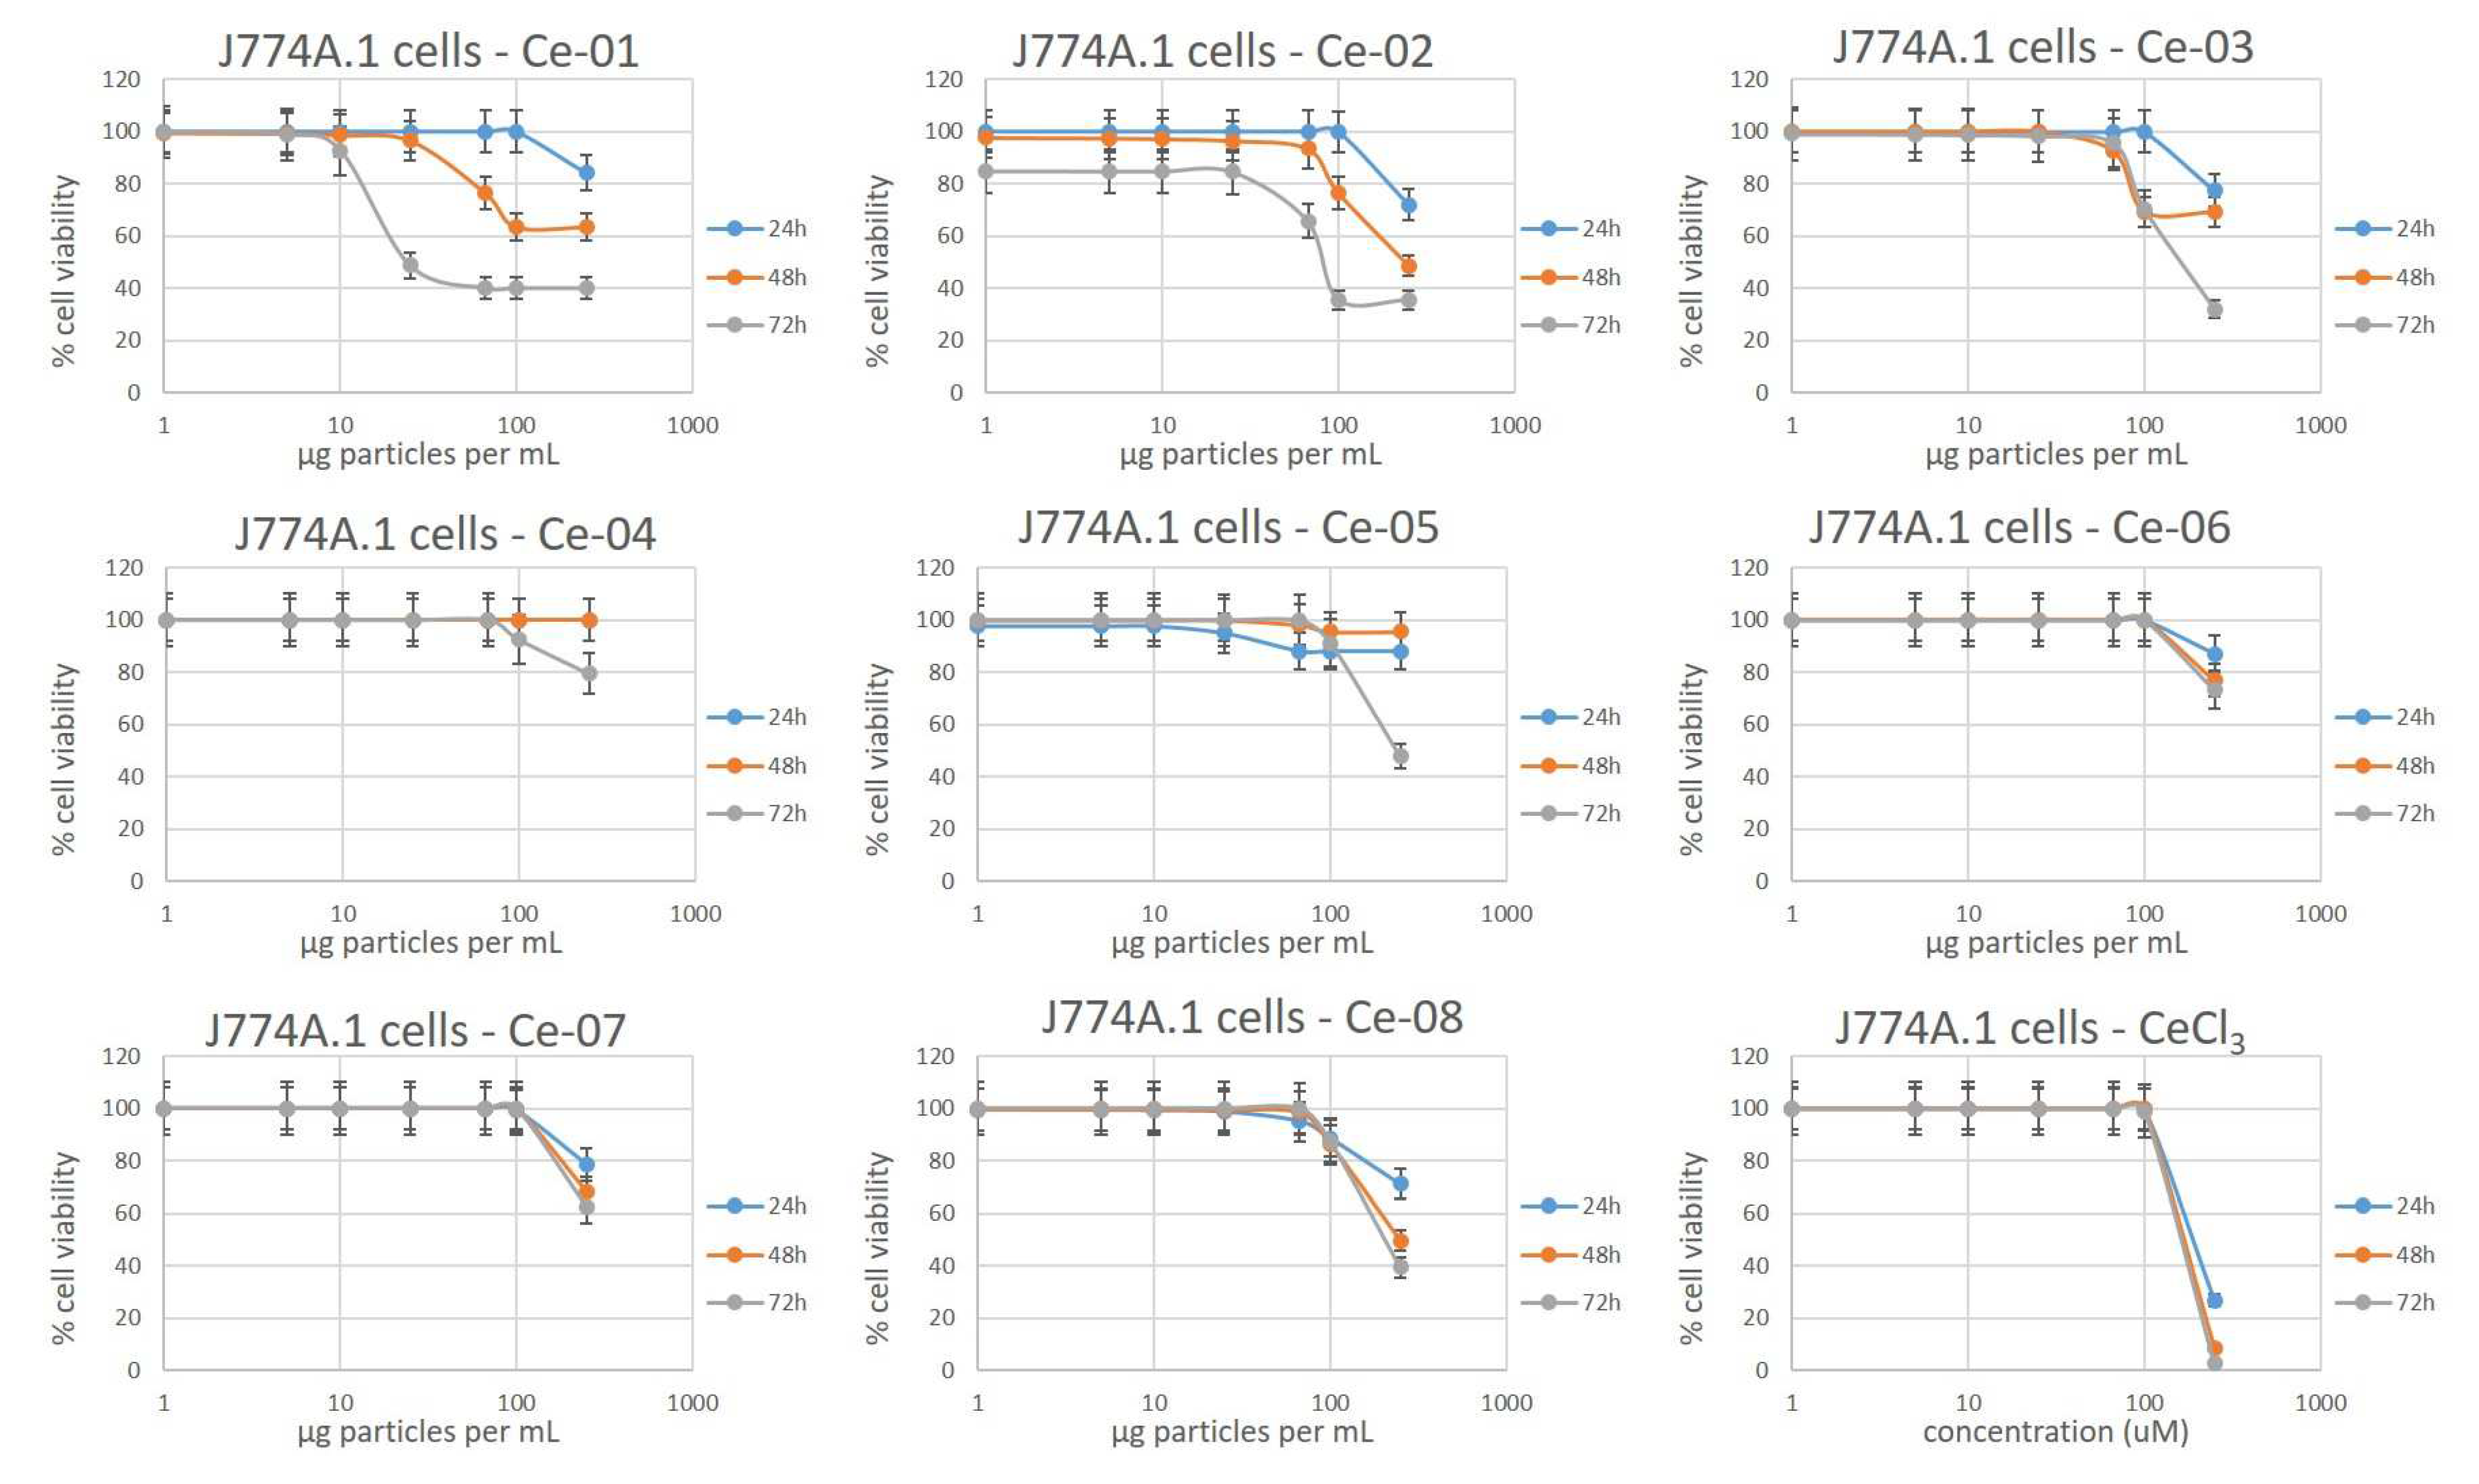
3.2. Cytotoxicity of Cerium Oxide Nanoparticles
3.3. Oxidative Stress Measurements of Cells Treated with Cerium Oxide Nanoparticles
4. Conclusions
Supplementary Materials
Author Contributions
Funding
Institutional Review Board Statement
Informed Consent Statement
Data Availability Statement
Acknowledgments
Conflicts of Interest
References
- Dale, J.G.; Cox, S.S.; Vance, M.E.; Marr, L.C.; Hochella, M.F. Transformation of Cerium Oxide Nanoparticles from a Diesel Fuel Additive during Combustion in a Diesel Engine. Environ. Sci. Technol. 2017, 51, 1973. [Google Scholar] [CrossRef] [PubMed]
- Liu, J.; Zhu, C.; Zhu, D.; Jia, X.; Zhang, Y.; Yu, J.; Li, X.; Yang, M. High Performance Low-Temperature Solid Oxide Fuel Cells Based on Nanostructured Ceria-Based Electrolyte. Nanomaterials 2021, 11, 2231. [Google Scholar] [CrossRef] [PubMed]
- Janoš, P.; Ederer, J.; Pilařová, V.; Henych, J.; Tolasz, J.; Milde, D.; Opletal, T. Chemical mechanical glass polishing with cerium oxide: Effect of selected physico-chemical characteristics on polishing efficiency. Wear 2016, 362–363, 114–120. [Google Scholar] [CrossRef]
- Li, H.; Xia, P.; Pan, S.; Qi, Z.; Fu, C.; Yu, Z.; Kong, W.; Chang, Y.; Wang, K.; Wu, D.; et al. The Advances of Ceria Nanoparticles for Biomedical Applications in Orthopaedics. Int. J. Nanomed. 2020, 15, 7199. [Google Scholar] [CrossRef] [PubMed]
- Thakur, N.; Manna, P.; Das, J. Synthesis and biomedical applications of nanoceria, a redox active nanoparticle. J. Nanobiotechnol. 2019, 17, 84. [Google Scholar] [CrossRef] [PubMed] [Green Version]
- Nelson, B.C.; Johnson, M.E.; Walker, M.L.; Riley, K.R.; Sims, C.M. Antioxidant Cerium Oxide Nanoparticles in Biology and Medicine. Antioxidants 2016, 5, 15. [Google Scholar] [CrossRef] [PubMed] [Green Version]
- Gao, Y.; Chen, K.; Ma, J.-L.; Gao, F. Cerium oxide nanoparticles in cancer. Oncotargets Ther. 2014, 7, 835. [Google Scholar] [CrossRef] [Green Version]
- Kim, J.; Hong, G.; Mazaleuskaya, L.; Hsu, J.C.; Rosario-Berrios, D.N.; Grosser, T.; Cho-Park, P.F.; Cormode, D.P. Ultrasmall Antioxidant Cerium Oxide Nanoparticles for Regulation of Acute Inflammation. ACS Appl. Mater. Interfaces 2021, 13, 60852. [Google Scholar] [CrossRef]
- Arumugam, A.; Karthikeyan, C.; Haja Hameed, A.S.; Gopinath, K.; Gowri, S.; Karthika, V. Synthesis of cerium oxide nanoparticles using Gloriosa superba L. leaf extract and their structural, optical and antibacterial properties. Mater. Sci. Eng. C 2015, 49, 408. [Google Scholar] [CrossRef]
- Pop, O.L.; Mesaros, A.; Vodnar, D.C.; Suharoschi, R.; Tăbăran, F.; Magerușan, L.; Tódor, I.S.; Diaconeasa, Z.; Balint, A.; Ciontea, L.; et al. Cerium Oxide Nanoparticles and Their Efficient Antibacterial Application In Vitro against Gram-Positive and Gram-Negative Pathogens. Nanomaterials 2020, 10, 1614. [Google Scholar] [CrossRef]
- Qi, M.; Li, W.; Zheng, X.; Li, X.; Sun, Y.; Wang, Y.; Li, C.; Wang, L. Cerium and Its Oxidant-Based Nanomaterials for Antibacterial Applications: A State-of-the-Art Review. Front. Mater. 2020, 7, 213. [Google Scholar] [CrossRef]
- Zamani, K.; Allah-Bakhshi, N.; Akhavan, F.; Yousefi, M.; Golmoradi, R.; Ramezani, M.; Bach, H.; Razavi, S.; Irajian, G.-R.; Gerami, M.; et al. Antibacterial effect of cerium oxide nanoparticle against Pseudomonas aeruginosa. BMC Biotechnol. 2021, 21, 68. [Google Scholar] [CrossRef]
- Ruotolo, R.; De Giorgio, G.; Minato, I.; Bianchi, M.G.; Bussolati, O.; Marmiroli, N. Cerium oxide nanoparticles rescue α-synuclein-induced toxicity in a yeast model of Parkinson’s disease. Nanomaterials 2020, 10, 235. [Google Scholar] [CrossRef] [Green Version]
- Sundararajan, V.; Venkatasubbu, G.D.; Sheik Mohideen, S. Investigation of therapeutic potential of cerium oxide nanoparticles in Alzheimer’s disease using transgenic Drosophila. 3 Biotech 2021, 11, 159. [Google Scholar] [CrossRef]
- Allawadhi, P.; Khurana, A.; Allwadhi, S.; Joshi, K.; Packirisamy, G.; Bharani, K.K. Nanoceria as a possible agent for the management of COVID-19. Nano Today 2020, 35, 100982. [Google Scholar] [CrossRef]
- Ulker, D.; Abacioglu, N.; Sehirli, A.O. Cerium Oxide (CeO2) Nanoparticles Could Have Protective Effect Against COVID-19. Lett. Appl. Nanobiosci. 2022, 12, 12. [Google Scholar]
- Aalapati, S.; Ganapathy, S.; Manapuram, S.; Anumolu, G.; Prakya, B.M. Toxicity and bio-accumulation of inhaled cerium oxide nanoparticles in CD1 mice. Nanotoxicology 2014, 8, 786. [Google Scholar] [CrossRef]
- Forest, V.; Leclerc, L.; Hochepied, J.-F.; Trouvé, A.; Sarry, G.; Pourchez, J. Impact of cerium oxide nanoparticles shape on their in vitro cellular toxicity. Toxicol. In Vitro 2017, 38, 136. [Google Scholar] [CrossRef] [Green Version]
- Khorrami, M.B.; Sadeghnia, H.R.; Pasdar, A.; Ghayour-Mobarhan, M.; Riahi-Zanjani, B.; Hashemzadeh, A.; Zare, M.; Darroudi, M. Antioxidant and toxicity studies of biosynthesized cerium oxide nanoparticles in rats. Int. J. Nanomed. 2019, 14, 2915. [Google Scholar] [CrossRef] [Green Version]
- Kumari, M.; Singh, S.P.; Chinde, S.; Rahman, M.F.; Mahboob, M.; Grover, P. Toxicity study of cerium oxide nanoparticles in human neuroblastoma cells. Int. J. Toxicol. 2014, 33, 86. [Google Scholar] [CrossRef]
- Lin, W.; Huang, Y.W.; Zhou, X.D.; Ma, Y. Toxicity of cerium oxide nanoparticles in human lung cancer cells. Int. J. Toxicol. 2006, 25, 451. [Google Scholar] [CrossRef] [PubMed]
- Ma, Y.; Li, P.; Zhao, L.; Liu, J.; Yu, J.; Huang, Y.; Zhu, Y.; Li, Z.; Zhao, R.; Hua, S.; et al. Size-Dependent Cytotoxicity and Reactive Oxygen Species of Cerium Oxide Nanoparticles in Human Retinal Pigment Epithelia Cells. Int. J. Nanomed. 2021, 16, 5333. [Google Scholar] [CrossRef] [PubMed]
- Mittal, S.; Pandey, A.K. Cerium oxide nanoparticles induced toxicity in human lung cells: Role of ROS mediated DNA damage and apoptosis. BioMed. Res. Int. 2014, 2014, 891934. [Google Scholar] [CrossRef] [PubMed] [Green Version]
- Savic-Zdravkovic, D.; Milosevic, D.; Uluer, E.; Duran, H.; Matic, S.; Stanic, S.; Vidmar, J.; Scancar, J.; Dikic, D.; Jovanovic, B. A Multiparametric Approach to Cerium Oxide Nanoparticle Toxicity Assessment in Non-Biting Midges. Environ. Toxicol. Chem. 2020, 39, 131. [Google Scholar] [CrossRef] [PubMed] [Green Version]
- Sugantharaj David, E.M.D.; Madurantakam Royam, M.; Rajamani Sekar, S.K.; Manivannan, B.; Jalaja Soman, S.; Mukherjee, A.; Natarajan, C. Toxicity, uptake, and accumulation of nano and bulk cerium oxide particles in Artemia salina. Environ. Sci. Pollut. Res. Int. 2017, 24, 24187. [Google Scholar] [CrossRef] [PubMed]
- Moore, T.L.; Rodriguez-Lorenzo, L.; Hirsch, V.; Balog, S.; Urban, D.; Jud, C.; Rothen-Rutishauser, B.; Lattuada, M.; Petri-Fink, A. Nanoparticle colloidal stability in cell culture media and impact on cellular interactions. Chem. Soc. Rev. 2015, 44, 6287. [Google Scholar] [CrossRef] [Green Version]
- Kunc, F.; Bushell, M.; Du, X.; Zborowski, A.; Johnston, L.J.; Kennedy, D.C. Physical Characterization and Cellular Toxicity Studies of Commercial NiO Nanoparticles. Nanomaterials 2022, 12, 1822. [Google Scholar] [CrossRef]
- Singh, C.; Friedrichs, S.; Ceccone, G.; Gibson, P.; Jensen, K.; Levin, M.; Goenaga, H.; Carlander, D.; Rasmussen, K. Cerium Dioxide, NM-211, NM-212, NM-213. Characterisation and Test Item Preparation. Available online: http://publications.jrc.ec.europa.eu/repository/bitstream/JRC89825/lbna26649enn.pdf (accessed on 12 January 2022).
- Kunc, F.; Gallernault, M.; Kodra, O.; Brinkmann, A.; Lopinski, G.P.; Johnston, L.J. Surface chemistry of metal oxides nanoparticles: NMR and TGA quantification. Anal. Bioanal. Chem. 2022, 414, 4409. [Google Scholar] [CrossRef]
- Kunc, F.; Kodra, O.; Brinkmann, A.; Lopinski, G.P.; Johnston, L.J. A Multi-Method Approach for Quantification of Surface Coatings on Commercial Zinc Oxide Nanomaterials. Nanomaterials 2020, 10, 678. [Google Scholar] [CrossRef] [Green Version]
- Na, I.; Kennedy, D.C. Size-Specific Copper Nanoparticle Cytotoxicity Varies between Human Cell Lines. Int. J. Mol. Sci. 2021, 22, 1548. [Google Scholar] [CrossRef]
- Al Rashaideh, T.; Metwali, N.; Perry, S.S.; Adamcakova-Dodd, A.; Thorne, P.S. Cerium Oxide Enhances the Toxicity of Zinc Oxide Nanoparticles in Human Lung Epithelial Cell Cultures. Toxics 2022, 10, 522. [Google Scholar] [CrossRef]


| Sample | Measurand | n 1 | Mean (nm) | Std 1 Dev (nm) | Std 1 Error | Median (nm) | Nominal Size (nm) |
| Ce-01, bare | Equiv diameter, nm | 152 | 27.4 | 10.8 | 0.9 | 25.8 | 50 |
| Aspect ratio | 1.31 | 0.21 | 0.02 | 1.25 | |||
| Ce-02, bare | Equiv diameter, nm | 68 | 13.5 | 5.11 | 0.6 | 12.2 | 10–30 |
| Aspect ratio | 1.35 | 0.20 | 0.02 | 1.32 | |||
| Ce-03 bare | Equiv diameter, nm | 55 | 9.5 | 2.0 | 0.3 | 9.0 | 10 |
| Aspect ratio | 1.37 | 0.20 | 0.03 | 1.33 | |||
| Ce-04 PVP | Equiv diameter, nm | 88 | 10.3 | 2.2 | 0.2 | 10.5 | 10 |
| Aspect ratio | 1.35 | 0.21 | 0.02 | 1.31 | |||
| Ce-05 2 stearic acid | Equiv diameter, nm | 10 | |||||
| Aspect ratio | |||||||
| Ce-06, bare | Equiv diameter, nm | 180 | 19.6 | 11.2 | 0.8 | 16.8 | 50–105 |
| Aspect ratio | 1.39 | 0.27 | 0.02 | 1.31 | |||
| Ce-07, bare | Equiv diameter, nm | 103 | 57.6 | 24.8 | 2.4 | 52.3 | 70 |
| Aspect ratio | 1.40 | 0.24 | 0.02 | 1.36 | |||
| Ce-08, bare | Equiv diameter, nm | 108 | 64.3 | 27.7 | 2.7 | 55.3 | 25 |
| Aspect ratio | 1.38 | 0.23 | 0.02 | 1.32 |
| Sample | Coating | SSA, Supplier (m2/g) | SSA, BET (m2/g) |
|---|---|---|---|
| Ce-01 | uncoated | 30–35 | 27.4 |
| Ce-02 | uncoated | 30–50 | 63.7 |
| Ce-03 | uncoated | 35–75 | 73.2 |
| Ce-04 | PVP | 35–75 | 61.5 |
| Ce-05 | Stearic acid | 35–75 | 26.9 |
| Ce-06 | uncoated | 8–15 | 25.8 |
| Ce-07 | uncoated | - | 12.5 |
| Ce-08 | uncoated | - | 12.7 |
| Sample | Coating | TGA in Argon, µmol/g, (n) 1 (Temperature Range) | |
|---|---|---|---|
| Corrected | Uncorrected | ||
| Ce-04 | PVP | 744 ± 22 (n = 2) (316–582 °C) | 788 ± 22 (n = 2) (316–582 °C) |
| Ce-05 | Stearic acid | 188 ± 12 (n = 3) (264–550 °C) | 213 ± 12 (n = 3) (264–550 °C) |
Publisher’s Note: MDPI stays neutral with regard to jurisdictional claims in published maps and institutional affiliations. |
© 2022 by the authors. Licensee MDPI, Basel, Switzerland. This article is an open access article distributed under the terms and conditions of the Creative Commons Attribution (CC BY) license (https://creativecommons.org/licenses/by/4.0/).
Share and Cite
Bushell, M.; Kunc, F.; Du, X.; Zborowski, A.; Johnston, L.J.; Kennedy, D.C. Characterization of Engineered Cerium Oxide Nanoparticles and Their Effects on Lung and Macrophage Cells. Int. J. Transl. Med. 2022, 2, 522-536. https://doi.org/10.3390/ijtm2040039
Bushell M, Kunc F, Du X, Zborowski A, Johnston LJ, Kennedy DC. Characterization of Engineered Cerium Oxide Nanoparticles and Their Effects on Lung and Macrophage Cells. International Journal of Translational Medicine. 2022; 2(4):522-536. https://doi.org/10.3390/ijtm2040039
Chicago/Turabian StyleBushell, Michael, Filip Kunc, Xiaomei Du, Andre Zborowski, Linda J. Johnston, and David C. Kennedy. 2022. "Characterization of Engineered Cerium Oxide Nanoparticles and Their Effects on Lung and Macrophage Cells" International Journal of Translational Medicine 2, no. 4: 522-536. https://doi.org/10.3390/ijtm2040039