Article

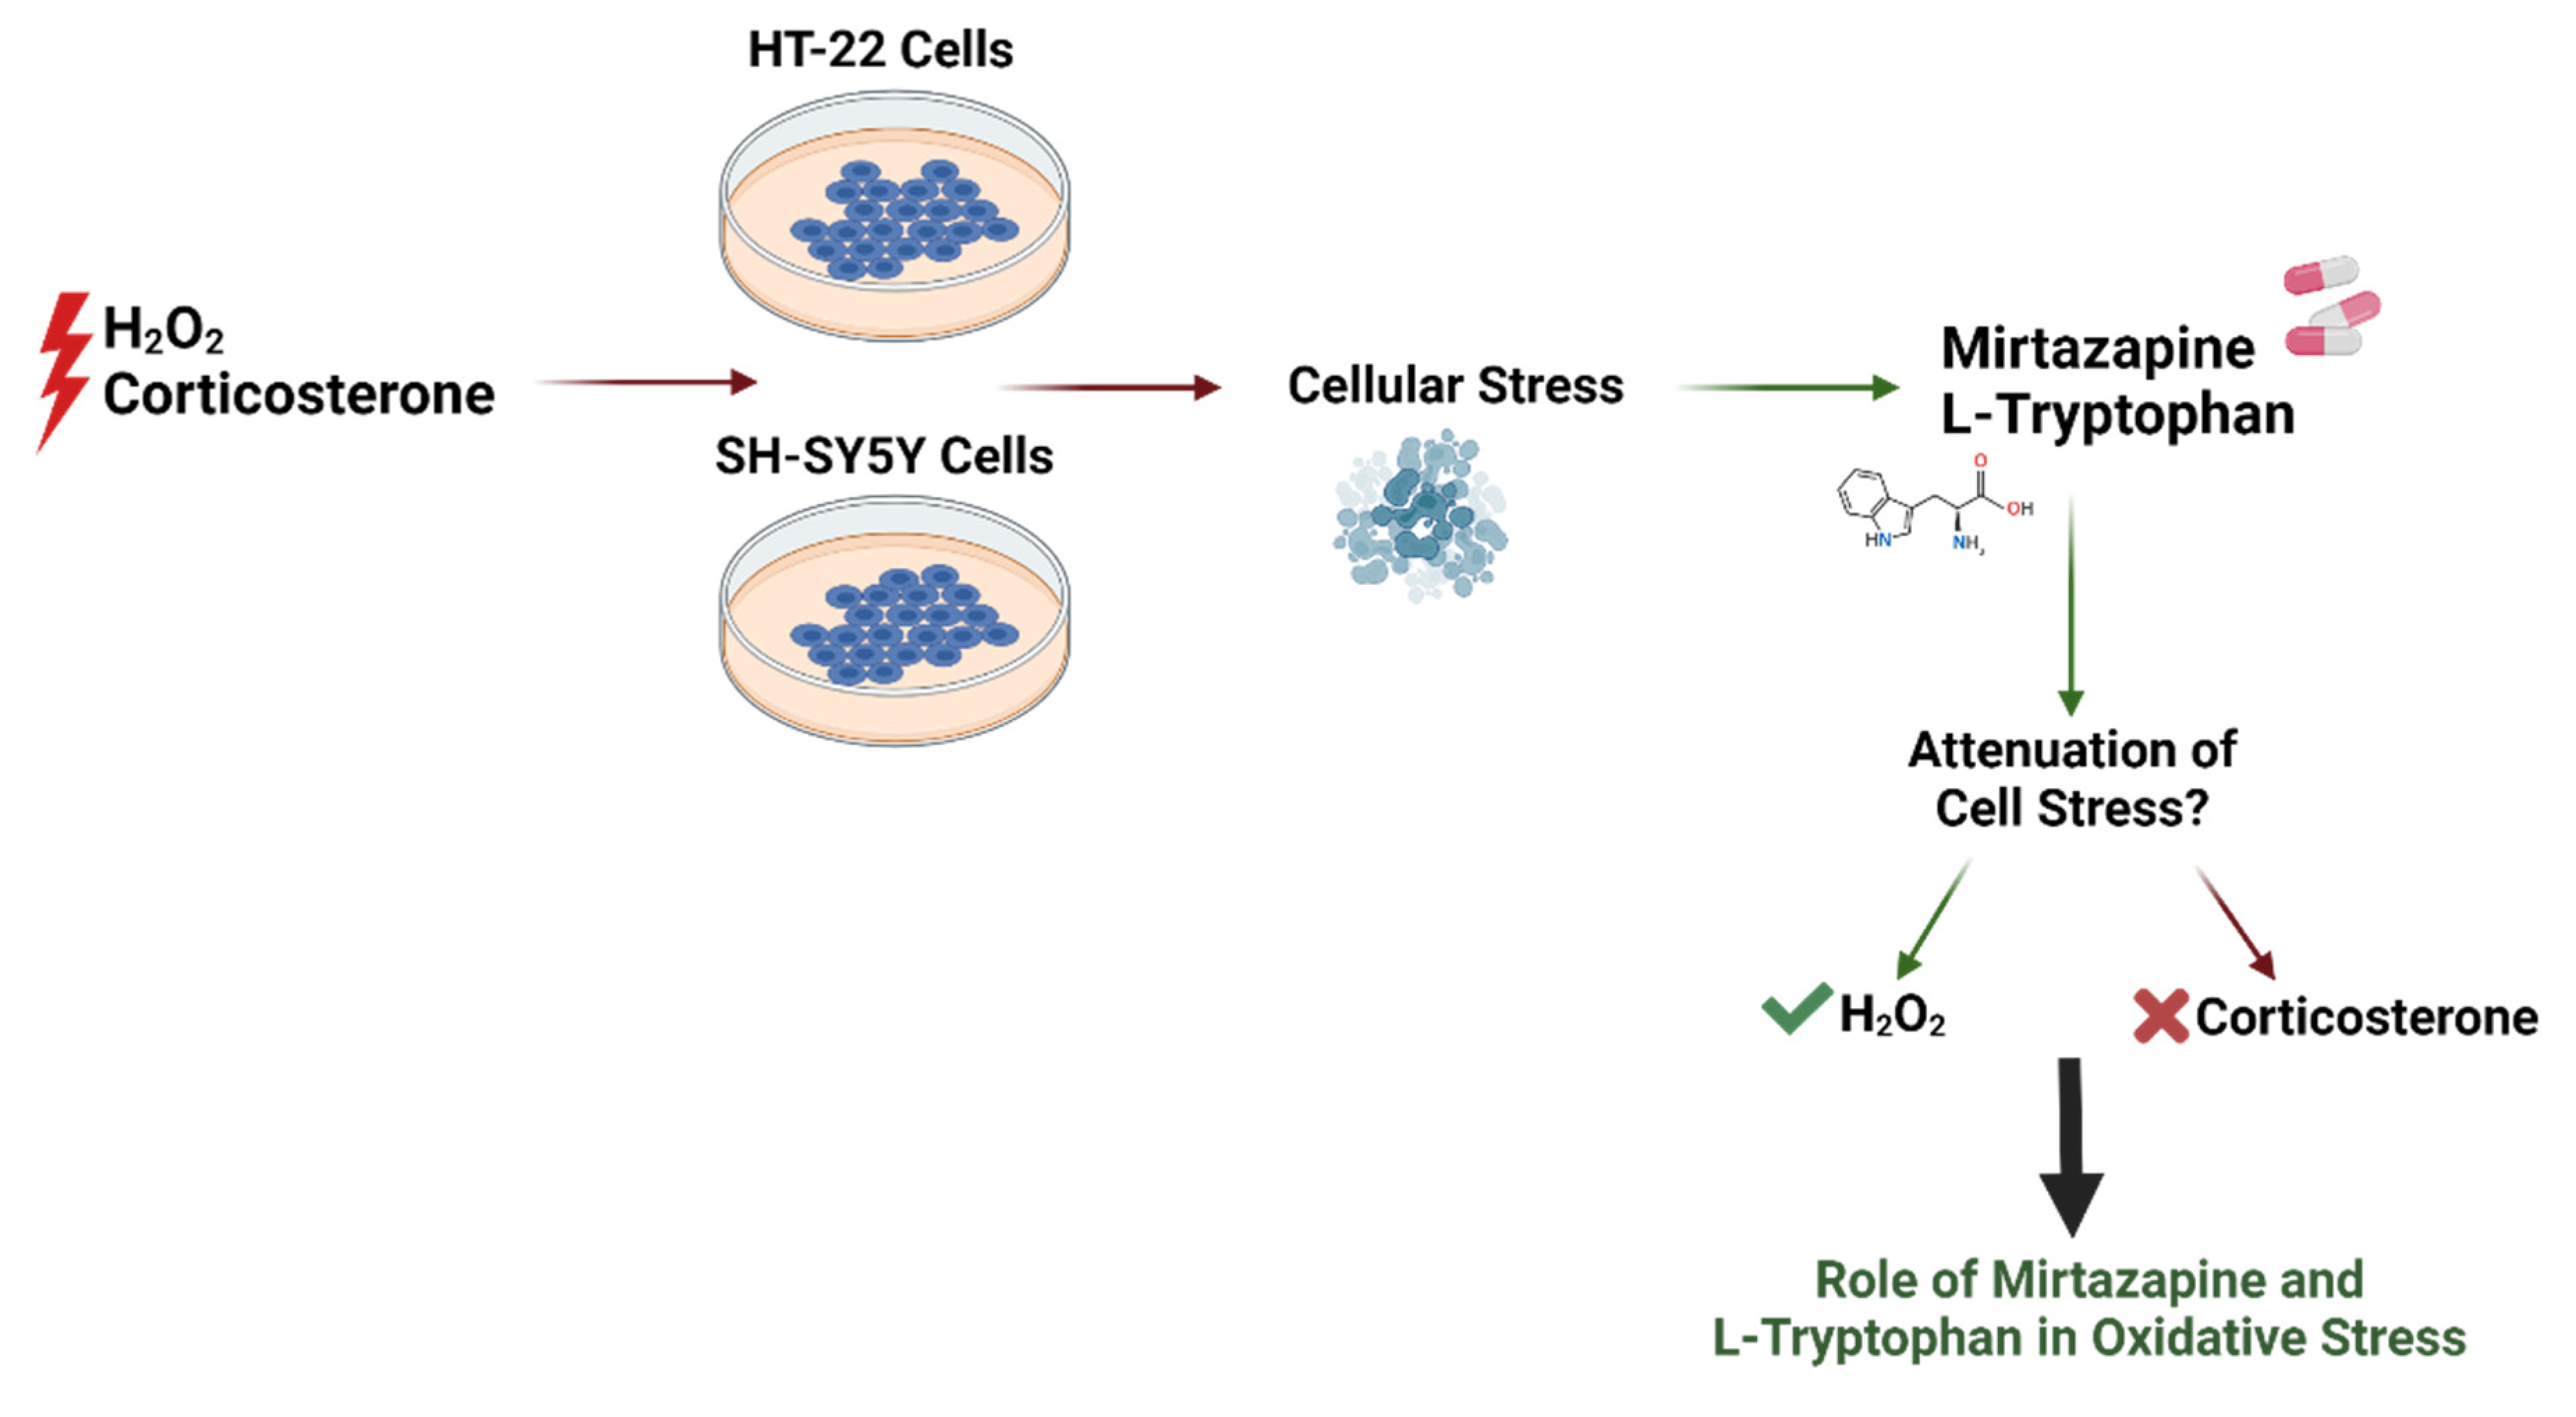
Significant Differences in the Reversal of Cellular Stress Induced by Hydrogen Peroxide and Corticosterone by the Application of Mirtazapine or L-Tryptophan

by
Ana Salomé Correia
1,2,
Armando Cardoso
3,4,5 and
Nuno Vale
1,3,6,*
1
OncoPharma Research Group, Center for Health Technology and Services Research (CINTESIS), Rua Dr. Plácido da Costa, 4200-450 Porto, Portugal
2
Institute of Biomedical Sciences Abel Salazar (ICBAS), University of Porto, Rua de Jorge Viterbo Ferreira 228, 4050-313 Porto, Portugal
3
CINTESIS@RISE, Faculty of Medicine, University of Porto, Al. Prof. Hernâni Monteiro, 4200-319 Porto, Portugal
4
NeuroGen Research Group, Center for Health Technology and Services Research (CINTESIS), Rua Dr. Plácido da Costa, 4200-450 Porto, Portugal
5
Unit of Anatomy, Department of Biomedicine, Faculty of Medicine, University of Porto, Alameda Professor Hernâni Monteiro, 4200-319 Porto, Portugal
6
Department of Community Medicine, Information and Health Decision Sciences (MEDCIDS), Faculty of Medicine, University of Porto, Al. Prof. Hernâni Monteiro, 4200-319 Porto, Portugal
*
Author to whom correspondence should be addressed.
Int. J. Transl. Med. 2022, 2(3), 482-505; https://doi.org/10.3390/ijtm2030036
Submission received: 6 June 2022 / Revised: 25 July 2022 / Accepted: 30 August 2022 / Published: 3 September 2022
(This article belongs to the Special Issue Trends of Translational Medicine for Oncology)

Abstract

:
Depression is a prevalent and debilitating disease worldwide. This pathology is very complex and the lack of efficient therapeutic modalities, as well as the high rates of relapse, makes the study and treatment of depression a global healthcare challenge. Thus, an intense investigation of this disease is crucial and urgent. In this study, we focused on hydrogen peroxide and corticosterone-induced stress on SH-SY5Y and HT-22 cells. Additionally, we aimed to study the potential attenuation of these induced stress with the exposure of both cells to mirtazapine and L-tryptophan, focusing on cell viability assays (MTT and Neutral Red) and reactive oxygen species production assays (DCFDA fluorescence). Taken together, our results indicate that mirtazapine and L-tryptophan counteract the cellular stress induced by hydrogen peroxide but not by corticosterone, revealing a potential role of these agents on oxidative stress relief, highlighting the role of serotonergic pathways in the oxidative stress present in depressed individuals. This study allows the investigation of depression using cellular models, enabling the screening of compounds that may have potential to be used in the treatment of depression by acting on cellular mechanisms such as oxidative stress protection.

1. Introduction

Depression is a worldwide prevalent disease that represents a major healthcare concern. This disease is characterized by several symptoms that include sad mood and lack of energy. In extreme cases, depression may even lead to death by suicide. There are several molecular mechanisms involved in the pathology of this disease, making its study a complex challenging task. Indeed, the resistance to the several available treatments and the high rates of relapse highlight the importance of the investigation of this disease and its associated therapies [1,2]. Thus, simpler, faster, and reproducible methodologies of investigation are extremely important to be implemented, such as cellular studies, that enable the study of molecular mechanisms associated with depression’s pathophysiology at the cellular level, sparing animal studies at the initial stages of investigation. To implement this kind of study, it is important to focus on specific biomarkers/hallmarks associated with depression [3]. Thus, in this study, we focused on hydrogen peroxide (H2O2) and glucocorticoid (particularly corticosterone) induced stress.
H2O2 promotes the generation of oxidative stress in the cells by increasing the overall reactive oxygen species (ROS) levels. These species cause oxidative DNA damage, dysfunction of the mitochondrial membrane potential, and apoptosis [4]. In depression, the role of oxidative stress is widely recognized and contributes to disease progression and increase in pro-inflammatory pathways and abnormal neuronal signaling [5,6]. Indeed, depressive individuals usually present high levels of oxidative stress markers and low levels of antioxidant defenses. For example, malondialdehyde (a product of lipidic damage caused by ROS) and 8-hydroxy-2-deoxyguanosine (a product originated by oxidation of DNA’s guanine) levels are increased in depressed patients, compared to healthy controls. Additionally, levels of antioxidant defenses such as superoxide dismutase and ascorbic acid are typically impaired in depressed individuals [6,7]. Regarding glucocorticoid (particularly corticosterone and cortisol) induced stress, the role of these compounds is also widely recognized in this disease. Indeed, glucocorticoids are key components in the stress response, connected with the hypothalamus-hypophysis–adrenal (HPA) axis [8,9]. Dysfunctions of this axis relate to depression, and chronic levels of glucocorticoids lead to HPA axis dysfunction, promoting stress responses such as high inflammation levels, cellular damage, and depressive phenotypes [10]. Based on these evidences, some studies include these compounds as stress/depression inducers [11,12,13,14,15,16,17,18,19,20,21,22].
In opposite, antidepressants such as mirtazapine are used in the context of the therapy of depression. This drug is an antagonist of adrenergic α2, and the serotonergic 5-HT2 and 5-HT3 receptors [23], and was previously reported as a good candidate for the reversal of H2O2 stress induction in the cells by mechanisms such as DNA damage and reduction of the expression of pro-apoptotic proteins such as Bax [19,22]. Taking into account the influence of mirtazapine in serotonergic pathways (widely recognized as important to the context of depression [24]), the complementary incorporation of L-tryptophan as a potential stress reverser in this study is based on the fact that this amino acid is the precursor of serotonin (5-HT) synthesis and may influence the activity of serotonergic pathways [25].
In this work, we aimed to study the induction of HT-22 and SH-SY5Y cellular stress by applying H2O2 and corticosterone to these cells. HT-22 cells are mouse hippocampal neuronal cells, whereas SH-SY5Y are a human neuroblastoma cell line. These cells are good models to study neuronal processes, being used in the research of depression and other neuropsychiatric disorders, enabling the study of these diseases at a molecular/cellular level [3]. Indeed, several studies report the use of these cell lines in the study of molecular mechanisms involved in depression [26,27,28,29]. After applying H2O2 and corticosterone to these cells, we aimed to study the potential reversion/attenuation of these responses with the exposure of both cell lines to mirtazapine and L-tryptophan, focusing on cell morphology, cell viability, and ROS assays. In sum, our main findings evidence that both mirtazapine and L-tryptophan can counteract the harmful effects caused by H2O2 but not by corticosterone, revealing that these agents may have an important protective role in oxidative stress. This highlights the role of serotonergic pathways in the oxidative stress present in depression. Our study enables the investigation of depression at the cellular level, leading to the possibility to a future screening of compounds that may be used in the treatment of depression in the context of mechanisms, such as oxidative stress protection.

2. Materials and Methods

2.1. Materials

Dulbecco’s modified Eagle’s medium (DMEM; cat. no. FG0415) and fetal bovine serum (FBS; cat. no S0615) were obtained from Millipore Sigma (Merck KGaA, Darmstadt, Germany). Penicillin/streptomycin (cat. no. P4333), thiazolyl blue tetrazolium bromide (MTT; cat. no. M5655), neutral red solution (cat. no. N2889), corticosterone (cat. no. 27840), hydrogen peroxide (30%; Perhydrol™; cat. no. 1.07209), L-tryptophan (cat. no. T0254), and 2′,7′-dichlorofluorescin diacetate (DCFDA; cat. no. D6883) were purchased from Sigma-Aldrich (Merck KGaA, Darmstadt, Germany). Mirtazapine (cat. no. 19994) was obtained from Cayman Chemical Company (Ann Arbor, MI, USA).

2.2. Cell Culture

SH-SY5Y cell line was obtained from American Type Culture Collection, (Manassas VA, USA), whereas HT-22 cells were gently provided by Professor Ana Cristina Rego’s group (University of Coimbra, Coimbra, Portugal). Both cell lines were incubated at 37 °C (95% air, 5% CO2), and cultured in DMEM, supplemented with 10% FBS and 1% penicillin (1000 U/mL)/streptomycin (10 mg/mL). These are adherent cell lines, subcultured when confluences of 75–80% were obtained. Before each new assay, both cell lines were trypsinized (0.25% trypsin-EDTA), centrifuged (5 min., 800 and 1100 rpm for HT-22 and SH-SY5Y, respectively; Hettich, Tuttlingen, Germany), and seeded at a density of 1.0 × 10⁵ cells/mL (SH-SY5Y cells) and 1.5 × 10⁴ cells/mL (HT-22 cells) in 96-well plates (200 μL/well).

2.3. Cell Treatments

Mirtazapine and hydrogen peroxide were prepared as previously described [22]. Corticosterone and L-tryptophan were dissolved in DMSO (or methanol) and sterilized water, respectively (0.1% and 1% in cell culture medium, respectively). For corticosterone alone, the concentrations tested in the cells ranged between 100 µM and 500 µM and the vehicle was composed of 0.1% DMSO in cell culture medium. For L-tryptophan alone (0.1 nM–100 µM), the vehicle was composed of 1% sterilized water in culture medium. For L-tryptophan combinations with hydrogen peroxide and corticosterone, vehicles were composed of, respectively, 1% sterilized water and 0.1% methanol/1% sterilized water in cell culture medium. Finally, for the mirtazapine/corticosterone combinations, vehicles were composed of 0.2% DMSO in cell culture medium. All the treatments were tested for a period of 48 h after the cell attachment. For the DCFDA assay, all the treatments were also tested after 1 h, 3 h, 6 h, and 24 h of contact with the cells.

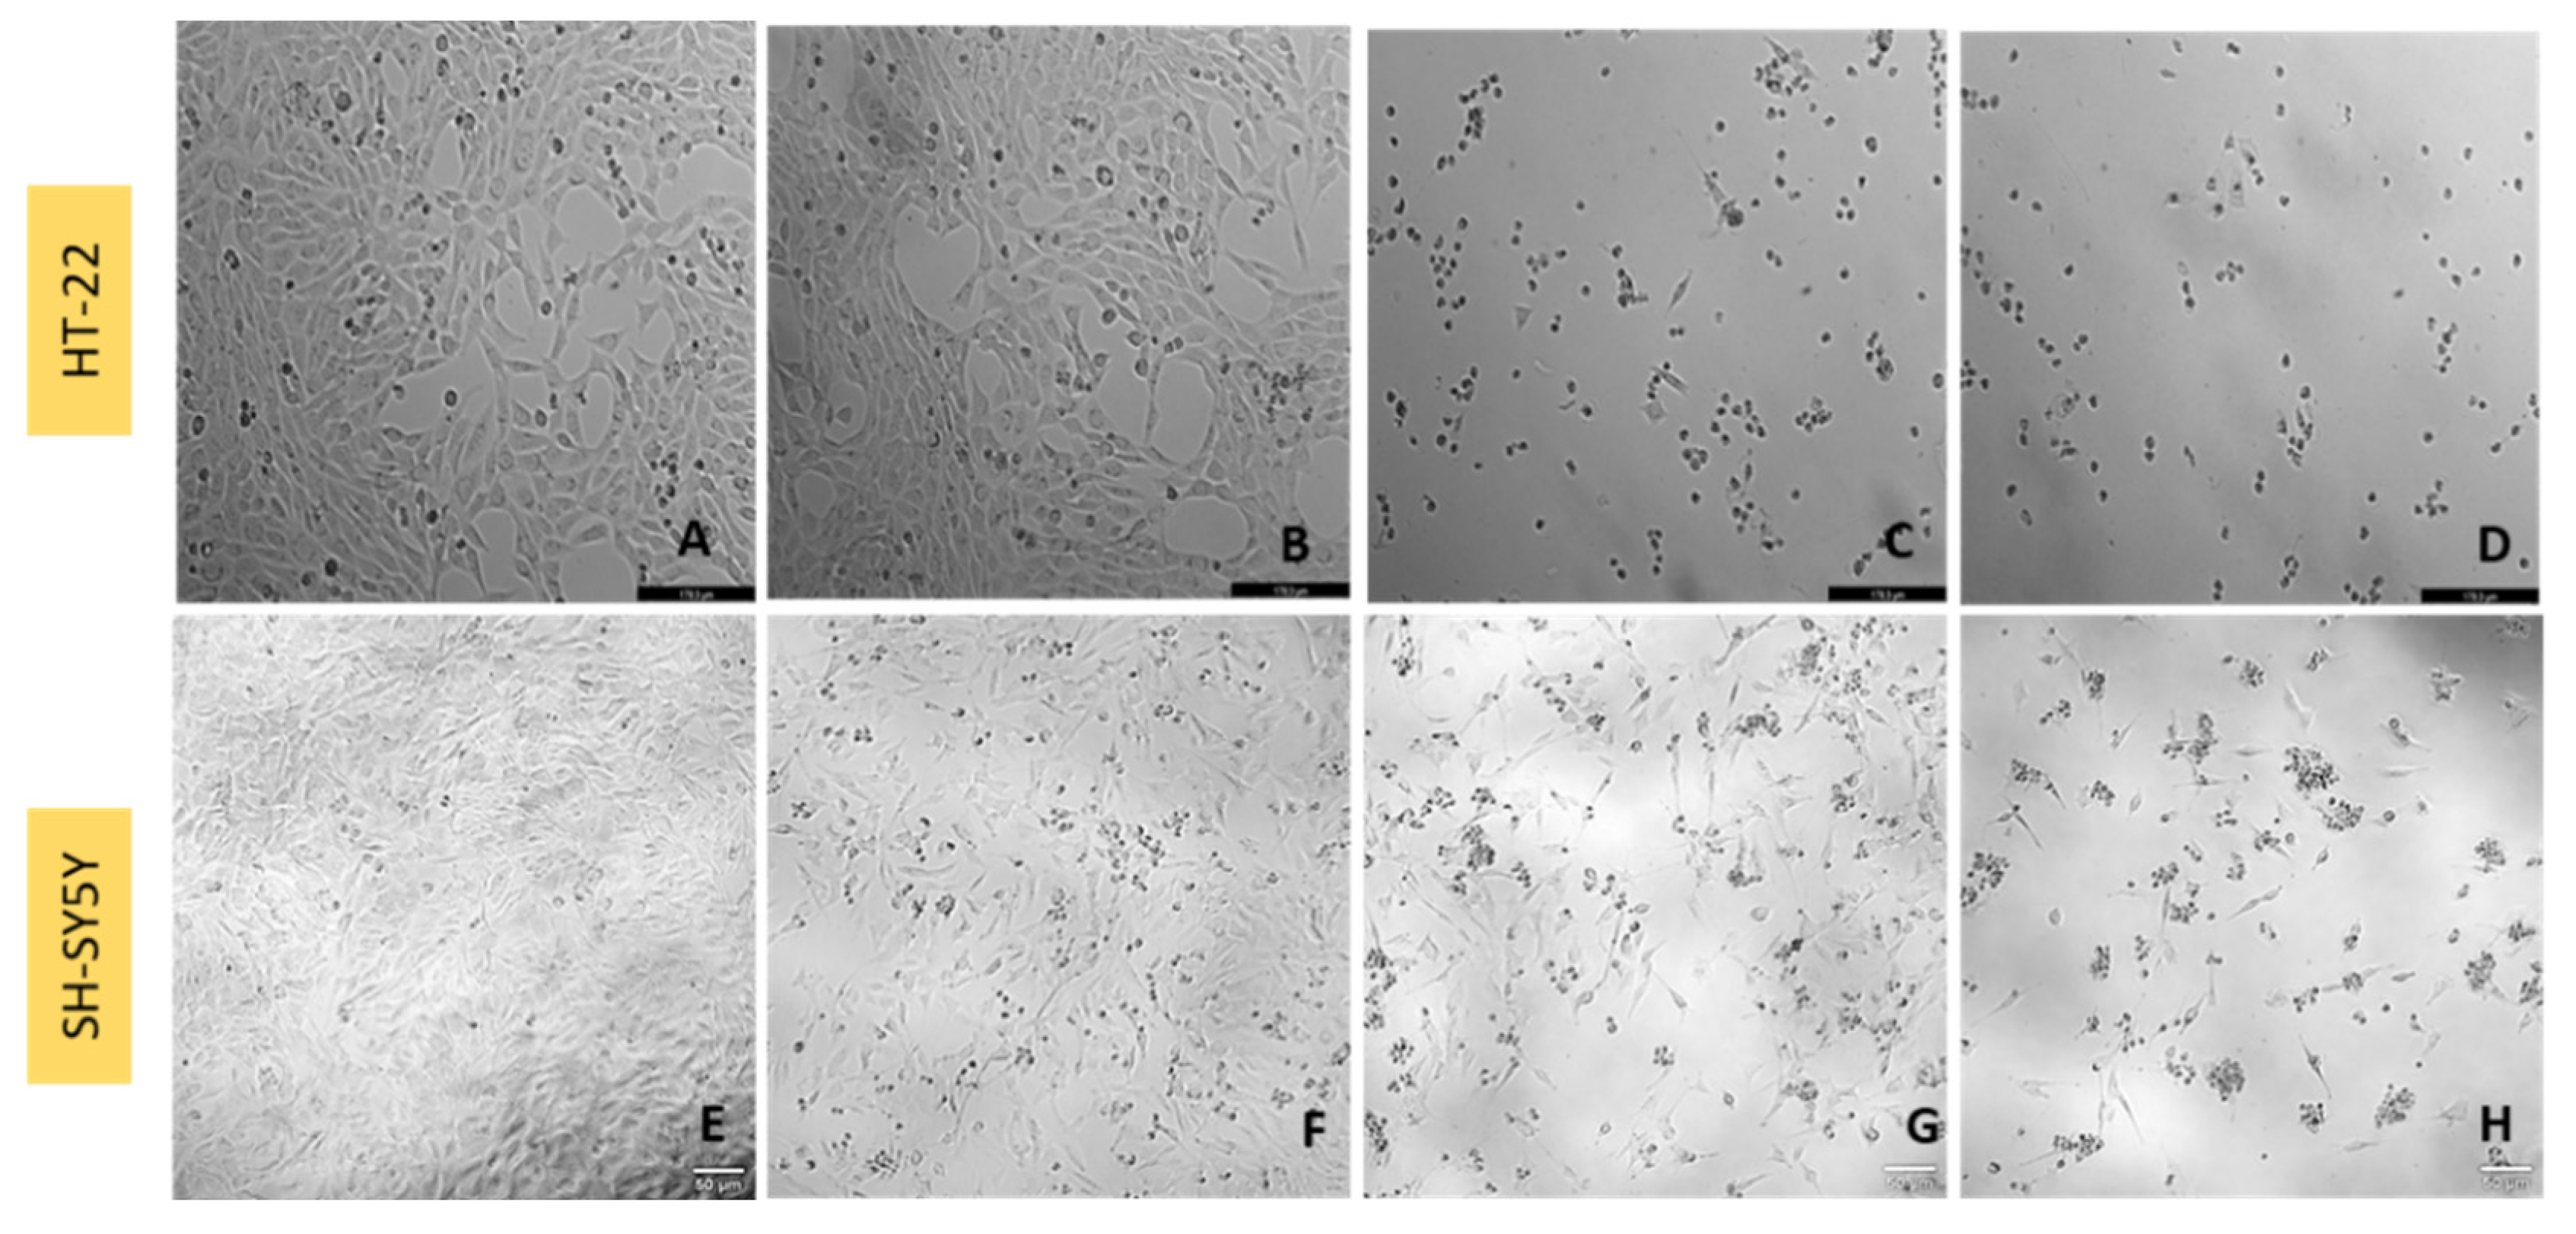
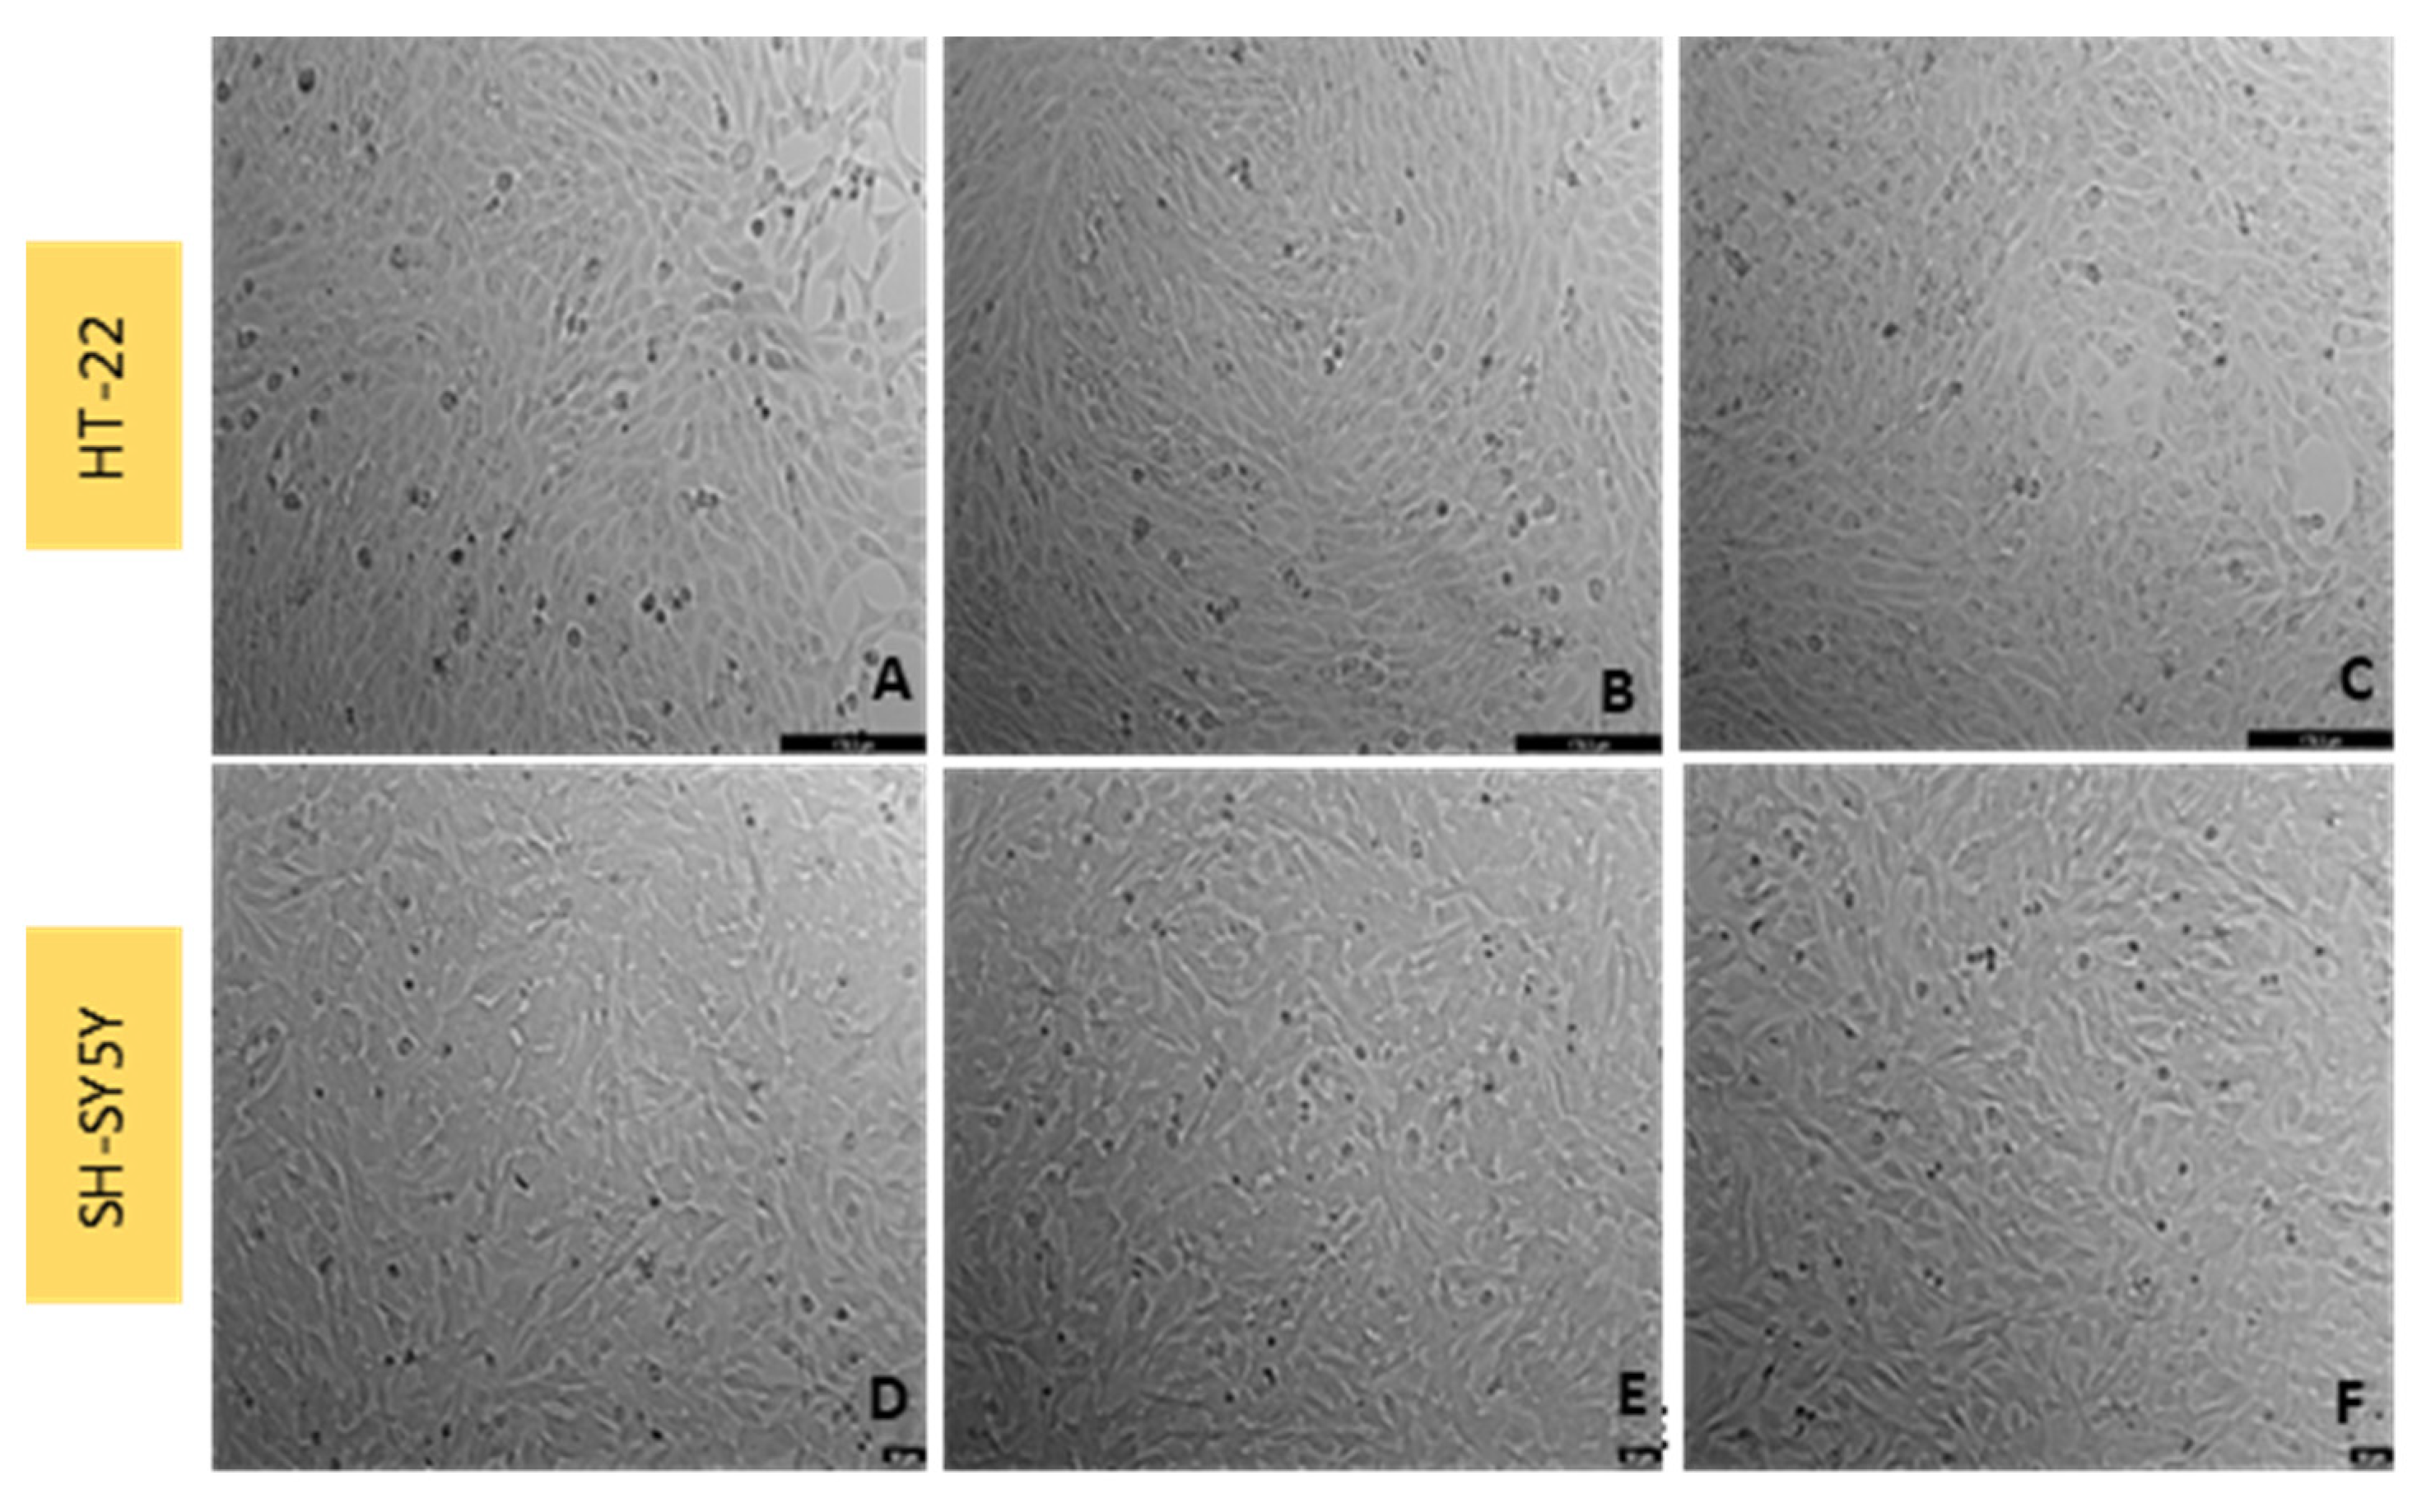
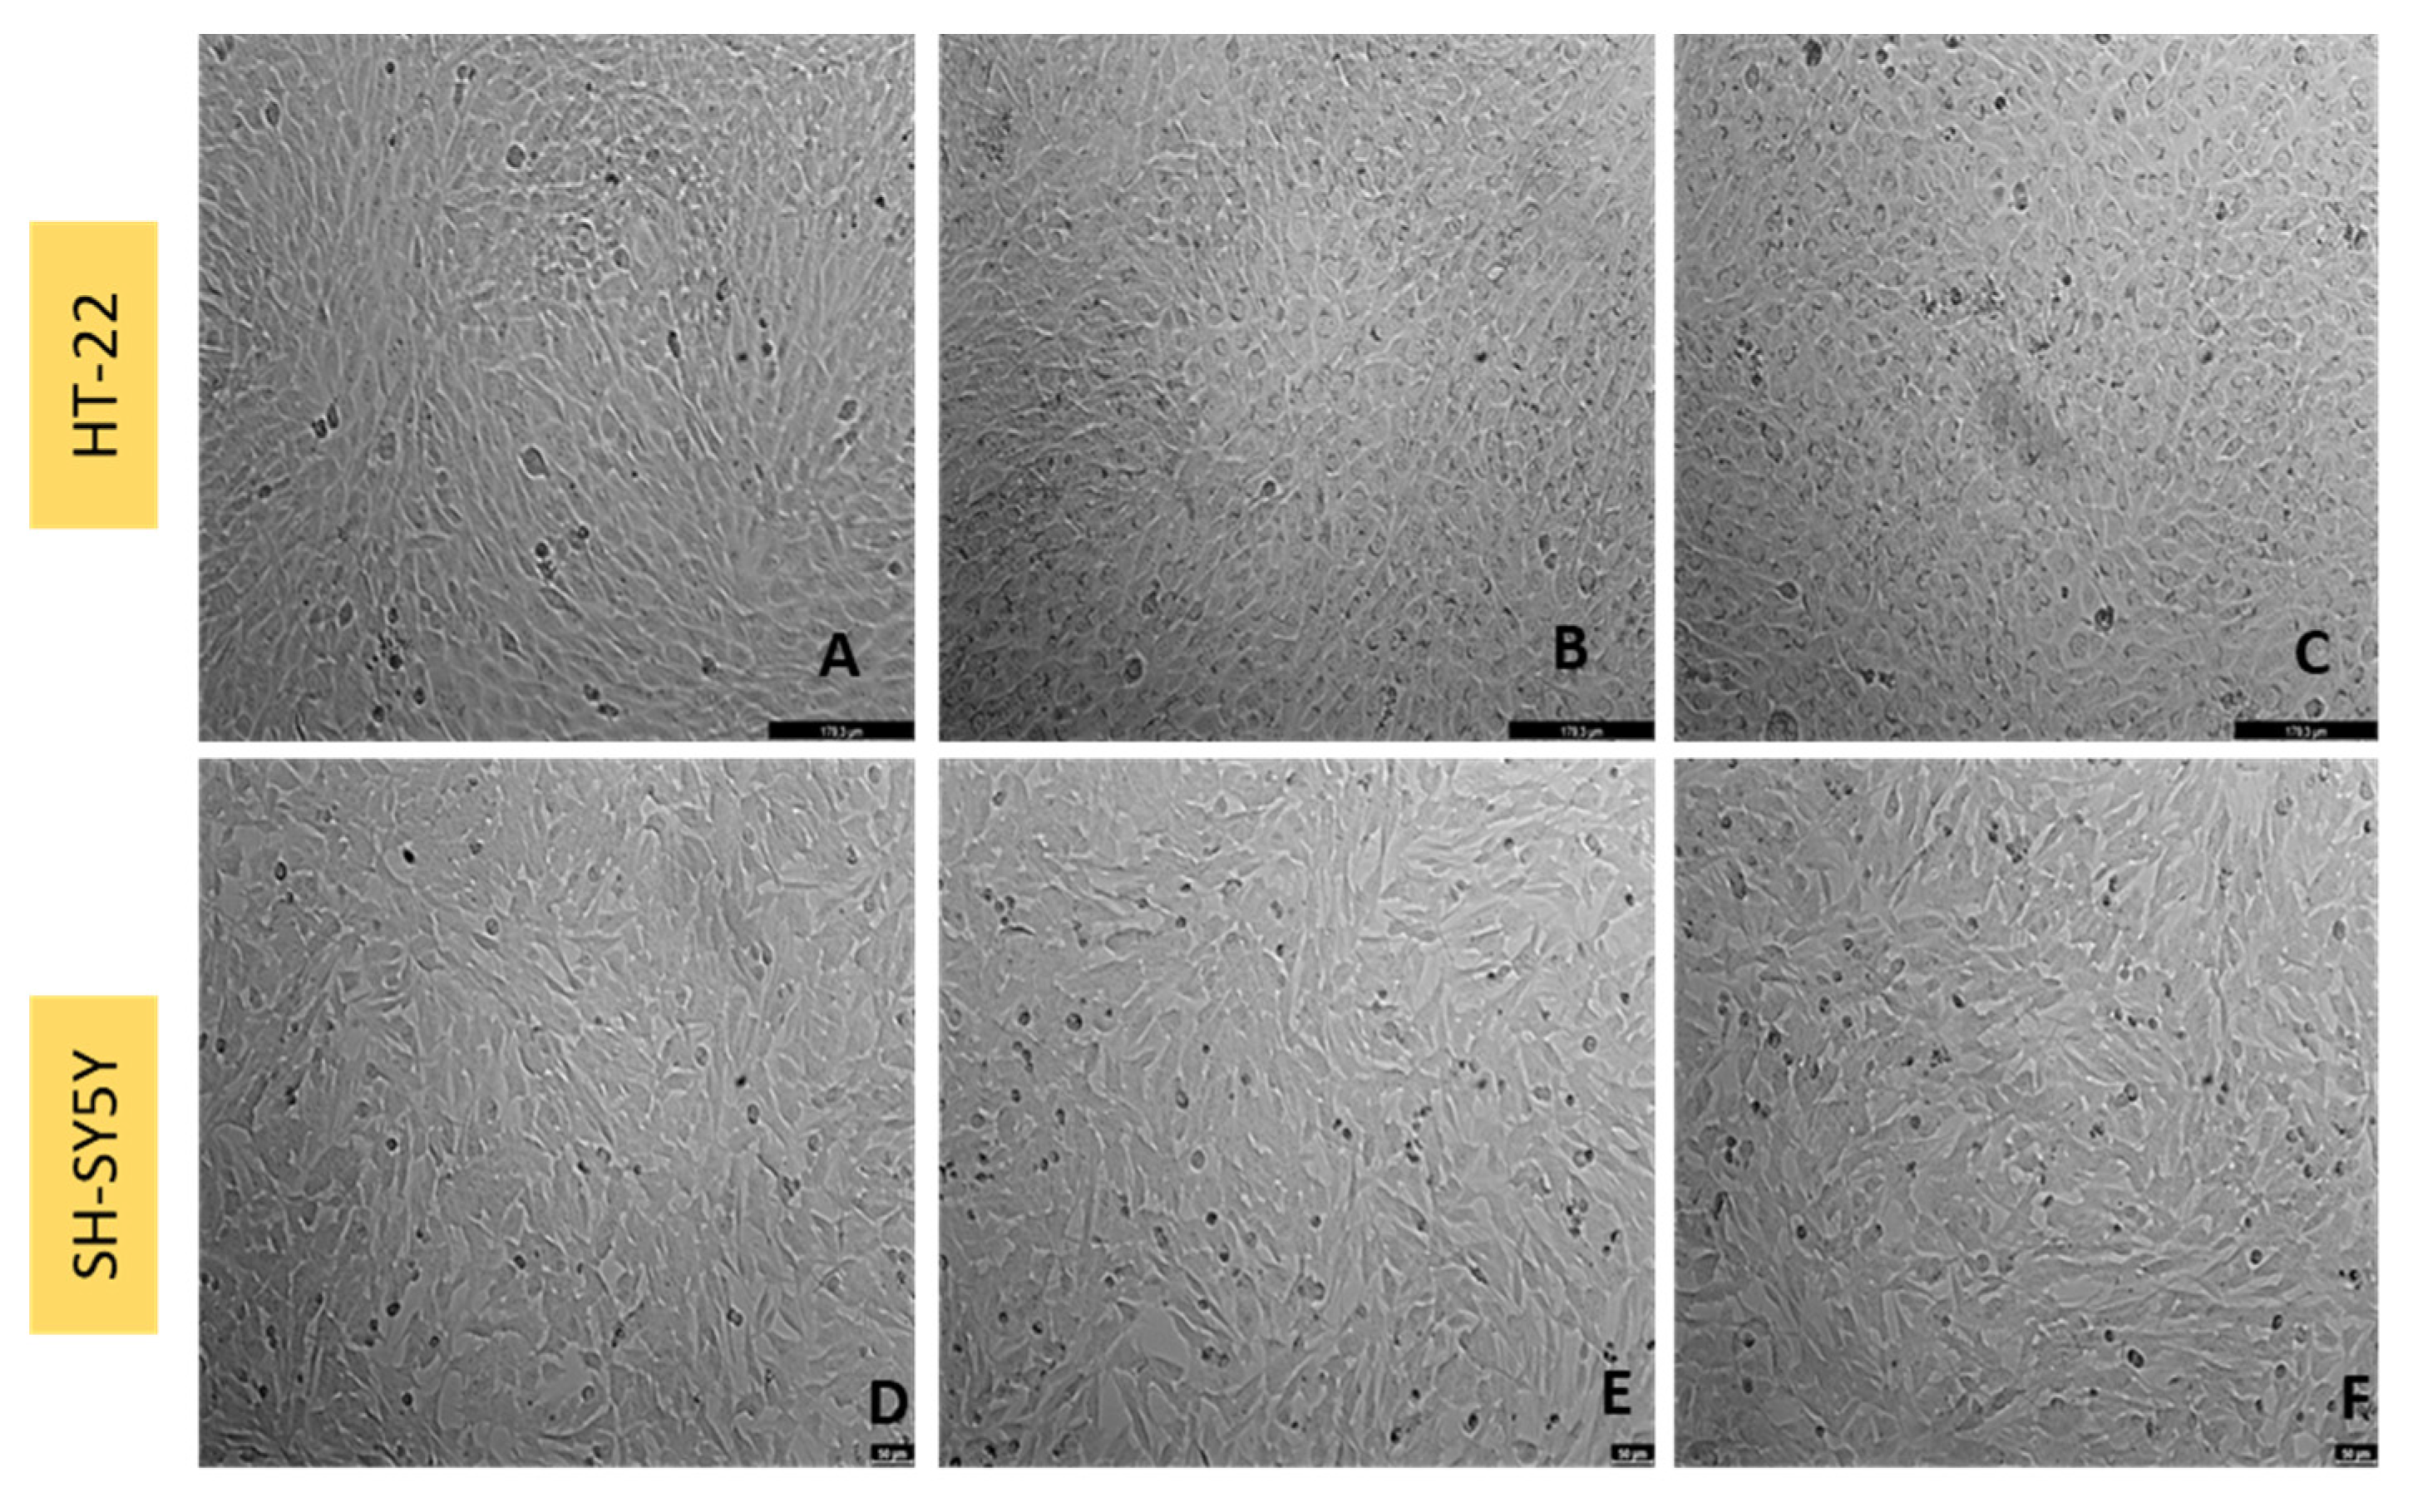
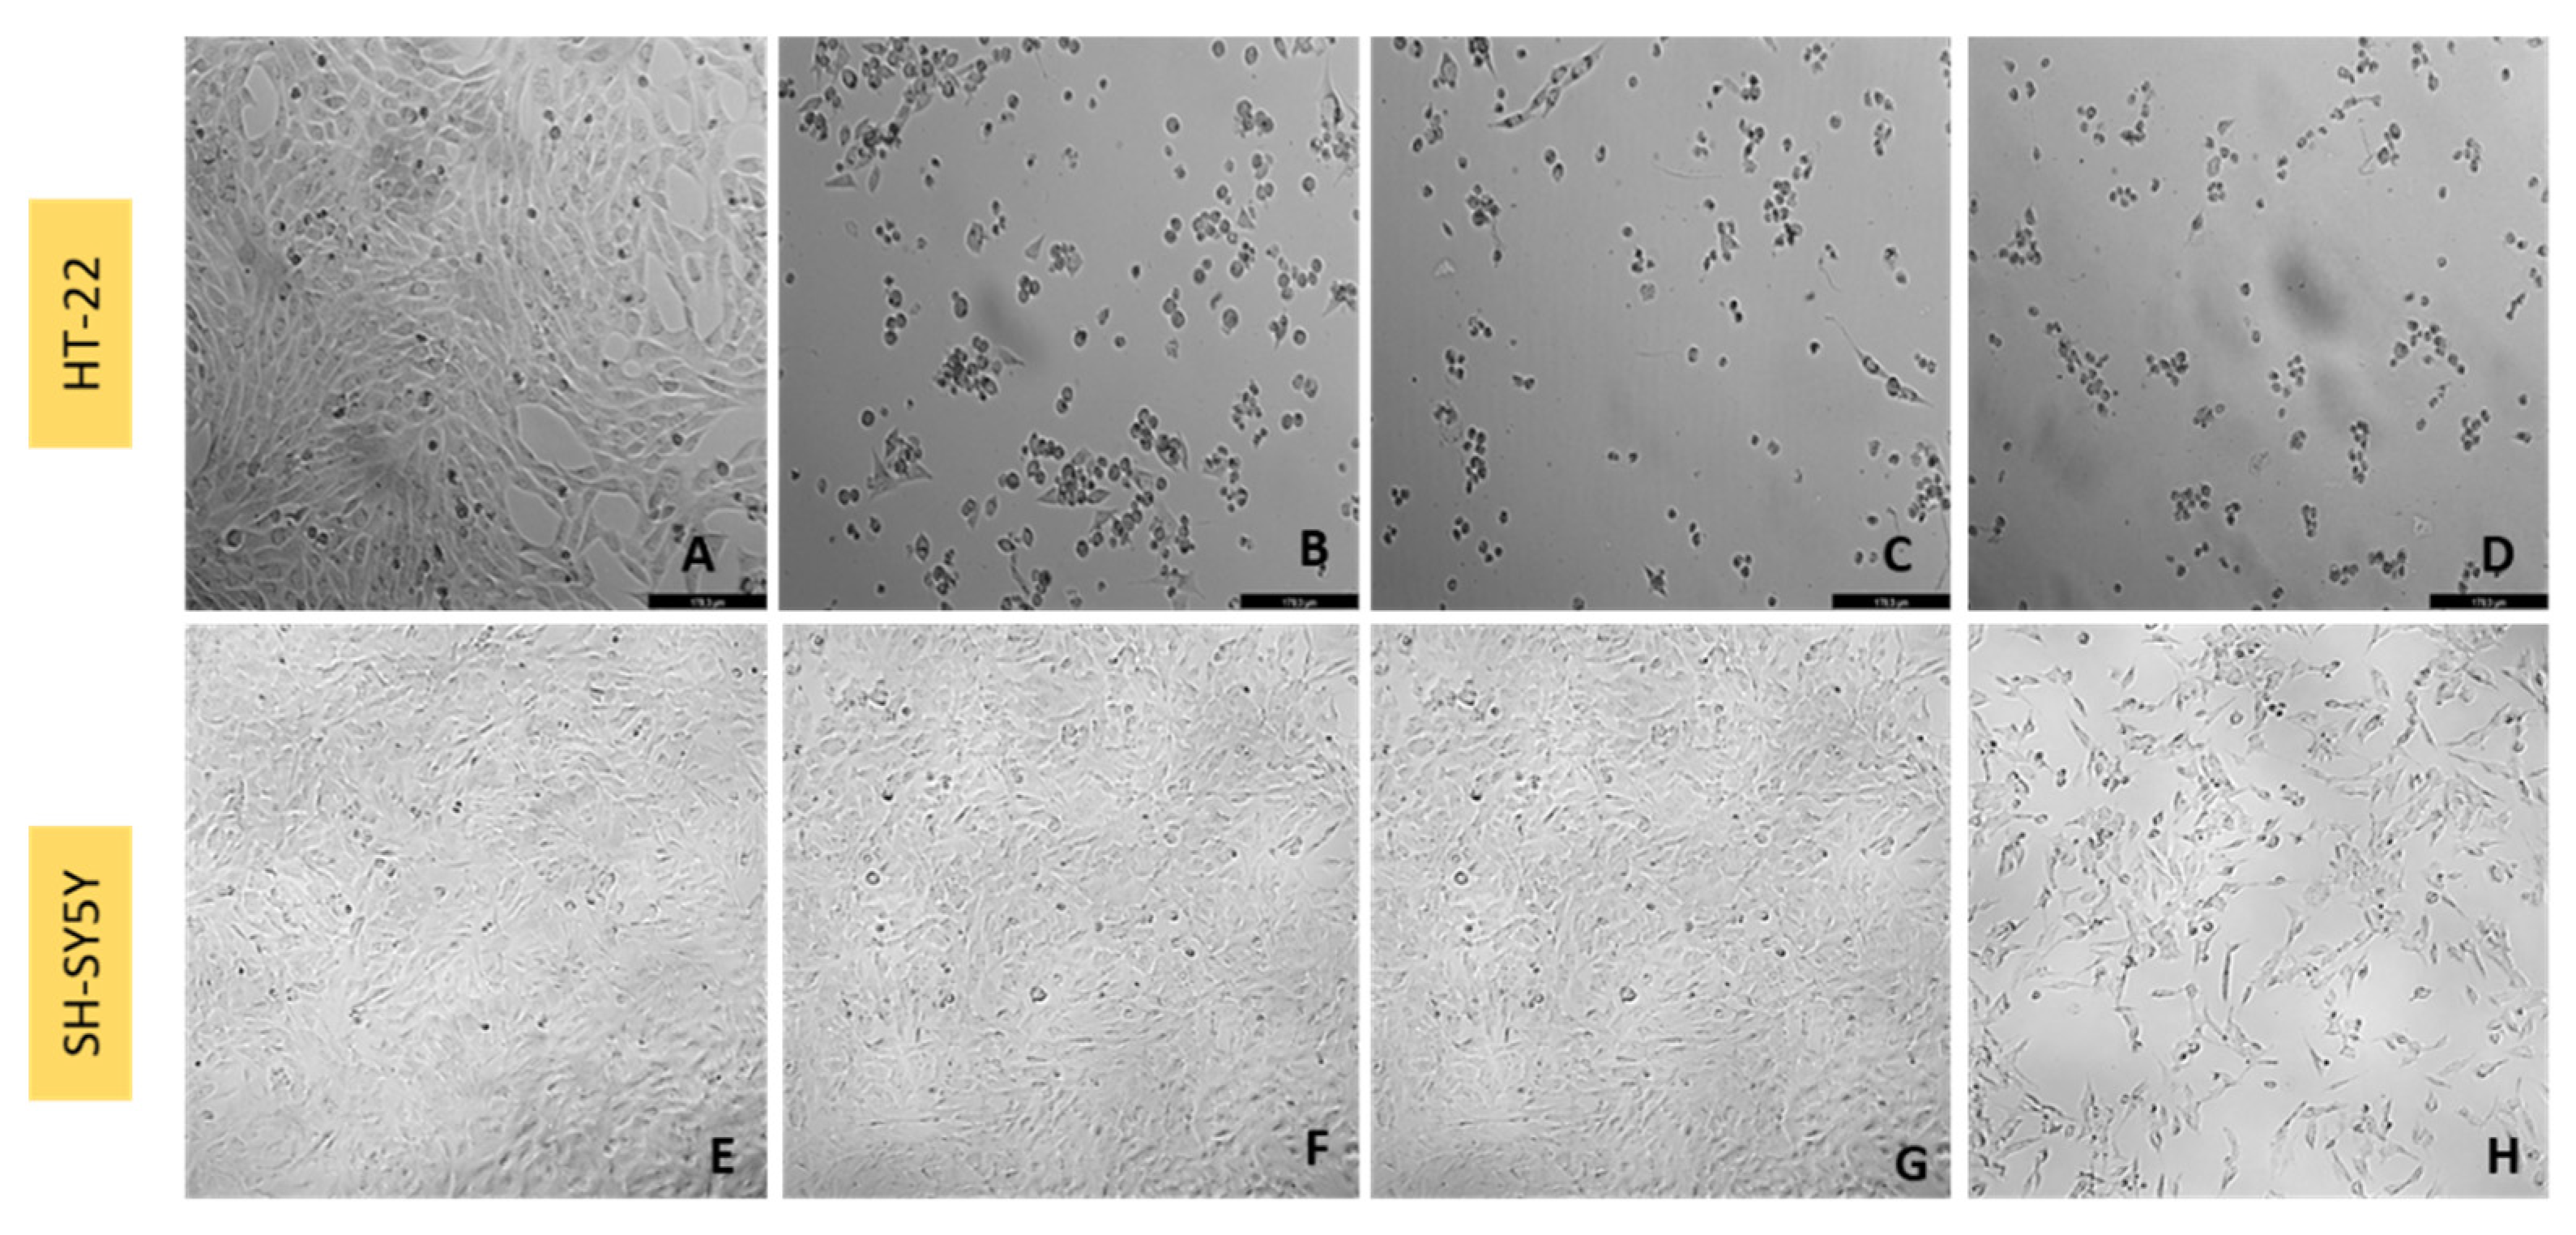
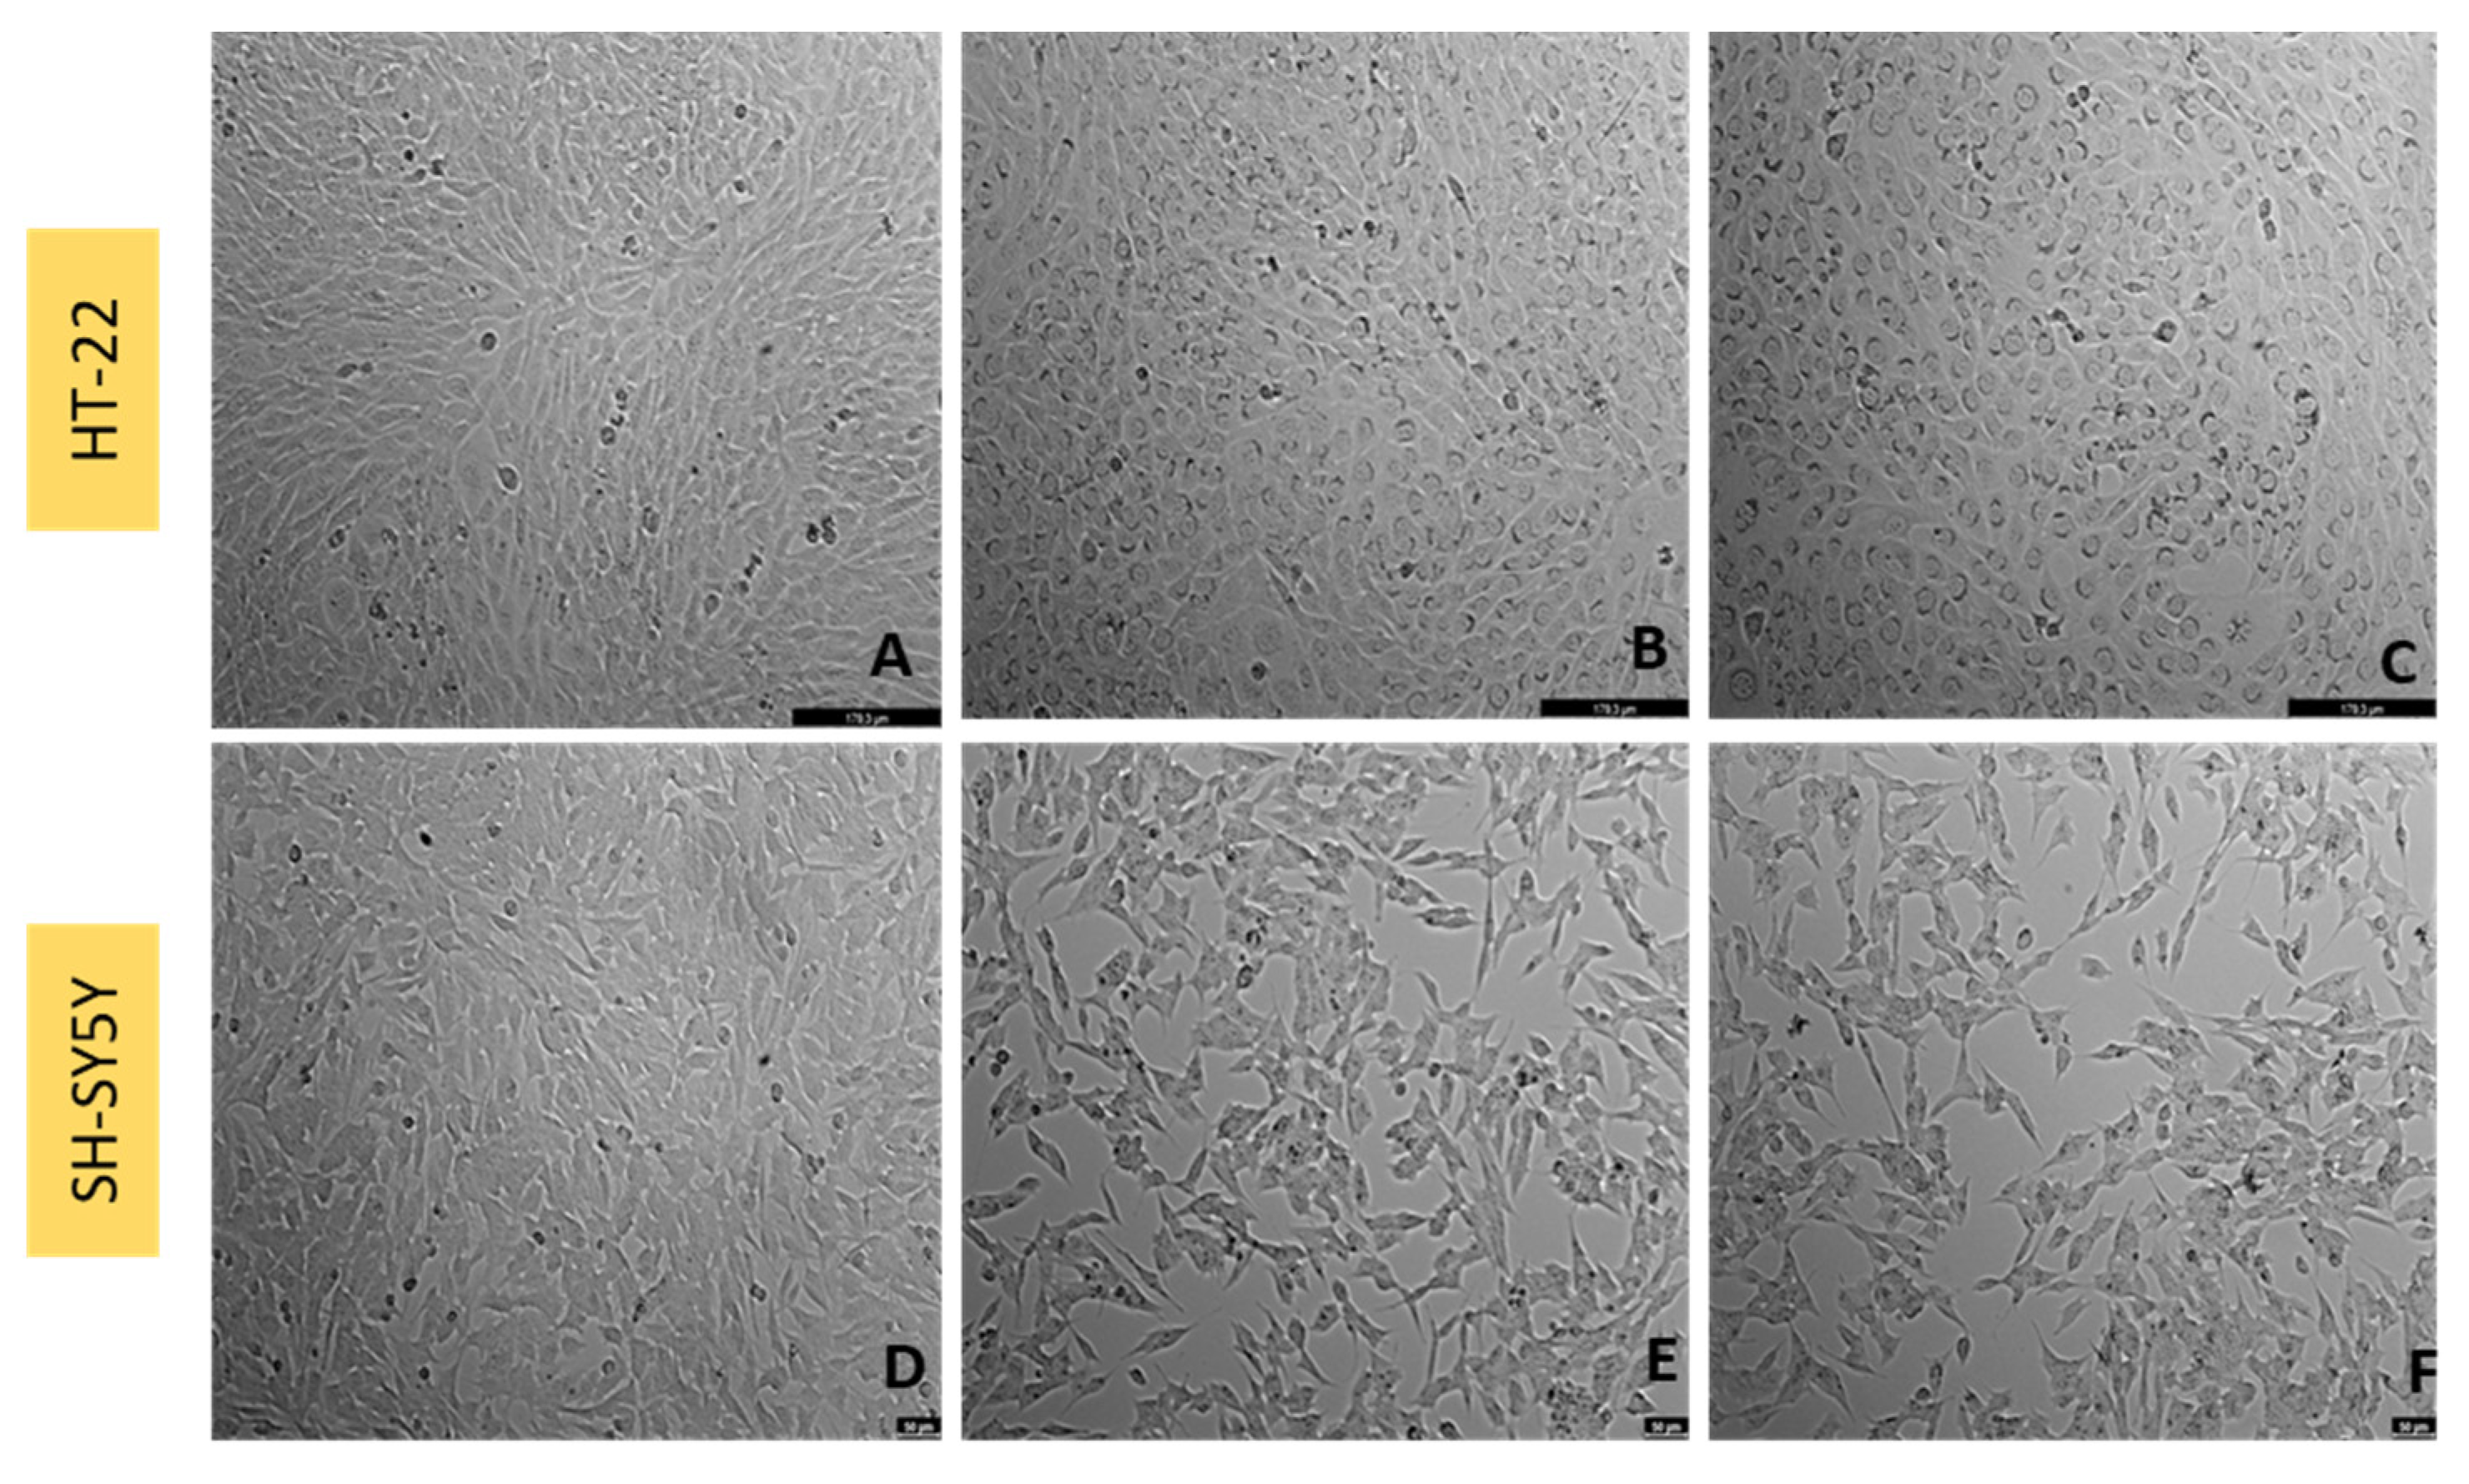
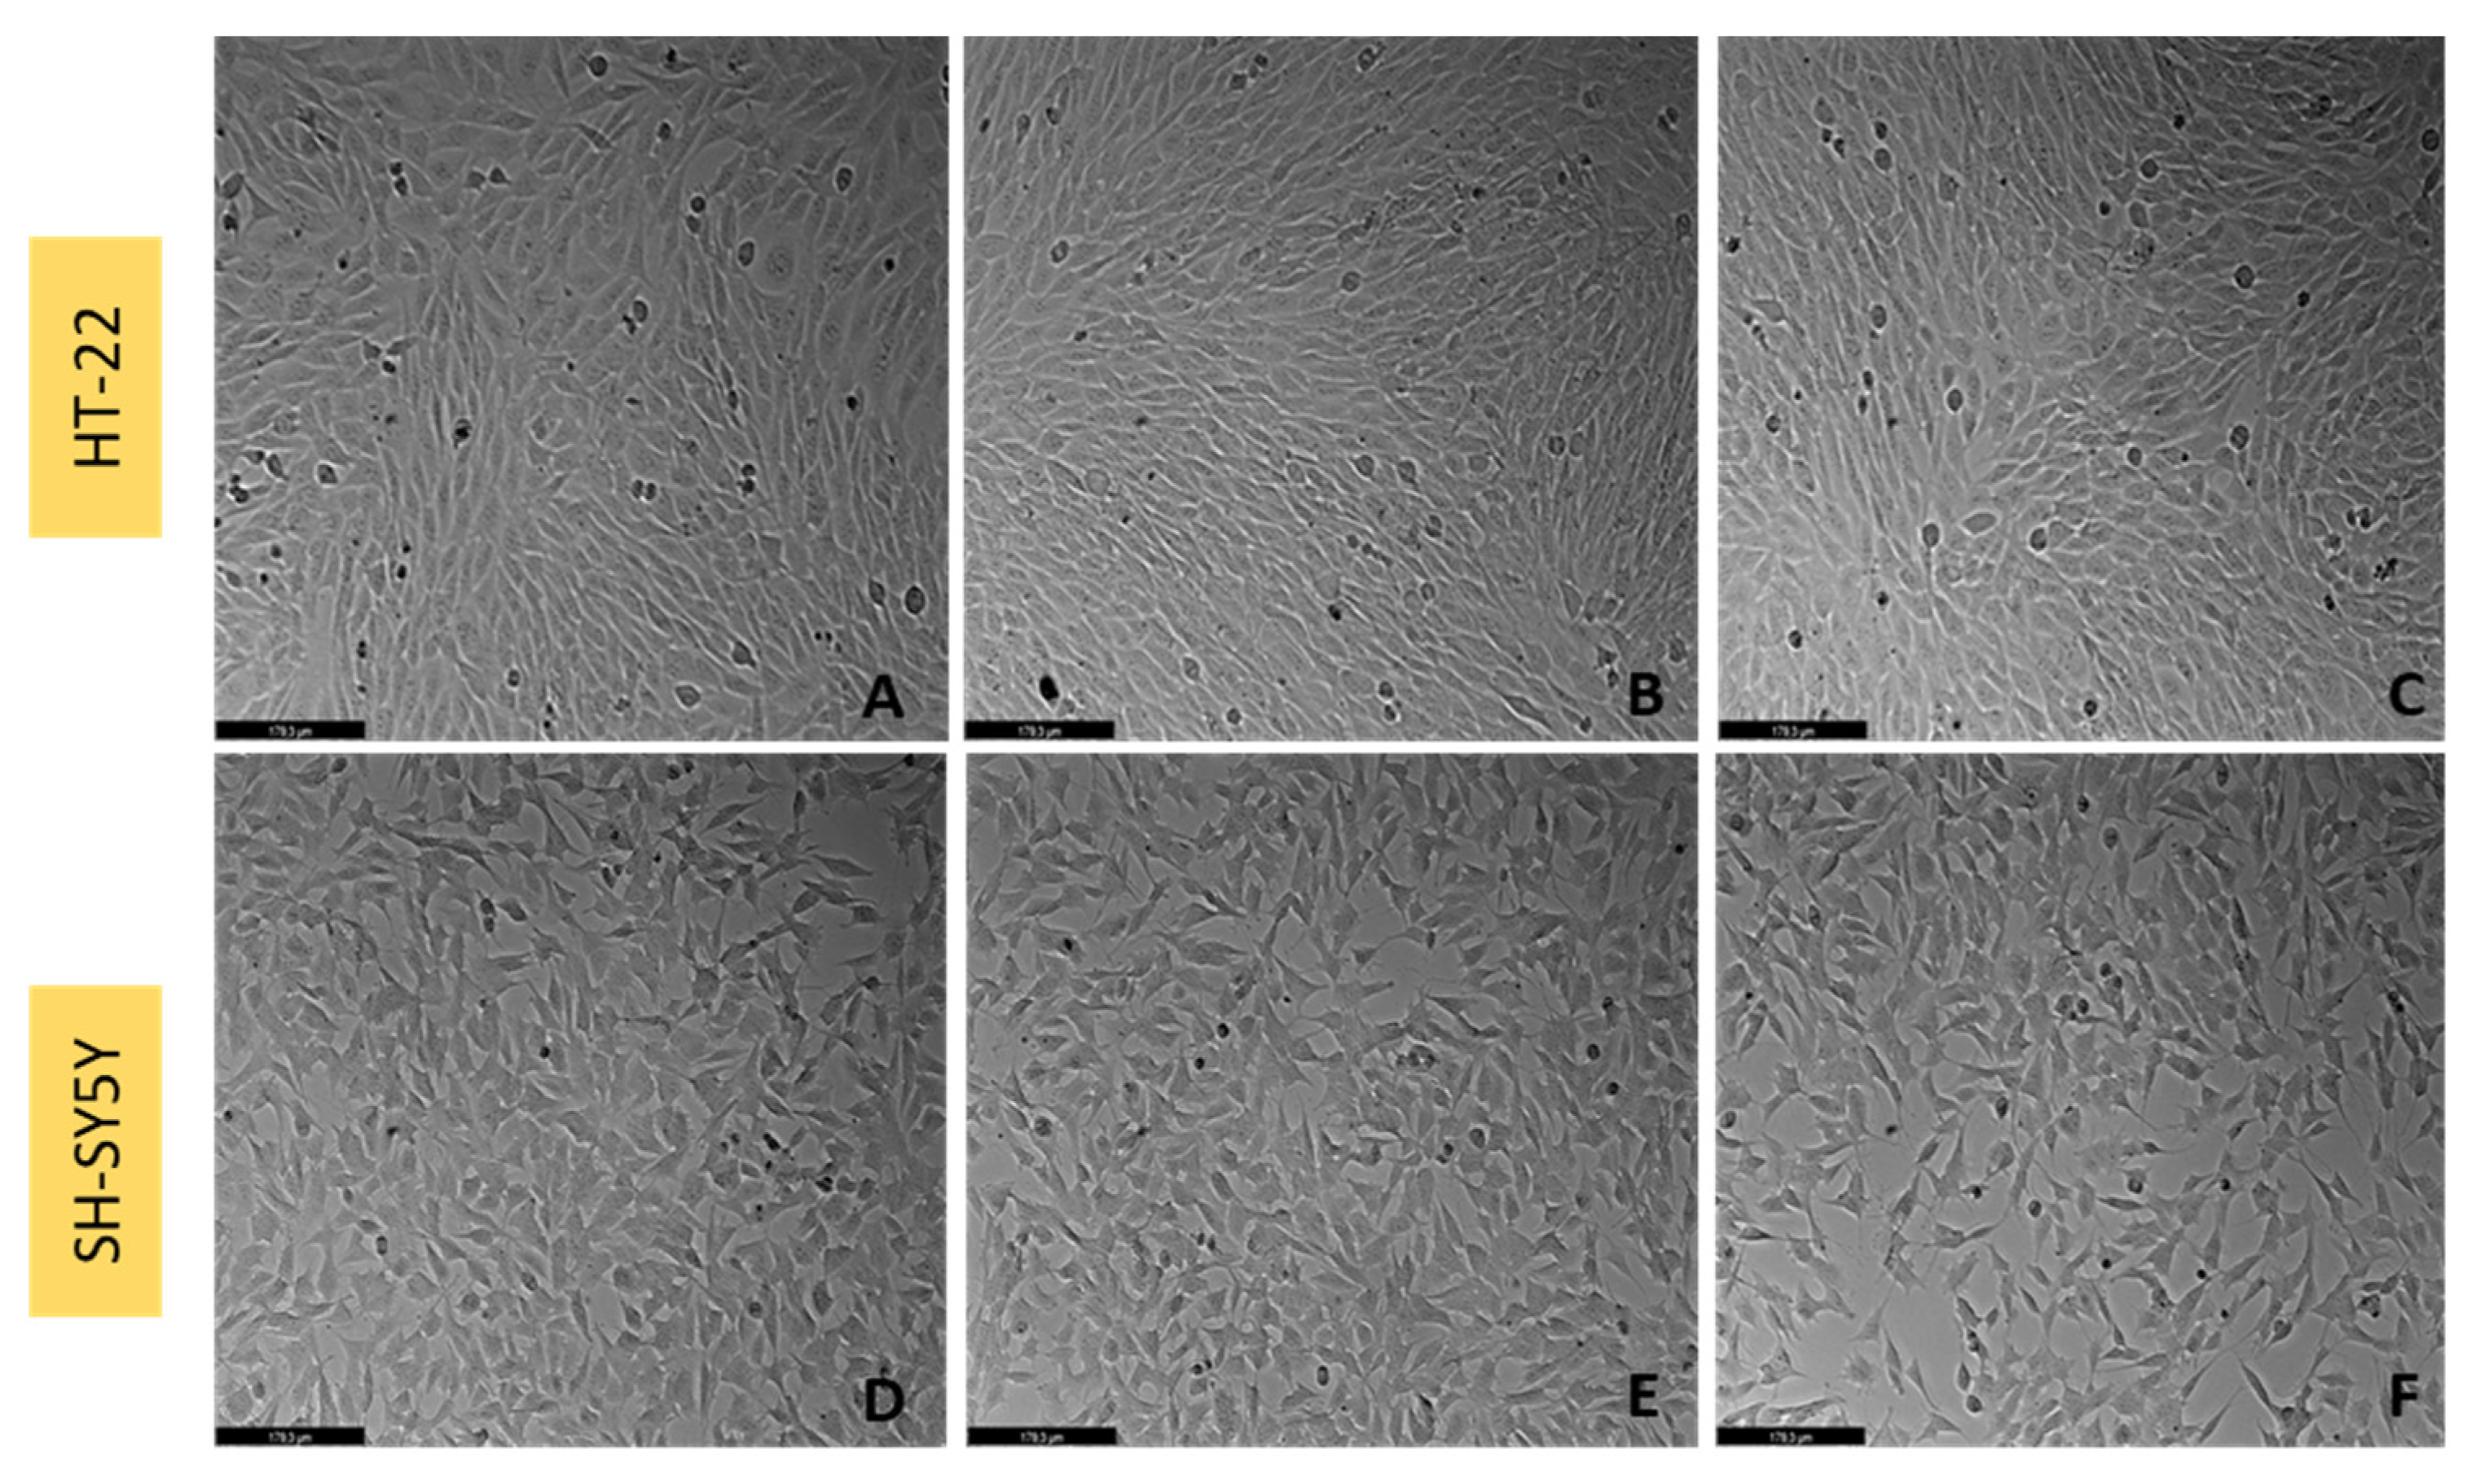
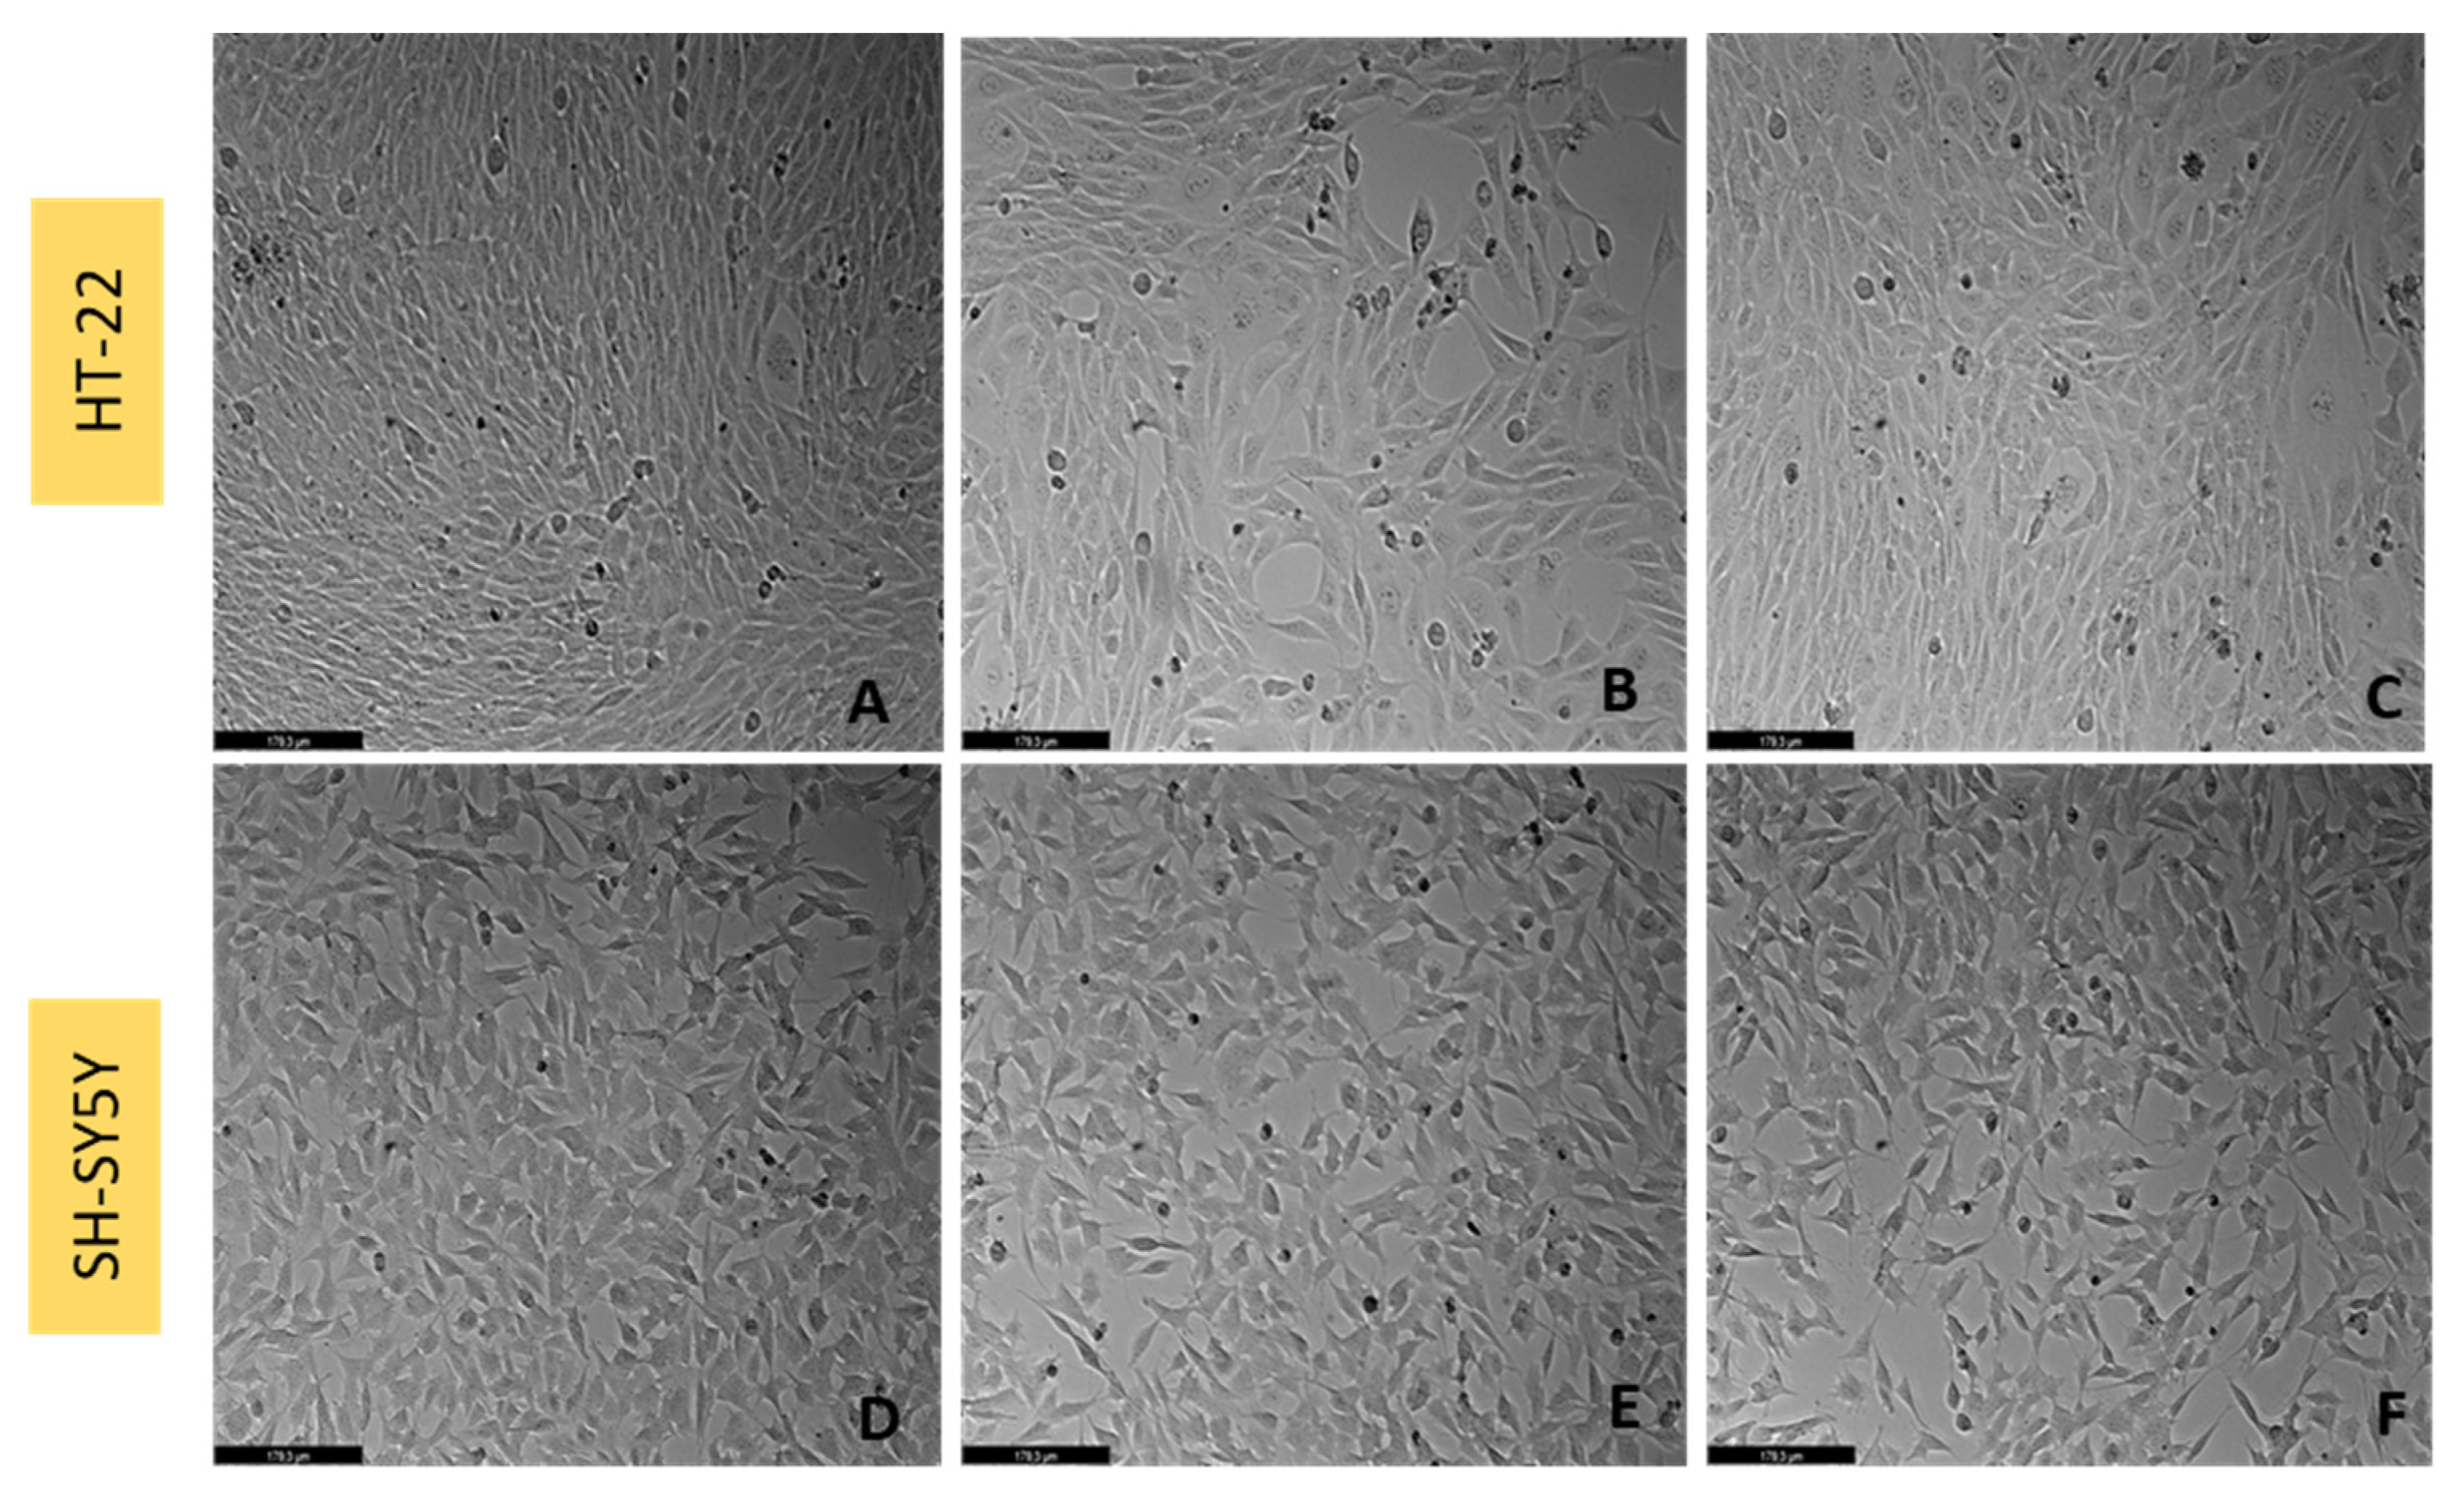
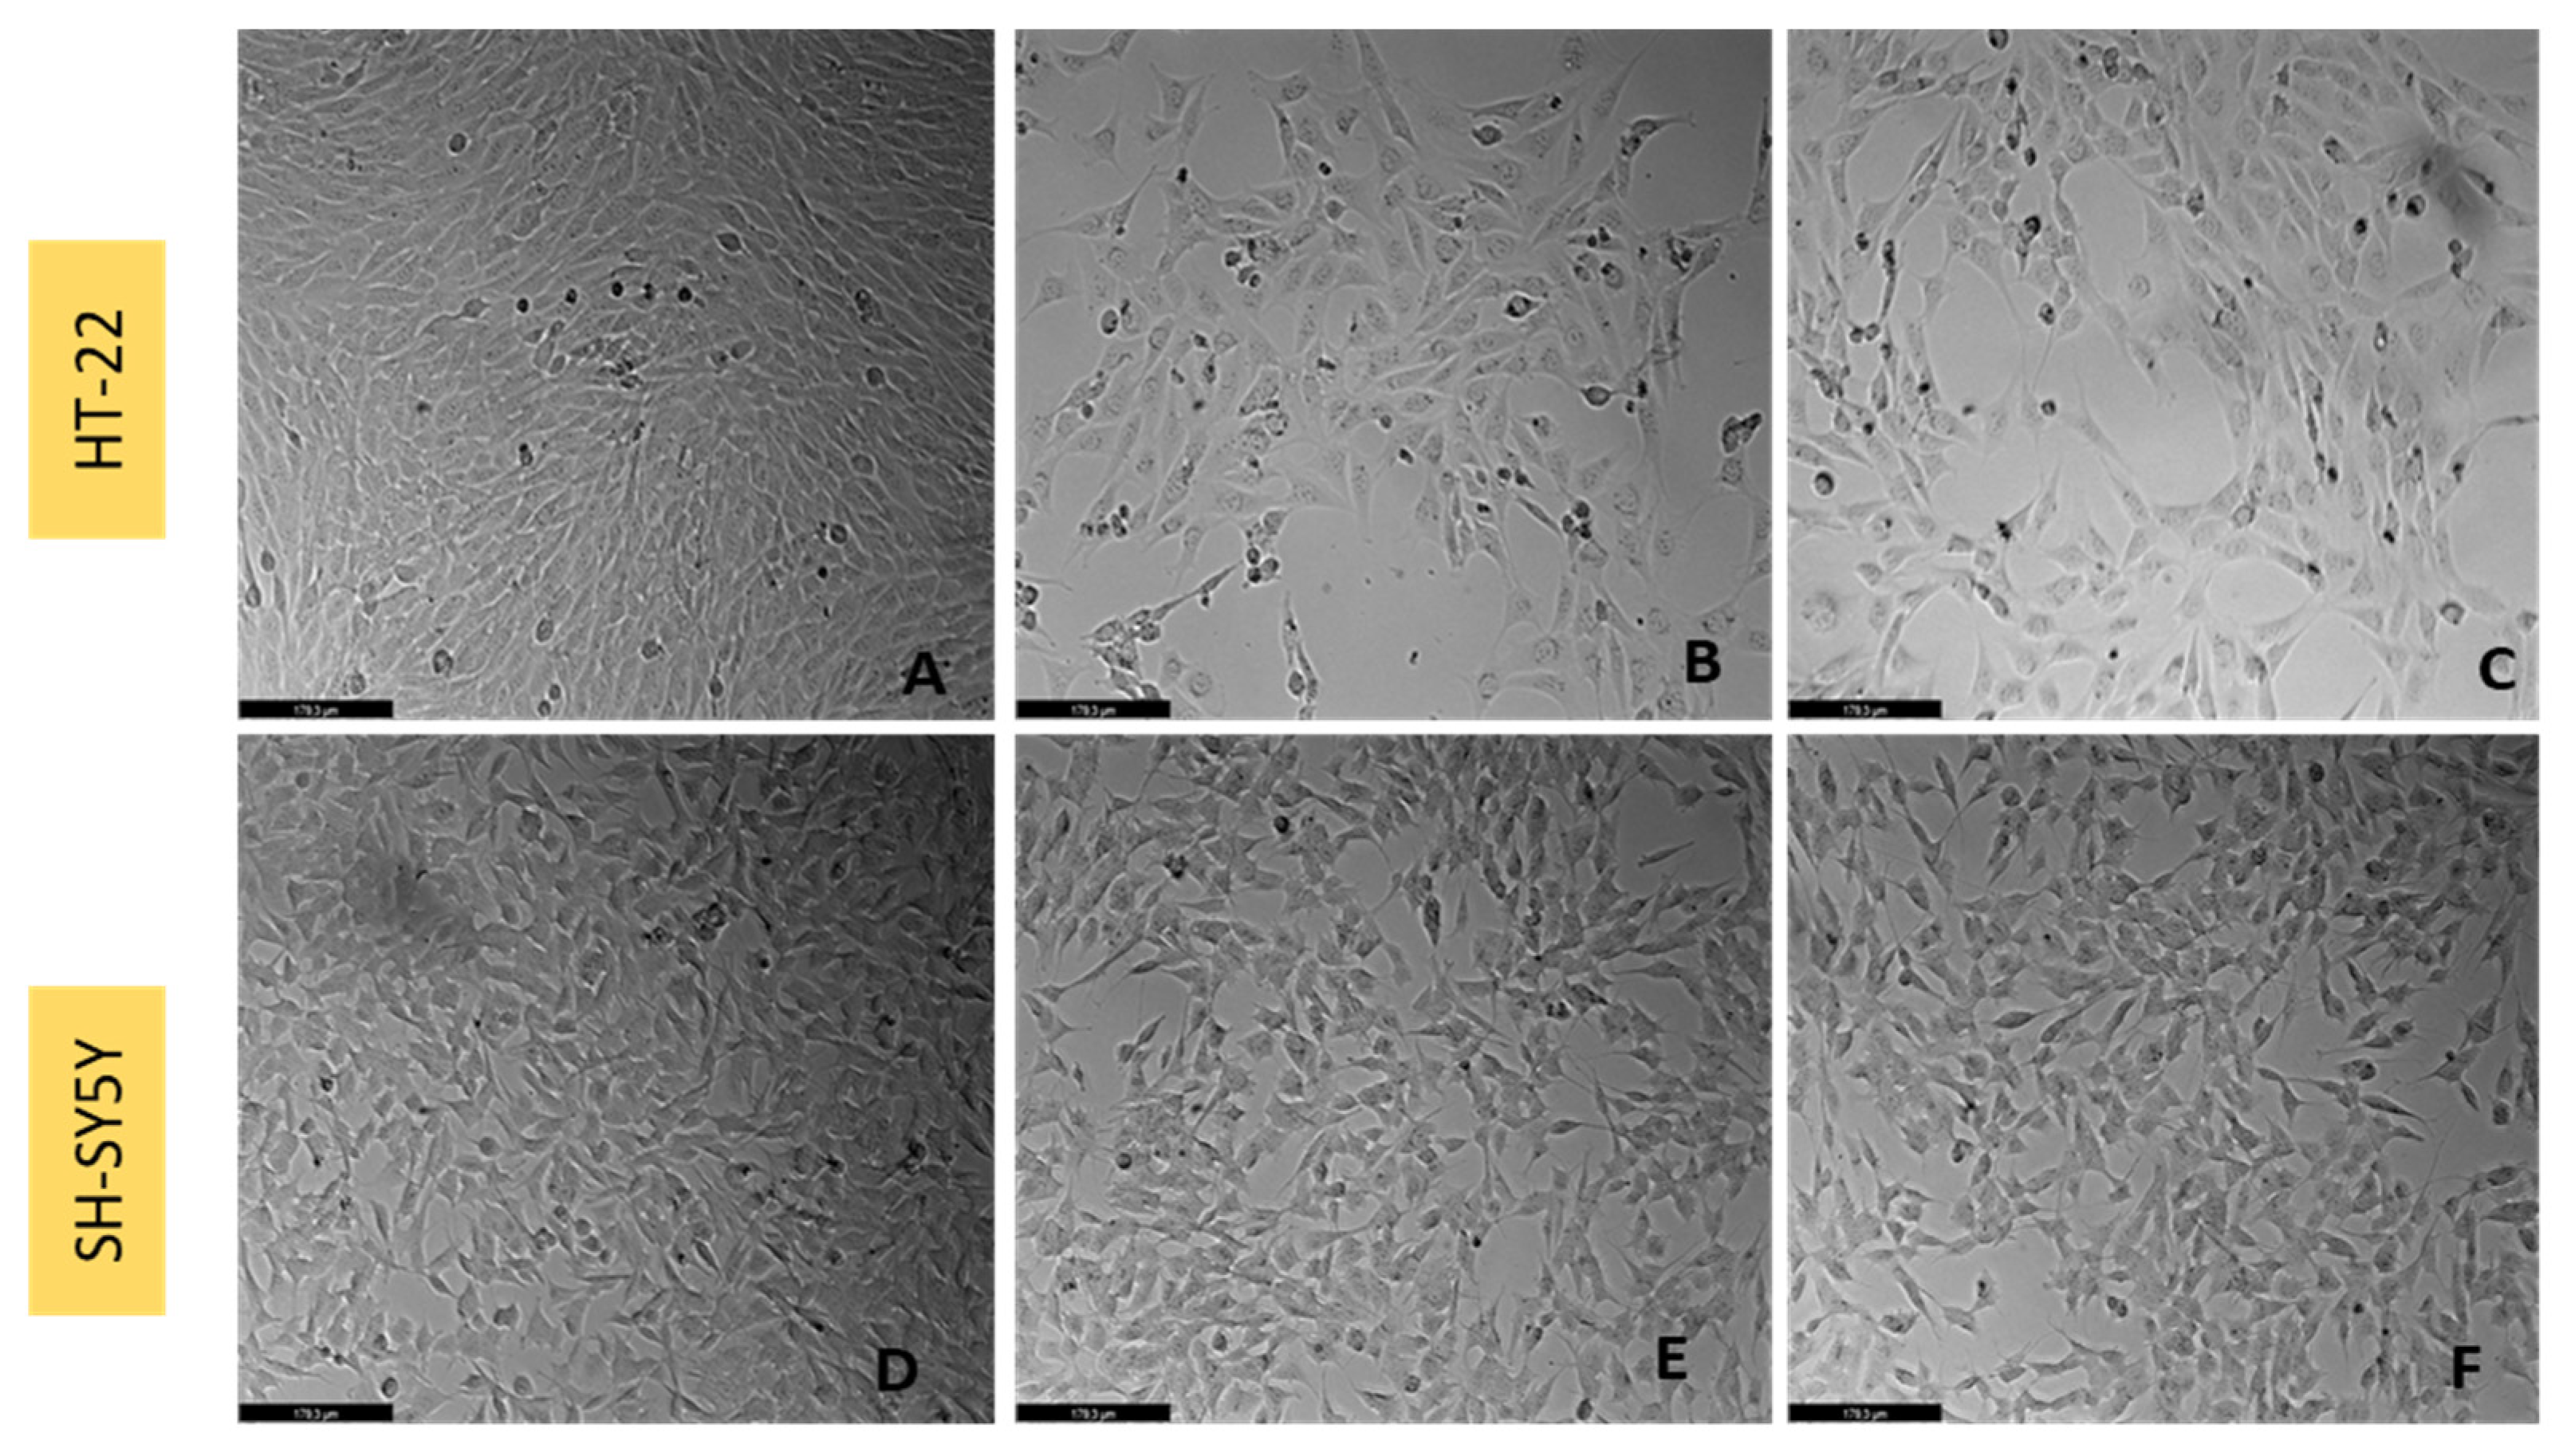
2.4. Cell Morphology Visualization

Leica DMI6000 B Automated Microscope (Leica, Wetzlar, Germany) was used to observe and capture images of SH-SY5Y and HT-22 cells after all the treatment conditions (48 h), previously to cell viability assays.

2.5. MTT and Neutral Red Assays

Cellular viability after exposure to the different treatments (48 h) was evaluated by performing MTT and neutral red (NR) assays. Briefly, these two assays evaluate cell viability, using a different approach. Indeed, MTT assay measures the metabolic activity of the cells through the enzymatic conversion of the tetrazolium to formazan crystals by dehydrogenases present mainly in the mitochondria. On the other hand, NR accumulates in the lysosomes of viable cells, but not in the non-viable cells. Thus, these two assays evaluate different organelles (mitochondria and lysosomes). For the MTT assay, after discarding the culture medium, MTT (0.5 mg/mL in PBS; 100 μL/well) was added to the cells, following a period of 3 h of incubation (37 °C). Then, MTT was discarded and 100 µL of DMSO was added to each well. Lastly, 570 nm absorbance values were extracted from the automated microplate reader (Tecan Infinite M200, Zurich, Switzerland). For the NR assay, after discarding the culture medium, NR medium (1:100 in DMEM; 100 µL/well) was added to the cells, following a period of 3 h of incubation (37 °C). After that, the cells were washed in PBS (150 µL/well), and 150 µL of NR destain solution (50% of 96% ethanol, 49% deionized water and 1% glacial acetic acid) was added to each cell well. Finally, absorbance values (540 nm) were obtained in the automated microplate reader described above.

2.6. DCFDA Assay

Intracellular oxidative activity was evaluated by DCFDA assay. After cell adhesion (24 h), cells were incubated with 100 µL/well of 100 µM DCFDA, dissolved in PBS for 30 min before exposure to the drugs. At the end of the incubation period, the supernatant was rejected, and the cells were incubated with the test compounds for 1 h, 3 h, 6 h, 24 h, and 48 h at 37 °C. Finally, the fluorescence was obtained using a fluorescence plate reader (SpectraMax Gemini EM Microplate Reader, Molecular Devices, San Jose, CA, USA), 485 nm excitation and 530 nm emission.

2.7. Statistical and Data Analyses

The results were expressed as mean ± SEM of, at 2–6 independent experiments. Statistical analyses between each vehicle and treatments (for each time) were carried out with two-away ANOVA (for DCFDA assays) or one-away ANOVA (for cell viability assays), followed by Dunnett’s multiple comparisons test. The differences were statistically significant when p < 0.05. Statistical analyses, graphical construction, and calculations of IC50 values were carried out using software GraphPad Prism 8 (San Diego, CA, USA).

3. Results

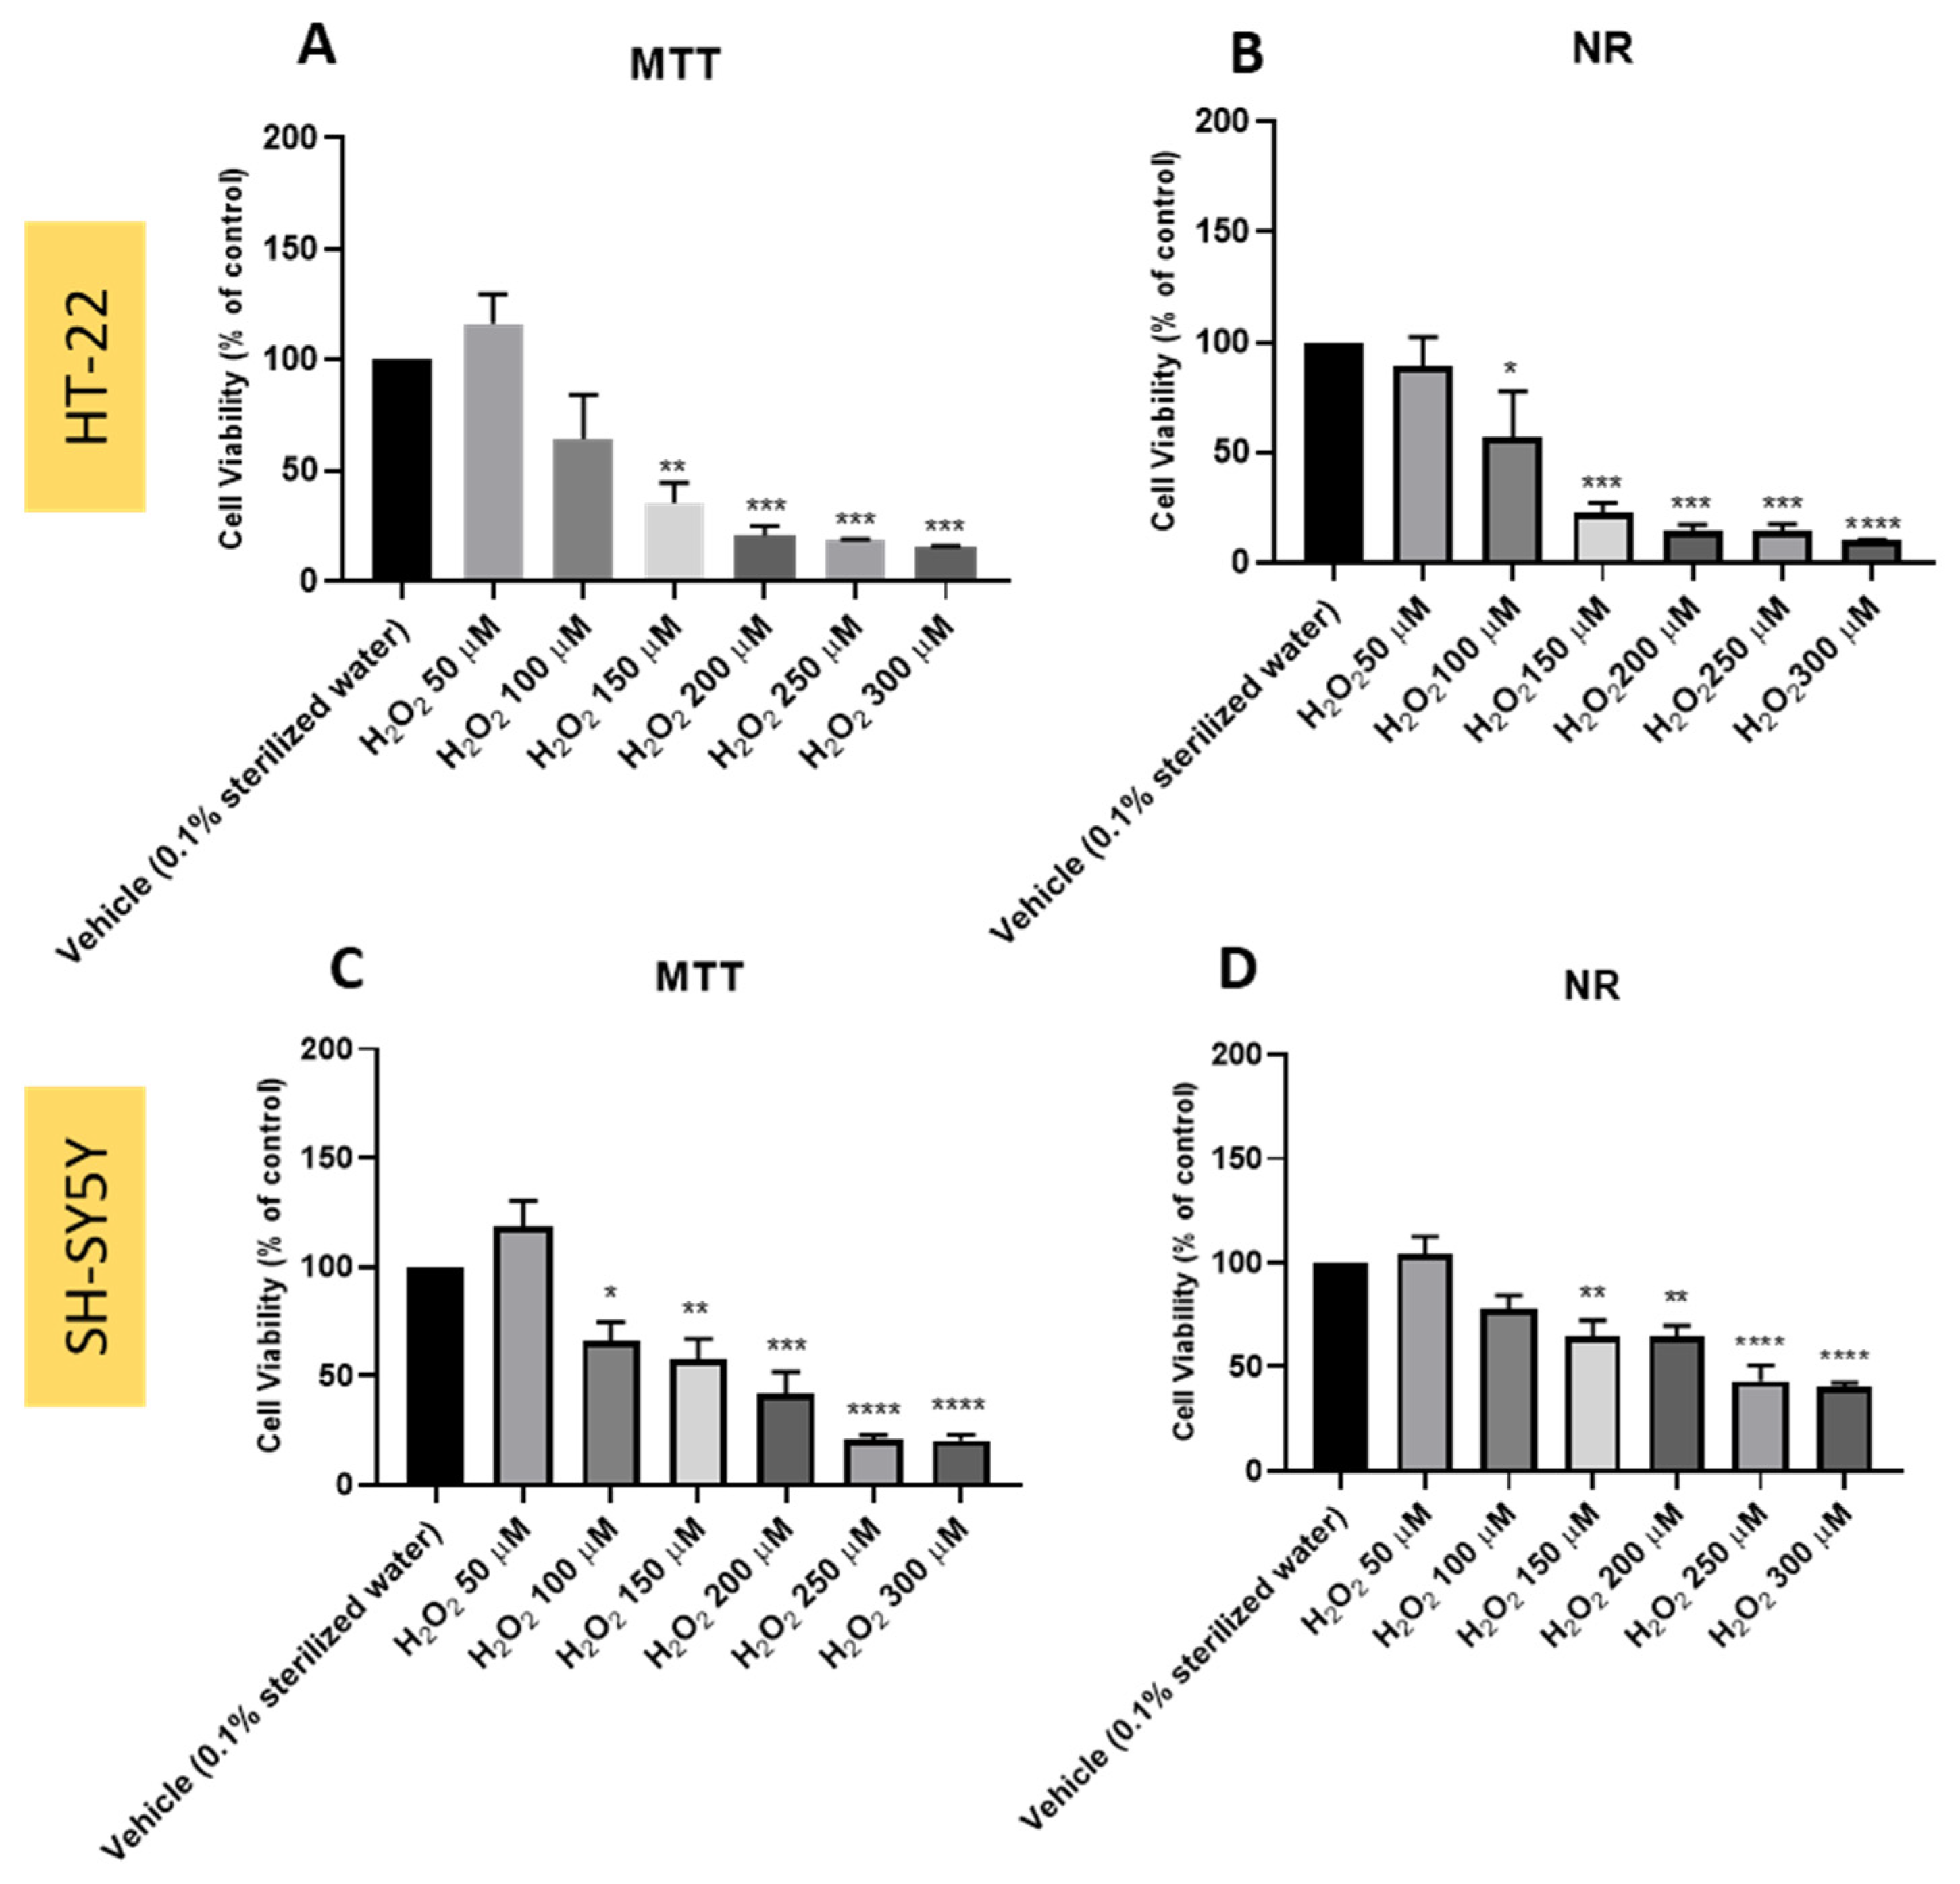
3.1. Effect of Hydrogen Peroxide on SH-SY5Y and HT-22 Cellular Viability

To evaluate the effect of H2O2 as a cellular stressor on the HT-22 cell line, this compound was added to these cells in concentrations ranging from 50–300 μM, for a period of 48 h. After that, cell viability values were obtained using MTT (Figure 1A) and NR assay (Figure 1B), as described in the Section 2. Morphological changes in the cells were also captured (Figure 2A–D). Additionally, the concentration-response curves (Figure S1) and half-maximal inhibitory concentrations (IC50) values were determined. In our previous work, we also evaluated the effect of H2O2 on the viability of SH-SY5Y neuroblastoma cells, obtaining a half-maximal inhibitory concentration (IC50) value of 132 μM [22] (Figure 1C,D and Figure S1), as well as morphological changes on SH-SY5Y after exposure to crescent concentrations of H2O2 (Figure 2E–H).
Proceeding to the analysis of the results, it is possible to conclude that H2O2 decreased both HT-22 and SH-SY5Y cellular viability, in a concentration-dependent manner, as evidenced in both MTT, NR, and morphology assays (Figure 1, Figure 2 and Figure S1). For SH-SY5Y, we previously obtained an IC50 value of 132 μM [22] and for HT-22 cells, we obtained IC50 values of 111 μM (MTT assay) and 98 μM (NR assay) (Figure S1). Taken together, these results support the stress effect of H2O2 on both cell lines.

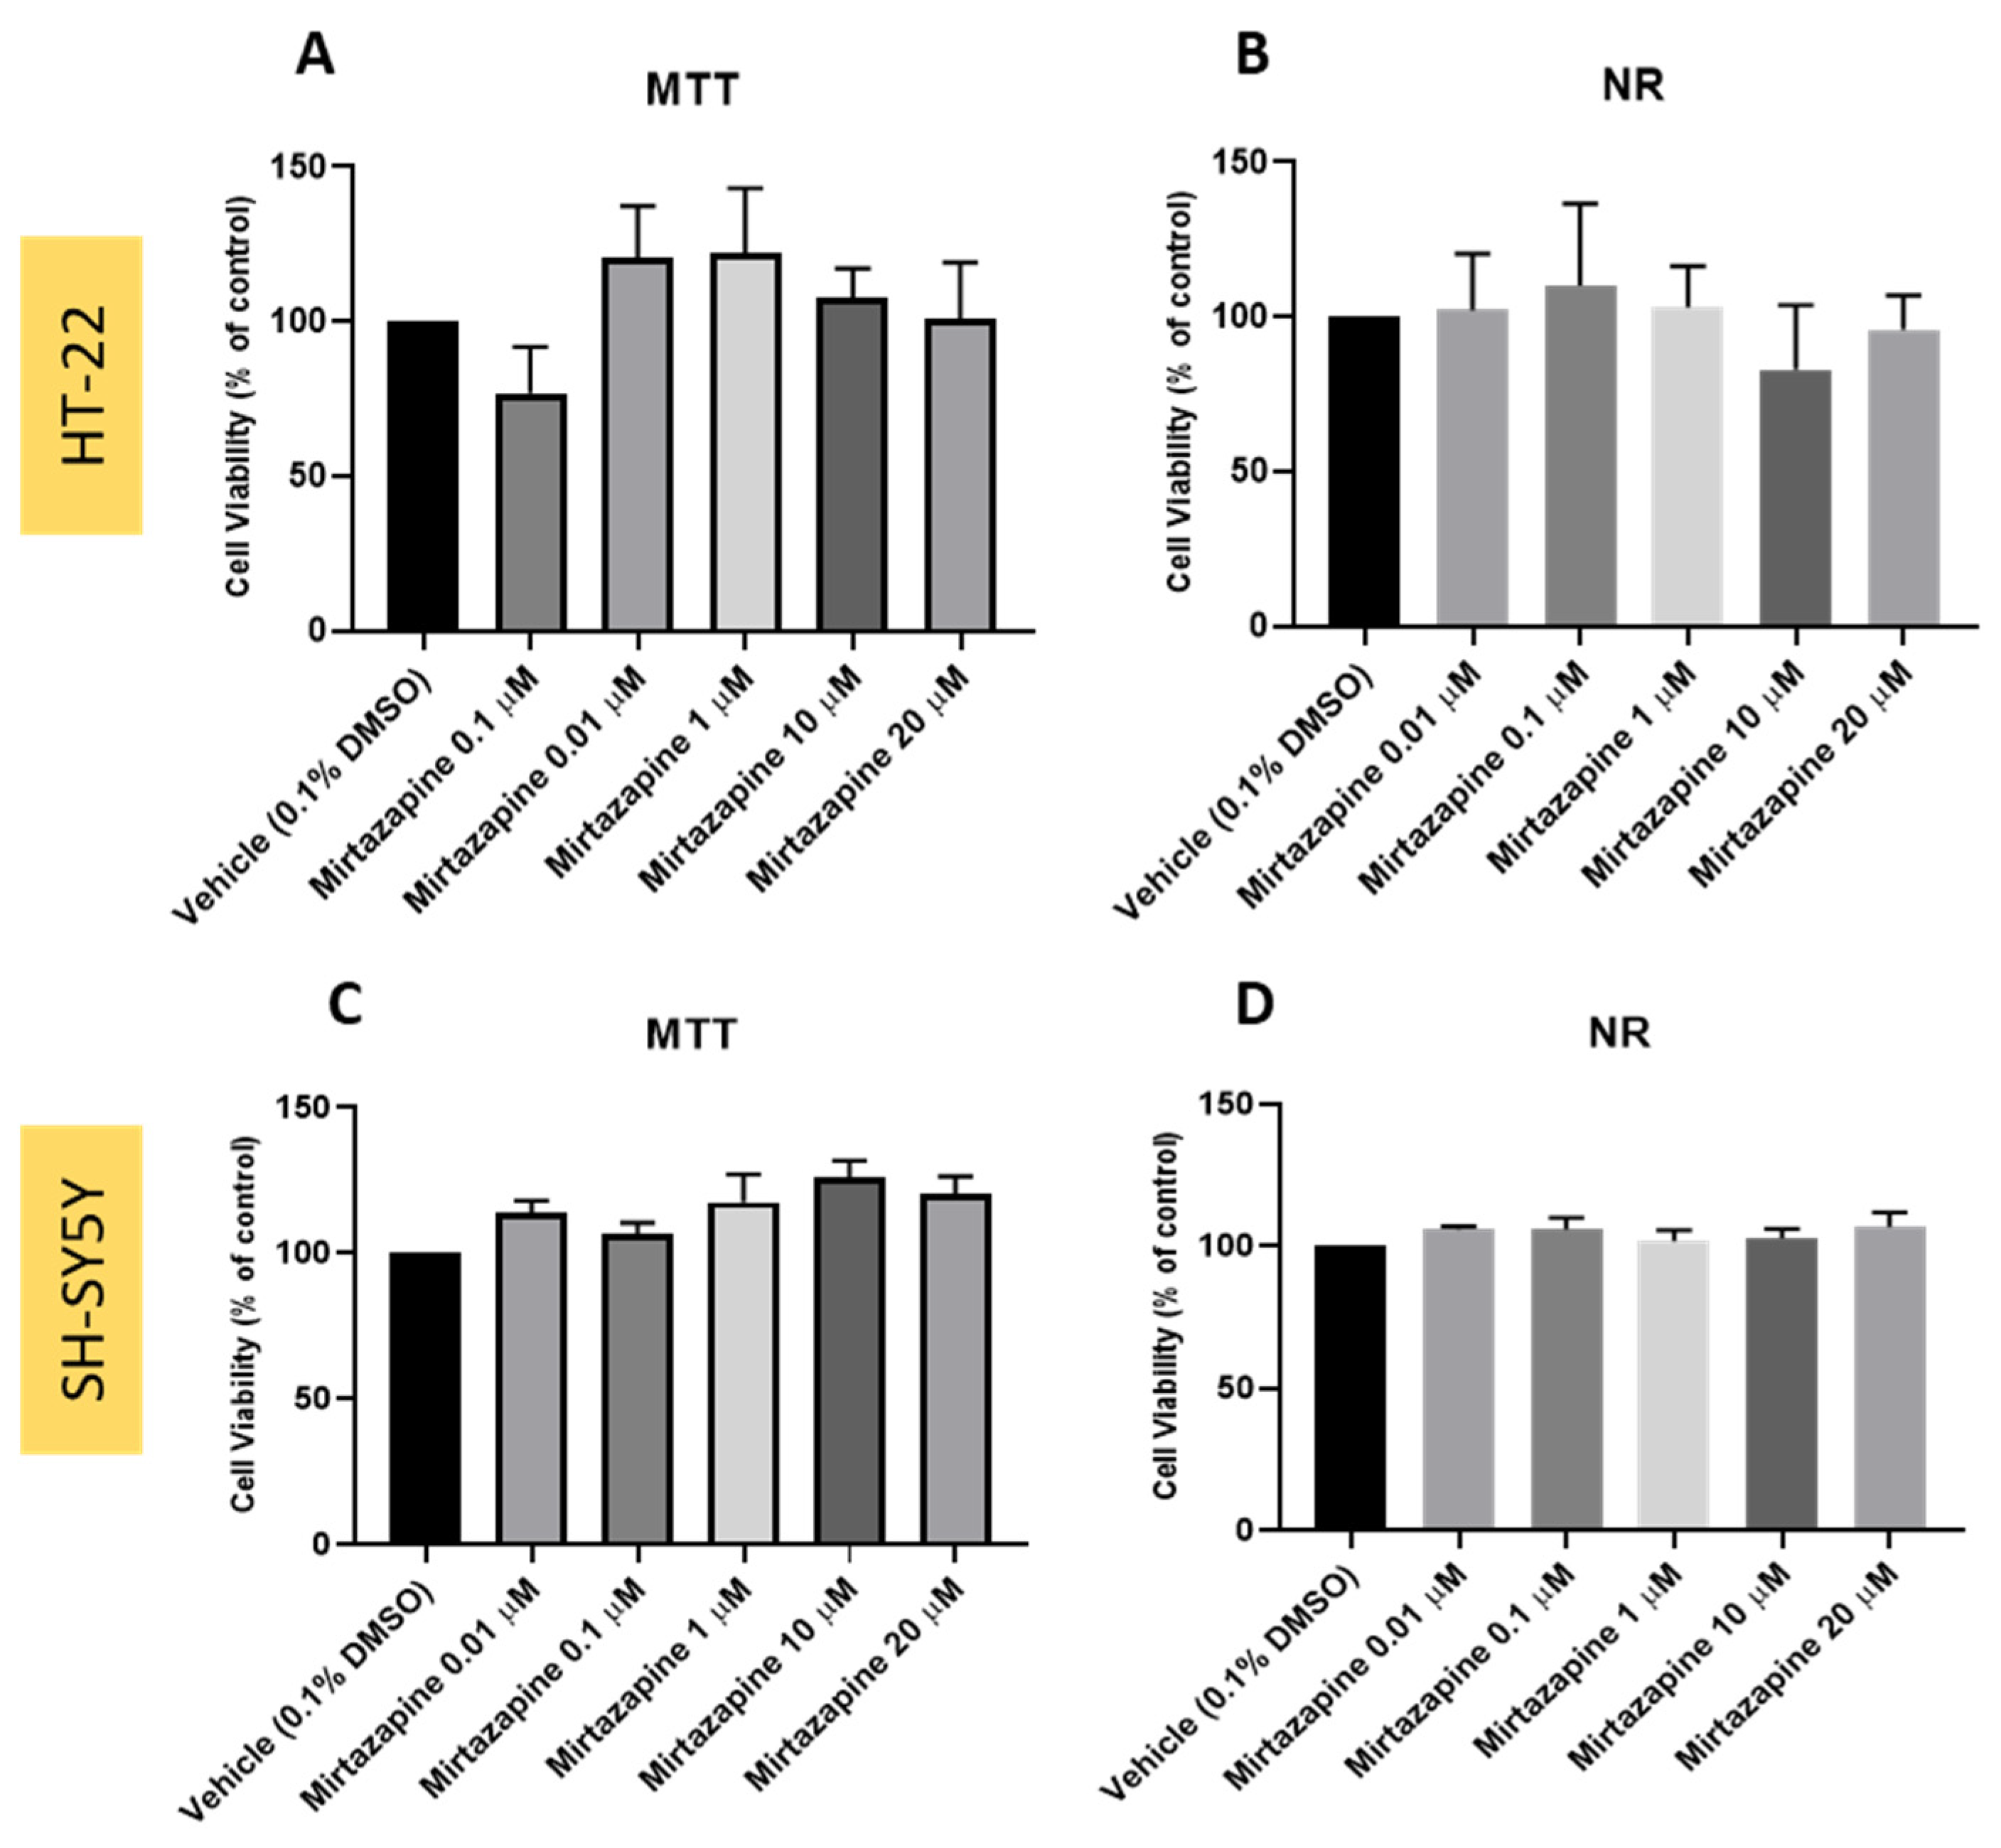
3.2. Effect of Mirtazapine on SH-SY5Y and HT-22 Cellular Viability

After studying H2O2 on the viability of both SH-SY5Y and HT-22 cells, we also studied the effect of the antidepressant mirtazapine on the viability of these cells. To perform this experiment, mirtazapine was added to HT-22 cells in concentrations ranging from 0.01 μM to 20 μM, for a period of 48 h. Cellular viability results were obtained by MTT (Figure 3A) and NR assays (Figure 3B), as described in the Section 2. Morphological observations were also carried out (Figure 4A–C). Previously, we also performed this experiment with SH-SY5Y cells [22] (Figure 3C,D and Figure 4D–F).
Our results reveal that mirtazapine, a clinically used antidepressant, was not toxic to the cells in any of the concentrations tested, being a good stress reverser for SH-SY5Y cells (as described previously [22]) and, potentially, to HT-22 cells. Taken together, these results demonstrate that mirtazapine does not lead to a decrease in cell viability in both cell lines, evidenced in both viability and morphological assays (Figure 3 and Figure 4), and may be used as a stress reverser in the proposed cellular model of stress.

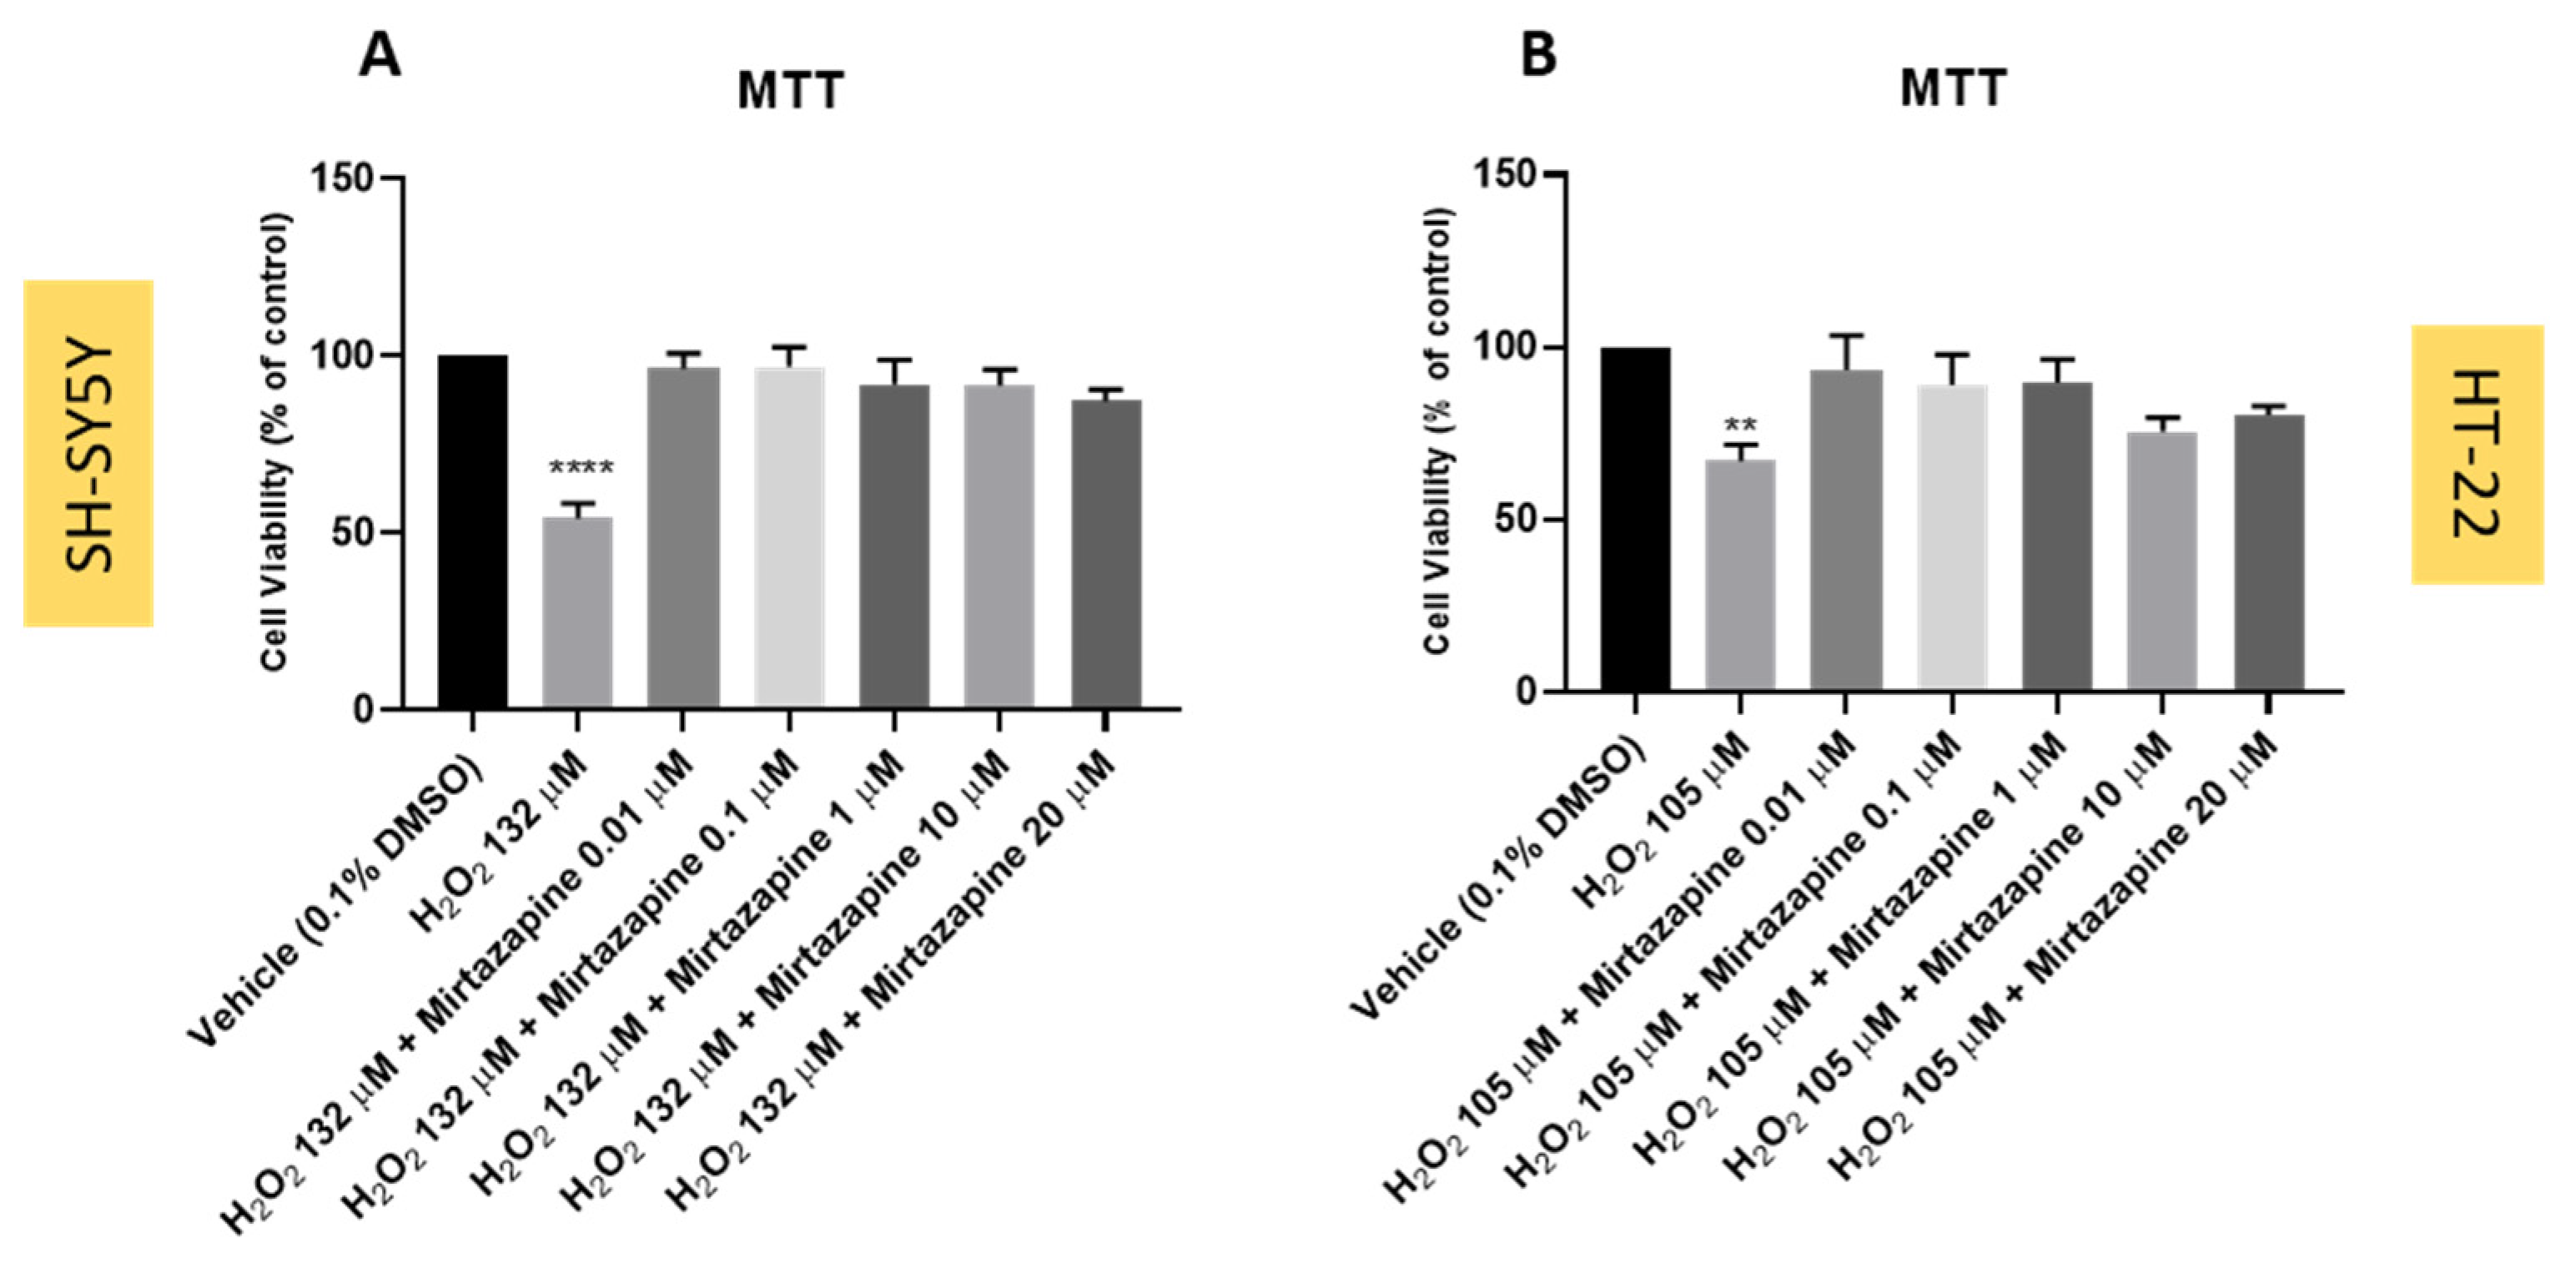
3.3. Effect of Mirtazapine Combined with Hydrogen Peroxide on SH-SY5Y and HT-22 Cellular Viability

To understand the effect of the combination of mirtazapine with H2O2 on SH-SY5Y and HT-22 cell viability, mirtazapine was added to the cells in concentrations of 0.01–20 μM, since there was no significant toxicity in these concentrations, for both cells. H2O2 was added to the cells at a fixed concentration of 132 µM for SH-SY5Y cells and 105 µM for HT-22 cells (representing the mean of the obtained IC50 values, respectively), for 48 h, and cell viability values were obtained by MTT assay, as described in the Section 2. Both drugs were applied to the cells in a simultaneous way. Figure 5B represents the obtained results for HT-22 cells. For SH-SY5Y cells, the results were previously reported [22] and are represented in the Figure 5A. Additionally, morphological analysis was also carried out (Figure 6).
Analyzing the obtained results for both cell lines, it can be observed that mirtazapine, at all the tested concentrations, was able to alleviate the decrease in the cell viability caused by H2O2. This effect was more pronounced in SH-SY5Y cells (Figure 5A) but was also notorious in HT-22 cells (Figu0re 5B). These results support the antidepressant activity of mirtazapine, highlighting the capability of this compound to counteract the harmful effects of H2O2 on the cells.

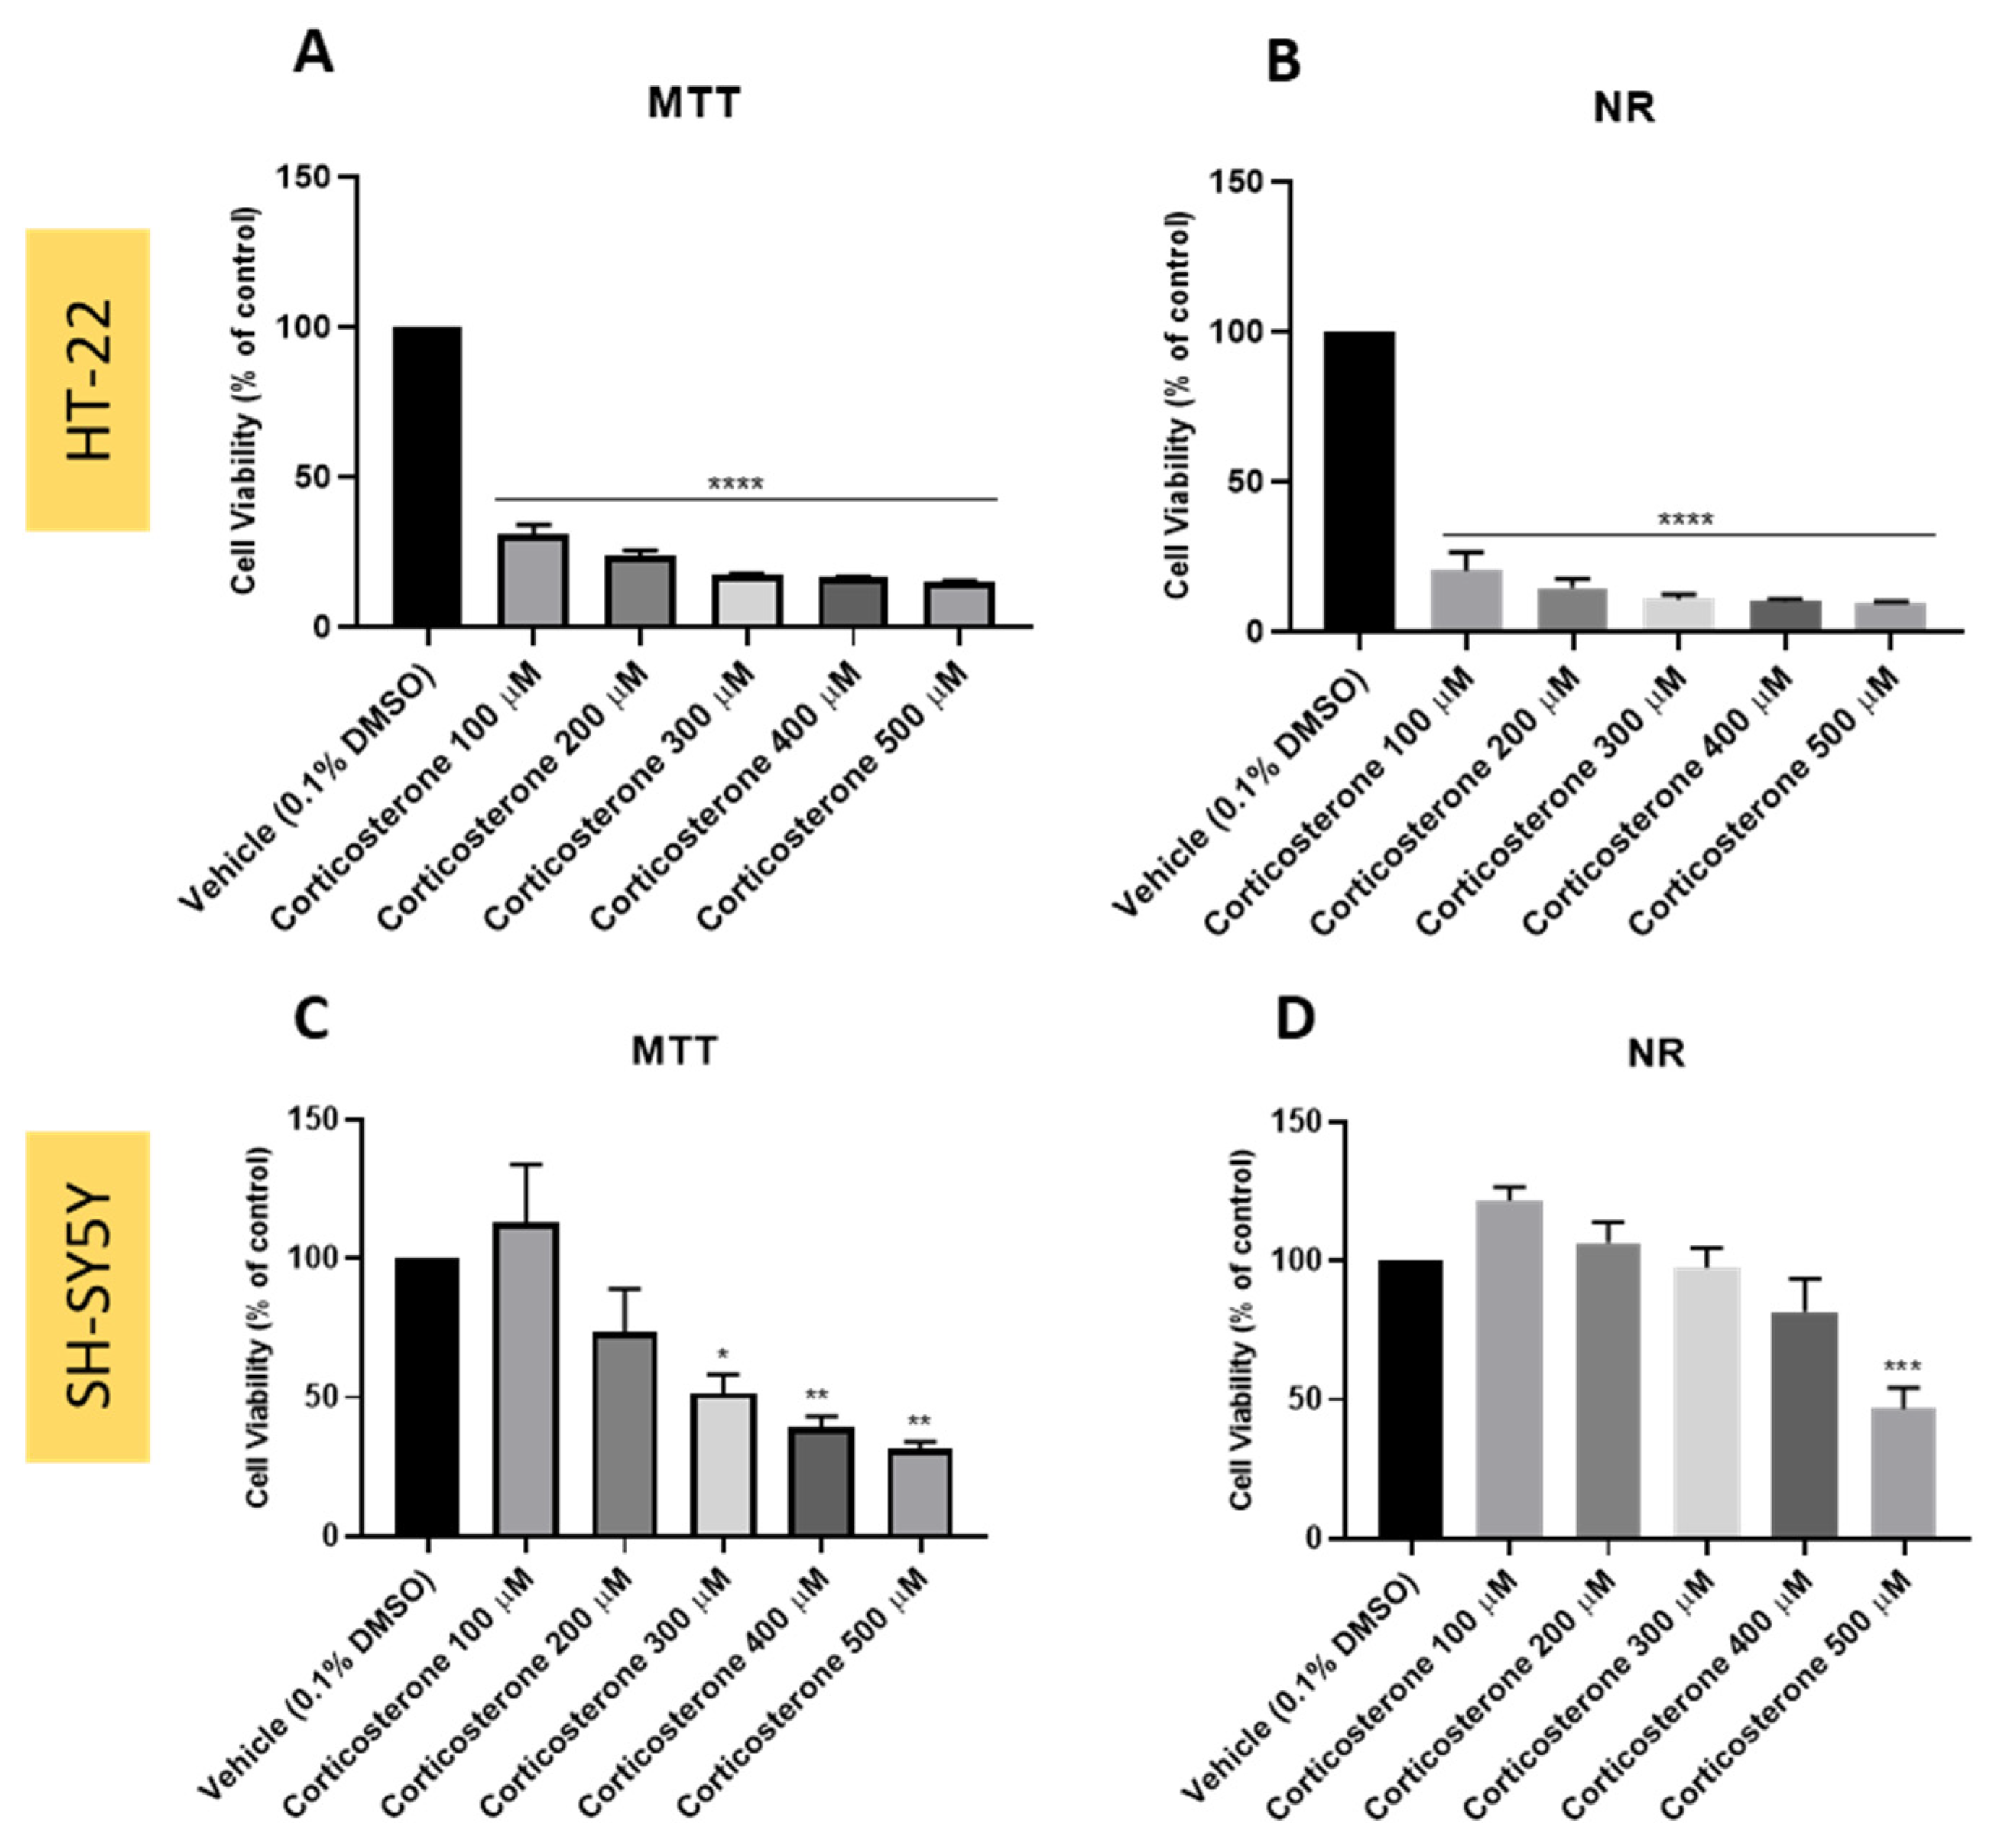
3.4. Effect of Corticosterone on SH-SY5Y and HT-22 Cellular Viability

To study the effect of another cell stressor on HT-22 and SH-SY5Y cell lines, corticosterone was applied to the cells in concentrations ranging from 100–500 μM, for 48 h. After that, cell viability values were obtained using MTT (Figure 7A,C) and NR assays (Figure 7B,D), as described in the Section 2. Additionally, morphological changes in the cells were also captured (Figure 8). The concentration-response curves (Figure S2) and half-maximal inhibitory concentrations (IC50) values were also determined.
It is possible to observe that corticosterone decreased both HT-22 and SH-SY5Y cell viability, in a concentration-dependent manner, as evidenced in MTT, NR, and morphology assays (Figure 7, Figure 8 and Figure S2). This effect of corticosterone was clearly more evidenced in HT-22 cells than in SH-SY5Y cells. Indeed, for HT-22 cells, we obtained IC50 values of 41 μM (MTT assay) and 31 μM (NR assay), whereas for SH-SY5Y cells, we obtained IC50 values of 236 μM (MTT assay) and 408 μM (NR assay) (Figure S2).

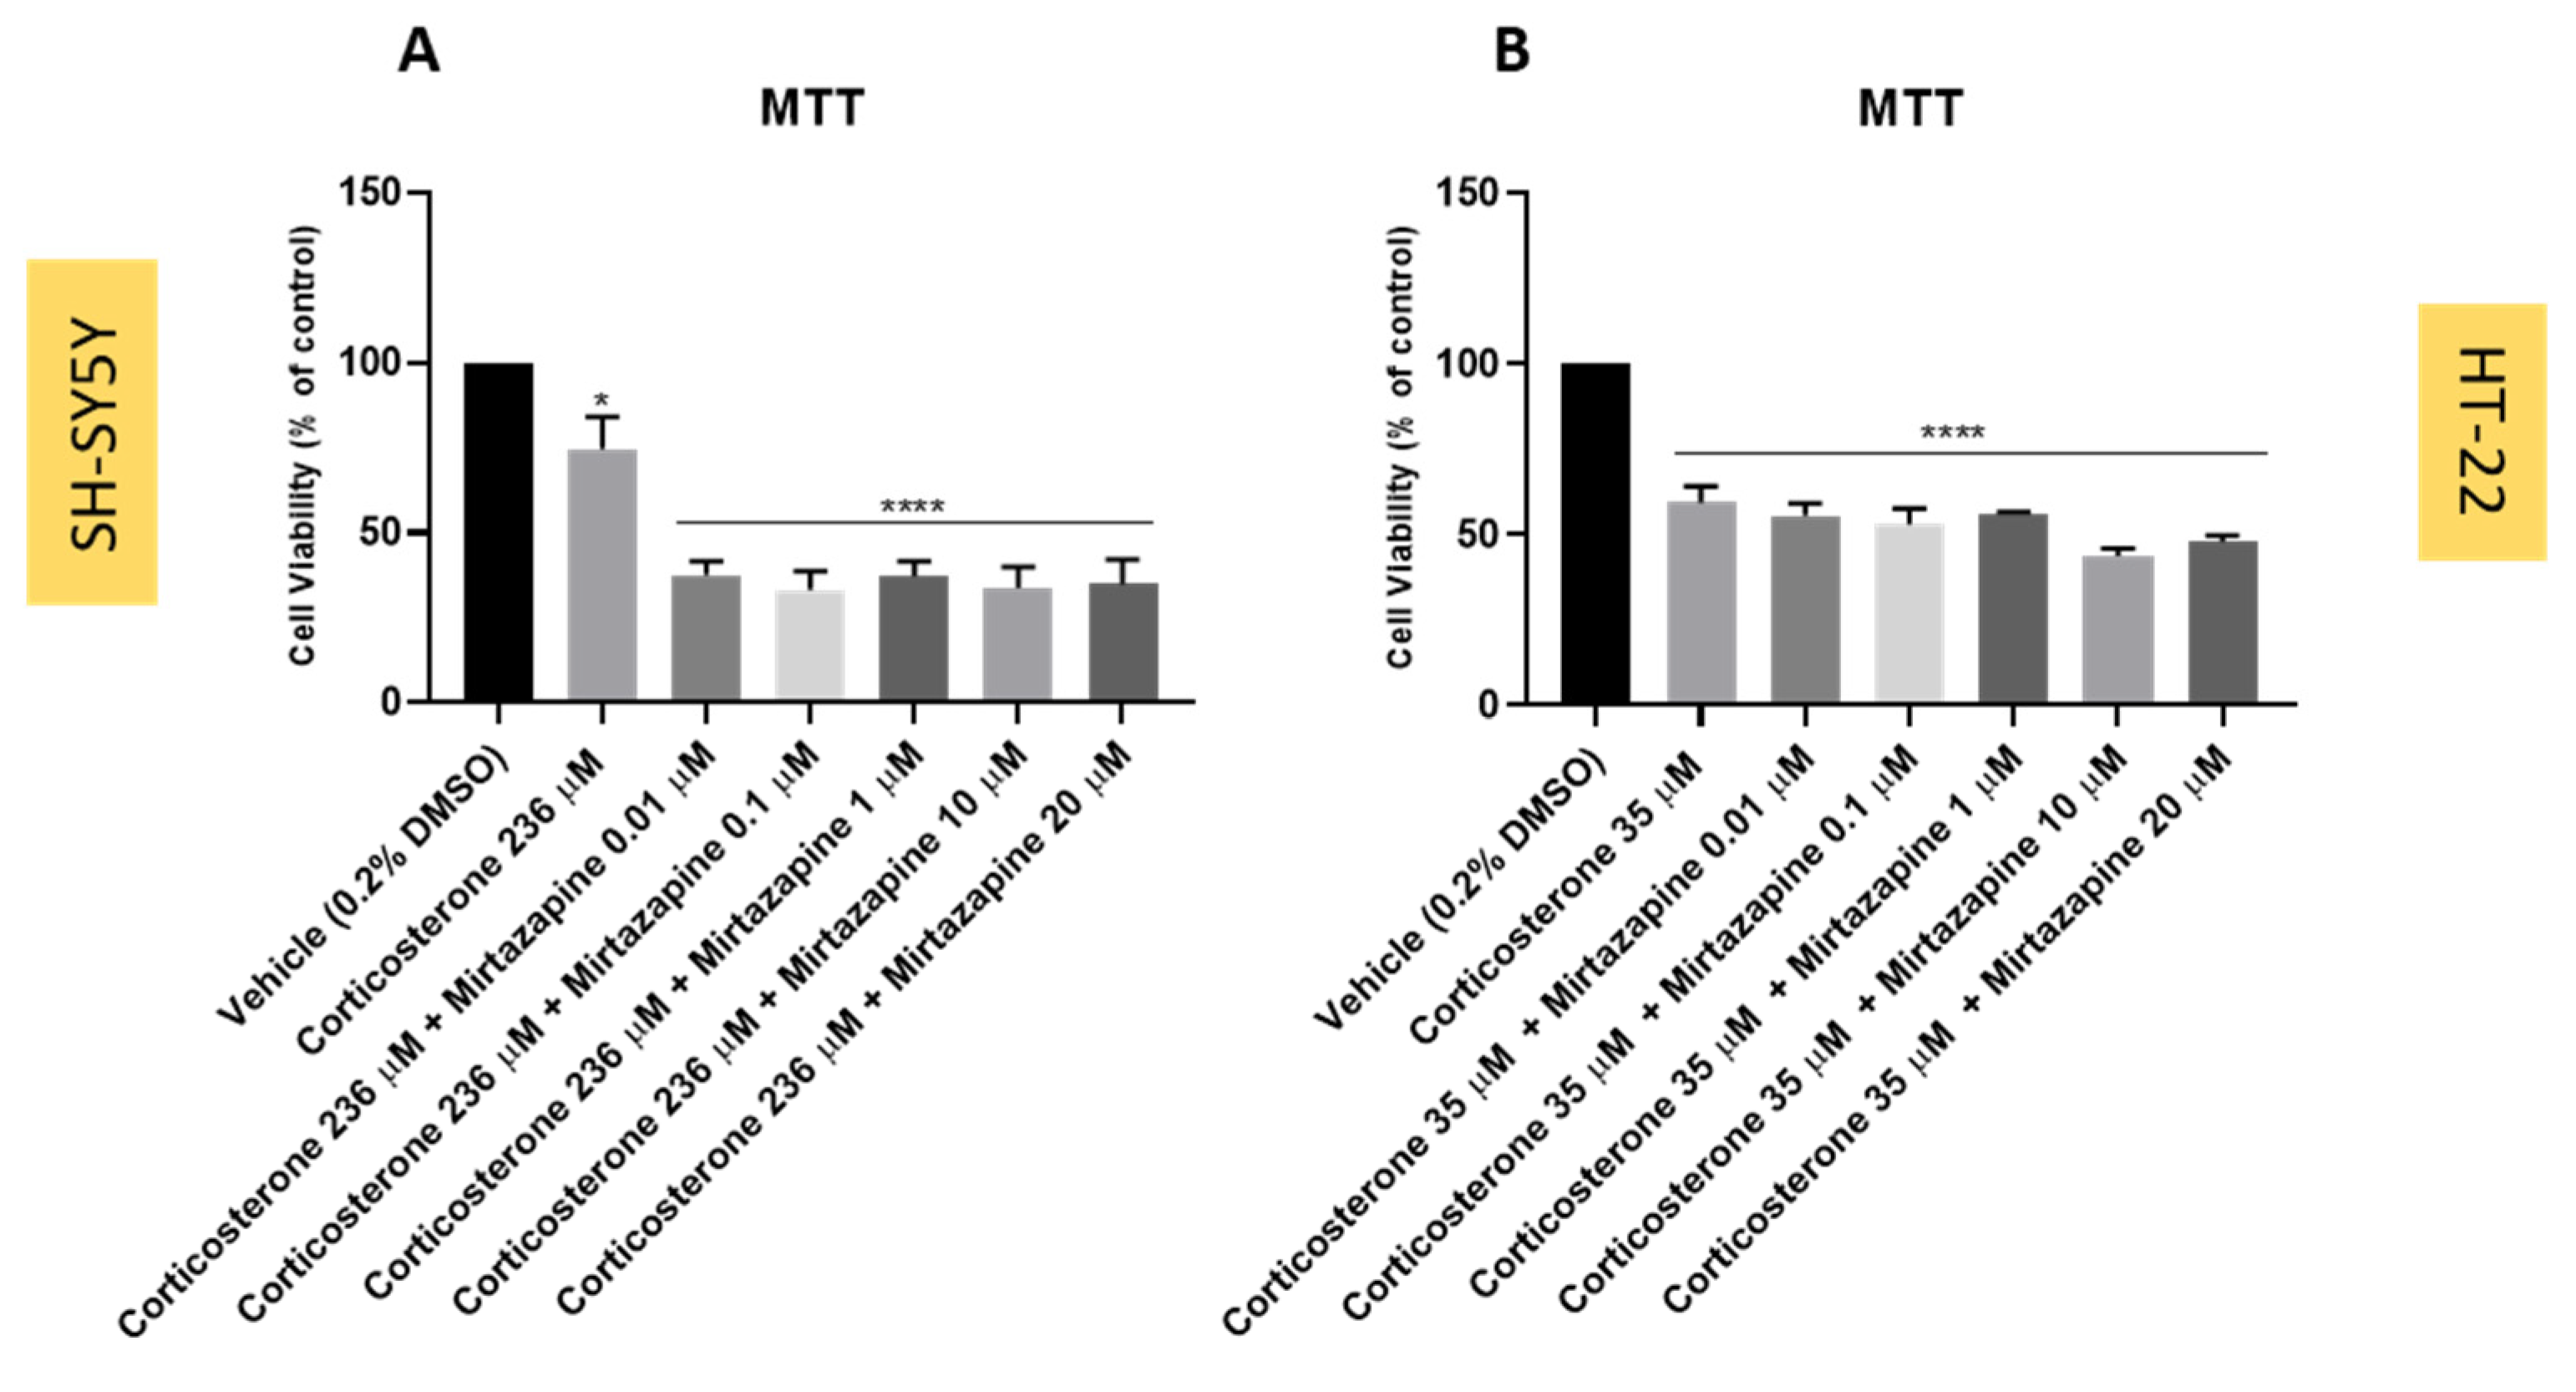
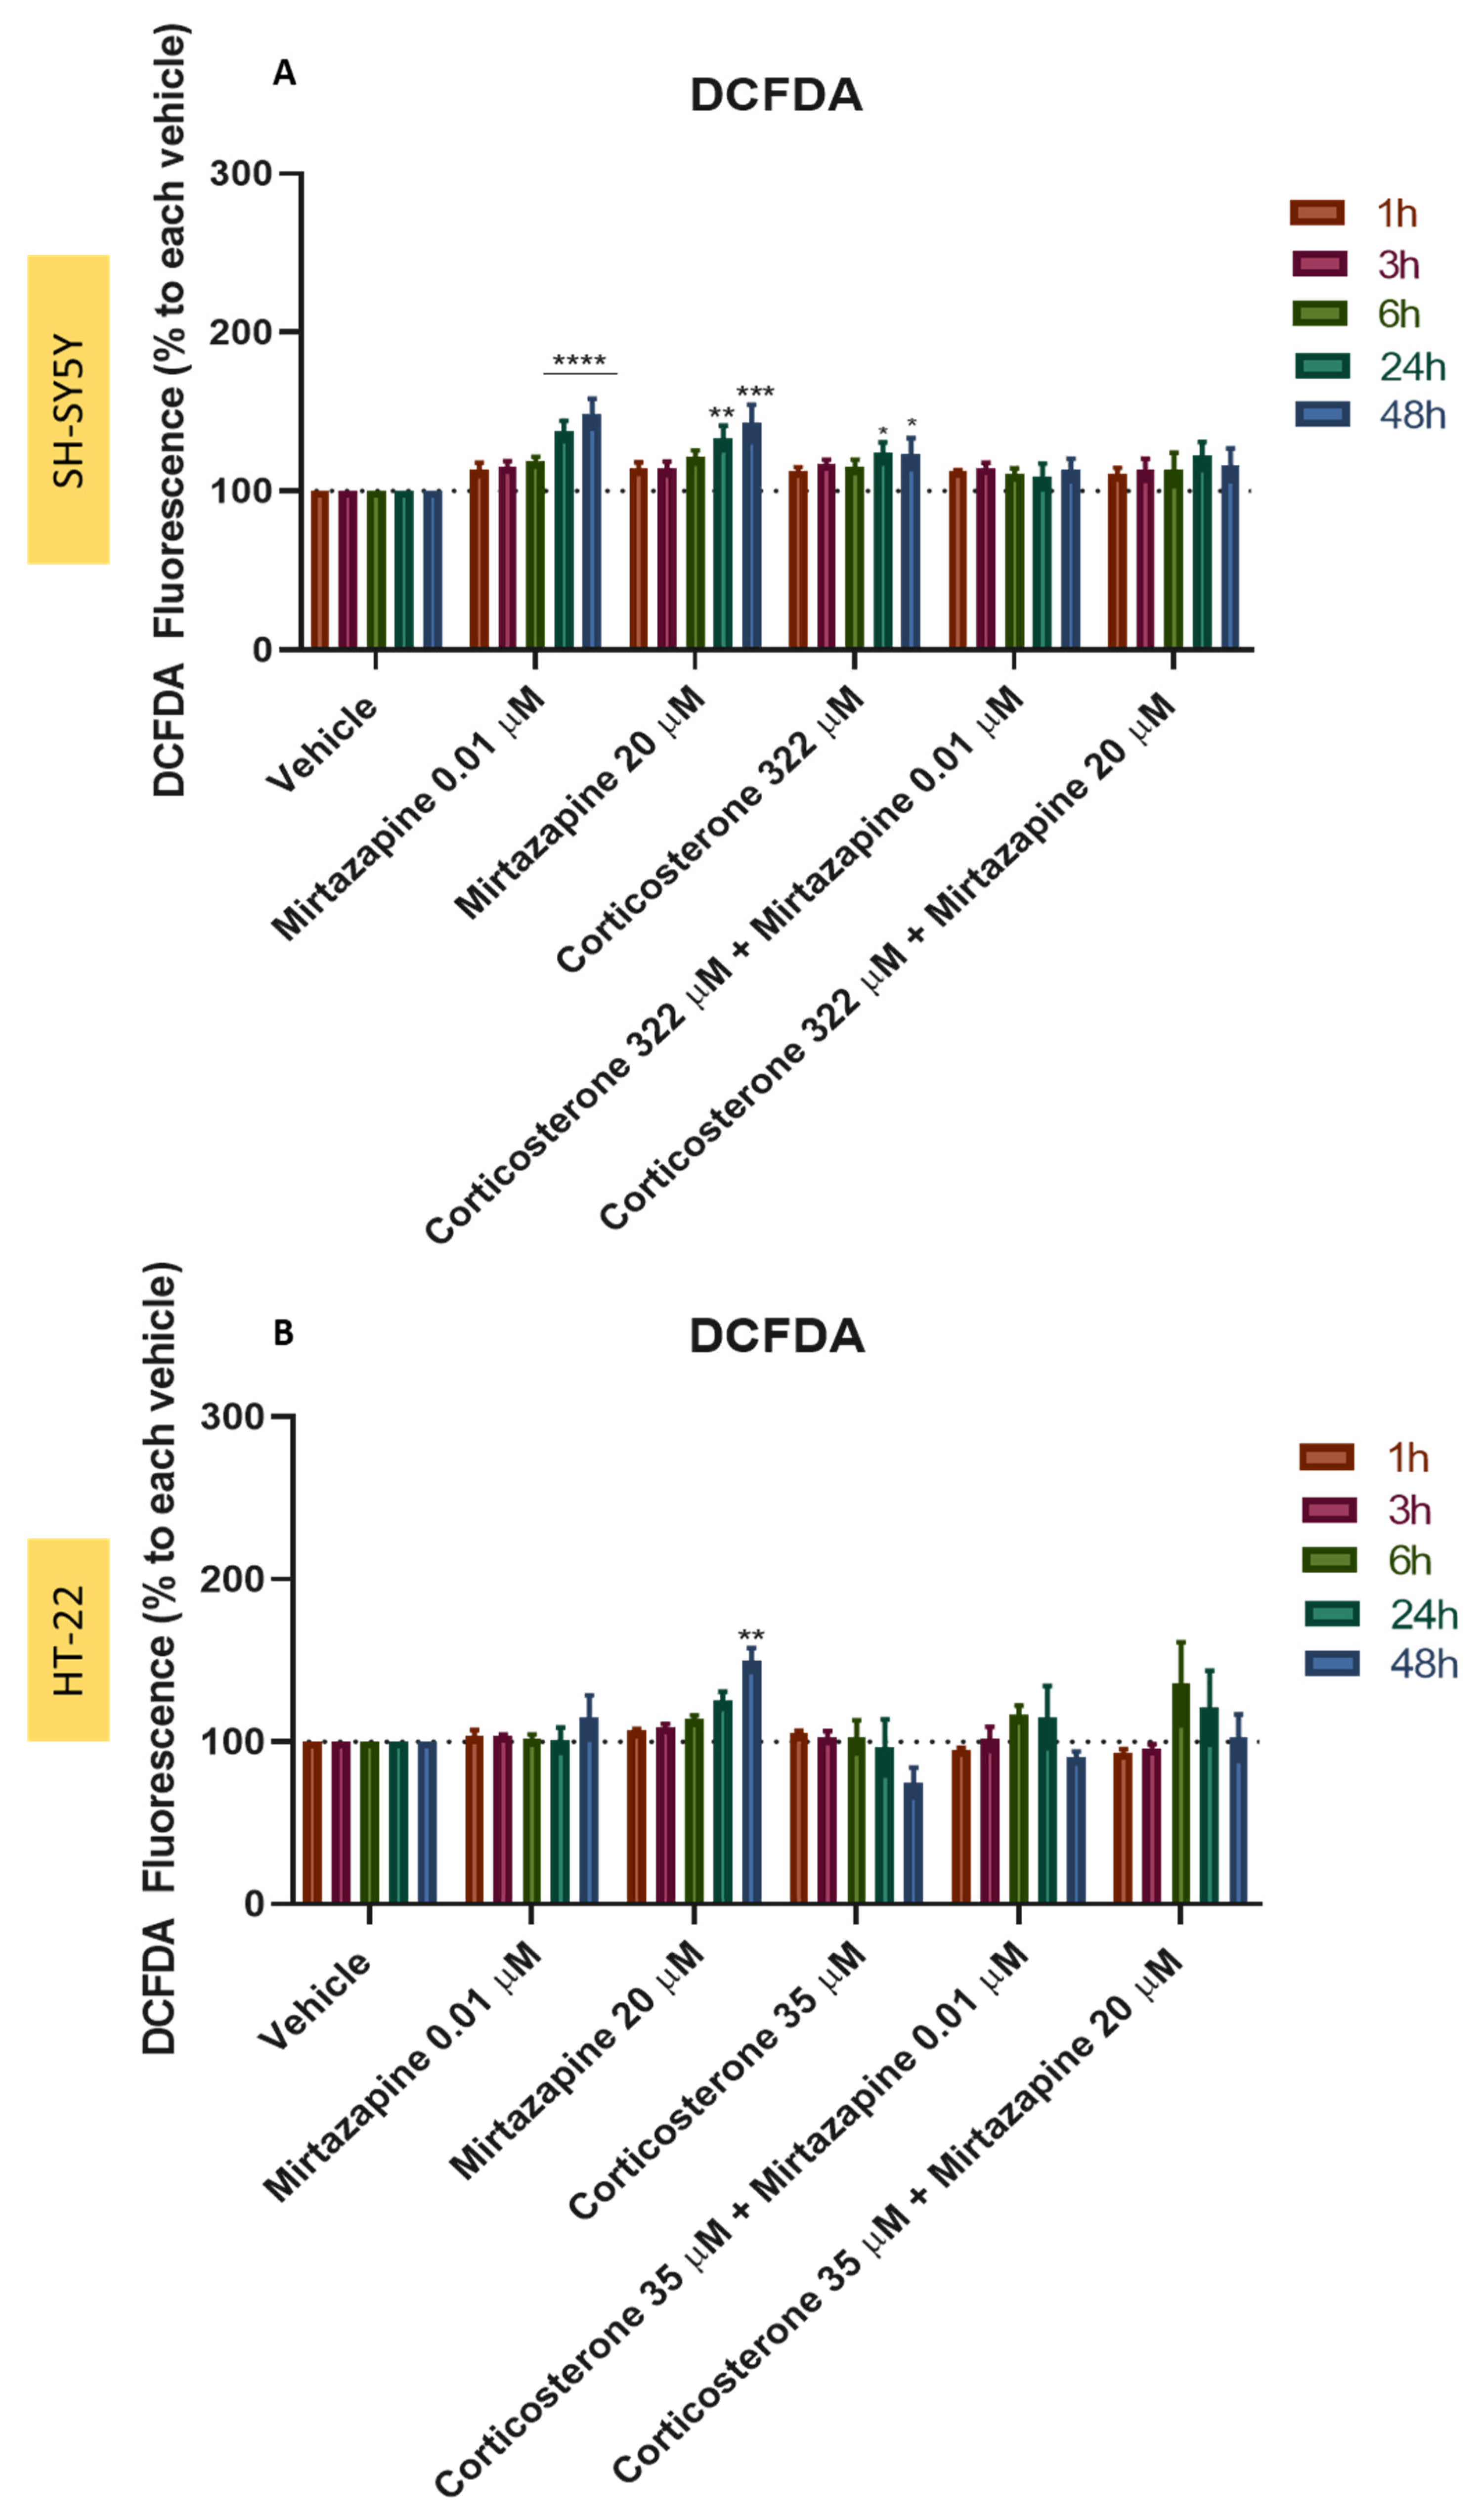
3.5. Effect of Mirtazapine Combined with Corticosterone on SH-SY5Y and HT-22 Cellular Viability

Aiming to study the effect of the combination of mirtazapine with corticosterone on SH-SY5Y and HT-22 cellular viability, this drug was added to the cells in concentrations of 0.01–20 μM for both cells, whereas corticosterone was added to the cells in a fixed concentration of 236 µM for SH-SY5Y cells and 35 µM for HT-22 cells (representing the obtained IC50 value for SH-SY5Y cells by MTT assay, and the mean of the IC50 values for HT-22 cells, obtained by MTT and NR assays). After a period of exposition of 48 h, cellular viability values were obtained by MTT assay (Figure 9). Once again, both drugs were applied to the cells simultaneously. Morphological analysis was also carried out (Figure 10).
Our results reveal that for SH-SY5Y cells, mirtazapine was not able to alleviate the harmful effects of corticosterone. Indeed, the combination of mirtazapine and corticosterone led to even more cell viability decrease, compared to corticosterone alone (Figure 9A and Figure 10D–F). Regarding HT-22 cells, mirtazapine was also not able to alleviate the harmful effects of corticosterone (Figure 9B and Figure 10A–C). However, in HT-22 cells, the effects of the combination of mirtazapine with corticosterone did not differ from corticosterone alone, contrasting with SH-SY5Y cells. Taken together, these results demonstrate that mirtazapine was not able to counteract the harmful effects of corticosterone on the cells.

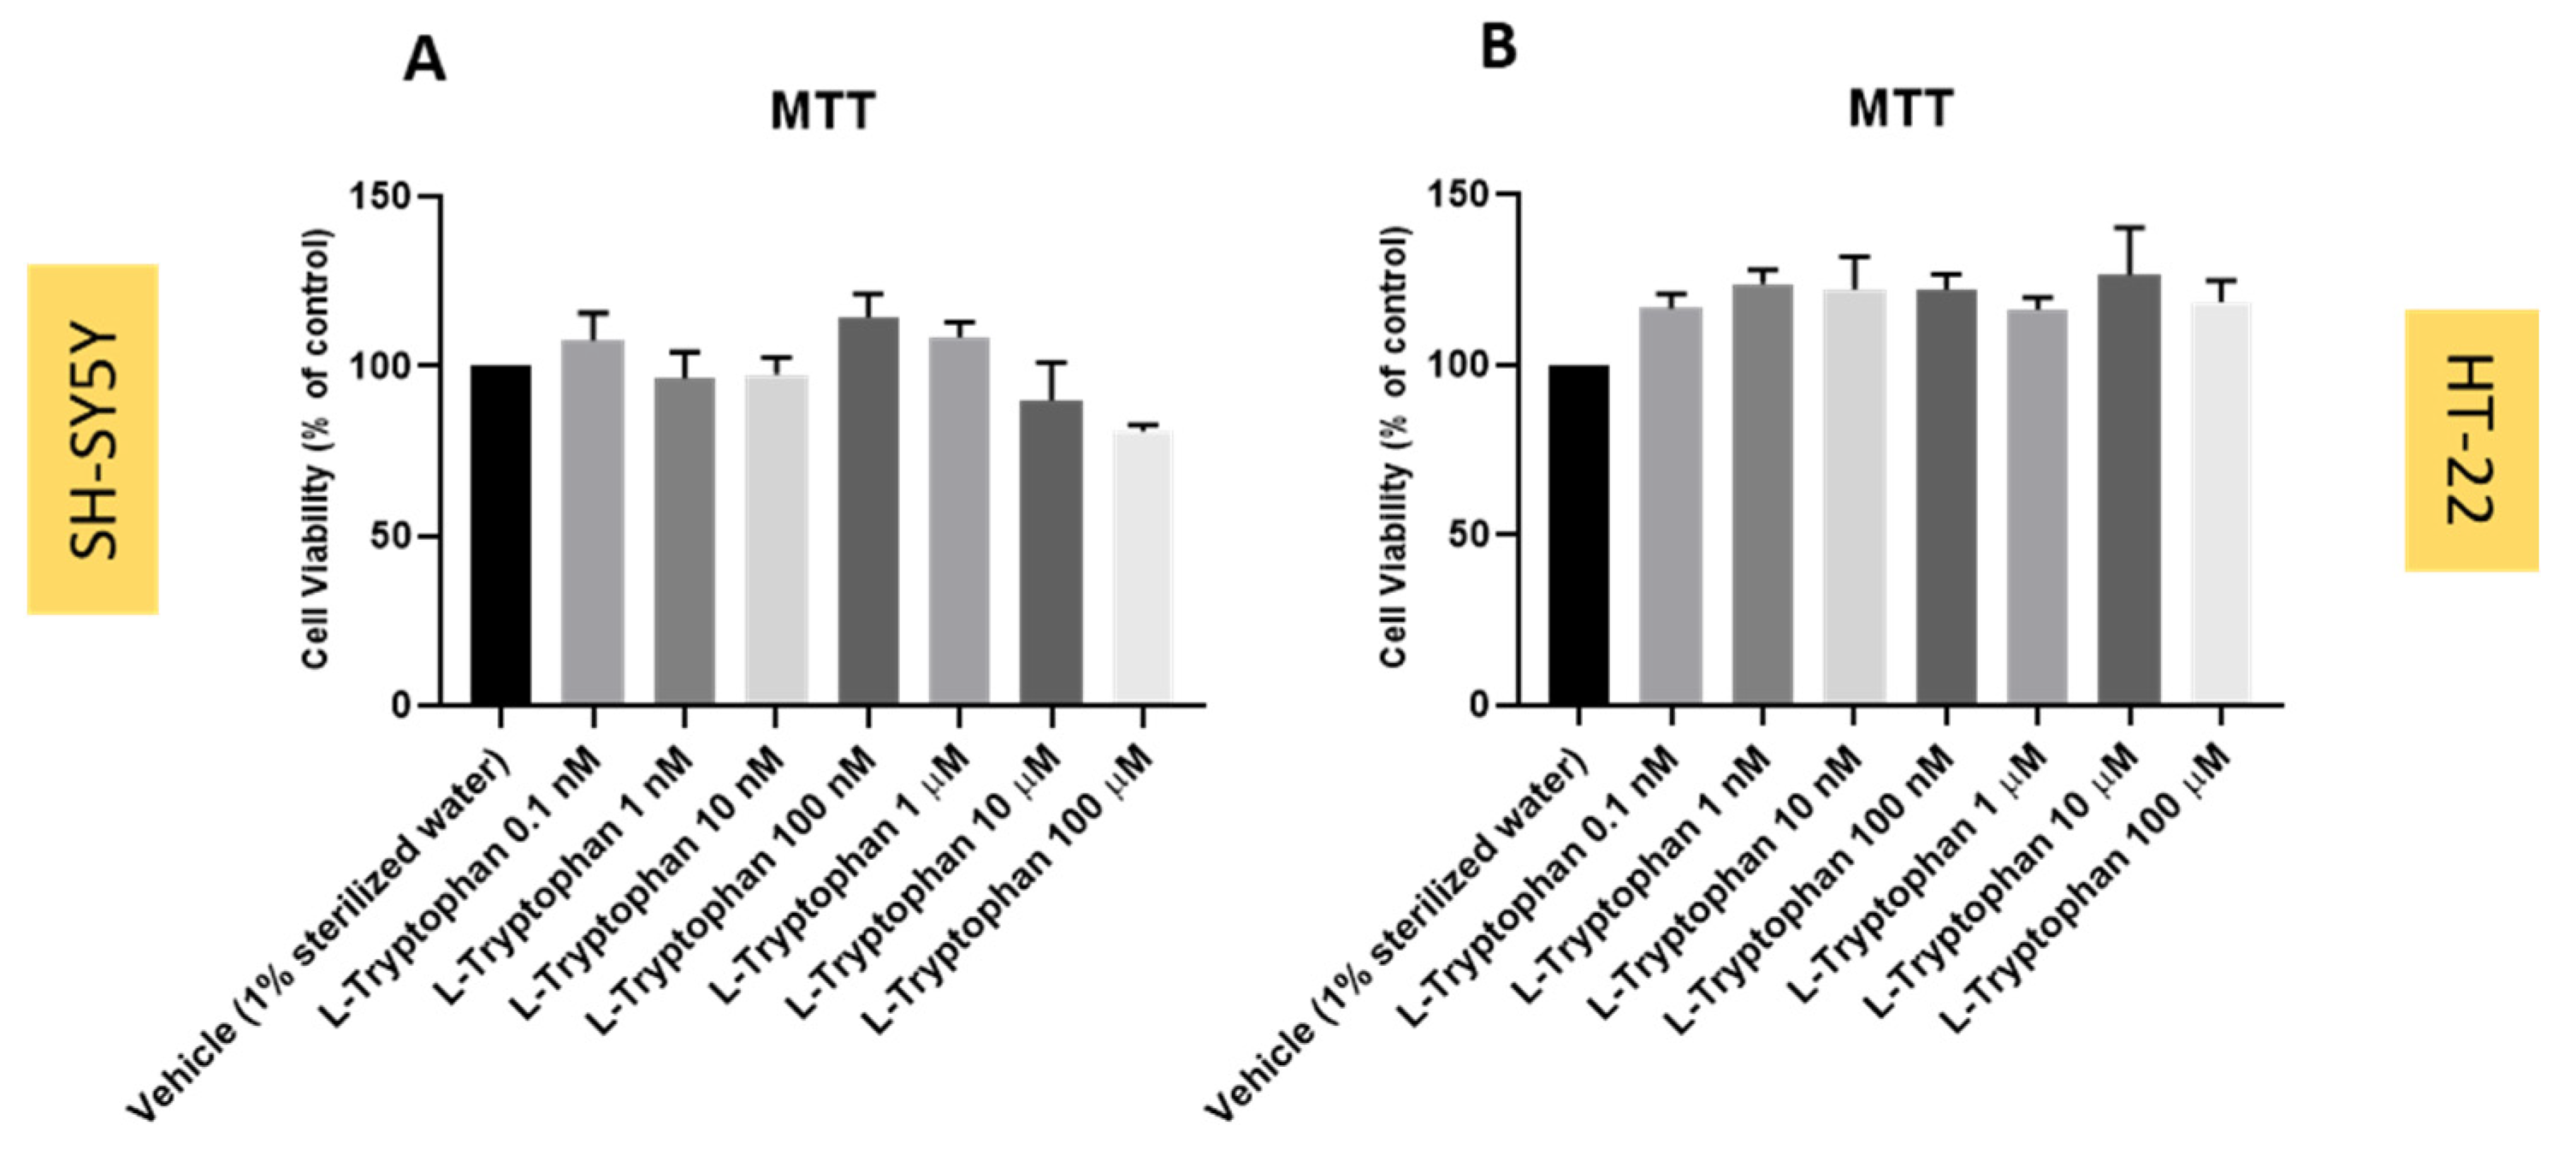
3.6. Effect of L-Tryptophan on SH-SY5Y and HT-22 Cellular Viability

To explore the potential of L-tryptophan to attenuate H2O2 or corticosterone-induced stress on both cell lines, L-tryptophan was added to the cells in concentrations ranging from 0.1 nM to 100 μM for 48 h. Cellular viability results were determined by MTT (Figure 11), as described in the Section 2. Morphological observations were also carried out (Figure 12).
Analyzing the obtained results for both cell lines, we can conclude that like mirtazapine, L-tryptophan was not toxic to the cells in any of the concentrations tested, being a potential stress reverser for both HT-22 and SH-SY5Y cells. In sum, these results demonstrate that L-tryptophan does not lead to a decrease in cell viability in both cell lines, evidenced in both viability (Figure 11) and morphological assays (Figure 12), and may be used as a stress reverser in the proposed cellular model of stress, such as mirtazapine.

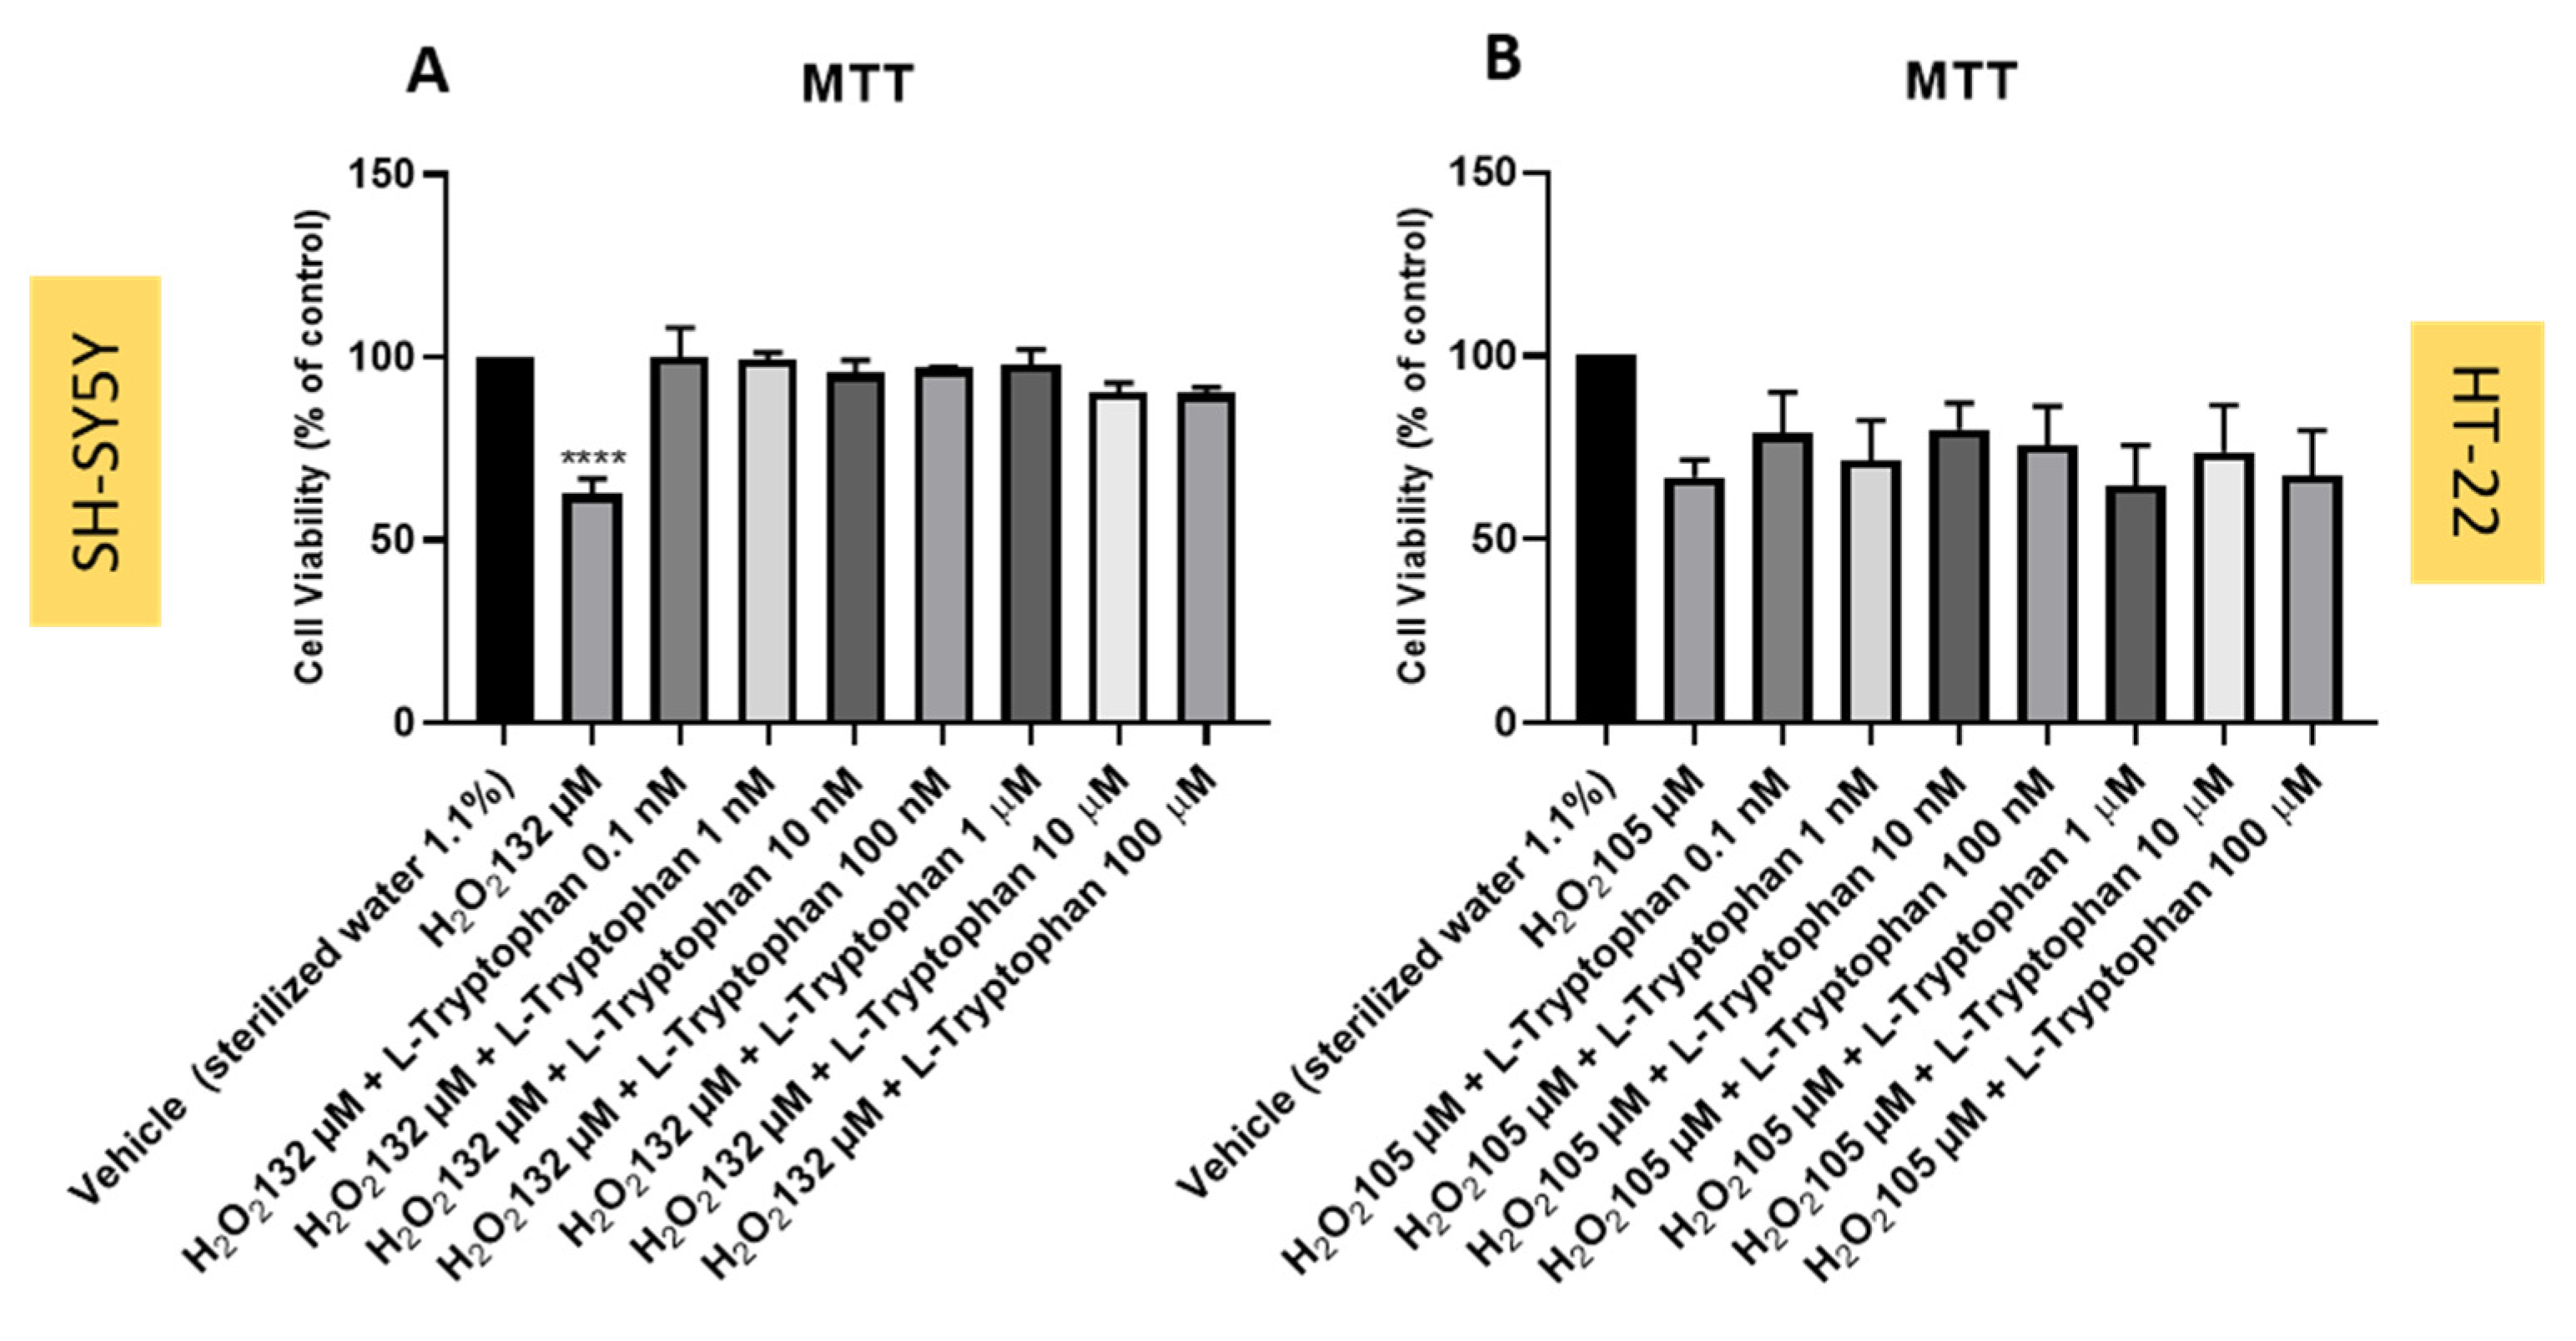
3.7. Effect of L-Tryptophan Combined with Hydrogen Peroxide on SH-SY5Y and HT-22 Cellular Viability

Next, to understand the effect of L-tryptophan combined with H2O2 on SH-SY5Y and HT-22 cellular viability, this amino acid was added to the cells in concentrations of 0.1 nM–100 μM. Once again, H2O2 was added to the cells at a fixed concentration of 132 µM for SH-SY5Y cells and 105 µM for HT-22 cells, for a period of incubation of 48 h, and cell viability was obtained by MTT assay (Figure 13). Morphological analysis was also carried out for both cell lines (Figure 14).
Analyzing the obtained results, we can conclude that L-tryptophan, at all the tested concentrations, was able to alleviate the decrease in the cellular viability caused by H2O2, especially notorious in SH-SY5Y cells (Figure 13A and Figure 14D–F). Regarding HT-22 cells, this effect was not so pronounced such as in SH-SY5Y cells. Nevertheless, it is possible to observe a tendency of stress alleviation by L-tryptophan, especially evidenced in Figure 14A–C. Together, these results evidence that L-tryptophan is a good candidate to counteract the harmful effects of H2O2 on the cells, especially SH-SY5Y cells.

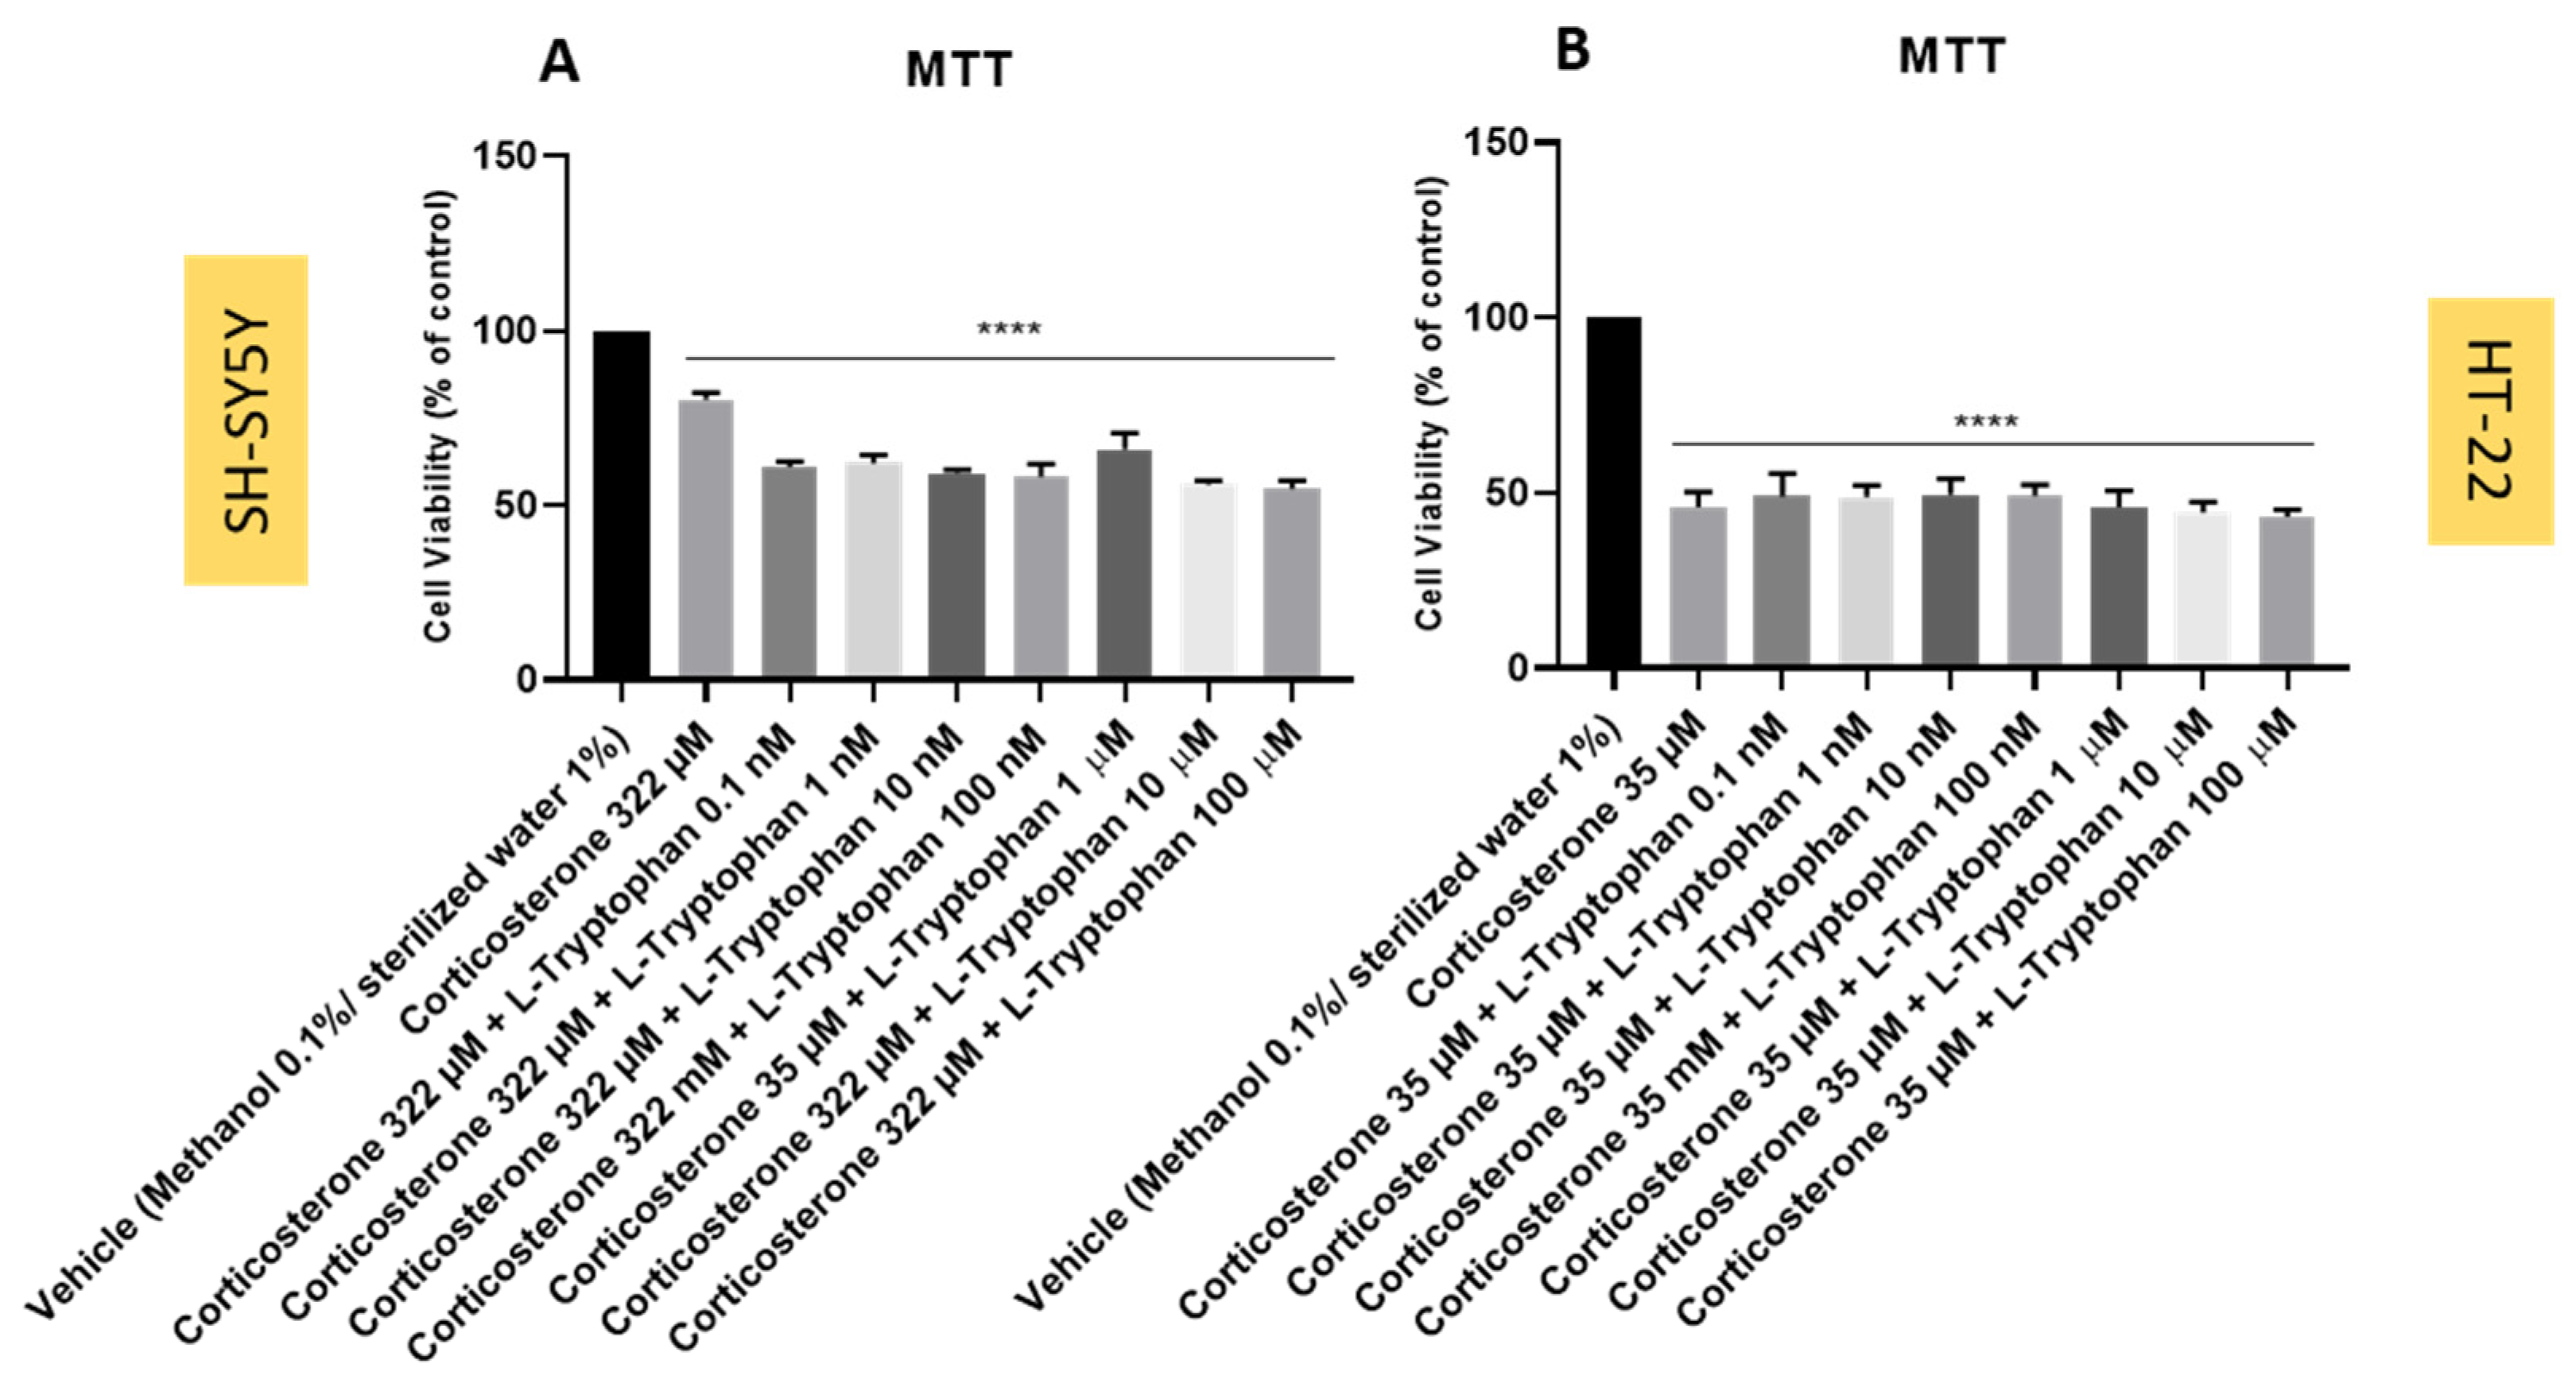
3.8. Effect of L-Tryptophan Combined with Corticosterone on SH-SY5Y and HT-22 Cellular Viability

To understand the effect of the combination of L-tryptophan with corticosterone on SH-SY5Y and HT-22 cell viability, this amino acid was added to the cells in concentrations of 0.1 nM–100. Corticosterone was added to both cell lines in a fixed concentration of 322 µM for SH-SY5Y cells and 35 µM for HT-22 cells (representing the mean of the obtained IC50 values for SH-SY5Y cells and HT-22 cells, respectively), for a period of 48 h. Cellular viability results were obtained by MTT assay (Figure 15). Both compounds were added to the cells simultaneously. Morphological evaluation was also carried out (Figure 16).
Our results reveal that L-tryptophan was not able to alleviate the harmful effects of corticosterone. Indeed, for SH-SY5Y cells, such as what was observed with mirtazapine, the combination of L-tryptophan and corticosterone led to even more cell viability decrease, compared to corticosterone alone (Figure 15A and Figure 16D–F). Regarding HT-22 cells, L-tryptophan was also not able to counteract the harmful effects of corticosterone (Figure 15B and Figure 16A–C). However, in HT-22 cells, the effects of the combination of L-tryptophan with corticosterone did not differ from corticosterone alone, contrasting with SH-SY5Y cells. These results are identical to those observed with mirtazapine in combination with corticosterone. Together, these results evidence that L-tryptophan was not able to counteract the effects of corticosterone on the cells.

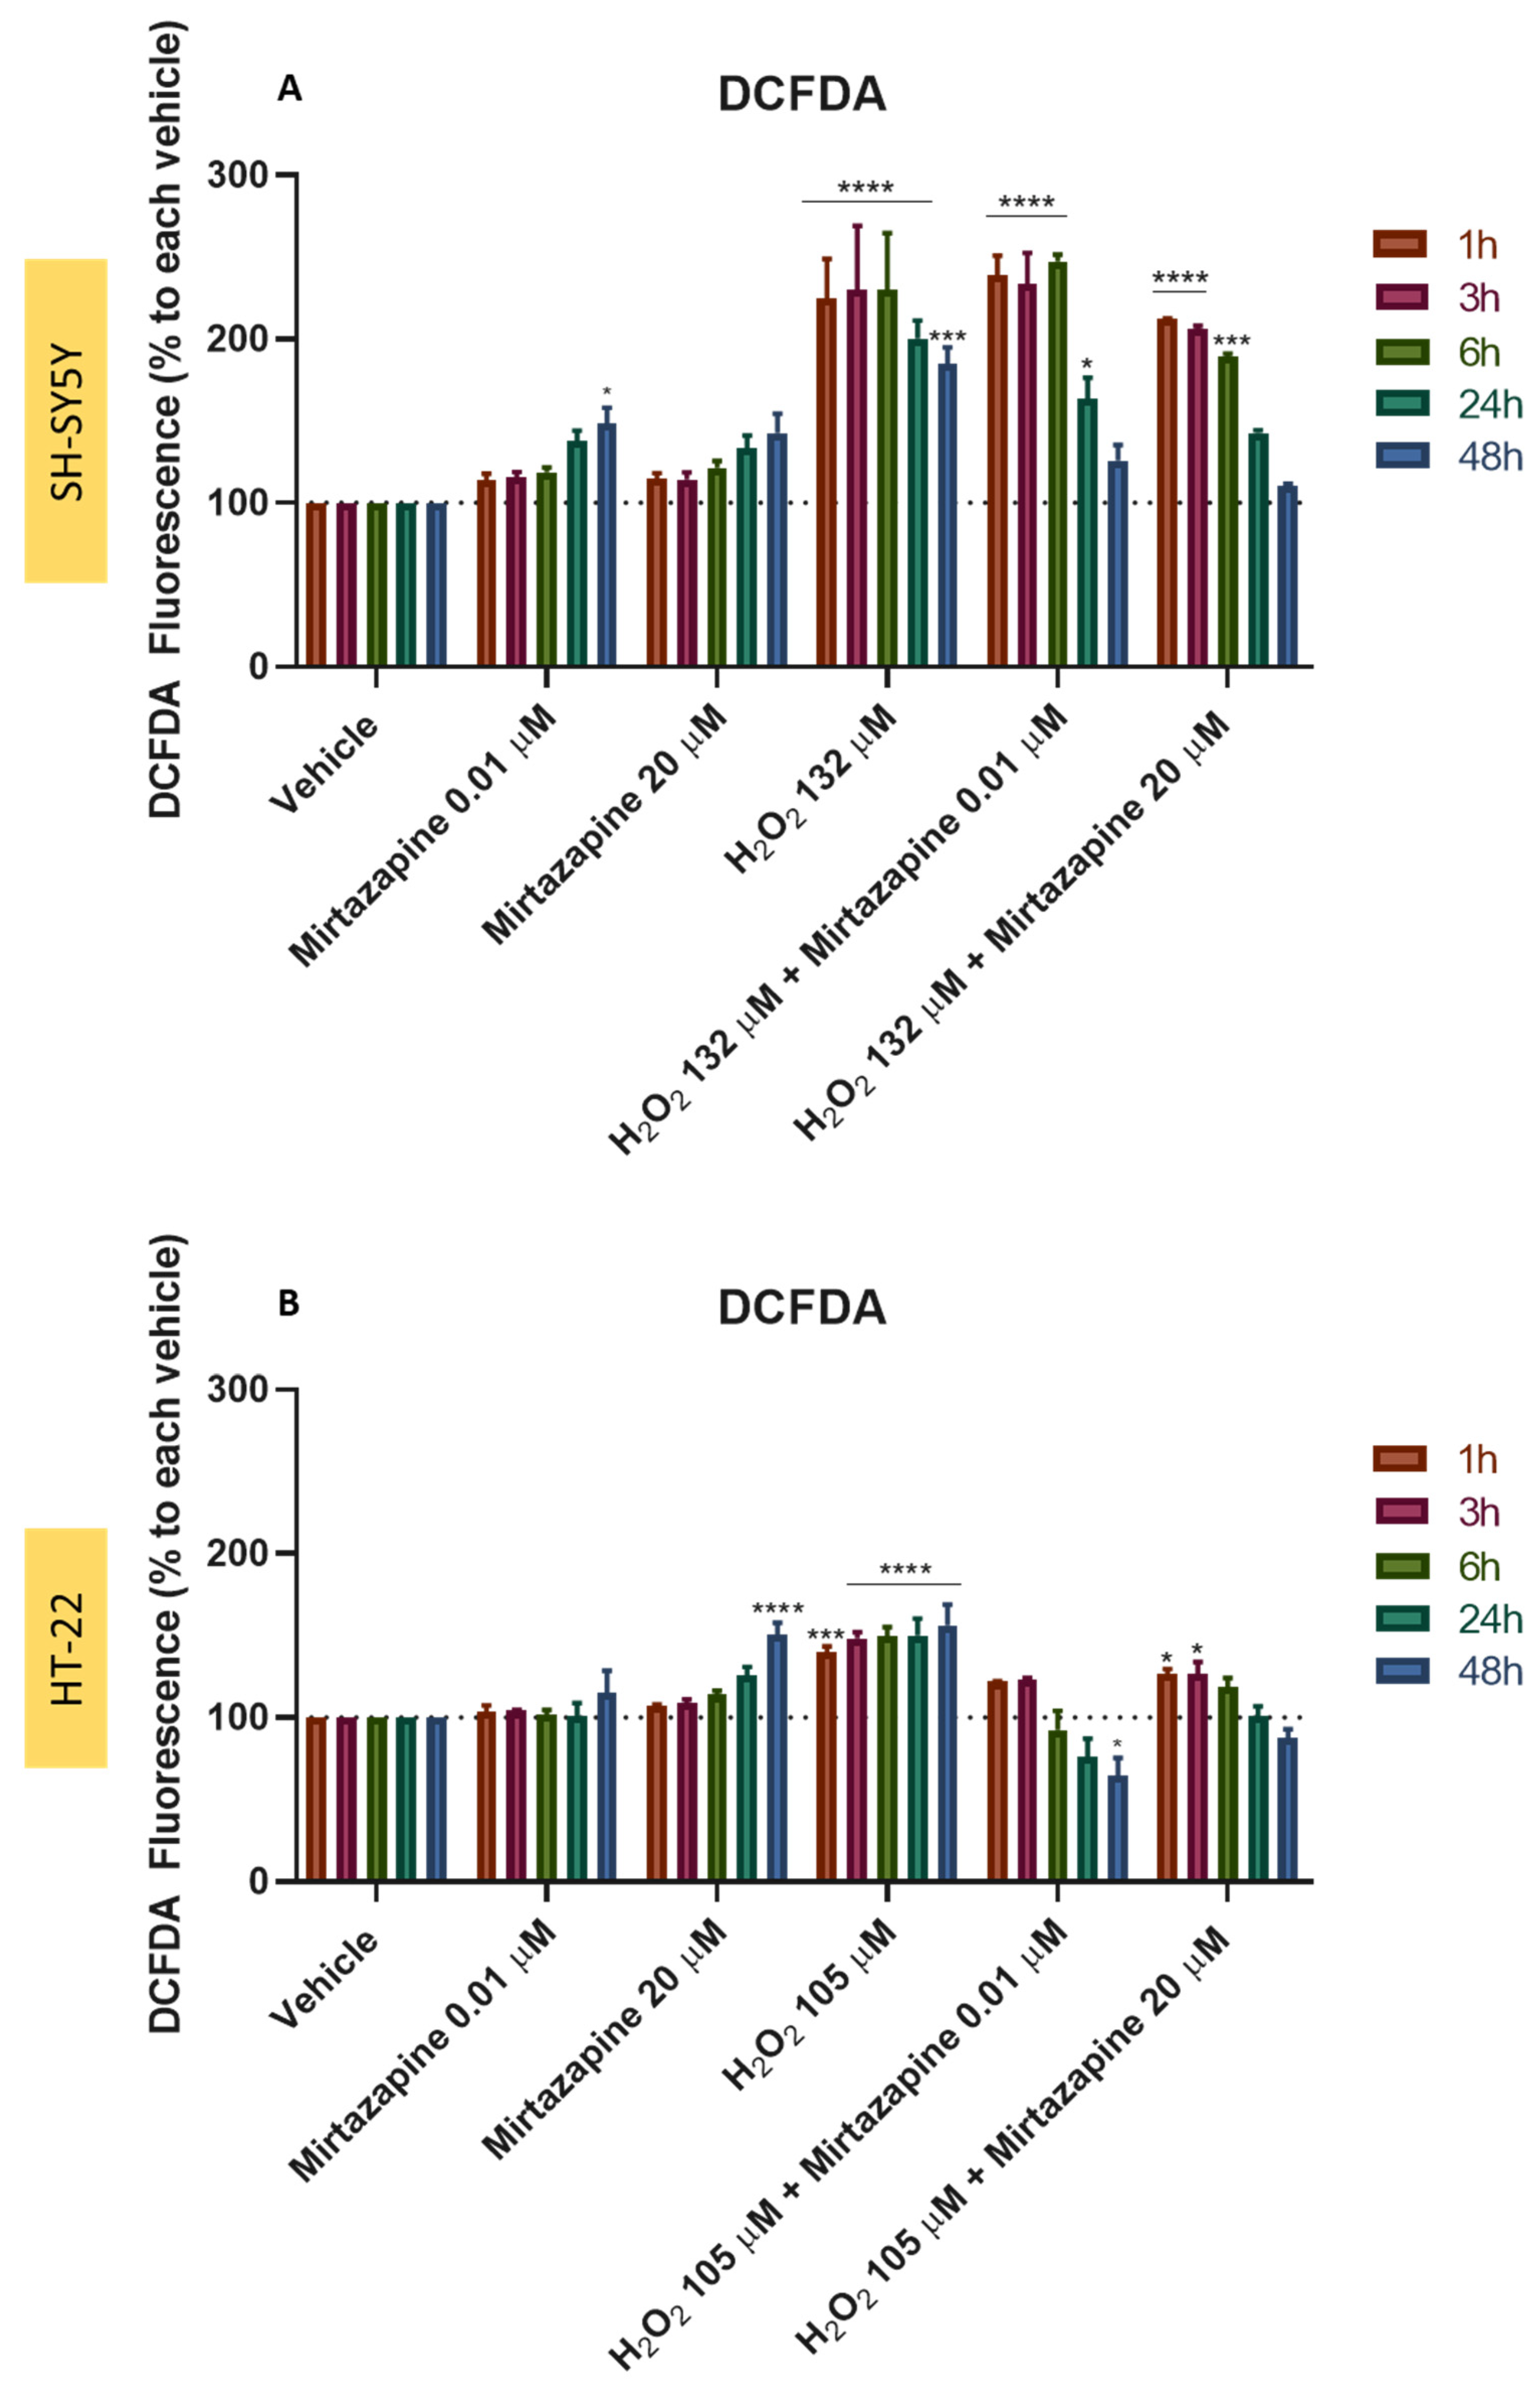
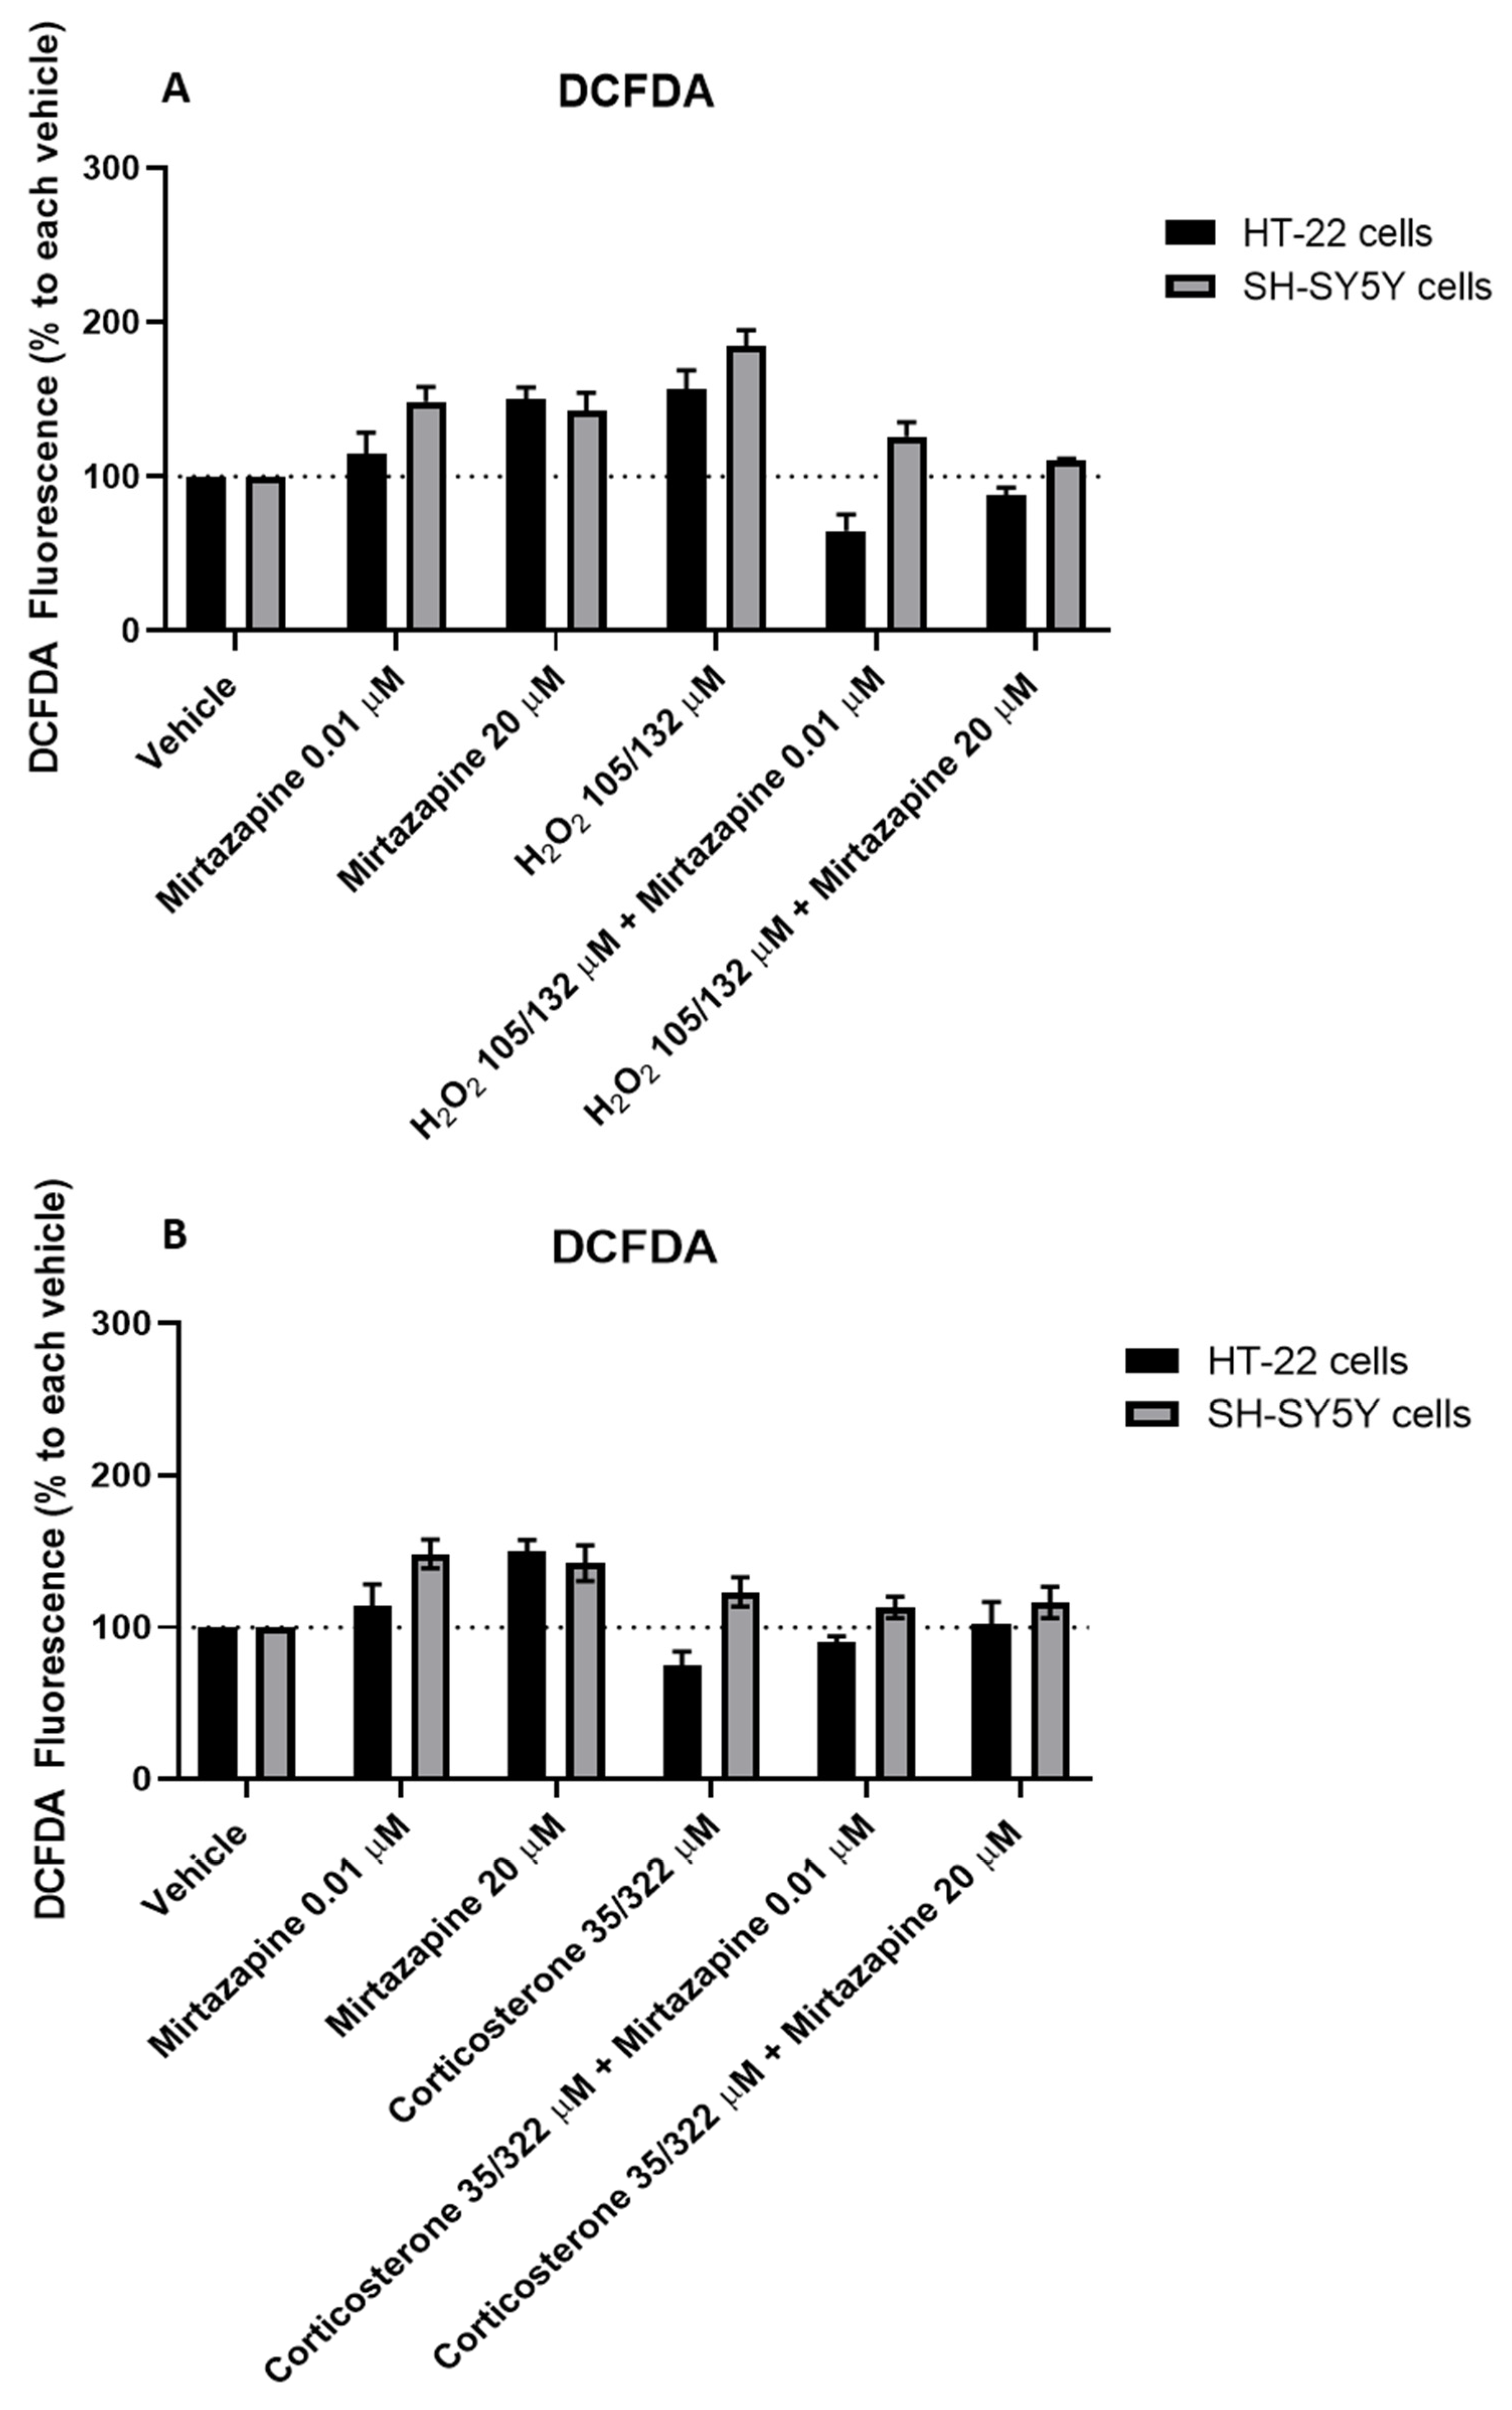
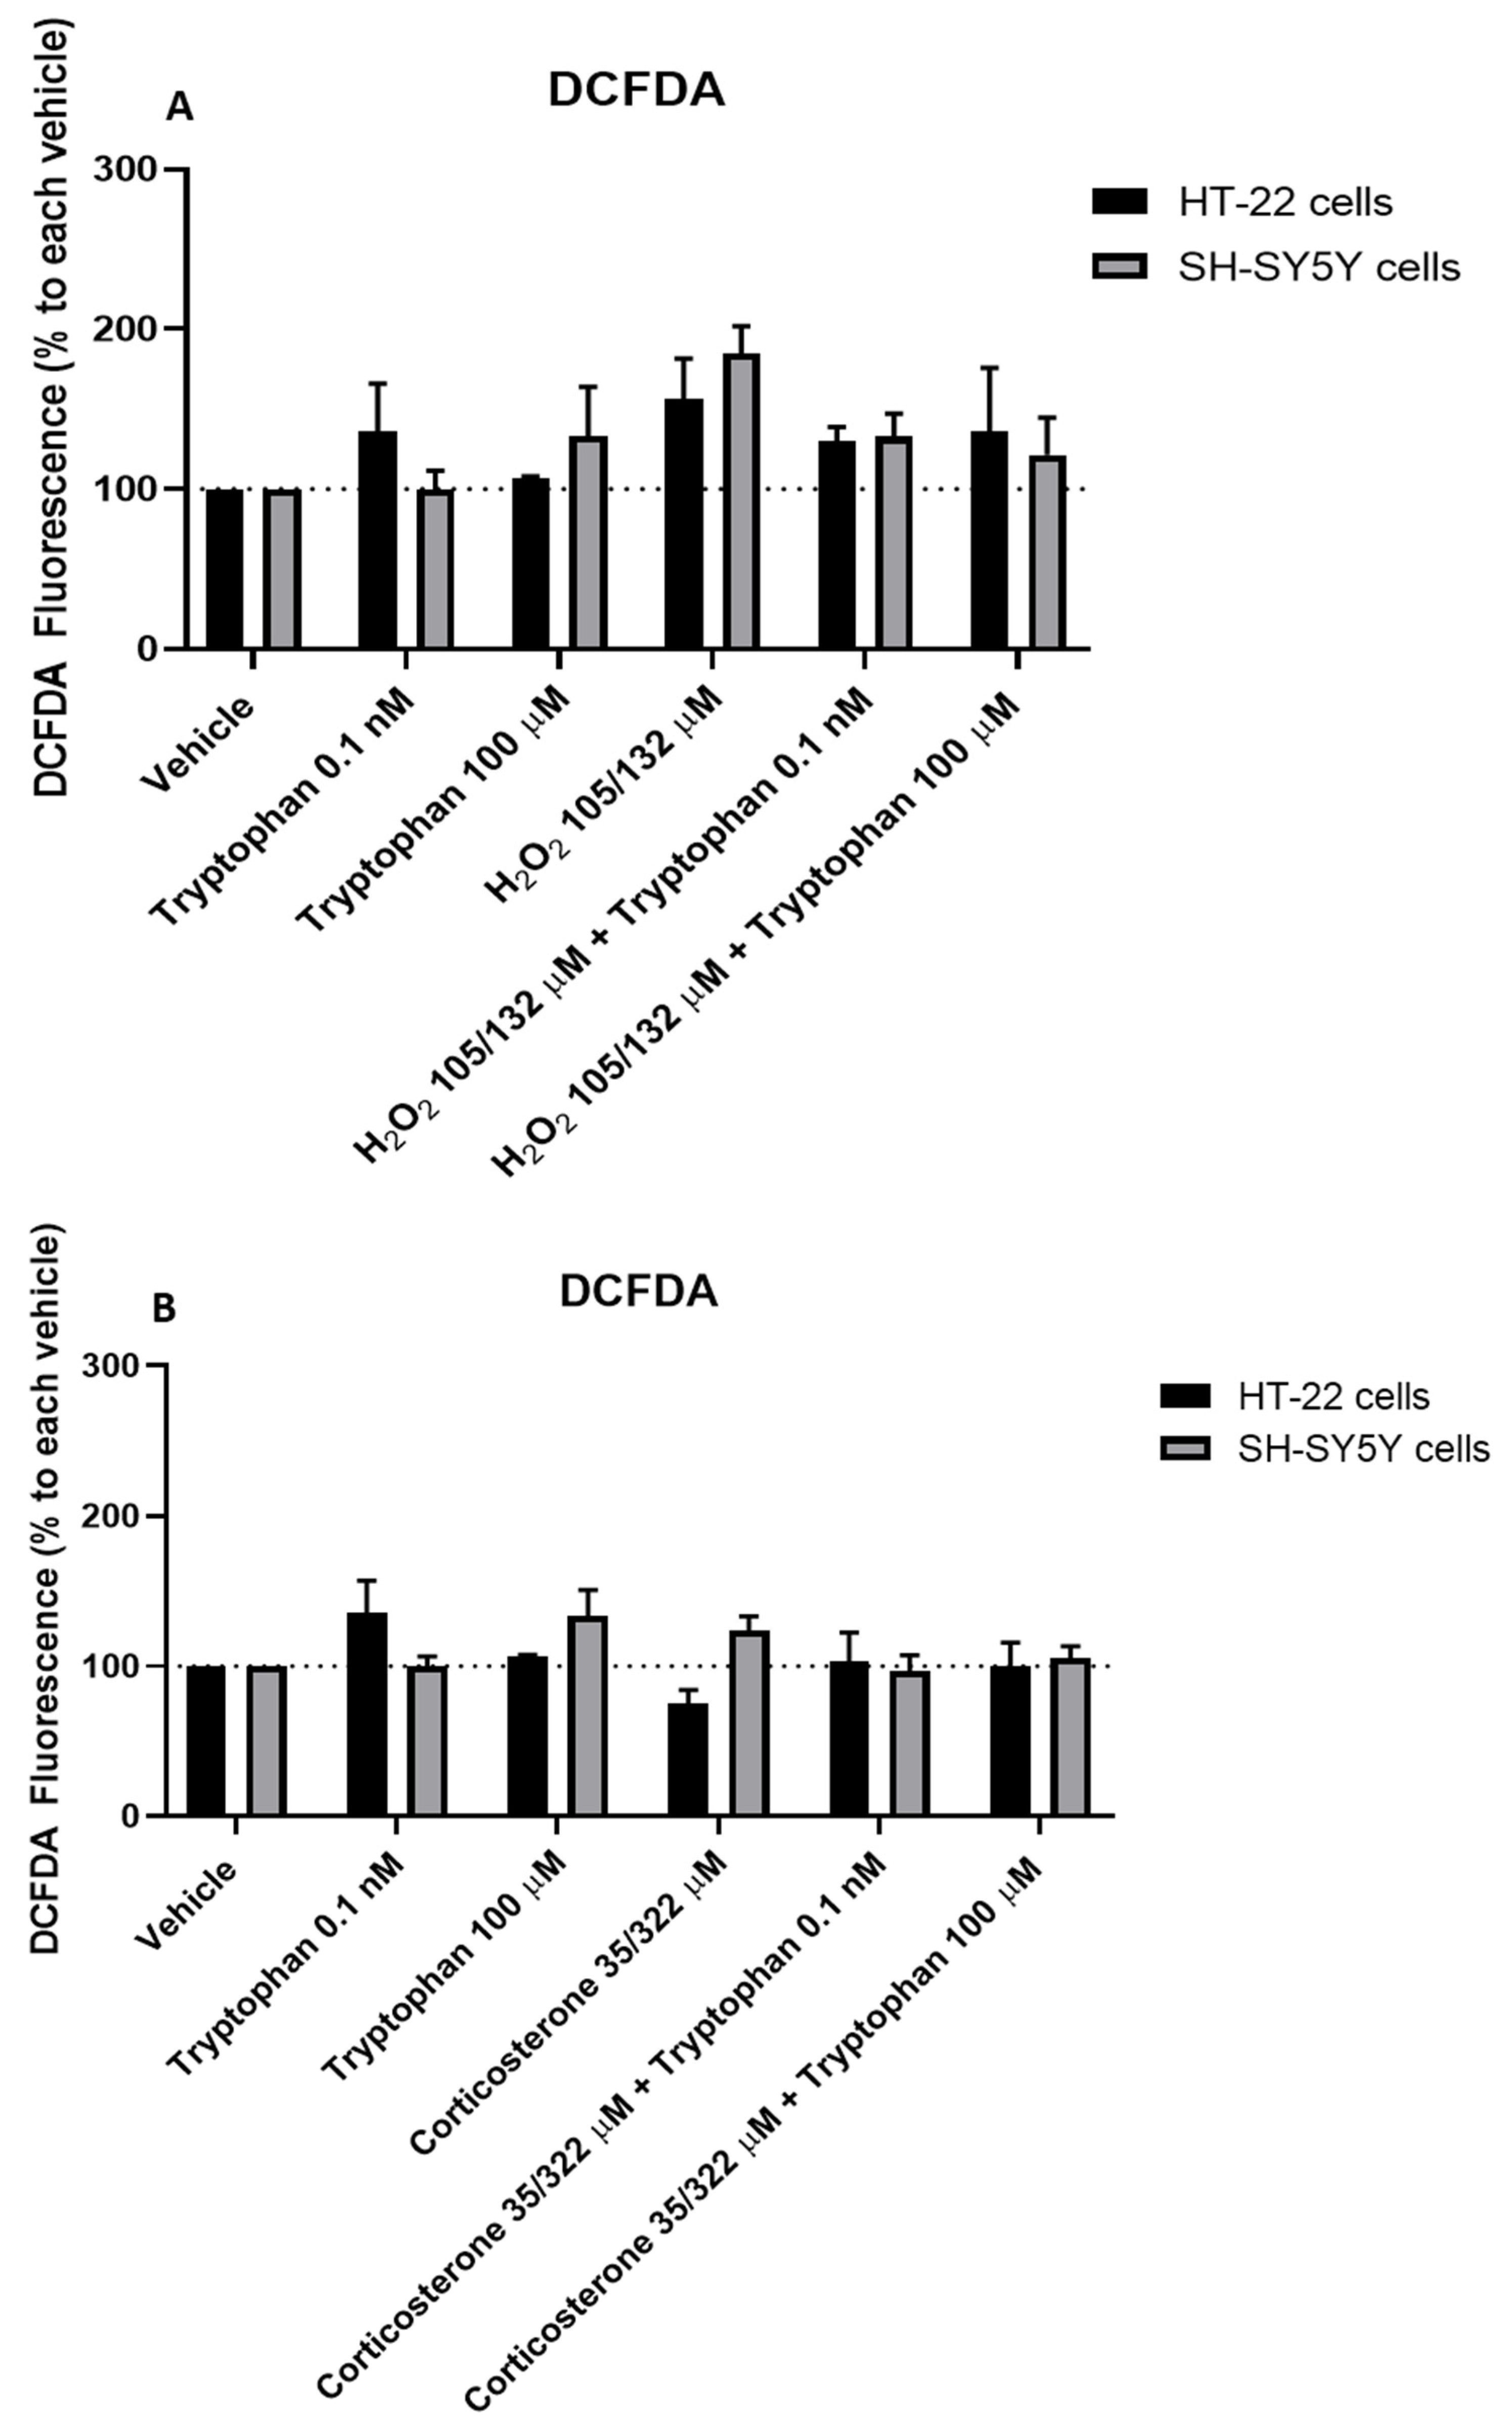
3.9. Effect of Mirtazapine Combined with H2O2 and Corticosterone on SH-SY5Y and HT-22 ROS Production

To understand the effect of H2O2, corticosterone and mirtazapine alone, as well as the combination of mirtazapine with H2O2 (Figure 17) and corticosterone (Figure 18) on SH-SY5Y and HT-22 cells ROS production, mirtazapine was applied to both cell lines in two concentrations: 0.01 μM and 20 μM, that represent both extreme tested concentrations in the cell viability studies. H2O2 was added to SH-SY5Y and HT-22 cells at a fixed concentration of 132 µM and 105 µM, respectively (mean IC50 values for both cell lines), and corticosterone was added to SH-SY5Y cells at a concentration of 322 µM and at a concentration of 35 µM for HT-22 cells (mean IC50 values) for periods of 1 h, 3 h, 6 h, 24 h, and 48 h. The percentage of ROS production (versus each vehicle, for each time) was obtained by DCFDA assay. Both compounds were added to the cells simultaneously. Figure 19 represents the comparison between the two cell lines for the time point of 48 h.
Proceeding to the analysis of the results, it is possible to conclude that mirtazapine alone led to similar DCFDA fluorescence compared to the vehicle, for all time points. However, the concentration of 20 μM led to a slight increase in ROS production, especially at 48 h. Nevertheless, H2O2 led to clearly higher levels of DCFDA fluorescence, reflecting higher ROS production. In both HT-22 and SH-SY5Y cells, the combination of mirtazapine with H2O2 decreased DCFDA fluorescence, compared to H2O2 alone (Figure 17 and Figure 19A). This highlights that mirtazapine is a good agent to counteract the harmful effects of H2O2, consistent with the cell viability assays. On the other hand, overall, corticosterone led to similar DCFDA fluorescence compared to the vehicle. However, for 24 and 48 h of incubation, it was possible to note a slight increase in DCFDA fluorescence compared to the vehicle.
In both HT-22 and SH-SY5Y cells, the combination of mirtazapine with corticosterone did not significantly change DCFDA fluorescence (Figure 18 and Figure 19B), consistent with cell viability assays. Taken together, these results highlight that mirtazapine is a potential drug to attenuate the effects of H2O2 but not the effects of corticosterone.

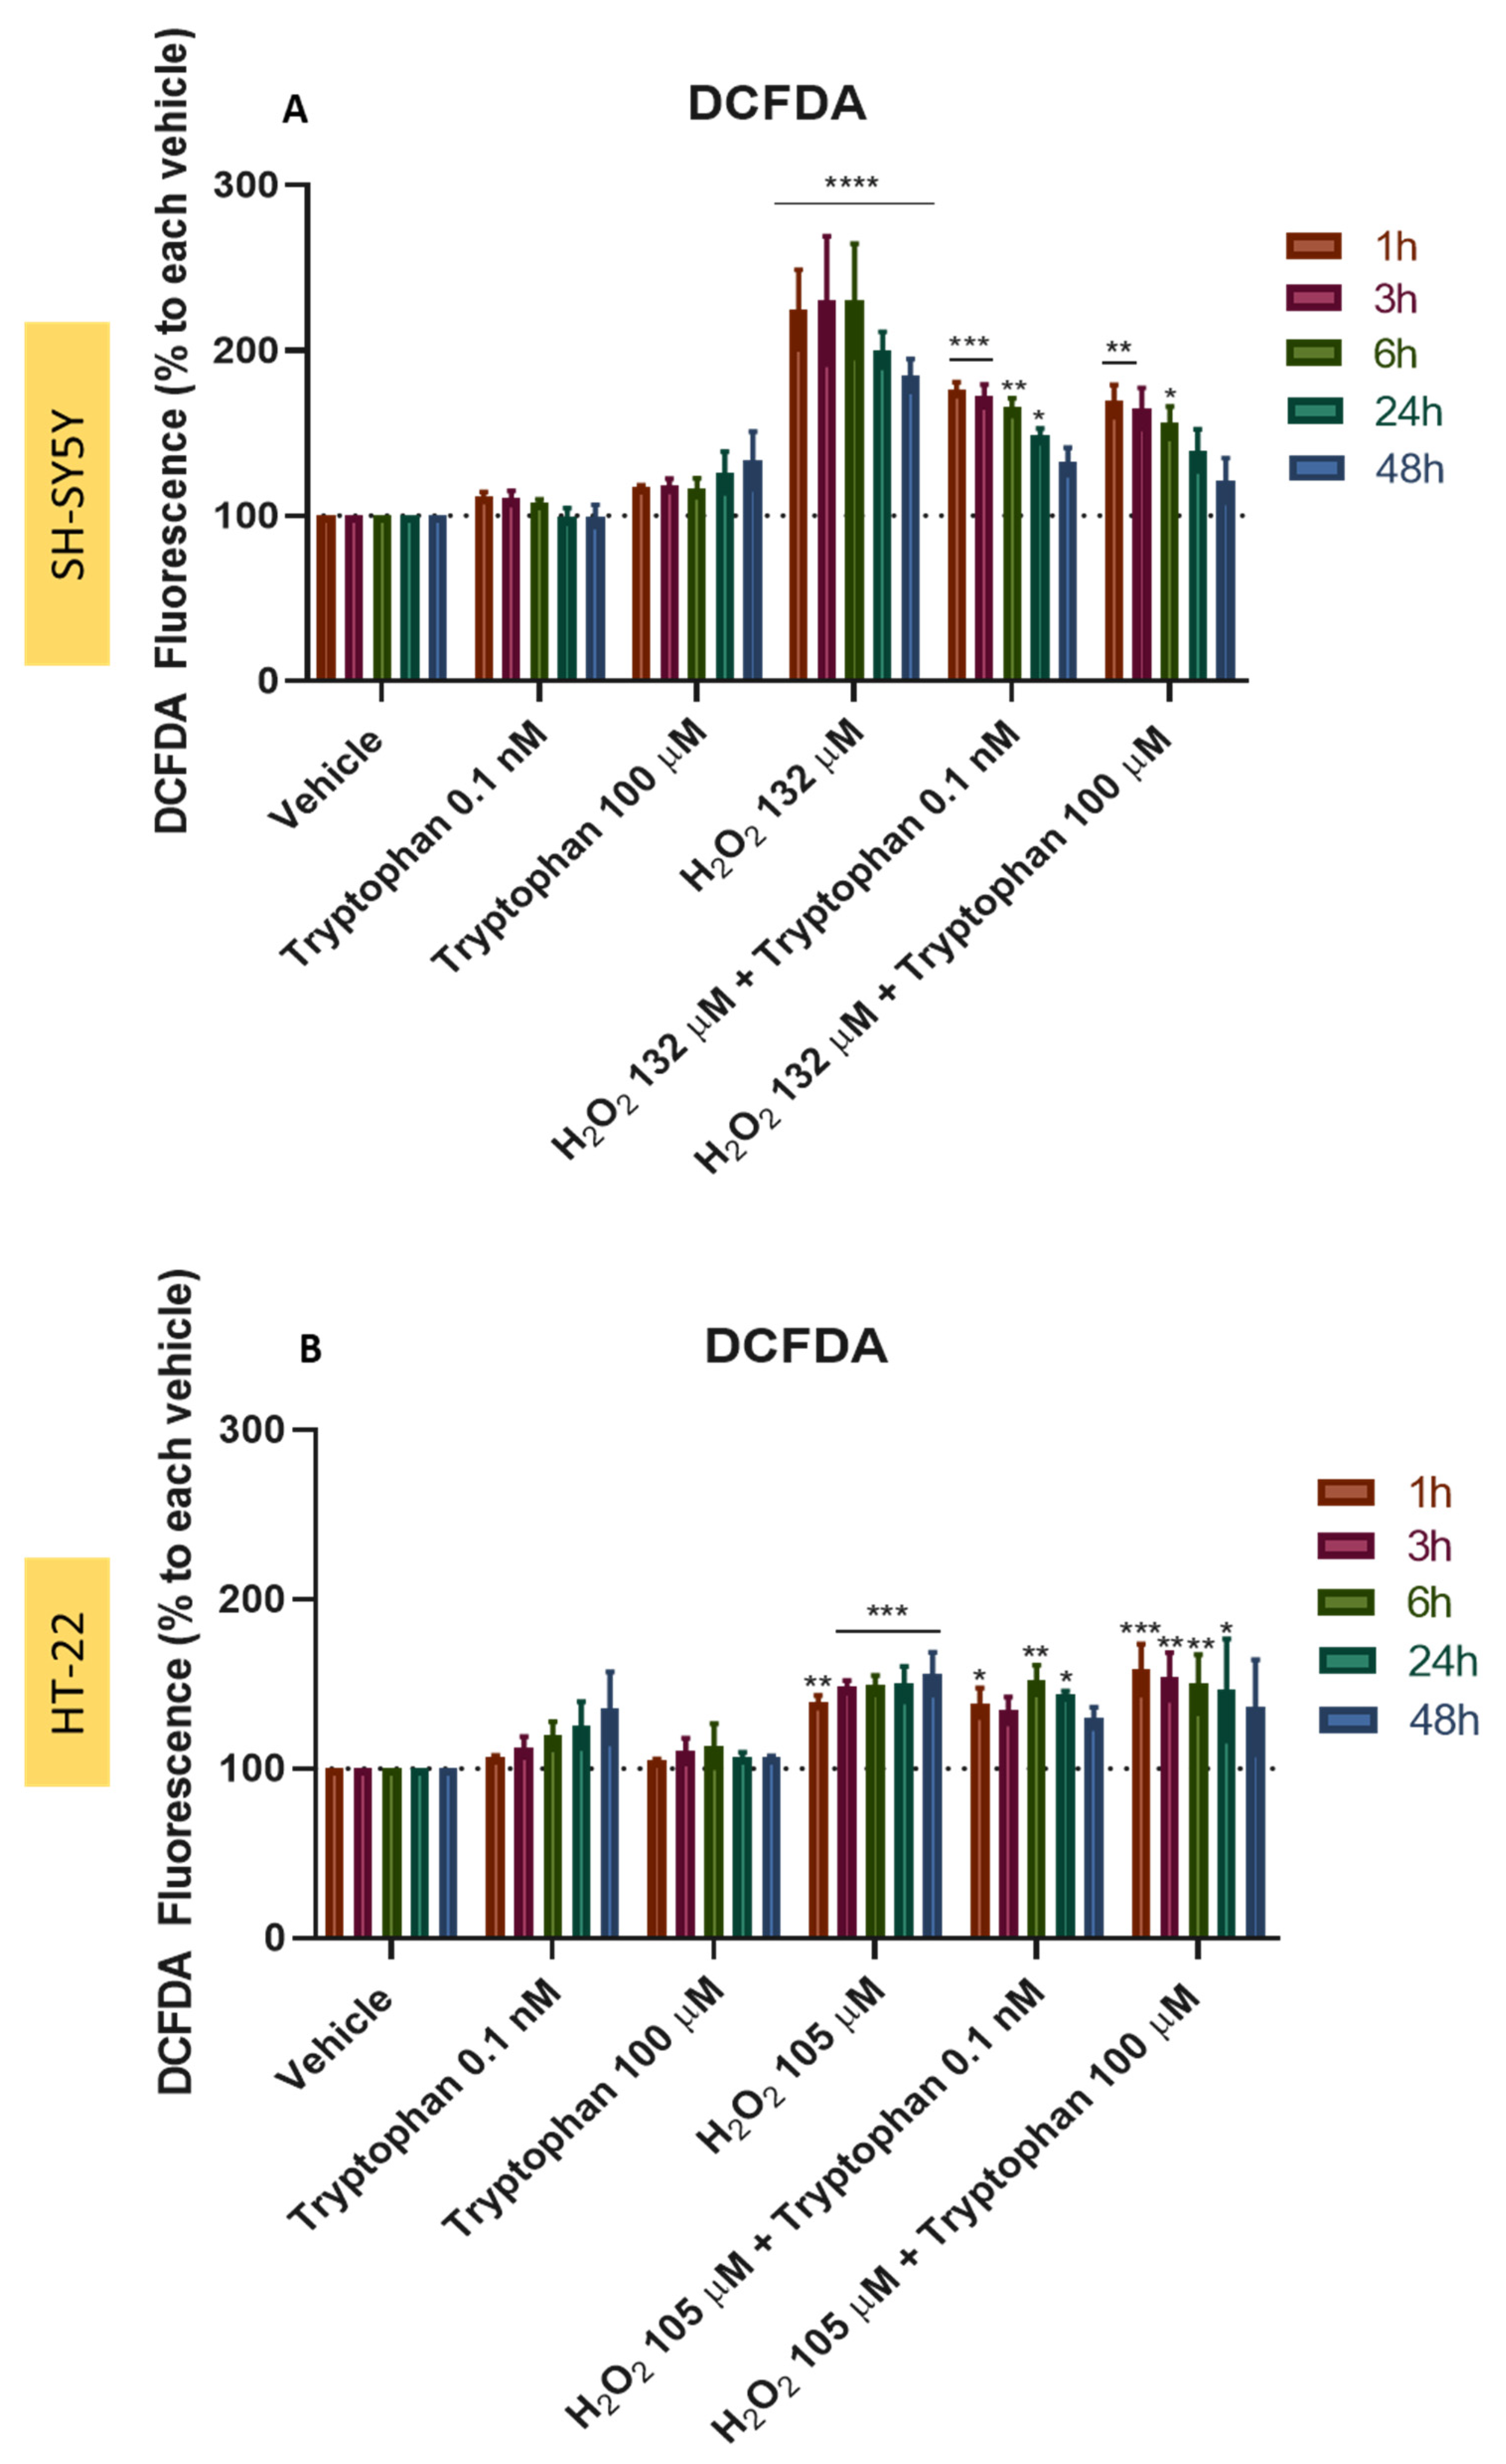
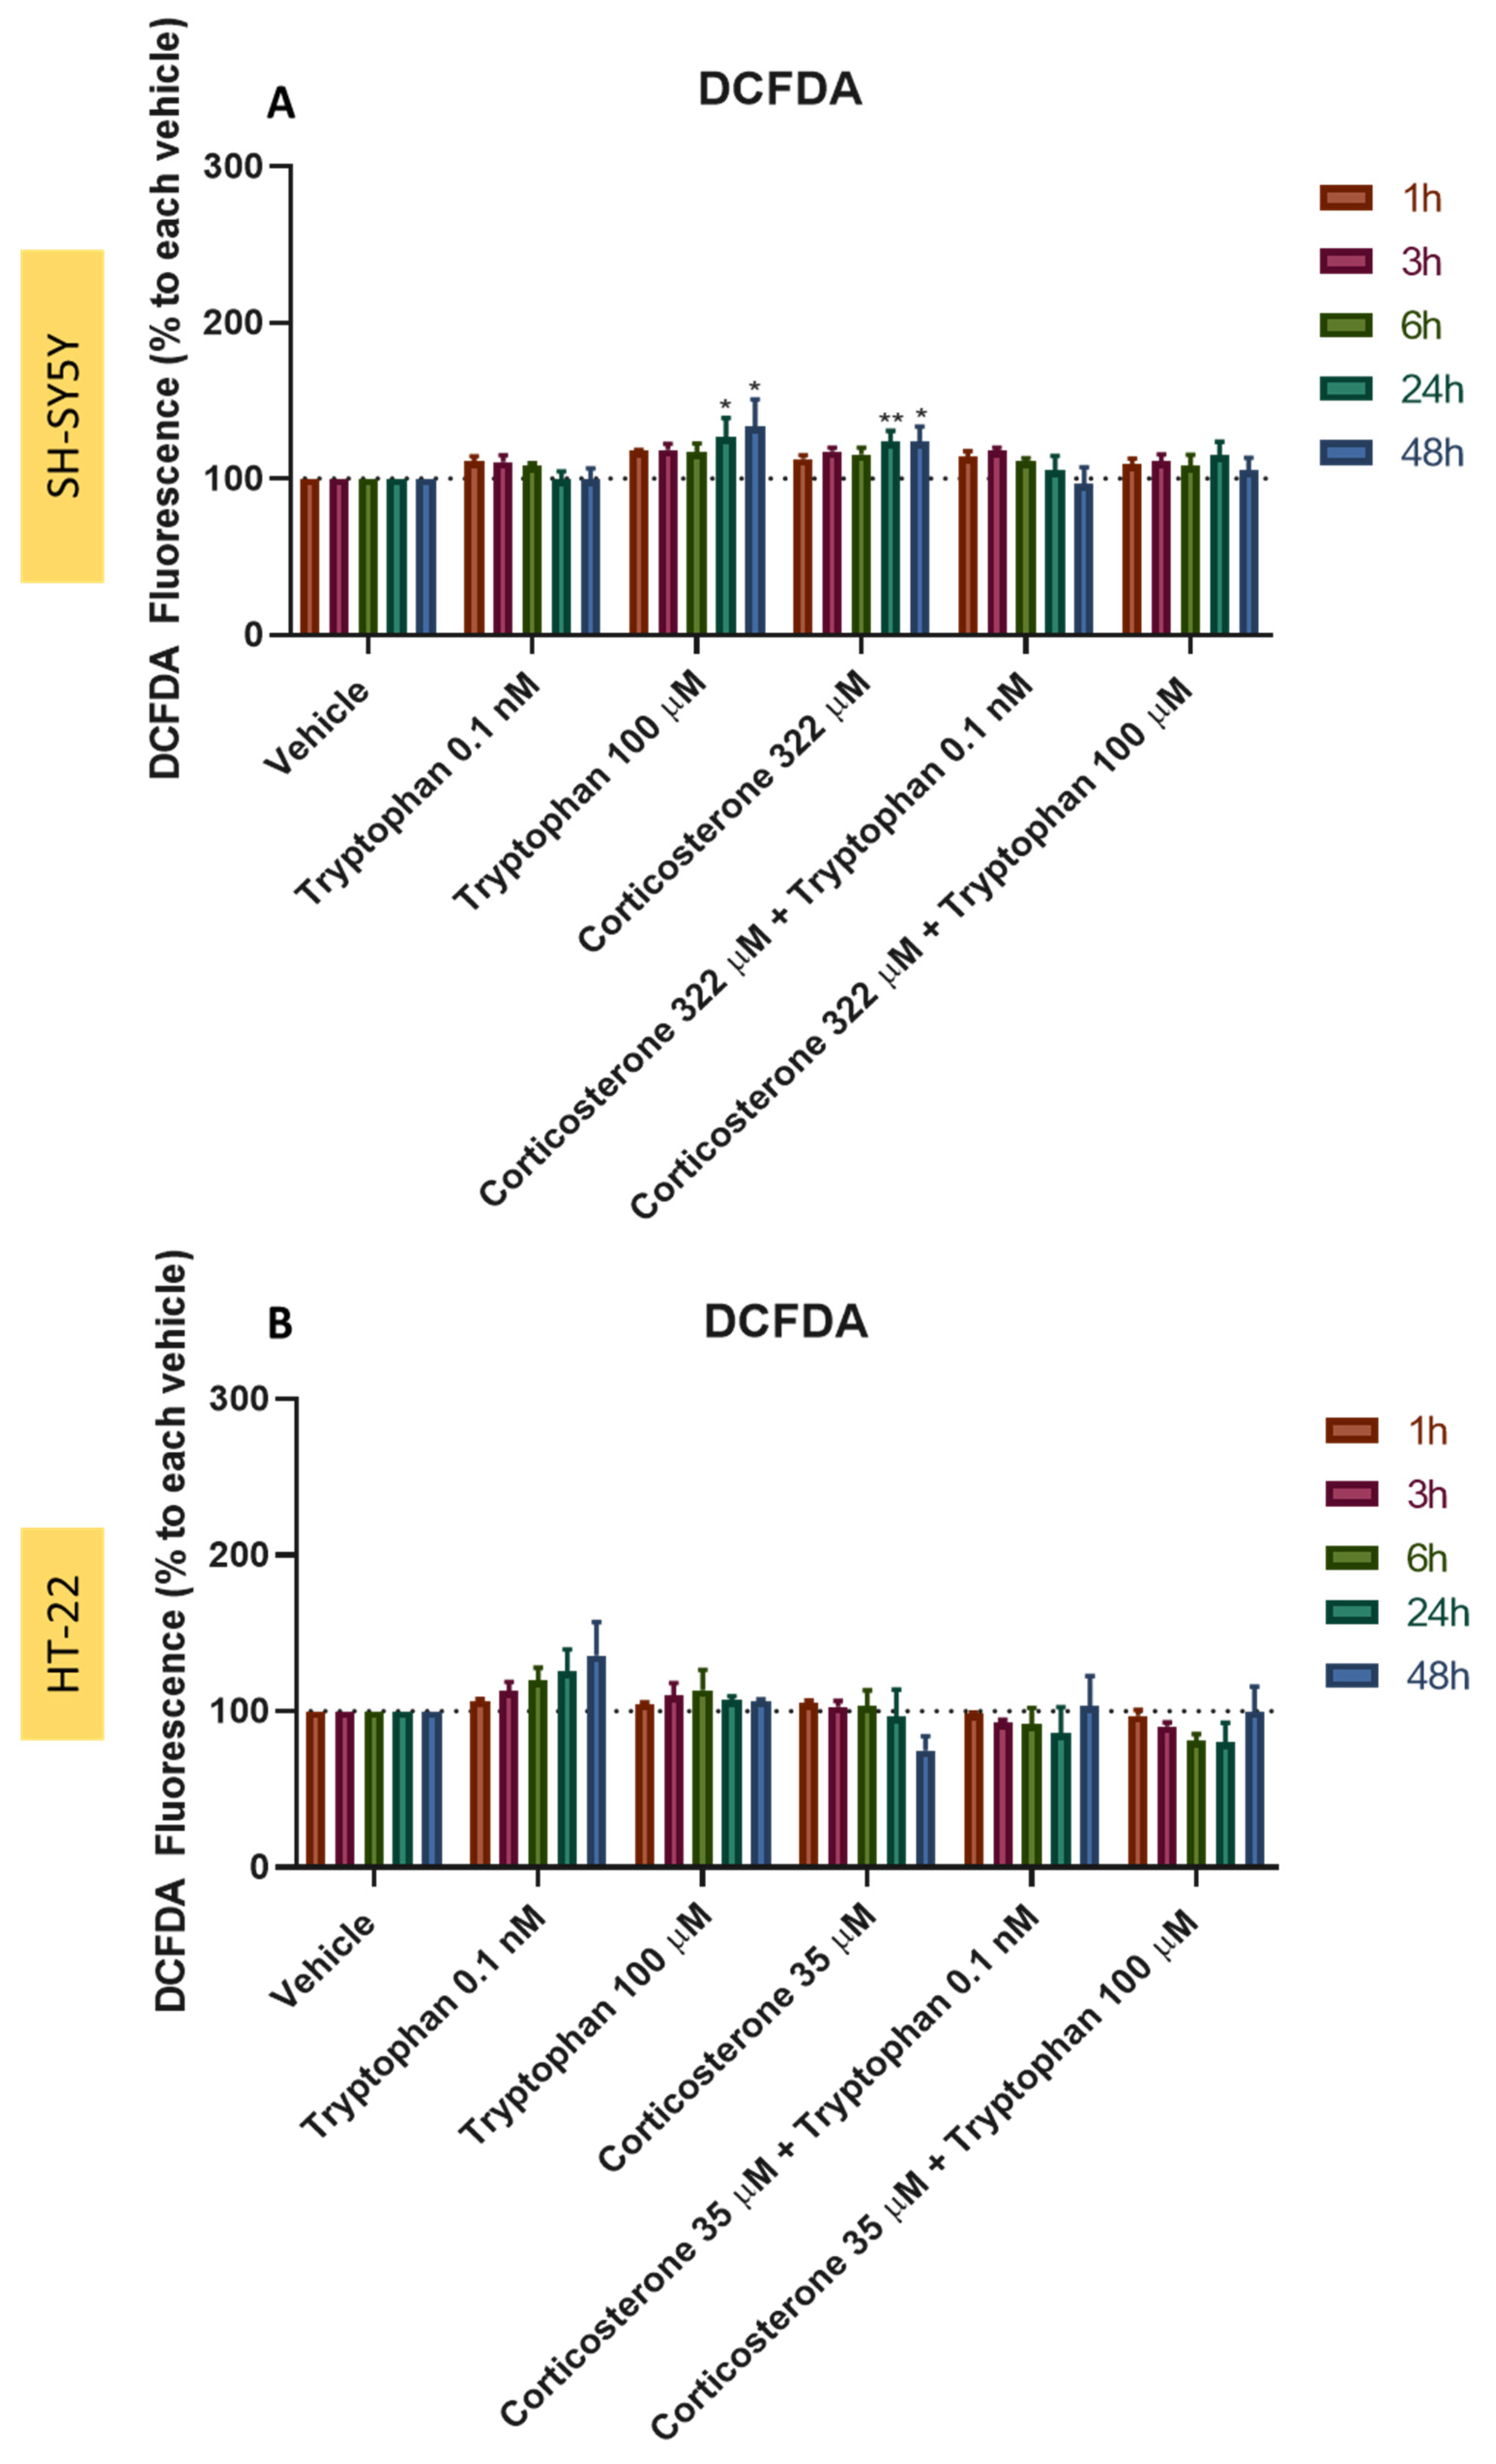
3.10. Effect of L-Tryptophan Combined with H2O2 and Corticosterone on SH-SY5Y and HT-22 ROS Production

Finally, to evaluate the effect of L-tryptophan alone, as well as the combination of L-tryptophan with H2O2 (Figure 20) and corticosterone (Figure 21) on SH-SY5Y and HT-22 cells’ ROS production, this amino acid was added to both cells in the concentrations of 0.1 nM and 100 μM, that represent both extreme tested concentrations in the previous cell viability studies. Once again, H2O2 was added to both cells in a fixed concentration of 132 µM and 105 µM, respectively, and corticosterone was added to SH-SY5Y cells in a concentration of 322 µM and in a concentration of 35 µM for HT-22 cells for periods of 1 h–48 h. The percentage of ROS production (versus each vehicle, for time point) was obtained by DCFDA assay. Figure 22 represents the comparison between the two cell lines for 48 h.
Our results reveal that L-tryptophan alone led to similar DCFDA fluorescence compared to the vehicle, for all time points. However, the concentration of 100 μM led to a slight increase in ROS production, especially at 48 h for SH-SY5Y cells, and the concentration of 0.1 nM also led to a slight increase in ROS production, especially at 48 h for HT-22 cells. Nevertheless, in both cell lines, the combination of L-tryptophan with H2O2 decreased DCFDA fluorescence, compared to H2O2 alone (Figure 20 and Figure 22A). These results demonstrate that L-tryptophan is a good agent to counteract the harmful effects of H2O2, also consistent with the cell viability assays. On the other hand, in both HT-22 and SH-SY5Y cells, the combination of L-tryptophan with corticosterone did not significantly change DCFDA fluorescence (Figure 21 and Figure 22B), also consistent with cell viability assays. Taken together, these results highlight that L-tryptophan, such as mirtazapine, is a potential compound to attenuate the effects of H2O2 but not the effects of corticosterone.

4. Discussion

Depression is a very prevalent and debilitating disease. Globally, this condition represents an important healthcare problem. New therapies, new strategies of study, and new insights about this complex disease are urgent to be developed [2]. Thus, this work aimed to study this disease using different cell lines (SH-SY5Y and HT-22 cells) and focusing on different mechanisms, particularly cellular viability and ROS production by the cells, avoiding animal models. To do that, we used well-characterized inducers of stress (corticosterone and H2O2), related to the pathophysiology of depression, as well as the potential stress reversers mirtazapine (a clinically characterized antidepressant) and L-tryptophan (precursor of 5-HT synthesis), as described in the Section 1. Previously, we developed a cellular model of depression in SH-SY5Y cells, with H2O2 as a stress inducer and mirtazapine as a stress reverser [22]. Now, using the same principle, we tested this model in HT-22 cells, but now including the assessment of intracellular ROS production by the cells. Additionally, we also tested corticosterone as another stress inducer and L-tryptophan as another stress reverser. Indeed, our results revealed that H2O2 led to cellular damage in both SH-SY5Y and HT-22 cells, as well as high levels of ROS production, consistent with the previous literature reports [17,18,30]. Overall, this damage was attenuated, in the two cell lines, with the application of both mirtazapine and L-tryptophan, suggesting that serotonergic pathways might be involved in fighting oxidative stress in depression. This hypothesis is highlighted by the fact that both mirtazapine and L-tryptophan did not significantly attenuate cell damage caused by corticosterone in both cells, but only attenuated the damage caused by H2O2, characterized by being a potent inducer of oxidative stress. Indeed, studies report that mirtazapine may have antioxidant capabilities, protecting cells against oxidative stress and DNA damage [19,31,32]. Additionally, other studies demonstrated that dietary tryptophan can attenuate the oxidative stress in the liver, reflecting some antioxidant capability [33]. Indeed, other studies also demonstrate that serotonergic pathways are involved in antioxidant mechanisms in depression, attenuating hippocampal oxidative damage induced by 5-HT depletion in mice [34].
Regarding corticosterone, this compound also led to cellular damage in both SH-SY5Y and HT-22 cells, consistent with the literature reports [35,36]. Additionally, regarding ROS production, overall, corticosterone led to low levels of production compared to H2O2. The effect of cellular damage by corticosterone was more pronounced on HT-22 cells, explained by the fact that these are mice cells, responding in a better way to corticosterone (primary adrenal corticosteroid in rodents [37]). However, the results obtained with the use of corticosterone in combination with mirtazapine and L-tryptophan revealed that overall, neither agent alleviated the stress induced by corticosterone, opposing to the effects observed with H2O2. Indeed, in HT-22 cells, there were no significant differences between corticosterone alone and corticosterone combined with mirtazapine or L-tryptophan. On the other side, in SH-SY5Y cells, the combination of mirtazapine or L-tryptophan with corticosterone led to more cell viability decrease, compared to corticosterone alone. There are some explanations that may be plausible to explain these findings, particularly the differences between the two cell lines. Indeed, HT-22 cells are hippocampal, mice, and non-tumoral cells [38], whereas SH-SY5Y are human neuroblastoma cells [39]. Additionally, because corticosterone is the main corticosteroid hormone in mice [37], HT-22 cells may be more responsive to corticosterone than SH-SY5Y cells, which may have more difficulty in metabolizing/ responding to this agent. Possibly, in SH-SY5Y cells, due to the difficulty in metabolization, corticosterone may accumulate in combination with mirtazapine or L-tryptophan, leading to the observed synergic effects. Nevertheless, both mirtazapine and L-tryptophan did not counteract the effects caused by corticosterone and one explanation may be the role of these agents in oxidative stress, which was not significantly present in the cells exposed to corticosterone. Future studies to explore the reason for mirtazapine and L-tryptophan’s lack of efficiency in reverting corticosterone-induced cellular stress may be important and relevant.
Taken together, our main findings demonstrate that H2O2 is a good stress inducer for both HT-22 and SH-SY5Y cells. Both mirtazapine and L-tryptophan can counteract the harmful effects of this agent, revealing that these agents may have an important role in oxidative stress relief. It is important to note that mirtazapine and L-tryptophan are agents that interact with serotonergic pathways, highlighting the role of serotonin in the oxidative stress present in depression. On the other hand, the corticosterone-induced stress to both cell lines was not alleviated by mirtazapine or L-tryptophan, supporting the hypothesis that these two agents are important mainly in the regulation of oxidative stress in cells. Figure 23 represents a summary of the findings of this work.
This work allows us the study depression in a molecular, faster, simplified, and reproducible way, leading to the possibility of a future screening of compounds that may be used in the treatment of depression by, for example, reducing oxidative stress. Nevertheless, it is important to note that depression is an extremely complex behavioral disease and several studies, including animal studies, are necessary to be performed, particularly in more advanced stages of investigation.

Supplementary Materials

The following supporting information can be downloaded at: https://www.mdpi.com/article/10.3390/ijtm2030036/s1. Figure S1: Concentration-response curves for increasing concentrations of H2O2 on the viability of (A,B) SH-SY5Y cells and (C,D) HT-22 cells, for a period of 48 h, obtained by (A,C) MTT and (B,D) NR assays. The results are expressed as the percentage of each respective vehicle and represent the mean ± SEM of 3–6 independent experiments. Figure S2: Concentration-response curves for increasing concentrations of corticosterone on the viability of (A,B) SH-SY5Y cells and (C,D) HT-22 cells, for a period of 48 h, obtained by (A,C) MTT and (B,D) NR assays. The results are expressed as the percentage of each respective vehicle and represent the mean ± SEM of 3–6 independent experiments.

Author Contributions

Conceptualization, N.V., A.S.C. and A.C.; methodology A.S.C., A.C. and N.V.; formal analysis, A.S.C. and N.V.; investigation, A.S.C., A.C. and N.V.; resources, N.V.; writing—original draft preparation, A.S.C.; writing—review and editing, A.S.C., A.C. and N.V.; supervision, N.V.; project administration, N.V.; funding acquisition, N.V. All authors have read and agreed to the published version of the manuscript.

Funding

This research was financed by FEDER—Fundo Europeu de Desenvolvimento Regional funds through the COMPETE 2020—Operational Programme for Competitiveness and Internationalisation (POCI), Portugal 2020, and by Portuguese funds through Fundação para a Ciência e a Tecnologia (FCT) in the framework of the project IF/00092/2014/CP1255/CT0004 and CHAIR in Onco-Innovation.

Institutional Review Board Statement

Not applicable.

Informed Consent Statement

Not applicable.

Data Availability Statement

Not applicable.

Acknowledgments

This article was supported by National Funds through FCT—Fundação para a Ciência e a Tecnologia, I.P., within CINTESIS, R&D Unit (reference UIDB/4255/2020). A.S.C. acknowledges FCT for funding her PhD grant (SFRH/BD/146093/2019). N.V. also thanks Paula Serrão from Unity of Pharmacology and Therapeutics, Department of Biomedicine, Faculty of Medicine, University of Porto for supporting with DCFDA assay/fluorescence.

Conflicts of Interest

The authors declare no conflict of interest.

References

  1. Nuggerud-Galeas, S.; Sáez-Benito Suescun, L.; Berenguer Torrijo, N.; Sáez-Benito Suescun, A.; Aguilar-Latorre, A.; Magallón Botaya, R.; Oliván Blázquez, B. Analysis of depressive episodes, their recurrence and pharmacologic treatment in primary care patients: A retrospective descriptive study. PLoS ONE 2020, 15, e0233454. [Google Scholar] [CrossRef] [PubMed]
  2. Otte, C.; Gold, S.M.; Penninx, B.W.; Pariante, C.M.; Etkin, A.; Fava, M.; Mohr, D.C.; Schatzberg, A.F. Major depressive disorder. Nat. Rev. Dis. Prim. 2016, 2, 16065. [Google Scholar] [CrossRef] [PubMed]
  3. Jantas, D. Cell-Based Systems of Depression: An Overview. In [3] Medicine in Depression; Springer International Publishing: Cham, Switzerland, 2016; pp. 75–117. ISBN 9783319140216. [Google Scholar]
  4. Ogawa, Y.; Kobayashi, T.; Nishioka, A.; Kariya, S.; Ohnishi, T.; Hamasato, S.; Seguchi, H.; Yoshida, S. Reactive oxygen species-producing site in hydrogen peroxide-induced apoptosis of human peripheral T cells: Involvement of lysosomal membrane destabilization. Int. J. Mol. Med. 2004, 13, 383–388. [Google Scholar] [CrossRef] [PubMed]
  5. Chen, L.; Liu, L.; Yin, J.; Luo, Y.; Huang, S. Hydrogen peroxide-induced neuronal apoptosis is associated with inhibition of protein phosphatase 2A and 5, leading to activation of MAPK pathway. Int. J. Biochem. Cell Biol. 2009, 41, 1284–1295. [Google Scholar] [CrossRef] [PubMed]
  6. Bajpai, A.; Verma, A.K.; Srivastava, M.; Srivastava, R. Oxidative Stress and Major Depression. J. Clin. Diagn. Res. 2014, 8, CC04–CC07. [Google Scholar] [CrossRef]
  7. Lopresti, A.L.; Maker, G.L.; Hood, S.D.; Drummond, P.D. A review of peripheral biomarkers in major depression: The potential of inflammatory and oxidative stress biomarkers. Prog. Neuro-Psychopharmacol. Biol. Psychiatry 2014, 48, 102–111. [Google Scholar] [CrossRef]
  8. Horowitz, M.A.; Zunszain, P.A.; Anacker, C.; Musaelyan, K.; Pariante, C.M. Glucocorticoids and Inflammation: A Double-Headed Sword in Depression? Inflamm. Psychiatry 2013, 28, 127–143. [Google Scholar] [CrossRef]
  9. Russell, G.; Lightman, S. The human stress response. Nat. Rev. Endocrinol. 2019, 15, 525–534. [Google Scholar] [CrossRef]
  10. Qin, D.; Li, Z.; Li, Z.; Wang, L.; Hu, Z.; Lü, L.; Wang, Z.; Liu, Y.; Yin, Y.; Li, Z.; et al. Chronic Glucocorticoid Exposure Induces Depression-Like Phenotype in Rhesus macaque (Macaca mulatta). Front. Neurosci. 2019, 13, 188. [Google Scholar] [CrossRef]
  11. Berger, S.; Gureczny, S.; Reisinger, S.N.; Horvath, O.; Pollak, D.D. Effect of Chronic Corticosterone Treatment on Depression-Like Behavior and Sociability in Female and Male C57BL/6N Mice. Cells 2019, 8, 1018. [Google Scholar] [CrossRef] [Green Version]
  12. Yang, G.; Li, J.; Cai, Y.; Yang, Z.; Li, R.; Fu, W. Glycyrrhizic Acid Alleviates 6-Hydroxydopamine and Corticosterone-Induced Neurotoxicity in SH-SY5Y Cells Through Modulating Autophagy. Neurochem. Res. 2018, 43, 1914–1926. [Google Scholar] [CrossRef] [PubMed]
  13. Duksal, F.; Kilic, I.; Tufan, A.C.; Akdogan, I. Effects of different corticosteroids on the brain weight and hippocampal neuronal loss in rats. Brain Res. 2009, 1250, 75–80. [Google Scholar] [CrossRef] [PubMed]
  14. Zhang, Y.; He, Y.; Deng, N.; Chen, Y.; Huang, J.; Xie, W. Protective effect of resveratrol against corticosterone-induced neurotoxicity in Pc12 cells. Transl. Neurosci. 2019, 10, 235–240. [Google Scholar] [CrossRef] [PubMed]
  15. Yu, Z.; Kong, D.; Liang, Y.; Zhao, X.; Du, G. Protective effects of VMY-2-95 on corticosterone-induced injuries in mice and cellular models. Acta Pharm. Sin. B 2021, 11, 1903–1913. [Google Scholar] [CrossRef] [PubMed]
  16. Lee, W.J.; Lee, G.H.; Hur, J.; Lee, H.G.; Kim, E.; Won, J.P.; Cho, Y.; Choi, M.J.; Seo, H.G. Taurine and Ginsenoside Rf Induce BDNF Expression in SH-SY5Y Cells: A Potential Role of BDNF in Corticosterone-Triggered Cellular Damage. Molecules 2020, 25, 2819. [Google Scholar] [CrossRef] [PubMed]
  17. Park, H.R.; Lee, H.; Park, H.; Jeon, J.W.; Cho, W.-K.; Ma, J.Y. Neuroprotective effects of Liriope platyphylla extract against hydrogen peroxide-induced cytotoxicity in human neuroblastoma SH-SY5Y cells. BMC Complement. Altern. Med. 2015, 15, 171. [Google Scholar] [CrossRef] [PubMed]
  18. Zhao, X.; Fang, J.; Li, S.; Gaur, U.; Xing, X.; Wang, H.; Zheng, W. Artemisinin Attenuated Hydrogen Peroxide (H2O2)-Induced Oxidative Injury in SH-SY5Y and Hippocampal Neurons via the Activation of AMPK Pathway. Int. J. Mol. Sci. 2019, 20, 2680. [Google Scholar] [CrossRef] [PubMed]
  19. Lieberknecht, V.; Engel, D.; Rodrigues, A.L.S.; Gabilan, N.H. Neuroprotective effects of mirtazapine and imipramine and their effect in pro- and anti-apoptotic gene expression in human neuroblastoma cells. Pharmacol. Rep. 2020, 72, 563–570. [Google Scholar] [CrossRef] [PubMed]
  20. Cai, L.; Wang, H.; Li, Q.; Qian, Y.; Yao, W. Salidroside inhibits H2O2-induced apoptosis in PC 12 cells by preventing cytochrome c release and inactivating of caspase cascade. Acta Biochim. Biophys. Sin. 2008, 40, 796–802. [Google Scholar] [CrossRef]
  21. Wang, C.-M.; Yang, C.-Q.; Cheng, B.-H.; Chen, J.; Bai, B. Orexin-A protects SH-SY5Y cells against H2O2-induced oxidative damage via the PI3K/MEK 1/2 /ERK 1/2 signaling pathway. Int. J. Immunopathol. Pharmacol. 2018, 32, 205873841878573. [Google Scholar] [CrossRef] [Green Version]
  22. Correia, A.S.; Fraga, S.; Teixeira, J.P.; Vale, N. Cell Model of Depression: Reduction of Cell Stress with Mirtazapine. Int. J. Mol. Sci. 2022, 23, 4942. [Google Scholar] [CrossRef] [PubMed]
  23. Correia, A.S.; Vale, N. Antidepressants in Alzheimer’s Disease: A Focus on the Role of Mirtazapine. Pharmaceuticals 2021, 14, 930. [Google Scholar] [CrossRef] [PubMed]
  24. Cowen, P.J.; Browning, M. What has serotonin to do with depression? World Psychiatry 2015, 14, 158–160. [Google Scholar] [CrossRef]
  25. Höglund, E.; Øverli, Ø.; Winberg, S. Tryptophan metabolic pathways and brain serotonergic activity: A comparative review. Front. Endocrinol. 2019, 10, 158. [Google Scholar] [CrossRef] [PubMed]
  26. Liu, L.; Zheng, J.; Huang, X.F.; Zhu, X.; Ding, S.M.; Ke, H.M.; O’Donnell, J.M.; Zhang, H.T.; Song, G.Q.; Xu, Y. The neuroprotective and antidepressant-like effects of Hcyb1, a novel selective PDE2 inhibitor. CNS Neurosci. Ther. 2018, 24, 652–660. [Google Scholar] [CrossRef]
  27. Yang, Y.; Jiang, W.; Feng, Y.; Liu, J.; Chen, H.; Wang, D.; Zhao, R. Melatonin alleviates hippocampal GR inhibition and depression-like behavior induced by constant light exposure in mice. Ecotoxicol. Environ. Saf. 2021, 228, 112979. [Google Scholar] [CrossRef]
  28. Xu, L.; Su, J.; Guo, L.; Wang, S.; Deng, X.; Ma, S. Modulation of LPA1 receptor-mediated neuronal apoptosis by Saikosaponin-d: A target involved in depression. Neuropharmacology 2019, 155, 150–161. [Google Scholar] [CrossRef]
  29. Fu, X.; Jiao, J.; Qin, T.; Yu, J.; Fu, Q.; Deng, X.; Ma, S.; Ma, Z. A New Perspective on Ameliorating Depression-Like Behaviors: Suppressing Neuroinflammation by Upregulating PGC-1α. Neurotox. Res. 2021, 39, 872–885. [Google Scholar] [CrossRef]
  30. Wu, X.; Luo, P.; Rao, W.; Dai, S.; Zhang, L.; Ma, W.; Pu, J.; Yu, Y.; Wang, J.; Fei, Z. Homer1a attenuates hydrogen peroxide-induced oxidative damage in HT-22 cells through AMPK-dependent autophagy. Front. Neurosci. 2018, 12, 51. [Google Scholar] [CrossRef]
  31. Gulec, M.; Oral, E.; Dursun, O.B.; Yucel, A.; Hacimuftuoglu, A.; Akcay, F.; Suleyman, H. Mirtazapine protects against cisplatin-induced oxidative stress and DNA damage in the rat brain. Psychiatry Clin. Neurosci. 2013, 67, 50–58. [Google Scholar] [CrossRef]
  32. Wang, Q.; Ma, M.; Yu, H.; Yu, H.; Zhang, S.; Li, R. Mirtazapine prevents cell activation, inflammation, and oxidative stress against isoflurane exposure in microglia. Bioengineered 2021, 13, 521–530. [Google Scholar] [CrossRef] [PubMed]
  33. Mao, X.; Lv, M.; Yu, B.; He, J.; Zheng, P.; Yu, J.; Wang, Q.; Chen, D. The effect of dietary tryptophan levels on oxidative stress of liver induced by diquat in weaned piglets. J. Anim. Sci. Biotechnol. 2014, 5, 49. [Google Scholar] [CrossRef] [PubMed]
  34. Gall, J.I.; Alves, A.G.; Carraro, L.R., Jr.; da Silva Teixeira Rech, T.; dos Santos Neto, J.S.; Alves, D.; Pereira Soares, M.S.; Spohr, L.; Spanevello, R.M.; Brüning, C.A.; et al. Insights into serotonergic and antioxidant mechanisms involved in antidepressant-like action of 2-phenyl-3-(phenylselanyl)benzofuran in mice. Prog. Neuro-Psychopharmacol. Biol. Psychiatry 2020, 102, 109956. [Google Scholar] [CrossRef] [PubMed]
  35. Ramos-Hryb, A.B.; Platt, N.; Freitas, A.E.; Heinrich, I.A.; López, M.G.; Leal, R.B.; Kaster, M.P.; Rodrigues, A.L.S. Protective Effects of Ursolic Acid Against Cytotoxicity Induced by Corticosterone: Role of Protein Kinases. Neurochem. Res. 2019, 44, 2843–2855. [Google Scholar] [CrossRef]
  36. Liu, Z.-L.; Wang, X.-Q.; Liu, M.-F.; Ye, B.-J. Meta-analysis of association between TPH2 single nucleotide poiymorphism and depression. Neurosci. Biobehav. Rev. 2022, 134, 104517. [Google Scholar] [CrossRef]
  37. Joëls, M.; Karst, H.; Sarabdjitsingh, R.A. The stressed brain of humans and rodents. Acta Physiol. 2018, 223, e13066. [Google Scholar] [CrossRef]
  38. HT-22 Mouse Hippocampal Neuronal Cell Line|SCC129. Available online: https://www.merckmillipore.com/PT/en/product/HT-22-Mouse-Hippocampal-Neuronal-Cell-Line,MM_NF-SCC129?ReferrerURL=https%3A%2F%2Fwww.google.com%2F (accessed on 31 May 2022).
  39. SH-SY5Y|ATCC. Available online: https://www.atcc.org/products/crl-2266 (accessed on 31 May 2022).
  40. BioRender. Available online: https://biorender.com/ (accessed on 1 June 2022).
Figure 1. Effect of 48 h-incubation of 50–300 μM of H2O2 on the viability of HT-22 and SH-SY5Y cells, determined by (A,C) MTT and (B,D) NR methodologies. The results represent the mean ± SEM of 3–6 independent experiments, expressed as the percentage of the vehicle (100%). Statistically significant * p < 0.05, ** p < 0.01, *** p < 0.001, and **** p < 0.0001 vs. vehicle.
Ijtm 02 00036 g001
Figure 2. Representative images (100 × total magnification) of HT-22 and SH-SY5Y cells after incubation of increasing concentrations of H2O2. Cells were treated with (A,E) vehicle (0.1% sterilized water) (B,F) H2O2 50 µM, (C,G) H2O2 150 µM, (D,H) H2O2 300 µM.
Ijtm 02 00036 g002
Figure 3. Effect of 48 h-incubation of 0.01–20 μM of mirtazapine on the viability of HT-22 and SH-SY5Y cells, determined by (A,C) MTT and (B,D) NR methodology. The results represent the mean ± SEM of three independent experiments, expressed as the percentage of the vehicle (100%).
Ijtm 02 00036 g003
Figure 4. Representative images (100 × total magnification) of HT-22 and SH-SY5Y cells. Cells were treated with (A,D) vehicle (0.1% DMSO) (B,E) mirtazapine 0.01 µM, (C,F) mirtazapine 20 µM.
Ijtm 02 00036 g004
Figure 5. Effect of 48 h-incubation of (A) 132 μM of H2O2 and (B) 105 μM of H2O2, in combination with 0.01–20 μM of mirtazapine, determined by MTT methodology. The results represent the mean ± SEM of 3–6 independent experiments, expressed as the percentage of the vehicle (100%). Statistically significant ** p < 0.01 and **** p < 0.0001 vs. vehicle.
Ijtm 02 00036 g005
Figure 6. Representative images (100 × total magnification) of HT-22 and SH-SY5Y cells after incubation of H2O2 in combination with mirtazapine. Cells were treated with (A,D) vehicle (0.1% DMSO/0.1% sterilized water), (B) mirtazapine 0.01 µM + H2O2 105 µM, (C) mirtazapine 20 µM + H2O2 105 µM, (E) mirtazapine 0.01 µM + H2O2 132 µM, (F) mirtazapine 20 µM + H2O2 132 µM.
Ijtm 02 00036 g006
Figure 7. Effect of 48-h-incubation of 100–500 μM of corticosterone on the viability of HT-22 and SH-SY5Y cells, determined by (A,C) MTT and (B,D) NR assays. The results represent the mean ± SEM of 3–6 independent experiments, expressed as the percentage of the vehicle (100%). Statistically significant * p < 0.05, ** p < 0.01, *** p < 0.001, and **** p < 0.0001 vs. vehicle.
Ijtm 02 00036 g007
Figure 8. Representative images (100 × total magnification) of HT-22 and SH-SY5Y cells after incubation of increasing concentrations of corticosterone. Cells were treated with (A,E) vehicle (0.1% DMSO) (B,F) corticosterone 100 µM, (C,G) corticosterone 300 µM, (D,H) corticosterone 500 µM.
Ijtm 02 00036 g008
Figure 9. Effect of 48 h-incubation of (A) 236 μM of corticosterone and (B) 35 μM of corticosterone, in combination with 0.01–20 μM of mirtazapine, determined by MTT assay. The results represent the mean ± SEM of 3–6 independent experiments, expressed as the percentage of the vehicle (100%). Statistically significant * p < 0.05 and **** p < 0.0001 vs. vehicle.
Ijtm 02 00036 g009
Figure 10. Representative images (100 × total magnification) of HT-22 and SH-SY5Y cells after incubation of corticosterone in combination with mirtazapine. Cells were treated with (A,D) vehicle (0.2% DMSO), (B) mirtazapine 0.01 µM + corticosterone 35 µM, (C) mirtazapine 20 µM + corticosterone 35 µM, (E) mirtazapine 0.01 µM + corticosterone 236 µM, (F) mirtazapine 20 µM + corticosterone 236 µM.
Ijtm 02 00036 g010
Figure 11. Effect of 48 h-incubation of 0.1 nM-100 μM of L-tryptophan on the viability of (A) SH-SY5Y cells and (B) HT-22 cells, determined by MTT methodology. The results represent the mean ± SEM of three independent experiments, expressed as the percentage of the vehicle (100%).
Ijtm 02 00036 g011
Figure 12. Representative images (100 × total magnification) of HT-22 and SH-SY5Y cells after incubation of increasing concentrations of L-tryptophan. Cells were treated with (A,D) vehicle (1% sterilized water) (B,E) L-tryptophan 0.1 nM, (C,F) L-tryptophan 100 µM.
Ijtm 02 00036 g012
Figure 13. Effect of 48 h-incubation of (A) 132 μM of H2O2 and (B) 105 μM of H2O2, in combination with 0.1 nM–100 μM of L-tryptophan, determined by MTT methodology. The results represent the mean ± SEM of three independent experiments, expressed as the percentage of the vehicle (100%). Statistically significant **** p < 0.0001 vs. vehicle.
Ijtm 02 00036 g013
Figure 14. Representative images (100 × total magnification) of HT-22 and SH-SY5Y cells after incubation of H2O2 in combination with L-tryptophan. Cells were treated with (A,D) vehicle (1% sterilized water), (B) L-tryptophan 0.1 nM + H2O2 105 µM, (C) L-tryptophan 100 µM + H2O2 105 µM, (E) L-tryptophan 0.1 nM + H2O2 132 µM, (F) L-tryptophan 100 μM + H2O2 132 µM.
Ijtm 02 00036 g014
Figure 15. Effect of 48 h-incubation of (A) 322 μM of corticosterone and (B) 35 μM of corticosterone, in combination with 0.1 nM-100 μM of L-tryptophan, determined by MTT assay. The results represent the mean ± SEM of 3–6 independent experiments, expressed as the percentage of the vehicle (100%). Statistically significant. **** p < 0.0001 vs. vehicle.
Ijtm 02 00036 g015
Figure 16. Representative images (100 × total magnification) of HT-22 and SH-SY5Y cells after incubation of corticosterone in combination with L-tryptophan. Cells were treated with (A,D) vehicle (0.1% Methanol/1%sterilized water), (B) L-tryptophan 10 nM + corticosterone 35 µM, (C) L-tryptophan 100 μM + corticosterone 35 µM, (E) L-tryptophan 0.1 nM + corticosterone 322 µM, (F) L-tryptophan 100 μM + corticosterone 322 µM.
Ijtm 02 00036 g016
Figure 17. Effect on ROS production of 1 h, 3 h, 6 h, 24 h, and 48 h-incubation of (A) 132 μM of H2O2, 0.01 μM/20 μM of mirtazapine and 132 μM of H2O2 + 0.01 μM/20 μM of mirtazapine (SH-SY5Y cells) and (B) 105 μM of H2O2, 0.01 μM/20 μM of mirtazapine and 105 μM of H2O2 + 0.01 μM/20 μM of mirtazapine (HT-22 cells), determined by DCFDA assay. The results represent the mean ± SEM of 2–6 independent experiments, expressed as the percentage of each vehicle (100%) for each period. Statistically significant * p < 0.05, *** p < 0.001, and **** p < 0.0001 vs. vehicle, for each time.
Ijtm 02 00036 g017
Figure 18. Effect on ROS production of 1 h, 3 h, 6 h, 24 h, and 48 h-incubation of (A) 322 μM of corticosterone, 0.01 μM/20 μM of mirtazapine and 322 μM of corticosterone + 0.01 μM/20 μM of mirtazapine (SH-SY5Y cells) and (B) 35 μM of corticosterone, 0.01 μM/20 μM of mirtazapine and 35 μM of corticosterone + 0.01 μM/20 μM of mirtazapine (HT-22 cells), determined by DCFDA assay. The results represent the mean ± SEM of 2–6 independent experiments, expressed as the percentage of each vehicle (100%) for each period. Statistically significant * p < 0.05, ** p < 0.01, *** p < 0.001, and **** p < 0.0001 vs. vehicle, for each time.
Ijtm 02 00036 g018
Figure 19. Comparison of SH-SY5Y and HT-22 cells regarding ROS production, for 48 h-incubation of (A) 105/132 μM of H2O2, 0.01 μM/20 μM of mirtazapine and 105/132 μM of H2O2 + 0.01 μM/20 μM of mirtazapine (HT-22 and SH-SY5Y cells, respectively) and (B) 35/322 μM of corticosterone, 0.01 μM/20 μM of mirtazapine and 35/322 μM of corticosterone + 0.01 μM/20 μM of mirtazapine (HT-22 and SH-SY5Y cells, respectively), determined by DCFDA assay. The results represent the mean ± SEM of 2–6 independent experiments, expressed as the percentage of each vehicle (100%).
Ijtm 02 00036 g019
Figure 20. Effect on ROS production of 1 h, 3 h, 6 h, 24 h, and 48 h-incubation of (A) 132 μM of H2O2, 0.01 μM/100 μM of L-tryptophan and 132 μM of H2O2 + 0.1 nM/100 μM of L-tryptophan (SH-SY5Y cells) and (B) 105 μM of H2O2, 0.1 nM/100 μM of L-tryptophan and 105 μM of H2O2 + 0.1 nM/100 μM of L-tryptophan (HT-22 cells), determined by DCFDA assay. The results represent the mean ± SEM of 2–6 independent experiments, expressed as the percentage of each vehicle (100%) for each period. Statistically significant * p < 0.05, ** p < 0.01, *** p < 0.001, and **** p < 0.0001 vs. vehicle, for each time.
Ijtm 02 00036 g020
Figure 21. Effect on ROS production of 1 h, 3 h, 6 h, 24 h, and 48 h-incubation of (A) 322 μM of corticosterone, 0.1 nM/100 μM of L-tryptophan and 322 μM of corticosterone + 0.1 nM/100 μM of L-tryptophan (SH-SY5Y cells) and (B) 35 μM of corticosterone, 0.1 nM/100 μM of L-tryptophan and 35 μM of corticosterone + 0.1 μM/100 μM of L-tryptophan (HT-22 cells), determined by DCFDA assay. The results represent the mean ± SEM of 2–6 independent experiments, expressed as the percentage of each vehicle (100%) for each period. Statistically significant * p < 0.05, and ** p < 0.01 vs. vehicle, for each time.
Ijtm 02 00036 g021
Figure 22. Comparison of SH-SY5Y and HT-22 cells regarding ROS production, for 48 h incubation of (A) 105/132 μM of H2O2, 0.1 nM/100 μM of L-tryptophan and 105/132 μM of H2O2 + 0.1 nM/100 μM of L-tryptophan (HT-22 and SH-SY5Y cells, respectively) and (B) 35/322 μM of corticosterone, 0.1 nM/100μM of L-tryptophan and 35/322 μM of corticosterone + 0.1 nM/100 μM of L-tryptophan (HT-22 and SH-SY5Y cells, respectively), determined by DCFDA assay. The results represent the mean ± SEM of 2–6 independent experiments, expressed as the percentage of each vehicle (100%).
Ijtm 02 00036 g022
Figure 23. Schematic illustration of the main findings of this work. Created with Biorender.com [40].
Ijtm 02 00036 g023
Publisher’s Note: MDPI stays neutral with regard to jurisdictional claims in published maps and institutional affiliations.

