Article

Artificial Intelligence and Democratization of the Use of Lung Ultrasound in COVID-19: On the Feasibility of Automatic Calculation of Lung Ultrasound Score

1
Institute for Physical and Information Technologies, Spanish National Research Council, 28006 Madrid, Spain
2
Nuclear Physics Group and IPARCOS, Complutense University of Madrid, 28040 Madrid, Spain
3
Dasel Sistemas Tecnología de Ultrasonidos, Arganda del Rey, 28500 Madrid, Spain
4
Department of Internal Medicine, Hospital de Emergencias Enfermera Isabel Zendal, 28055 Madrid, Spain
5
Department of Internal Medicine, Hospital Universitario Puerta de Hierro Majadahonda, 28222 Madrid, Spain
6
Department of Medicine, Universidad Alfonso X, Villanueva de la Cañada, 28691 Madrid, Spain
*
Author to whom correspondence should be addressed.
Int. J. Transl. Med. 2022, 2(1), 17-25; https://doi.org/10.3390/ijtm2010002
Submission received: 4 December 2021 / Revised: 30 December 2021 / Accepted: 11 January 2022 / Published: 13 January 2022
(This article belongs to the Special Issue Translational Aspects of Infectious Diseases: From Bench to Bedside)

Abstract

:
During the COVID-19 pandemic, lung ultrasound has been revealed as a powerful technique for diagnosis and follow-up of pneumonia, the principal complication of SARS-CoV-2 infection. Nevertheless, being a relatively new and unknown technique, the lack of trained personnel has limited its application worldwide. Computer-aided diagnosis could possibly help to reduce the learning curve for less experienced physicians, and to extend such a new technique such as lung ultrasound more quickly. This work presents the preliminary results of the ULTRACOV (Ultrasound in Coronavirus disease) study, aimed to explore the feasibility of a real-time image processing algorithm for automatic calculation of the lung ultrasound score (LUS). A total of 28 patients positive on COVID-19 were recruited and scanned in 12 thorax zones following the lung score protocol, saving a 3 s video at each probe position. Those videos were evaluated by an experienced physician and by a custom developed automated detection algorithm, looking for A-Lines, B-Lines, consolidations, and pleural effusions. The agreement between the findings of the expert and the algorithm was 88.0% for B-Lines, 93.4% for consolidations and 99.7% for pleural effusion detection, and 72.8% for the individual video score. The standard deviation of the patient lung score difference between the expert and the algorithm was ±2.2 points over 36. The exam average time with the ULTRACOV prototype was 5.3 min, while with a conventional scanner was 12.6 min. Conclusion: A good agreement between the algorithm output and an experienced physician was observed, which is a first step on the feasibility of developing a real-time aided-diagnosis lung ultrasound equipment. Additionally, the examination time was reduced to less than half with regard to a conventional ultrasound exam. Acquiring a complete lung ultrasound exam within a few minutes is possible using fairly simple ultrasound machines that are enhanced with artificial intelligence, such as the one we propose. This step is critical to democratize the use of lung ultrasound in these difficult times.

1. Introduction

Lung ultrasonography (LUS) has proven to be an accessible, reproducible, low-cost and safe imaging modality (radiation-free) for the diagnosis, risk stratification, monitoring, and management of COVID-19 patients [1]. LUS is more available than computed tomography or X-ray, and allows us to better understand the pathophysiology of the disease [2,3]. However, the main limitation with this technique is that it is dependent on competent operators performing the examination, and therefore the main barrier to its expansion.
We developed a numeric lung score based on the pathological findings in each lung sonographic area, described in a previous study [4,5]:
Irregular pleural lines and focal B lines: 1 point;
Confluent B lines (<50%): 2 points;
Confluent B lines (>50%): 3 points;
Subpleural or lobar consolidation or pleural effusion: 3 points.
We summed every area’s points, obtaining the patient’s lung score, ranging from 0 to 36.
Several authors have proposed image processing and artificial intelligence algorithms for automatic detection of pneumonia related artifacts in ultrasound images, and automatic calculation of the lung score. Some of the earlier works were focused on the detection of lines in the ultrasound frames (pleura line, A-lines, B-lines) with analytical methods [6]. Deep-learning methods have also been used to detect B-lines to analyze the ultrasound acquisitions at the frame or video level [7,8,9,10,11]. These works include results from non-COVID-19 patient acquisitions [7], a large public repository of lung ultrasound (LUS) [8,9], and data acquired in one center [10], and later on in a multi-center study [11]. Some of these works compare the findings with the ones obtained by medical doctors, proving a comparable score [11].
This work presents the preliminary results of the ULTRACOV (Ultrasound in Coronavirus disease) study, about the feasibility of developing a lung-oriented ultrasound scanner with real-time aided-diagnosis algorithms. A description of the developed prototype is given, along with the basic operation principles of the proposed algorithms. Then the results of the first clinical trial with 28 patients are presented and compared with the results obtained by a lung ultrasound expert. Finally, advantages and limitations of the developed prototype are discussed, and conclusions extracted.

2. Materials and Methods

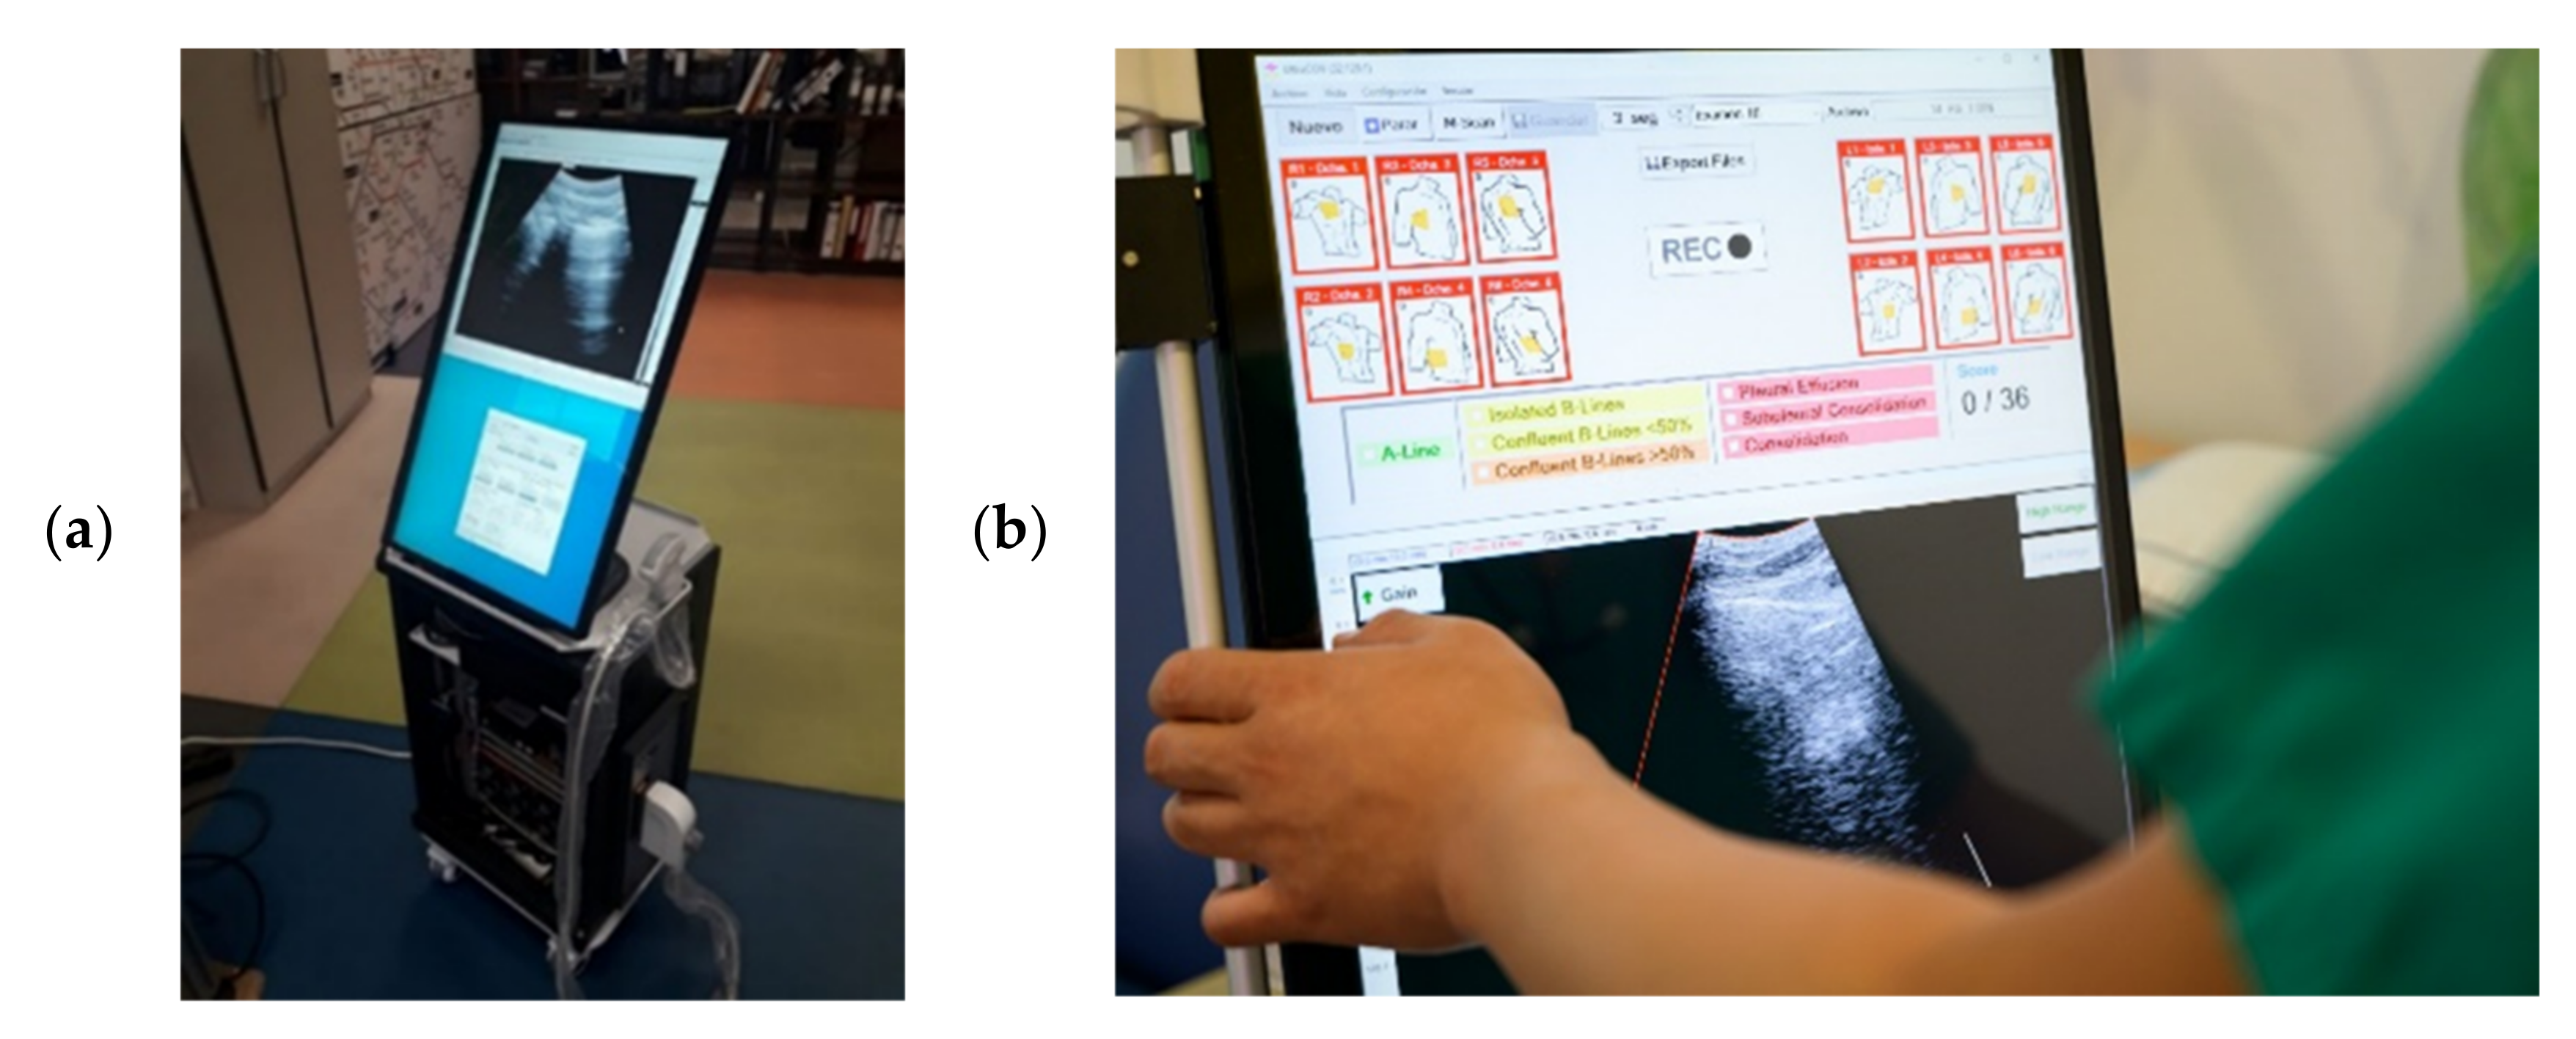
2.1. Lung-Scanner Prototype

Figure 1a shows the ultrasound scanner prototype developed for the clinical trial. It is based on a 128-channel ultrasound electronics and a 3.5 MHz convex probe, and it includes a personal computer running a custom developed software for performing the scan (Figure 1b) with a touchable screen for ease of operation and disinfection. For each patient, the 12 zones of the lung score were sequentially selected. After selecting a zone, the operator looked for a representative image and, without moving the probe, the equipment saved a 3-s video. Findings were manually annotated by the operator at this moment, to be compared with the automated algorithm output afterwards. Table 1 summarizes the scan parameters, which were the same for all zones and patients. The total scan time was automatically obtained from the time-stamp difference between the first and the last video acquired with each patient.

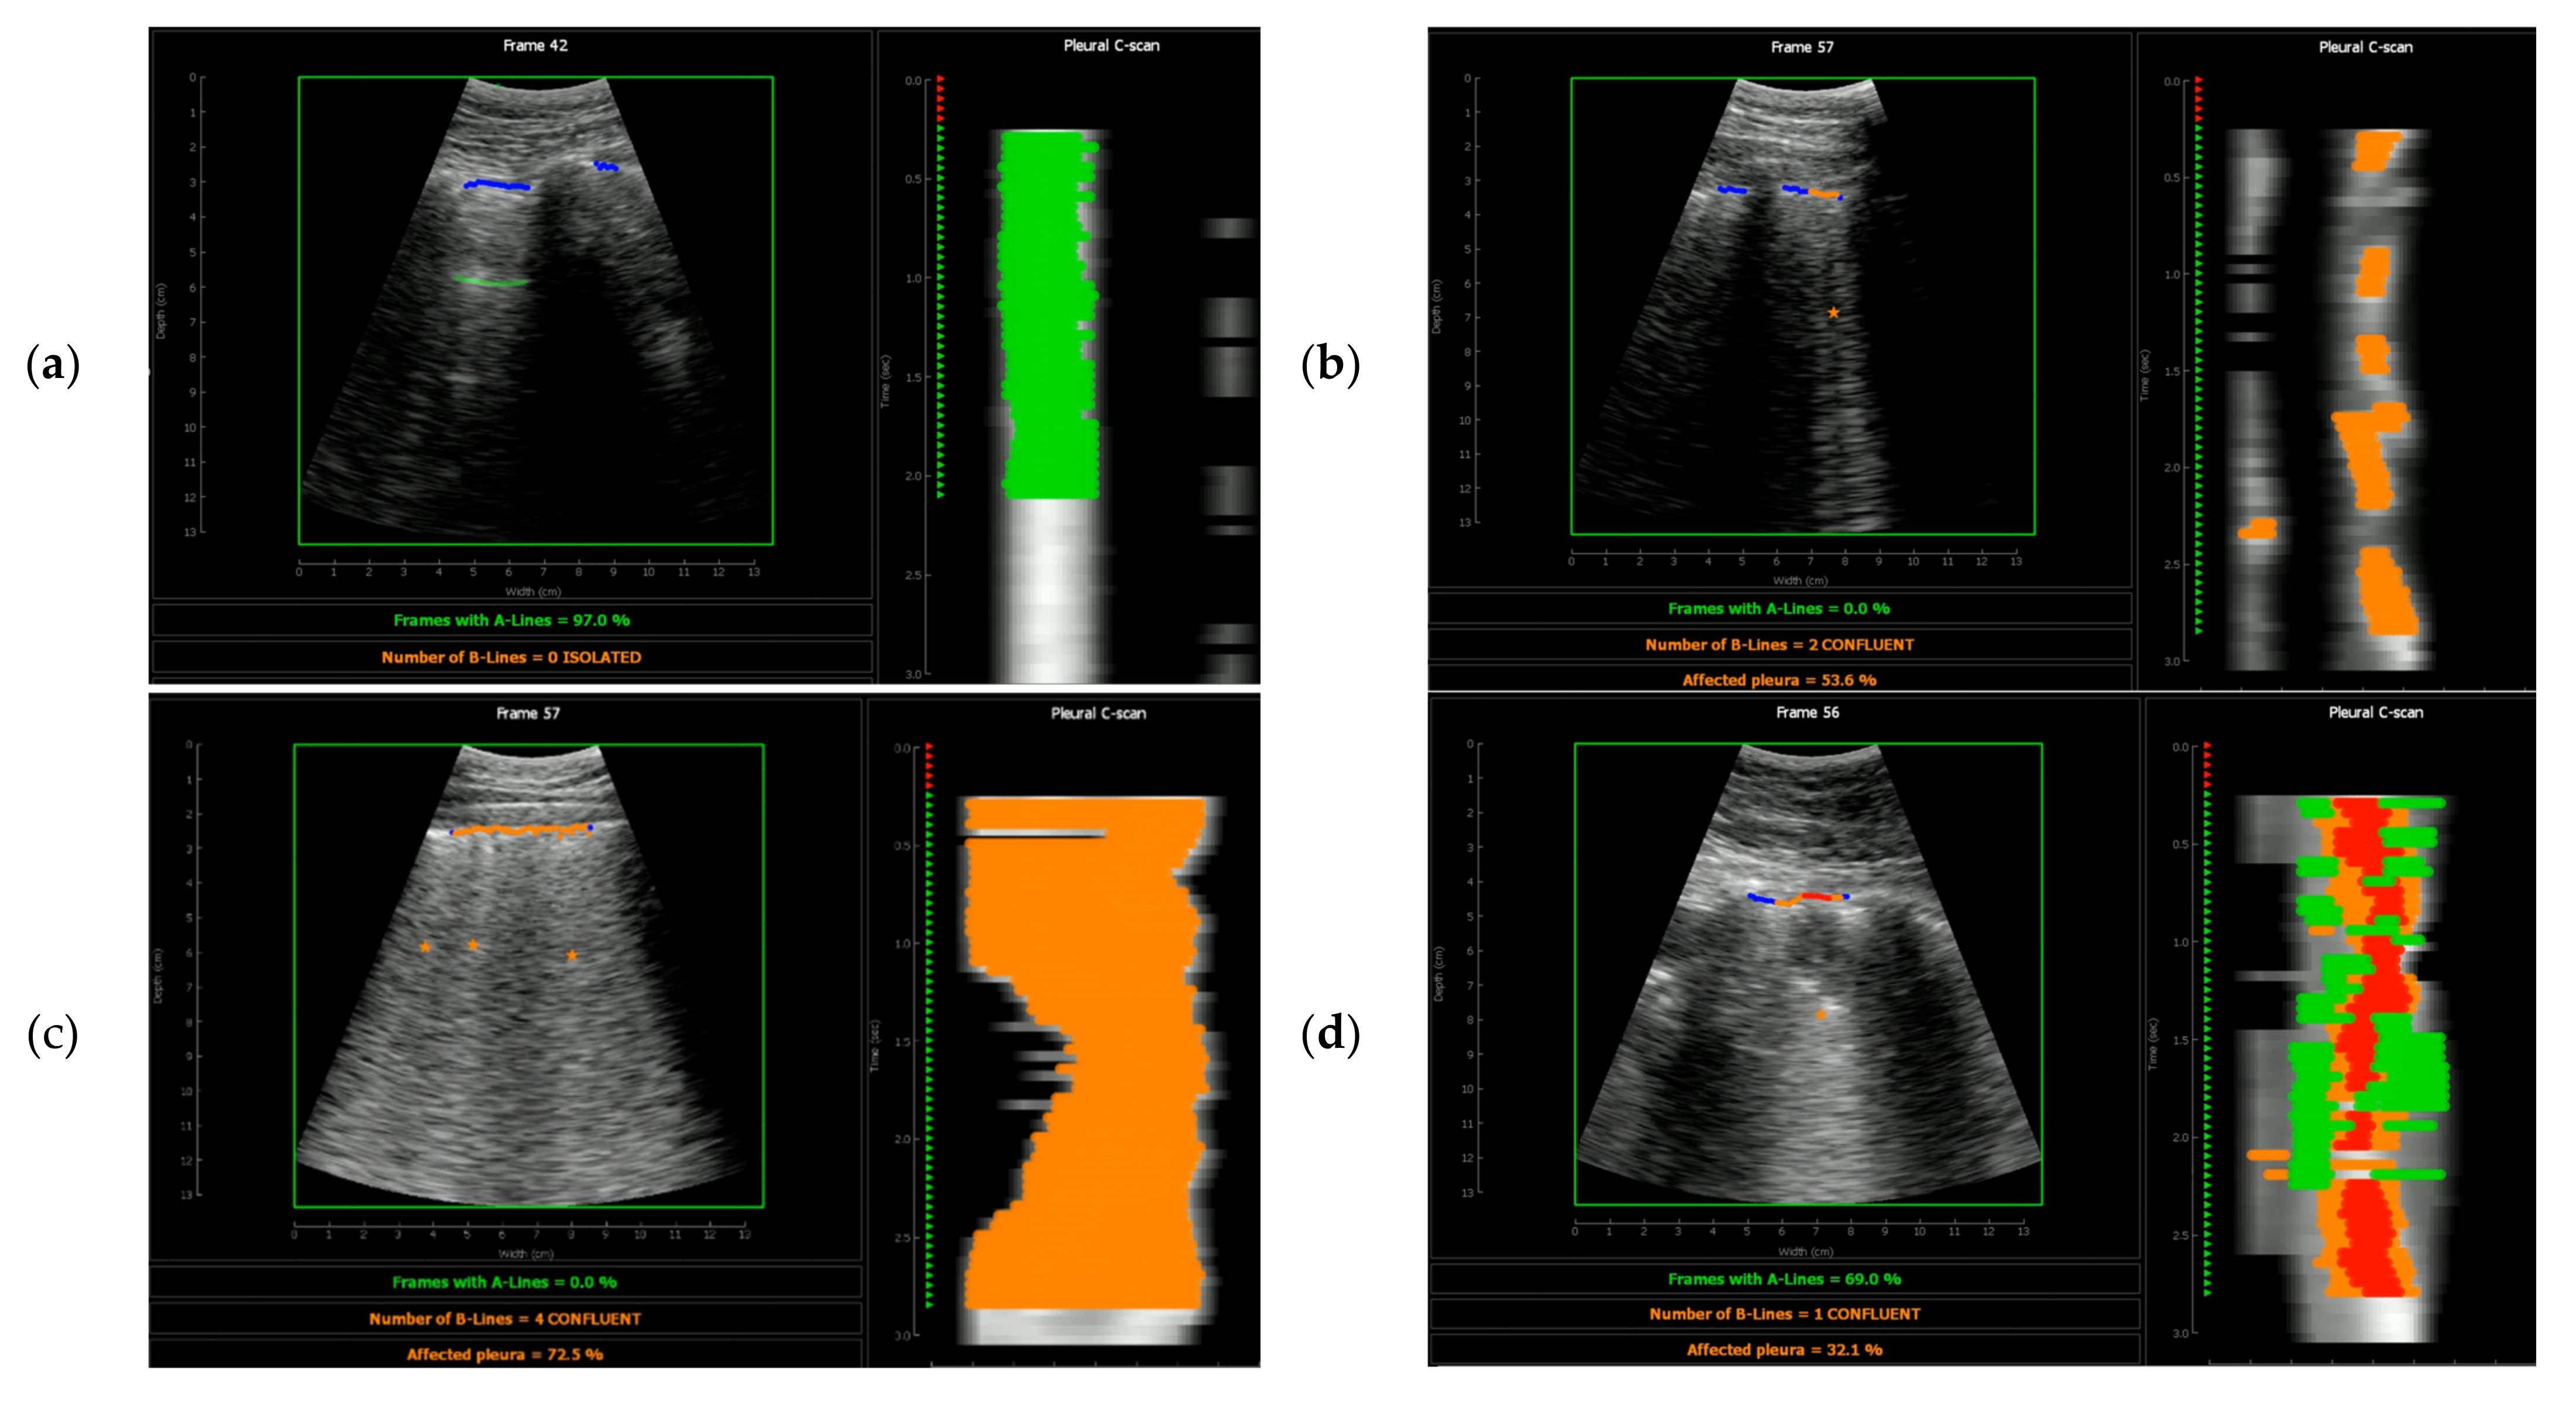
2.2. Automatic Detection Algorithm

The automatic detection algorithm was designed to identify, at each video frame, the pleura, A-Lines, B-Lines, consolidations, and pleura effusions. It is performed in the following sequential steps:
Pleura detection. It based on the fact that, when the probe is still, the image above the pleura almost does not change, while variations can be observed below the pleura during the respiratory cycle. A motion filter identifies the boundary between the two zones, which is used as an initial guess to find the pleura as a continuous bright line around that depth.
A-Lines detection. A-Lines are identified as replicas of the pleura at depths multiple of the probe-pleura distance, looking for continuous and bright horizontal lines parallel to the pleura. Despite not being used for calculating the lung score, its presence is used to discard false B-Lines and consolidations;
B-Lines detection. Each one of the image lines is fitted to a first-degree polynomial, starting at the detected pleura. The criteria to detect a B-Line are based on the slope of that best fit line: Higher slopes correspond to bright vertical artifacts that increase their bright towards the bottom of the image, which corresponds with a B-Line. The percentage of the affected pleura is obtained by the ratio of lines marked as B-Lines to the total number of image lines containing the pleura;
Consolidations. There are two criteria that should be met to detect a consolidation. First, the pleura is not seen as a continuous bright line, which is measured through the standard deviation of the difference between consecutive pleura points. Second, the B-Line criterion is meet, but a dark zone is present between the pleura and the starting point of the B-Line. In this case, the image line is marked as consolidation;
Pleura effusion. A pleura effusion is detected when there is a dark zone above the pleura, and the pleura line moves vertically during the video. This way, they are differenced from consolidations, which usually move laterally but not vertically during the acquisition time.
The above steps are applied to each image frame, and the worst case of the whole video is considered for giving the score of that zone: 0 points for A-Lines or no indications, 1 point for B-Lines affecting less than 50% of the pleura, 2 points for B-Lines affecting more than 50% of the pleura, and 3 points for consolidation or pleura effusion. Finally, the individual scores of the 12 zones are summed, obtaining the patient lung score between 0 and 36 points.
Figure 2 shows the automatic detection results in 4 representative cases. On the left is the B-Mode image, and overlaid are the pleura (blue), A-Lines (green), B-Lines (orange), and consolidations (red). The C-Scan is shown on the right, which is a condensed representation of the whole video where the vertical axis is the elapsed time and the horizontal axis the horizontal axis of the B-Mode image at the depth of the pleura. The C-Scan colored with the same color code used in the B-mode image.
Figure 2a shows the results of a normal scan, where only A-Lines are detected. It can be observed how the algorithm is able to detect two pleura sections separated by a rib, which are analyzed independently. The C-Scan image is mostly colored in green, because A-Lines are detected in most image frames.
Figure 2b shows an example of confluent B-Lines, which were detected in several fames. The percentage of affected pleura was 53.6%, and hence, a score of 2 was assigned to this video. The C-Scan showed a discontinuous orange indication, as B-Lines were not present in all the frames of this video. Furthermore, the lateral displacement of the B-Lines during the respiratory cycle could be observed in the C-Scan, which could possibly give relevant information to the physician.
Figure 2c shows a zone with a higher density of B-Lines, which is clearly evidenced in the C-Scan colored orange (72.5% of the pleura affected in this case). Finally, Figure 2d shows a more severe case, where a consolidation is present in the center of the image during the whole video. It is indicated with red color on the C-Scan, where also A-Lines and B-Lines are present is some frames. In this case, the assigned score value was 3.

2.3. Clinical Study Population

A total of 28 patients were recruited between June to July 2021. The mean age was 53.3 years (standard deviation—SD 12.5) and 43.3% were female. Ten patients (33.3%) had hypertension, 4 patients (13.3%) had diabetes, and 2 patients (6.7%) had cardiovascular disease. They had an average of 17.0 days (SD 18.6) after symptom onset, consisting in fever (90%), shortness of breath (66,7%), and weakness (86,7%). The mean lymphocyte count was 1.61 × 10⁹ (SD 0.96, normal value-NV: 1.0–4.0), C-reactive protein was 43.6 mg/dL (SD 36.8, NV: 0–10), and D-dimer 586.5 ng/mL (SD 405.5, NV: <400) at admission. No patients died at follow-up.

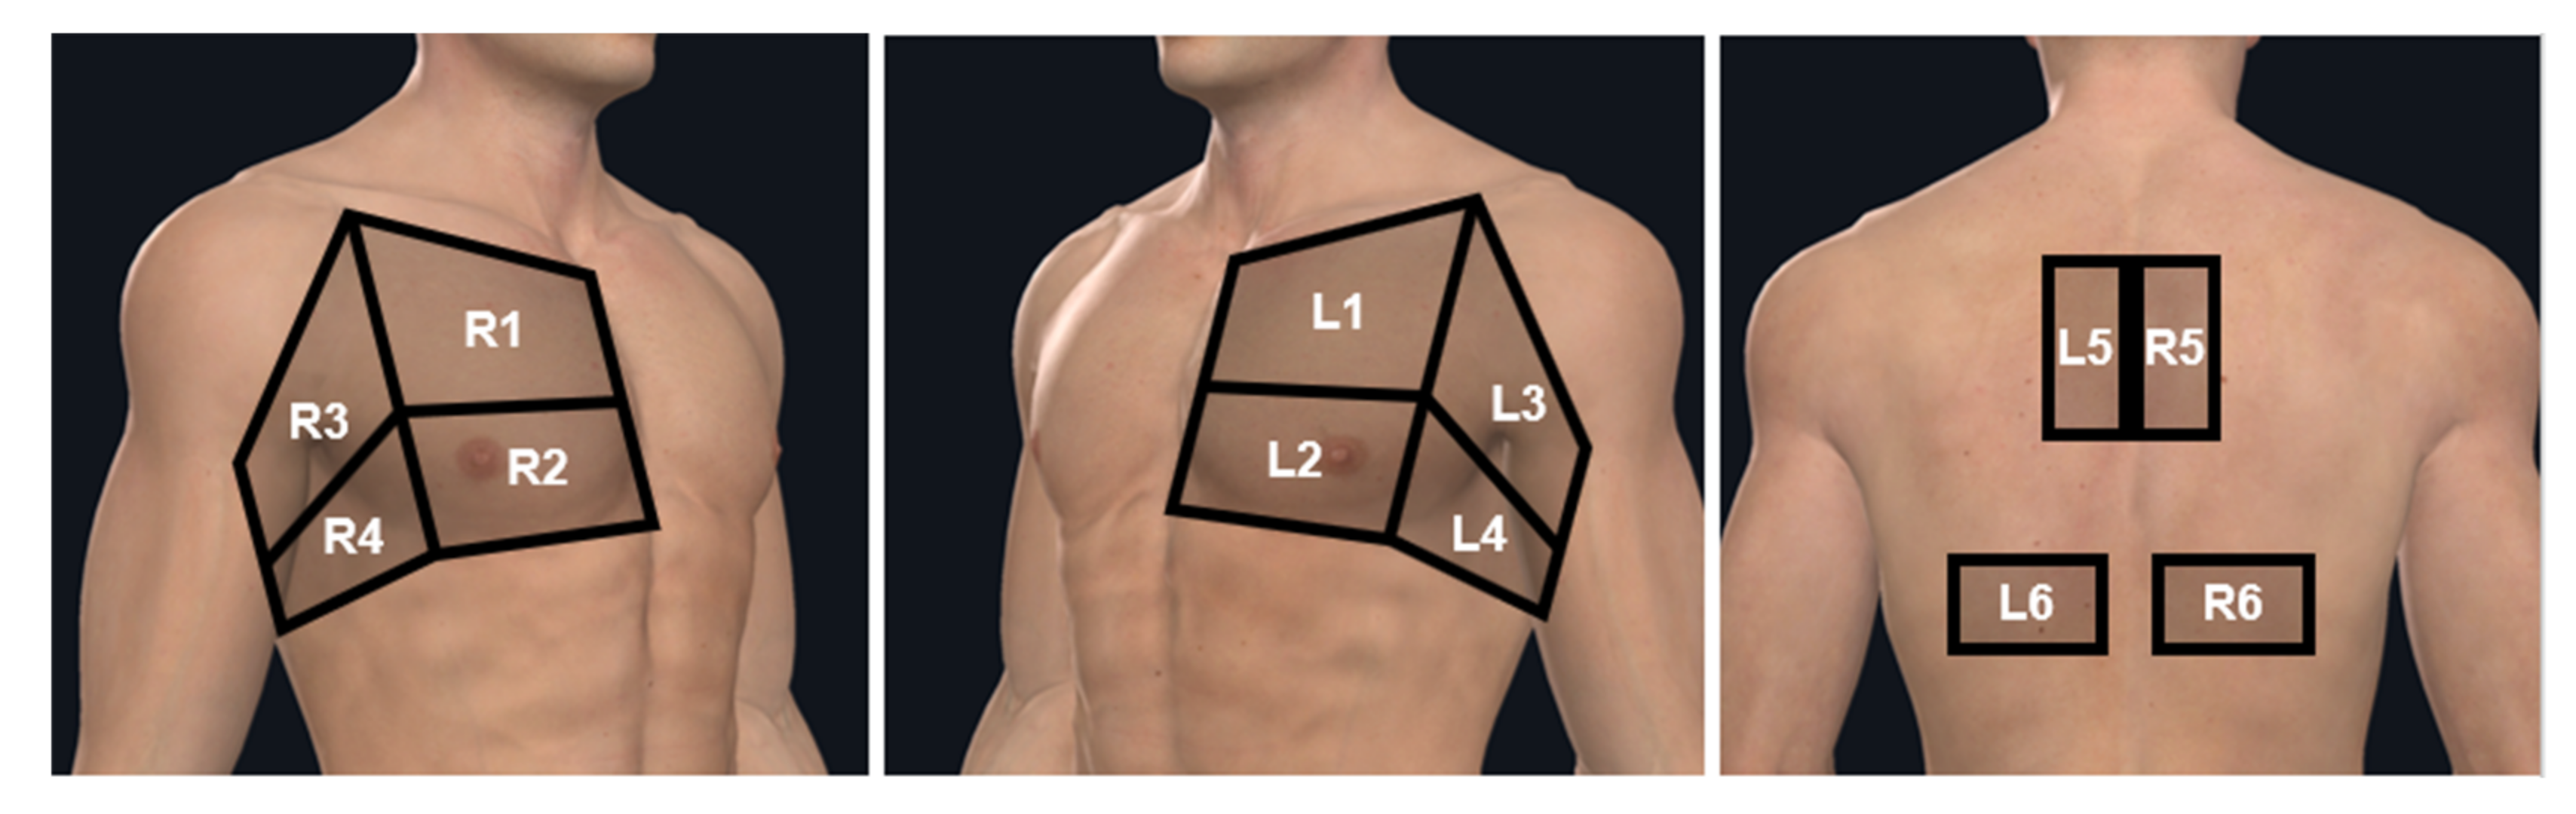
2.4. Exploration Zones
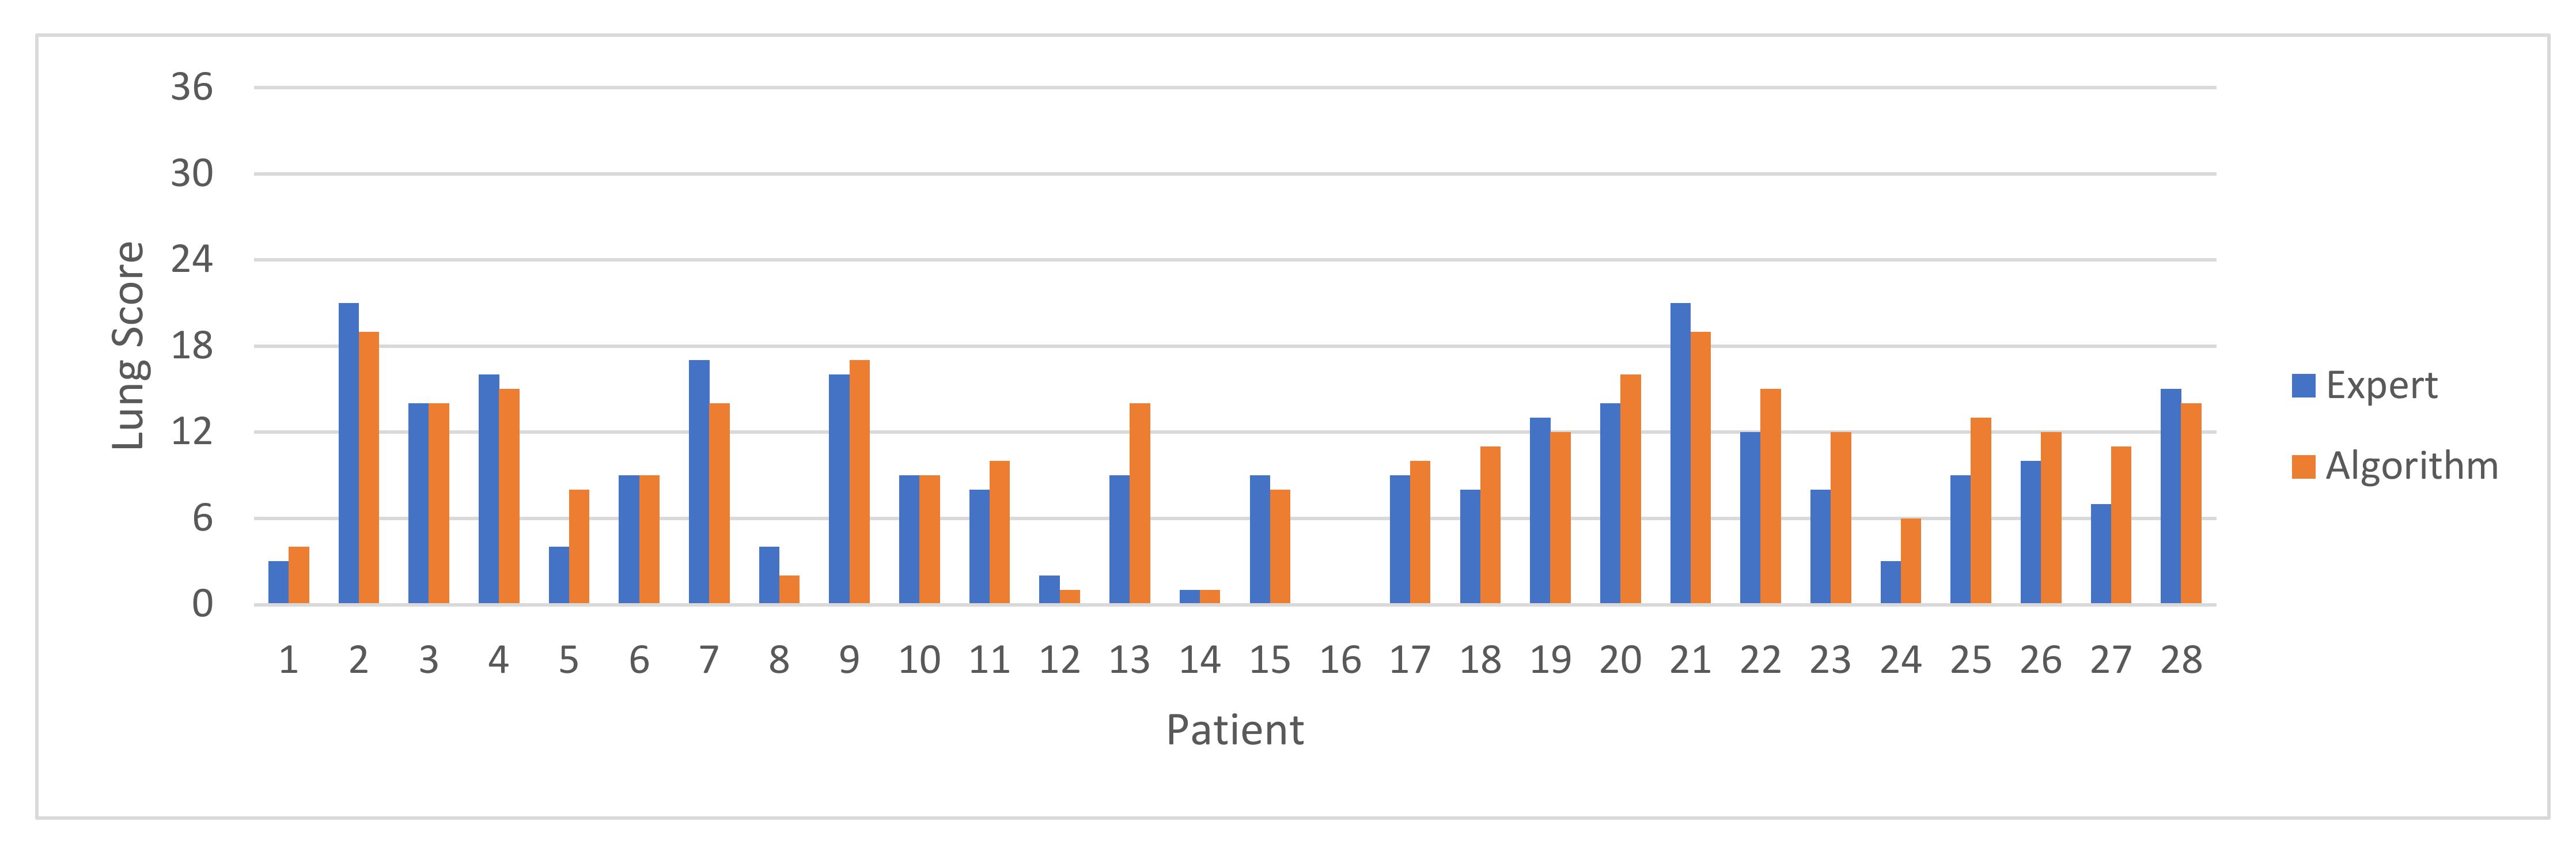
Each patient was scanned in 12 zones, following the lung score protocol, as shown in Figure 3. The probe orientation in all cases was perpendicular to the ribs (longitudinal scans).

3. Results

The acquired videos were processed off-line with the proposed algorithm, and, for each patient, the lung score was calculated. Individual zone findings and scores were compared with the findings and scores given by an expert physician trained in lung ultrasound during the image acquisitions, measuring the coincidence as the percentage of videos where the algorithm output equals the expert findings.
Results are summarized in Table 2. For A-Lines, B-Lines, pleura effusion, and consolidation, the false positive percentage represents the cases where the algorithm detects and artifact and the expert do not, and false negative the opposite. For the zone score, false positives are the cases where the automatic score is larger than that calculated by the expert, and false negative the opposite.
Figure 4 shows the lung score for each patient, calculated from the expert physician findings (blue) and by the automatic algorithm output (orange), and Figure 5 shows the difference between both scores. The average difference was 0.8 points, and the standard deviation of the difference was 2.2 points.
Figure 6 shows the coincidence between the automatic and manual detection for each one of the 12 zones, for B-Lines, consolidations, and zone score.
Table 3 summarizes the number of videos where each artifact was identified by the expert, and the percentage of the total videos in each case. The total number of videos was 334, because 2 videos were not saved correctly during acquisition.

4. Discussion

There is growing literature suggesting LUS as safe and easily accessible tool, which helps in early correct diagnosis, appropriate therapy, and a positive correlation with prognosis, serving as a complement to the management of COVID-19 patients, in combination with other imaging tools, such as X-ray and CT [3].
Easy to access and reliable diagnostic methods which can predict prognosis in COVID-19 are vital in any (ambulatory or in-hospital) settings, but especially in areas with limited resources [3,4,5].
In our study, coincidence between the algorithm and the expert in the detection of A-Lines was 70.7% (Table 2), with 23% of false positives. This quite large number of false positives is explained by the fact that A-Lines were not included in the lung score protocol, and hence, they were not labeled by the expert in all videos. This was a limitation of the study, which will be further addressed by a second round of evaluation by an expert panel with more clear instructions about labeling A-lines when present.
Regarding B-Lines, the coincidence percentage was 88%, with a higher number of false positives than negatives, which means that the algorithm tends to slightly over-estimate the presence of B-Lines. Coincidence values were reduced when discriminating between isolated and confluent B-Lines affecting more and less than 50% of the pleura, with values of 84.4%, 79.3%, and 85.3%, respectively. This is explained by the fact that discriminating between an affected area of more than 50% or less than 50% of the pleura just observing the images is very subjective, not only because of variations in determining the width of the B-lines but also in the lateral extension of the pleura. In the opinion of the authors this is, indeed, a limitation of the lung score formulation, as the individual zone score changes between 1 and 2 based on this hardly quantifiable observation. In this sense, using a quantitative algorithm like the one presented in this work should have the advantage of giving more consistent results when discriminating between values 1 and 2 of the lung score.
Consolidations were detected with a 93.4% coincidence between the algorithm and the expert, with 4.2% of false positives and 2.4% of false negatives. Again, the number of false positives was higher than the number of false negatives, indicating that, in case of error, the algorithm tended to overestimate the pneumonia severity. About the pleura effusion, it must be pointed out that only 1 case was found by the expert (Table 3), and it was not detected by the algorithm. No conclusion about the algorithm ability for detecting pleural effusions can be extracted from this dataset, apart from the fact that no false positives were produced.
Regarding the patient lung score, the maximum difference between that obtained by the algorithm and by the expert was 5 points (Figure 5). The difference average was 0.8 points, which meant that the algorithm slightly overestimated the lung score. Furthermore, the standard deviation of the difference was 2.2 points, which was a 6% standard error over the full scale of 36 points.
When analyzing the results by zones (Figure 6), there were no significant differences between the algorithm and the expert when detecting B-Lines and consolidations. However, the coincidence in the individual zone score was about 15% lower for zones L3, L4, R3, and R4 than for the rest of the zones. When analyzing these specific regions, it can be observed that the lack of concordance was in determining the affected area of the pleura in the presence of B-Lines, which defined if the score of the zone was 1 or 2 (less and more than 50% of the pleura, respectively). In general, the expert underestimated the width of the B-Lines with regard to the pleura extension, which could be induced by the lower image bright that these lateral zones usually have.
Lung ultrasound has the potential to become a first-line diagnostic tool alternative to conventional chest X-ray and CT scan, including critically ill patients, where LUS-score had already been proven to be useful in diagnosis, prognosis and monitoring management. Moreover, since there is no exposure to ionizing radiation, it can be considered in vulnerable populations such as pregnant women and children. This automatic method might become as a quick and easy solution, in the long-waited standardization of the technique. In particular settings and clinical conditions, might allow to rule in or out quickly and accurately several diagnoses. Save time in the assessment of the lung involvement, with direct impact in the diagnosis, prognosis or monitoring of the disease.
Adopting a standardized protocol (12 areas) such as the one we propose might increase the accuracy of the technique, especially in minimally trained operators, where this automatic method might benefit most, allowing the democratization use of lung ultrasound.

5. Conclusions

The overall conclusion is that calculation of the lung score based on the automatic detection and quantification of artifacts in ultrasound images is feasible. The developed algorithm was able to detect and quantify A-Lines, B-Lines, and consolidations with a high degree of confidence when compared with an expert physician labeling the same images in situ during the scan. The standard deviation of the difference in the lung score between the algorithm and the expert was just 2.2 points over 36, which can be considered acceptable in terms of deciding the degree of severity of pneumonia in COVID-19 patients. Furthermore, as these image artifacts were not exclusive of SARS-CoV-2 infection, the algorithm could possibly be used for assisting the diagnosis of different origin pneumonias.
From the technical point of view, a limitation of the automatic method is that it needs a correctly acquired video for being analyzed, which can sometimes be difficult to achieve for non-experienced personnel. We are currently working in artificial intelligence algorithms for guiding the physician during the scanning process, giving a real-time score of the image quality before processing it. From the clinical point of view, the limitations of the automatic method are that these automatic results, although they can save time in the assessment, need to be integrated with a standard clinical approach to optimize diagnostic accuracy.
Acquiring a complete lung ultrasound exam within a few minutes is possible using fairly simple ultrasound machines that are enhanced with artificial intelligence, such as the one we propose. This step is critical to democratize the use of lung ultrasound in these difficult times.

6. Patents

A patent describing the automatic detection algorithm was presented in December 2020 to the Spanish Patent Office, with registry number P202031284.

Author Contributions

Conceptualization, J.C., M.M., V.G., J.L.H., I.O., A.B., R.G., D.S., R.C.G., Á.T.-V., Y.T.-C.; methodology, Y.T.-C.; software, J.C., M.M., V.G., J.L.H., I.O., A.B., R.G., D.S., R.C.G.; validation, J.C., M.M., V.G., J.L.H., I.O., A.B., R.G., D.S., R.G., Á.T.-V., Y.T.-C.; formal analysis, J.C., M.M., V.G., J.L.H., I.O., A.B., R.G., D.S., R.C.G., Á.T.-V., Y.T.-C.; resources, R.C.G.; data curation, J.C., R.G., J.L.H., Y.T.-C.; writing—original draft preparation, J.C.; writing—review and editing, J.C., J.L.H., Y.T.-C.; visualization, J.C., M.M., V.G., J.L.H., I.O., A.B., R.G., D.S., R.C.G., Á.T.-V., Y.T.-C.; supervision, J.C., M.M., V.G., J.L.H., I.O., A.B., R.G., D.S., R.C.G., Á.T.-V., Y.T.-C.; project administration, R.C.G.; funding acquisition, R.C.G., J.C., J.L.H. All authors have read and agreed to the published version of the manuscript.

Funding

This research was partially funded by CDTI (Spanish acronym: Centre for Industrial Technological Development), funding number COI-20201153. Partially supported by the Google Cloud Research Credits program with the funding number GCP19980904, by the project RTI2018-099118-A-I00 founded by MCIU/AEI/FEDER UE and by the European Commission–NextGenerationEU, through CSIC’s Global Health Platform (PTI Salud Global).

Institutional Review Board Statement

The study was conducted in accordance with the guidelines of the Declaration of Helsinki and approved by the Institutional Review Board of Hospital Universitario Puerta de Hierro (protocol code 2.0 5 April 2021 and date of approval April 2021).

Informed Consent Statement

Informed consent was obtained from all subjects involved in the study.

Data Availability Statement

The authors confirm that the data supporting the findings of this study are available from the corresponding author, upon reasonable request.

Conflicts of Interest

The authors declare no conflict of interest.

References

  1. Liu, R.B.; Tayal, V.S.; Panebianco, N.L.; Tung-Chen, Y.; Nagdev, A.; Shah, S.; Pivetta, E.; Henwood, P.C.; Nelson, M.J.; Moore, C.L. Ultrasound on the frontlines of COVID-19: Report from an international webinar. Acad. Emerg. Med. 2020, 27, 523–526. [Google Scholar] [CrossRef]
  2. Hernández-Píriz, A.; Tung-Chen, Y.; Jiménez-Virumbrales, D.; Ayala-Larrañaga, I.; Barba-Martín, R.; Canora-Lebrato, J.; Zapatero-Gaviria, A.; De Casasola-Sánchez, G.G. Importance of lung ultrasound follow-up in patients who had recovered from coronavirus disease 2019: Results from a prospective study. J. Clin. Med. 2021, 10, 3196. [Google Scholar] [CrossRef]
  3. Islam, N.; Ebrahimzadeh, S.; Salameh, J.-P.; Kazi, S.; Fabiano, N.; Treanor, L.; Absi, M.; Hallgrimson, Z.; Leeflang, M.M.G.; Hooft, L.; et al. Thoracic imaging tests for the diagnosis of COVID-19. Cochrane Database Syst. Rev. 2021, CD013639. [Google Scholar] [CrossRef]
  4. Tung-Chen, Y.; Martí de Gracia, M.; Díez-Tascón, A.; Alonso-González, R.; Agudo-Fernández, S.; Parra-Gordo, M.L.; Ossaba-Vélez, S.; Rodríguez-Fuertes, P.; Llamas-Fuentes, R. Correlation between chest computed tomography and lung ultrasonography in patients with coronavirus disease 2019 (COVID-19). Ultrasound. Med. Biol. 2020, 46, 2918–2926. [Google Scholar] [CrossRef] [PubMed]
  5. Tung-Chen, Y.; Gil-Rodrigo, A.; Algora-Martín, A.; Llamas-Fuentes, R.; Rodríguez-Fuertes, P.; Marín-Baselga, R.; Alonso-Martínez, B.; Rodríguez, E.S.; Soriano, P.L.; Ramos-Rincón, J.-M. The lung ultrasound “Rule of 7” in the prognosis of COVID-19 patients: Results from a prospective multicentric study [published online ahead of print, 2021 Sep 4]. Med. Clin. 2021; in press. [Google Scholar] [CrossRef]
  6. Anantrasirichai, N.; Hayes, W.; Allinovi, M.; Bull, D.; Achim, A. Line detection as an inverse problem: Application to lung ultrasound imaging. IEEE Trans. Med. Imaging 2017, 36, 2045–2056. [Google Scholar] [CrossRef] [PubMed] [Green Version]
  7. Baloescu, C.; Toporek, G.; Kim, S.; McNamara, K.; Liu, R.; Shaw, M.M.; McNamara, R.L.; Raju, B.I.; Moore, C.L. Automated lung ultrasound b-line assessment using a deep learning algorithm. IEEE Trans. Ultras. Ferr. Freq. Cont. 2020, 67, 2312–2320. [Google Scholar] [CrossRef] [PubMed]
  8. Born, J.; Wiedemann, N.; Cossio, M.; Buhre, C.; Brändle, G.; Leidermann, K.; Aujayeb, A.; Moor, M.; Rieck, B.; Borgwardt, K. Accelerating detection of lung pathologies with explainable ultrasound image analysis. Appl. Sci. 2021, 11, 672. [Google Scholar] [CrossRef]
  9. Diaz-Escobar, J.; Ordóñez-Guillén, N.E.; Villarreal-Reyes, S.; Galaviz-Mosqueda, A.; Kober, V.; Rivera-Rodriguez, R.; Lozano Rizk, J.E. Deep-learning based detection of COVID-19 using lung ultrasound imagery. PLoS ONE 2021, 16, e0255886. [Google Scholar] [CrossRef] [PubMed]
  10. Roy, S.; Menapace, W.; Oei, S.; Luijten, B.; Fini, E.; Saltori, C.; Huijben, I.; Chennakeshava, N.; Mento, F.; Sentelli, A.; et al. Deep learning for classification and localization of covid-19 markers in point-of-care lung ultrasound. IEEE Trans. Med. Imaging 2020, 39, 2676–2687. [Google Scholar] [CrossRef] [PubMed]
  11. Mento, F.; Perrone, T.; Fiengo, A.; Smargiassi, A.; Inchingolo, R.; Soldati, G.; Demi, L. Deep learning applied to lung ultrasound videos for scoring COVID-19 patients: A multicenter study. J. Acoust. Soc. Am. 2021, 149, 3626–3634. [Google Scholar] [CrossRef]
Figure 1. (a) UTRACOV scanner prototype and (b) screenshot of the acquisition software.
Ijtm 02 00002 g001
Figure 2. Output of the automatic detection algorithm (a) normal scan, (b,c) B-Lines, (d) consolidation. Overlay colors represent A-Lines (green), B-Lines (orange), and consolidations (red).
Ijtm 02 00002 g002
Figure 3. Graphical representation of the 12 scanned zones and the names used. “L” stands for left, “R” for right and the number identifies the zone (Source https://www.winfocus.org/ accessed 27 December 2021).
Ijtm 02 00002 g003
Figure 4. Lung score calculated from the expert findings (blue) and from the algorithm output (orange). In patient 16 the score was 0 for the expert and the algorithm.
Ijtm 02 00002 g004
Figure 5. Lung score difference between the algorithm and the expert.
Ijtm 02 00002 g005
Figure 6. Automatic detection coincidence by zone for B-Lines (blue), consolidations (orange), and zone score (gray).
Ijtm 02 00002 g006
Table 1. Ultrasound image parameters.
ParameterValueUnits
Scan typeSector scan
Active aperture32elements
No. of image lines82lines
Image depth13cm
Emission focus depth4cm
Digital band-pass filter1.8 to 5MHz
Time-gain compensation0.14dB/mm
Table 2. Comparison between the indications detected by the automated algorithm and the expert.
IndicationCoincidenceFalse PositivesFalse Negatives
A-Lines70.7%23.1%6.2%
Isolated B-Lines84.4%7.5%8.1%
Confluent B-Lines (<50%)79.3%11.1%9.6%
Confluent B-Lines (>50%)85.3%8.1%6.6%
Any B-Line88.0%7.8%4.2%
Pleura effusion99.7%0.0%0.3%
Consolidation93.4%4.2%2.4%
Zone score72.8%16.5%10.7%
Table 3. Dataset statistics from the expert labels.
Artifact TypeNumber of VideosPercentage
Videos with A-Lines20762.0%
Videos with B-Lines16348.8%
Videos with pleura effusion10.3%
Videos with consolidations257.5%
Total334100%
Publisher’s Note: MDPI stays neutral with regard to jurisdictional claims in published maps and institutional affiliations.

