Article

Assessing Microplastic Prevalence and Dispersion from Saigon Urban Canals via Can Gio Mangrove Reserve to East Sea by Raman Scattering Microscopy

1
Institute of Waste Management and Circular Economy, Department of Hydrosciences, Faculty of Environmental Sciences, Technische Universität Dresden, Pratzschwitzer Str. 15, 01796 Pirna, Germany
2
Faculty of Chemical Engineering, Industrial University of Ho Chi Minh City, Nguyen Van Bao Str. 12, Ho Chi Minh City 70000, Vietnam
3
Institute for Environmental Science, Engineering and Management, Industrial University of Ho Chi Minh City, Nguyen Van Bao Str. 12, Ho Chi Minh City 70000, Vietnam
*
Authors to whom correspondence should be addressed.
Microplastics 2022, 1(3), 536-553; https://doi.org/10.3390/microplastics1030038
Submission received: 27 June 2022 / Revised: 26 August 2022 / Accepted: 29 August 2022 / Published: 5 September 2022
(This article belongs to the Special Issue Microplastics in Marine Environment)

Abstract

:
Plastic pollution is one of the significant environmental concerns due to the threefold increase in global plastic waste. Marine microplastics, including petroleum-based plastic pieces and synthetic and artificial fibers smaller than 5 mm, are not only ubiquitous in natural water but also high in wastewater streams due to the direct discharge, transfer and breakdown of plastic items. This research aims to investigate the presence and dispersion of microplastics in the downtown area and coastal suburban area of Ho-Chi-Minh City by using Raman microscopy. As a result, the most common plastics (PE, PET, PA, PP, PVC, PS and PMMA) were detected, and most of them were fibrous shorter than 500 μm. The total microplastics decreased gradually from the urban waterborne (up to 220 MPs/L) via Can Gio UNESCO Mangrove Biosphere Reserve (10 MPs/L) and to the East Sea (3 MPs/L), which reveals the potential role of the mangrove in reducing marine contaminants including microplastics. This study provides important insights into microplastic pollution in the Western Pacific Region, especially the Saigon-Dong Nai river systems, supporting useful data for natural water resources management.

1. Introduction

Plastic products are generally inexpensive, lightweight, and durable, bringing technological and medical advances, energy savings, and other societal benefits. Therefore, the plastic industry has increased global manufacture substantially, up to nearly 370 million tons in 2019 [1]. Mismanaged plastic waste has introduced 8–12.7 million tons of plastic (PP, PE in prevalence) into the ocean every year [2]. The top polluting rivers globally are primarily located in Asia, accounting for 67% of the global total. Vietnam is in the world-top countries with the estimated amount of plastic waste discharged into the sea from 0.28 to 0.73 million tons/year [3], and ranked fourth in the world about plastic waste mismanagement [4]. Southern Vietnam featured an interlaced system of rivers, streams and canals with asymmetric semi-diurnal tides. Ho Chi Minh City (HCMC, Saigon) is the most populous and largest economic center of Vietnam. In 2014, about 8175 tons of municipal solid waste were generated daily, textile and plastic components accounted for 5–7.2% and 16–25%, respectively [5]. Saigon (SG) River flows to HCMC, forming main canal systems—Nhieu Loc-Thi Nghe (NL-TN), Te (KT), Đôi (KĐ), Tau Hu (TH), Tan Hoa-Lo Gom (LG). At least 2000 metric tons of floating debris are collected every year on the main urban canals of Saigon [6]. Saigon River merging with Đong Nai River flows through Can Gio Mangrove to Ganh Rai Gulf of the East Sea (South China Sea). Can Gio, a coastal district of HCMC, is the first Mangrove Biosphere Reserve of Vietnam designated by UNESCO in 2000. It functions as a natural water filter for the marine environment by remaining and diluting soluble pollutants in rivers from the city. The reserve is divided into three zones: (1) core zone (4720 ha) with few households and strict forest protection; (2) buffer zone (37,340 ha) where traditional exploitation in rivers is unregulated; (3) transition zone (29,310 ha) where intensive aquaculture (oysters, shrimps, clams, etc.) and tourism are along the shoreline [7].
Plastic items tend to be broken into small particles with a wide range of shapes and sizes under chemical weathering, photo-degradation and physical and biological reactions. Annually between 0.8 and 2.5 million tons of microplastics (MPs), two-thirds of them are synthetic fibers released during washing and erosion of tires while driving [8]. According to the size, they are classified as mesoplastics (>5 mm), large microplastics (1–5 mm), small microplastics (≤1 mm) and nano plastics (<100 nm) [9]. Plastic debris causes an aesthetic loss of urban landscape and poses a hazard to aquatic wildlife and human maritime activities. Nearly 700 marine species such as dolphins, sharks, crocodiles, crabs and invertebrates have been reported to be affected by microplastics. “Ghost fishing” from fishing nets left on the beach due to accidental or deliberate fishing activities could entangle turtles, coral reefs, other valuable creatures, and even human divers, resulting in losses to commercial fisheries and lethal dangers of marine entertainment [10]. Some species specifically select plastic debris since they mistake similar-size microplastics for food [11]. The uptake of microplastics results in physical conditions such as bowel obstructions [12], reduced food intake, behavior changes, and chemical effects such as inflammation, hepatic stress and reduced reproductive output due to plastic additives [13].
The monitoring of microplastic pollution is still a big challenge because the distribution of plastic debris is affected by different factors in the marine environment. Moreover, microplastics analysis is a very complicated field, which has been conducted for many years. It has been difficult to validate the procedures and reproduce and compare the results between studies since the standardized and validated methods are still under development [14]. Different methods have been used to sample microplastics in the sweater. In volume-reduced methods, manta trawls or nets are used to collect floating microplastics around 300 μm [9]. In contrast, bulk sampling takes the whole volume of water samples by using pumps or other techniques, and therefore can be used to obtain particles smaller than 300 μm [15]. Nets or manta trawls are preferable for large-scale surface water sampling in the sea since they can filter a large volume of water to collect the target-sized microplastics [9]. Nonetheless, a manta trawl system is expensive, and the result depends on the net size. Microplastic abundance can be underestimated because plastics smaller than the net aperture size may pass through trawls [9]. On the other hand, bulk sampling is more advantageous for point sampling [16]. As there are no size limitations in the sampling, a wide range of size fractions, from large to smaller microplastics, can be identified.
A typical workflow for microplastic analysis comprises physical and chemical characterizations. Physical identification includes a microscope, and if necessary, combined with a melting test for >50 μm microplastics [17]. The visual sorting is based on microplastics’ morphology observed under a dissection microscope with or without stained with Rose Bengal [18], a fluorescence microscope after dyed with Nile Red [19], or a scanning electron microscope (SEM) [20]. Although the Nile Red method is highly sensitive, biogenic materials such as lipids and chitin will interfere with the plastic detection, and plastic types may give similar color signals [21]. Hence, the visual methods should be combined with a spectrometer. FT-IR spectroscopy is a convenient tool to determine marine microplastics [22,23]. Raman spectroscopy based on the interaction of molecules with photons in monochromatic light has recently attracted more attention [24,25] due to the non-destructive feature, better resolution, wider spectral coverage and lower water interference [26]. It can replace FT-IR or be used with FT-IR to obtain the best results [27]. Confocal Raman microscopy (CRM) is an improved system involving the pairing of an optical microscope with a Raman spectroscopy. This system provides chemical information with spatial resolution images of very small pieces, up to 1 μm [28]. It has many benefits over fluorescence microscopy since it does not need external labeling. In addition, thermal analysis such as TED-GC/MS and pyrolysis-GC/MS has been employed with high reliability [20,29]. However, the chromatographic operation and procedure are more complicated, compared with the spectroscopic methods.
Saigon-Dong Nai basin is one of the main river systems of Vietnam, but there have been several studies on its plastic pollution [6,30,31,32]. According to the data of [31] the number of anthropogenic fibers varied from 22 to 25 items per liter during the 1.5-year survey, and there was no relation between their concentration variations with rainfall, water discharge or abiotic factors. There are four main river systems through Can Gio Mangrove: (1) Soai Rap (Western border with Mekong Delta), (2) Đong Tranh (Northern border with Đong Nai), (3) Thi Vai River (Eastern border with Vung Tau province) and (4) Long Tau, which flows to Ganh Rai Gulf. To the best of the authors’ knowledge from searching the literature, there were no official published research articles on microplastics in the Can Gio Biosphere Reserve by other research groups. All publications focused on the microplastic accumulation in the Saigon-Dong Nai basin (172–519 fibers/L, 0.01–0.223 fragments/L) [30] and Vung Tau (Dinh River, <0.1 MPs/L) [32] by using FT-IR and/or stereomicroscopic methods. This article aims to prove the spec-ificity and versatility of Confocal Raman microscopy (CRM, or μ-Raman spectroscopy) and employ the method in investigating the prevalence and dispersion of microplastics from Saigon urban canals to Can Gio Mangrove and eventually to the East Sea of Vietnam.

2. Materials and Methods

2.1. Reagents and Equipment

The powdered standard plastics were purchased from Goodfellow (Hamburg, Germany): low-density polyethylene (LDPE) with an average particle size of smaller than 300 microns; polyethylene terephthalate (PET) 300 µm, un-plasticized polyvinyl chloride (uPVC) 250 µm, poly(methyl methacrylate) (PMMA) 85 µm, and nylon-6 (PA-6) particles 15–20 µm in size. In addition, the raw pure plastic particles (diameter of 3 mm) of PP, HDPE and PS were supplied by Vietnamese plastic production companies.
Filtered deionized water (FDW) was prepared by filtering deionized water through a 0.4-μm filter membrane (Sigma Aldrich, Ho-Chi-Minh City, Vietnam) with the support of a vacuum filtration system before use. Whatman GF/A glass-fiber filter paper (diameter 47 mm, pore size 1.6 µm) was used to extract microplastics.
A ZEISS Stemi 508 Stereo Microscope with 8:1 Zoom was firstly used to observe the whole area of the GF/A membrane and count the total number of particles. Every single piece was then analyzed in viewing and Raman modes with the XploRA Horiba Raman One 532 nm integrating with optical parts of Olympus (Horiba Scientific, Montpellier, France).

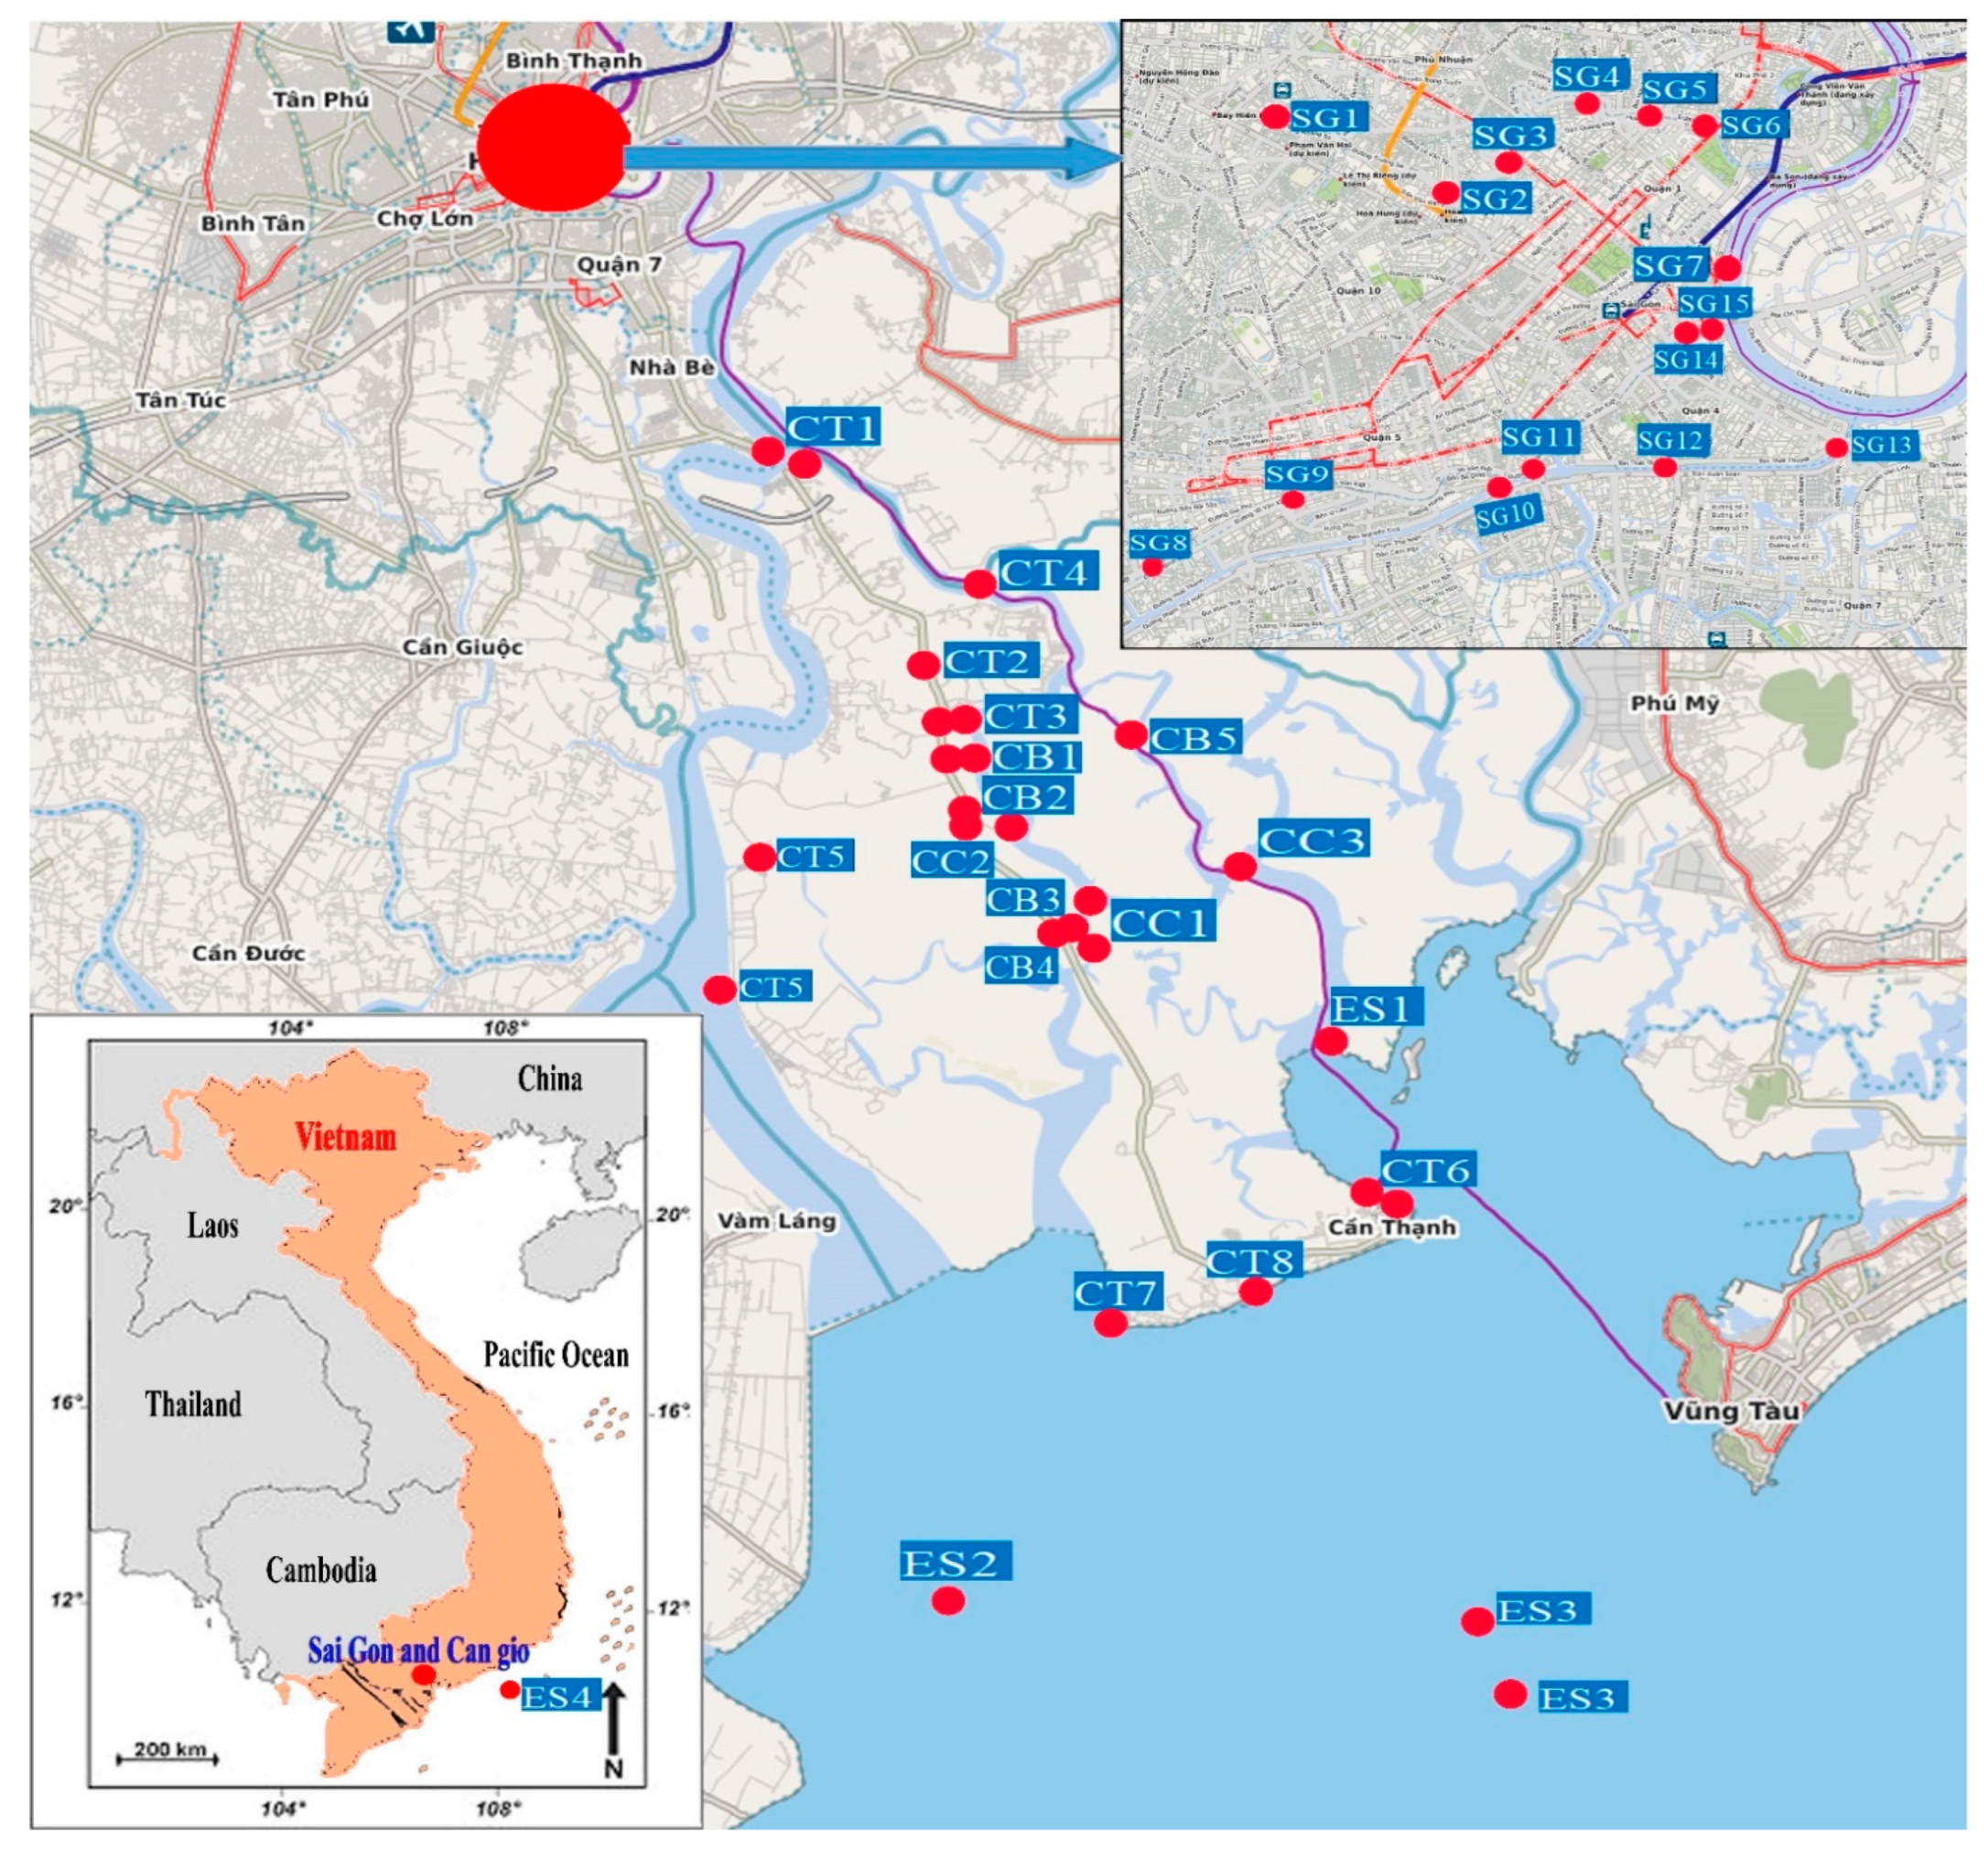
2.2. Study Areas and Sampling Methods

The sampling locations were marked on the map (Figure 1) (see detailed description and coordinates in Table S1 in Supplementary Materials). Bulk sampling was used in previous studies [30,33,34,35] from February 2020 to March 2021. Wildco horizontal alpha water sampler or bucket (Table S2i in Supplementary Materials) was used to take the water at the surface (surface water deep to 30 cm) during the slack water (end of low tide). To obtain the reproducible and representative results for each canal system or zone of the reserve, water was taken in different sampling locations (Table S1 in Supplementary Materials). At each location, at least five water samples (1 L per sample) for five replicate analyses (up to 45 replicates for the Ganh Rai location in the East Sea) were taken in the middle along every canal system in the center of Ho Chi Minh City (Saigon urban canals); randomly in transition, buffer and core zones of Can Gio mangrove from the boat; and in the sea (ES1, ES2, ES3 and ES4) from the canoe.

2.3. The Workflow for Marine Microplastic Extraction and Analysis

Microplastics were extracted from the water samples by using the procedure of Khuyen et al. [36]. With the aid of a vacuum pump, 1 L of water sample was directly filtered through a GF/A membrane until the membrane became brownish yellow. Visible items on the filter membranes were picked up, cleaned with filtered deionized water (FDW), and stored for microplastic observation. All materials were immediately washed off with FDW, and the final volume of supernatant containing microplastics was reduced to only 100–200 mL. The supernatant was then digested with 30% hydrogen peroxide at 70–80 °C until the solution was discolored, and the mixture was incubated at room temperature overnight. Finally, the mixture was filtered and microplastics deposited on the filter membranes were analyzed with a Raman microscope. Five replicates of 1 Liter were applied for each sampling location.

2.4. Quality Control

There was a field control sample at each sampling location. Glass bottle containing 1 L of FDW was opened and placed during the sampling collection. Bottles containing samples were carefully sealed and transported to the laboratory. The air control samples were clean filter membranes on glass Petri dishes around the working area during sampling handling, vacuum filtering, and microplastic analysis. The water control samples were bottles containing 500 mL FDW. All the control samples were directly analyzed to observe whether contaminating microplastics were found in the actual samples. As a result, no microfibers were found, showing that fibers found in the study were not from clothes worn in the laboratory and during the sampling.

2.5. Statistical Analysis

The number of pieces was counted manually and classified by polymer type, shape and color. The detailed procedure for distinguishing microplastics will be described in Section 3.1. The microplastic abundance in samples was expressed as items per liter of water (MPs/L), and the results were evaluated for statistical homogeneity by analysis of variance (ANOVA). Tukey’s multiple comparison test was used to analyze the mean differences between sampling locations in Saigon canal systems, between locations in Saigon with Can Gio, and with the East Sea. All statistical analyses were performed at a 95% confidence interval on SPSS v22 software (IBM SPSS Statistics 22, Armonk, NY, USA).

3. Results and Discussion

3.1. Combined Qualification and Quantification of Microplastics by Raman Microscopy

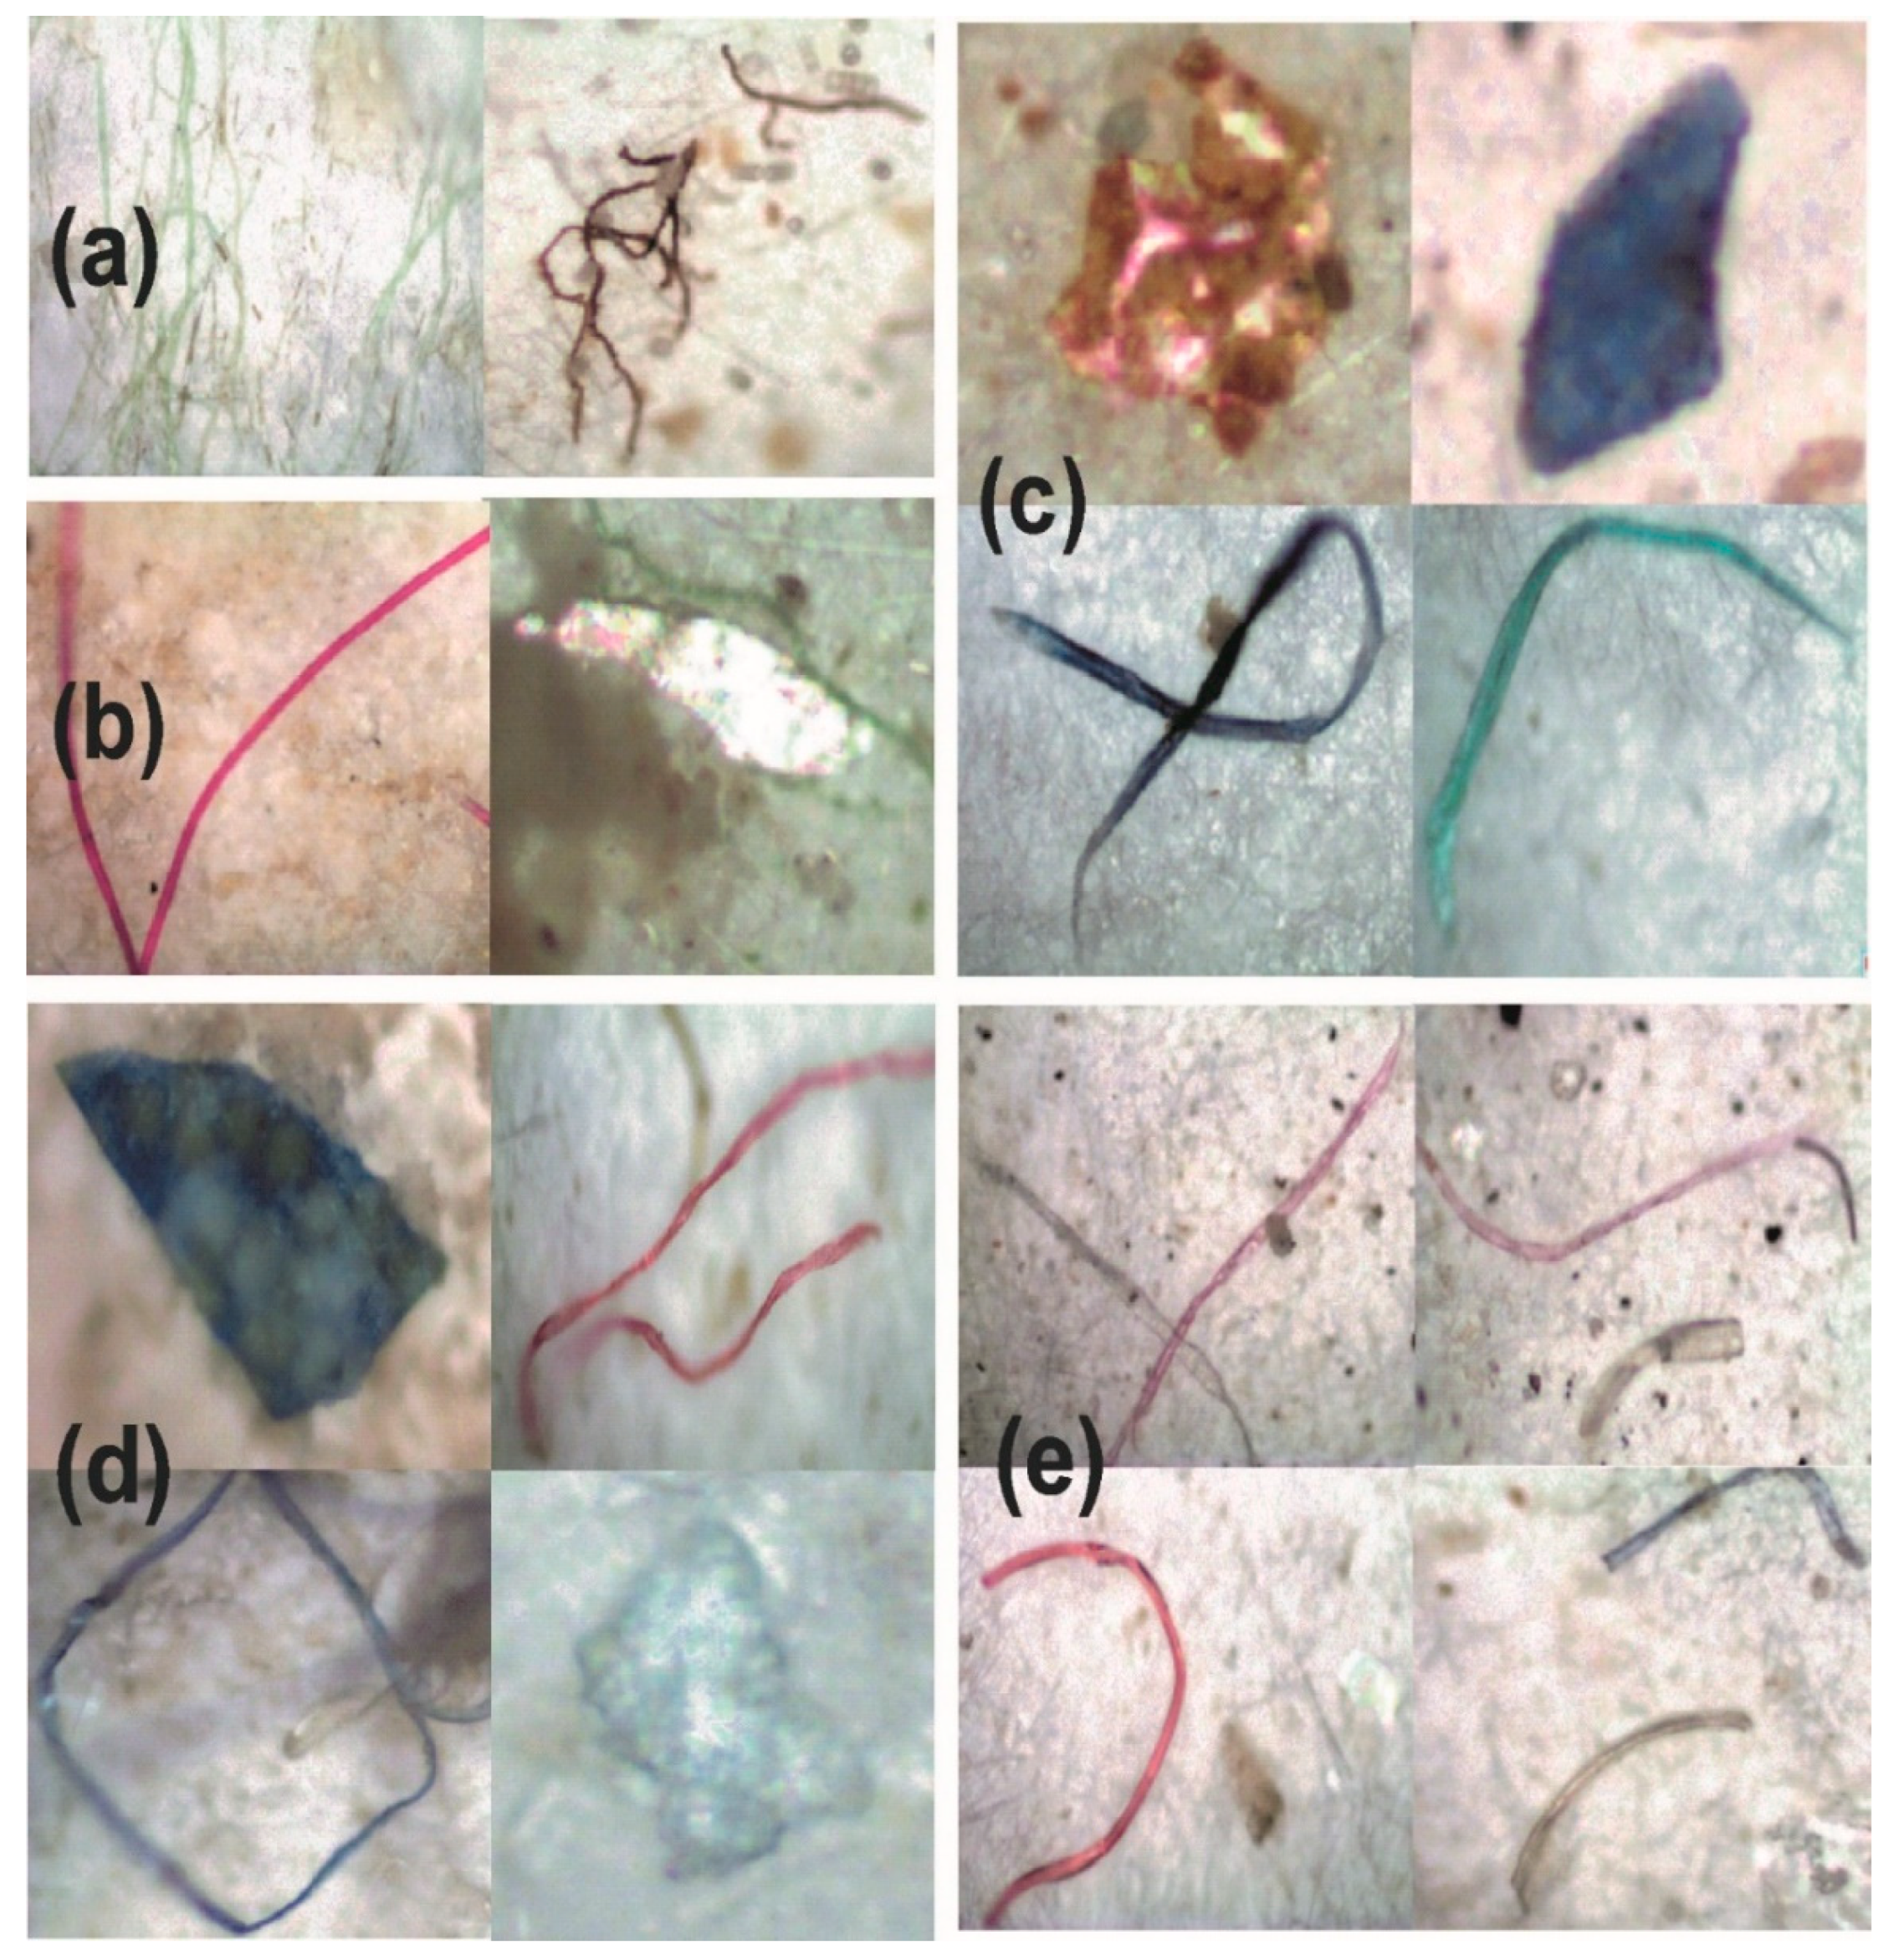
3.1.1. Visual Identification

The viewing mode includes two objectives: 10× and 50×. The larger objective allowed to zoom powdered particles in the case of PA and PMMA. However, the images were not always clear. Thus, the shape, color and size (μm) were observed at 10×. The final size was calculated depending on the shape. It was expressed as length for microfibers, and the sum of width and length for non-fibrous forms.
The morphology of debris under the microscopic mode could be used to quantify the microplastics. Some criteria described by [37] were applied to distinguish microplastic fibers (clothing, fishing nets, for instance) from non-plastic fibers (organic, or cellular structures, Figure 2a). Microplastic fibers were (1) clear and homogeneously colored, (2) soft and three-dimensional bendable Figure 2c; (3) equally thick, not segmented and not tapered towards the ends. Fibers, especially dark-colored ones, meeting the above requirements but having complicated spectra were called “unidentified group”. Moreover, the lengths of some fibers were close to the widths, and these cases were recorded in the shape of “bars or sticks” instead of particles as suggested by [15]. Non-fibrous shapes included particles with either spherical or aggregate of spheres, fragments (particles with jagged edges as a signal of fragmentation) and films with square or rectangle images. However, the film category always accounted for a small percentage, mainly because they were broken down into threads and filaments, thereby classified into fiber categories [38]. The other groups are foams and pellets (granules with the shape of a cylinder or a disk manufactured as a raw material of plastic goods).
In addition to shapes, colors can be a preliminary tool to guess the plastic type, behavior and origin of microplastics. Clear and transparent particles have been ascribed to polypropylene (PP) [39], while black represented the sorption of PAHs and PCBs on PP and polystyrene (PS) [40]. White pieces were assigned to polyethylene (PE) [39], and their film or sheet shapes suggest they come from shopping bags and agricultural and food packaging films [41]. Colors can also indicate the weathering and decomposition degree, and residence time at the seawater surface. The discoloration can be caused by long exposure to UV light (translucent color) [42,43]. In other words, the discoloration (yellowing) is a result of oxidized PCBs adsorbed on plastic resins in the environment [44].

3.1.2. Spectroscopic Identification

The Raman spectrometer with a 532 nm excitation laser and a charge-coupled device (CDC) detector was used to measure spectra of each item at ×50 objective in an integration time of 15 s and a grating of 900 gr/mm in a range wavelength from 50 to 3600 cm−1. In practice, plastic additives and organic pollutants such as PCBs, PAHs adsorbed on microplastics’ surface made the spectra more complex. Hydrogen peroxide (H2O2 30–35%) is a conventional oxidizing agent with higher efficiency, but little to no degradation of polymers, compared with HCl and NaOH [45]. The effectiveness depends on its concentration (15–35%), temperature (room temperature up to 70 °C) of incubation and reaction times (a few hours to a week) [45,46]. The sample treatment was performed on all polymer standards before it was applied to the actual samples to evaluate the deterioration effects on the plastic types. The results showed their morphology and Raman spectra were not affected by peroxide oxidation. Thus, the peak shifts of sampled microplastics were mainly caused by the degradation in the environment. Nevertheless, as can be seen in Table 1, vibration wavenumbers of functional groups in pure plastic molecules could be recognized in the sampled microplastics’ spectra, which pointed out the high specificity of Raman spectroscopy in identifying the chemical composition of most common plastics.

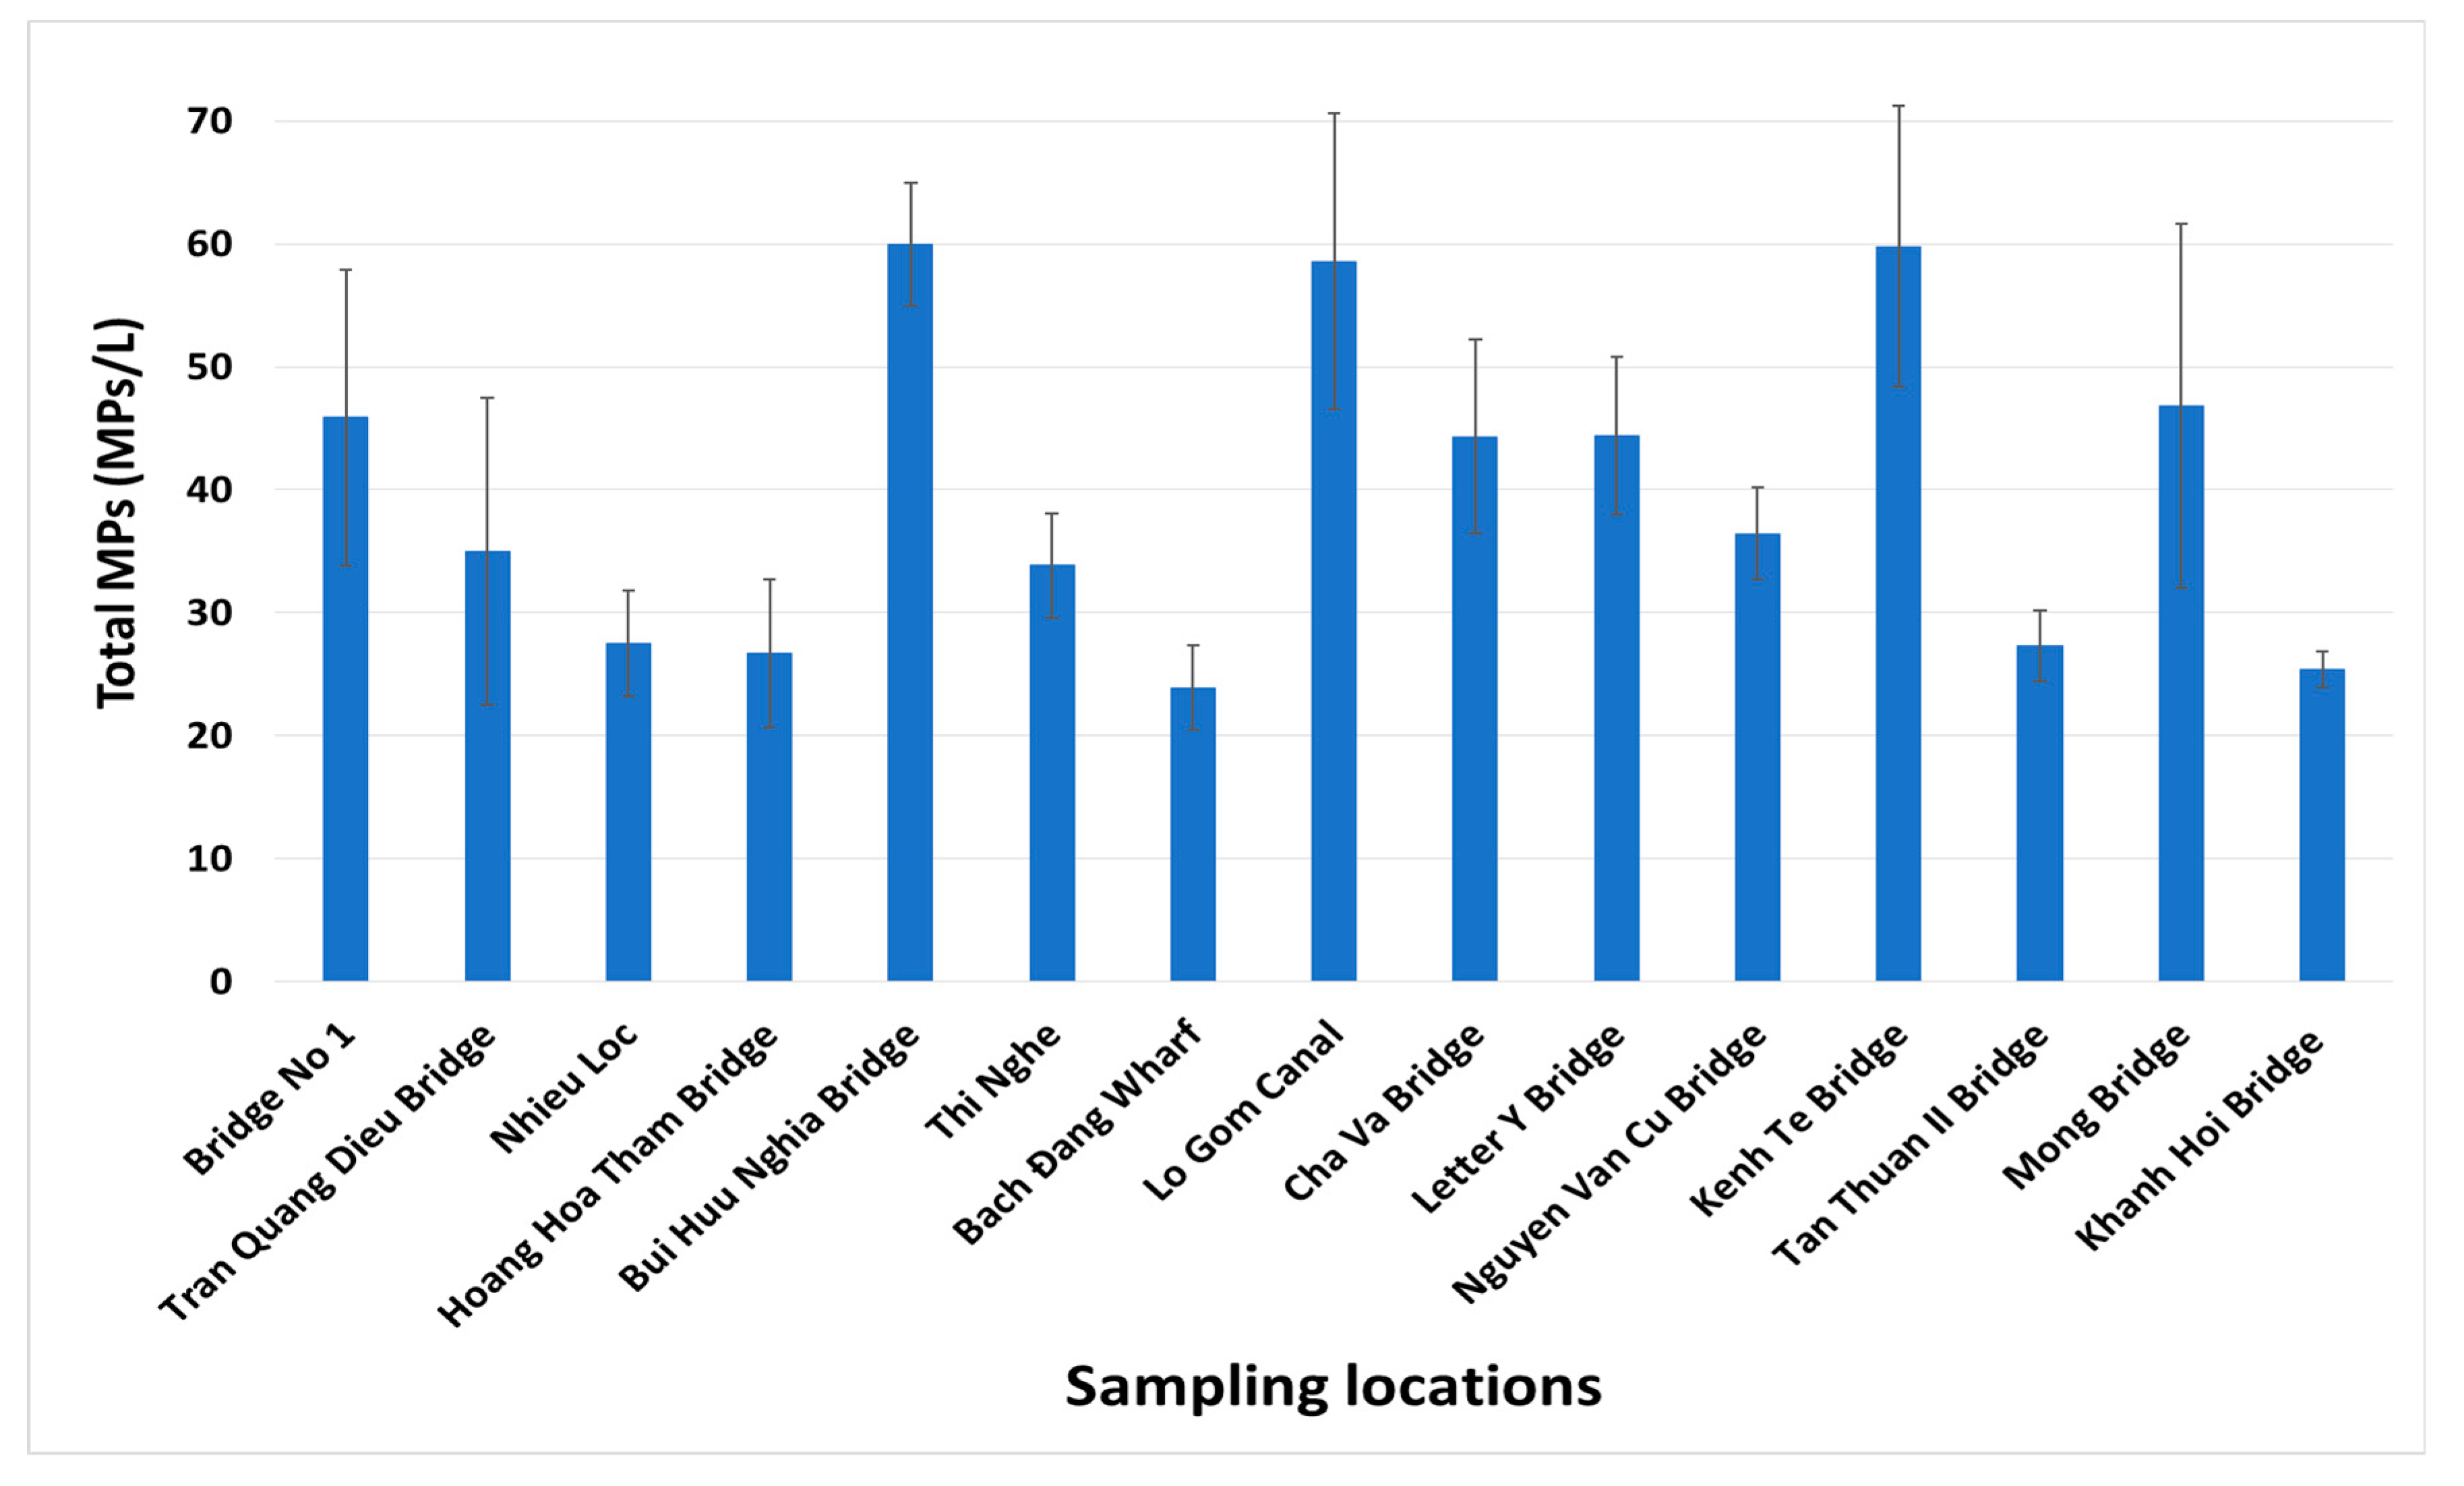
3.2. Microplastic Pollution in the Freshwater at Saigon Urban Canals

Figure 3 showed the uneven distribution of microplastics in locations of Ho Chi Minh City. The microplastic amount was highest in residential areas, 45.89 ± 24.04 MPs/L in Bridge No. 1 (SG1 on the map, Figure 1) where floating rubbish from NL-TN canal was gathered, varied from 44.33 to 58.57 MPs/L in Tau Hu Canal (SG8, SG9, SG1, SG11) belonging to Districts 6, 7, 8 and Tan Binh. Microplastics were found with a noticeably high abundance in some samples at the locations where the water environment was concentrated (dark color) with a higher number of visible floating garbage such as food boxes, clothing pieces and nylon bags. Among the repetition times, there were replicates obtaining a very high abundance of plastic debris, for instance, 160 MPs/L in Bridge No. 1 (SG1, Figure S1a), 110 MPs/L in Letter Y Bridge (SG10), 125 MPs/L in Lo Gom canal (SG10), and 220 MPs/L in Kenh Te Bridge (SG12). There was a dramatic decrease in the microplastic amount from the pollution sources to Saigon River estuaries, for example, 23.92 ± 19.23 MPs/L in Bach Đang Wharf (SG7), and 27.33 ± 6.23 MPs/L in Khanh Hoi Bridge (SG15). Indeed, Tukey’s multiple tests showed significant statistical differences between Kenh Te Bridge and Khanh Hoi (Sig. = 0.005, Table S4), and Bach Dang Wharf (Sig. = 0.021, Table S4). There were no statistical differences between other locations.
These locations are grouped into four canals according to the geographical division of the Government. Nhieu Loc-Thi Nghe is a separate system inside HCMC flowing to Saigon River, while other canal systems connect HCMC with neighboring cities. Ben Nghe Canal (3.1 km) originates from the Lo Gom-Tau Hu Canal system (9 km), the Te Canal (KT, 4.5 km) is the continuation of the Doi Canal system (8.5 km). Đoi-Te and the Ben Nghe-Tau Hu canal basins join at the position of Nguyen Van Cu Bridge before flowing to Saigon River. Regarding the composition (Table 2), the percentages of plastic types were similar at close locations belonging to each canal system. In general, nylon was the most abundant component, followed by polyester fibers. PE was also the second most frequently sorted in Ben Nghe and Te basins. In Nhieu Loc and Lo Gom basins, PE and PP were identified at the same proportions. Polystyrene was found with a higher percentage (around 12%) in the study of [56] but made up small percentages in our study. In fact, many fragments of PS food boxes were seen floating on surface waters while sampling, but they were regarded as macroplastics. Small-size particles in black color had a Raman band only at 1000 cm−1 of PS, which was not enough to assign them as PS microplastics. Physical processes, particularly wind blowing and water mixing influenced the sinking behavior of plastic debris, strongly affecting the presence of PS micro-size classes (<2 mm) [57].
Nhieu Loc-Thi Nghe canal system plays an important role in the city’s activities during its foundation and development. This 8.7-km long canal flowing through seven districts was the cleanest canal at the beginning of the reclamation of land in Southern Vietnam. It became the dirtiest canal in the 1970s mainly due to the discharge of solid waste and wastewater from the slums on both sides of the banks. The water quality in this canal has been significantly improved since 1993. It is now the cleanest canal in the city, thanks to the largest canal clean-up programs (HCMC Environmental Sanitation Project) funded by the World Bank and the City Government [6]. Nonetheless, plastic pollution is still a concerning problem because plastic wastes can come from different sources such as direct dropping litter on land or at sea, blowing, leaching from landfills and losses during transport. According to statistical data from Barnes et al. [58], a large proportion of 40–80% of plastic garbage is from carrier bags, packaging, footwear, cigarette lighters and other domestic items. Indeed, in all urban canals, there is floating debris that comes from discarded wastes of tourists and residents, and natural vegetal waste, mainly water hyacinths drifting in from the Sai Gon River during high tides. The floating debris life cycle is specific to each canal and not involved in solid waste management. The floating debris collection is very active in Nhieu Loc–Thi Nghe canal, conducted every day from 6 am to 6 pm. Indeed, the average values showed the lowest abundance of microplastics in this canal (Table 2), which is similar to the study of Lahens et al. [30]. The water quality of KT and TH-BN canal basins has been improved to some extent thanks to HCMC Water Environment Improvement Project funded by the JICA [6]. Nonetheless, TH and LG canals flow along with the highest populated districts with many slum areas along the canals. The mismanaged wastewater management and ineffective floating debris collections in these districts led to higher pollution compared to the Nhieu Loc canal [6].
The average of MPs in our study (38.45 ± 24.93) was two orders of magnitude lower than the range of total microplastics reported by Lahens et al. [30] (172–519 fibers/L). The noticeable differences can be explained by different time periods, sampling techniques and analysis methods rather than the levels of plastic pollution in the studied regions as proposed by Enders et al. [15]. A few bundles of green fibers (Figure 2a) were detected in the state of being twisted together, thereby considered as “non-microplastics” due to unclear shapes. Moreover, we found a large number of black particles whose images and spectra were difficult to identify. Indeed, Raman analysis of black particles resulted in a considerably higher rejection rate, as suggested by Lenz et al. [59]. Hence, only black items with clearly homogenous shapes and identifiable structural characteristics were included in microplastic data, consequently leading to small percentages (1.58–6.7%) of black color.

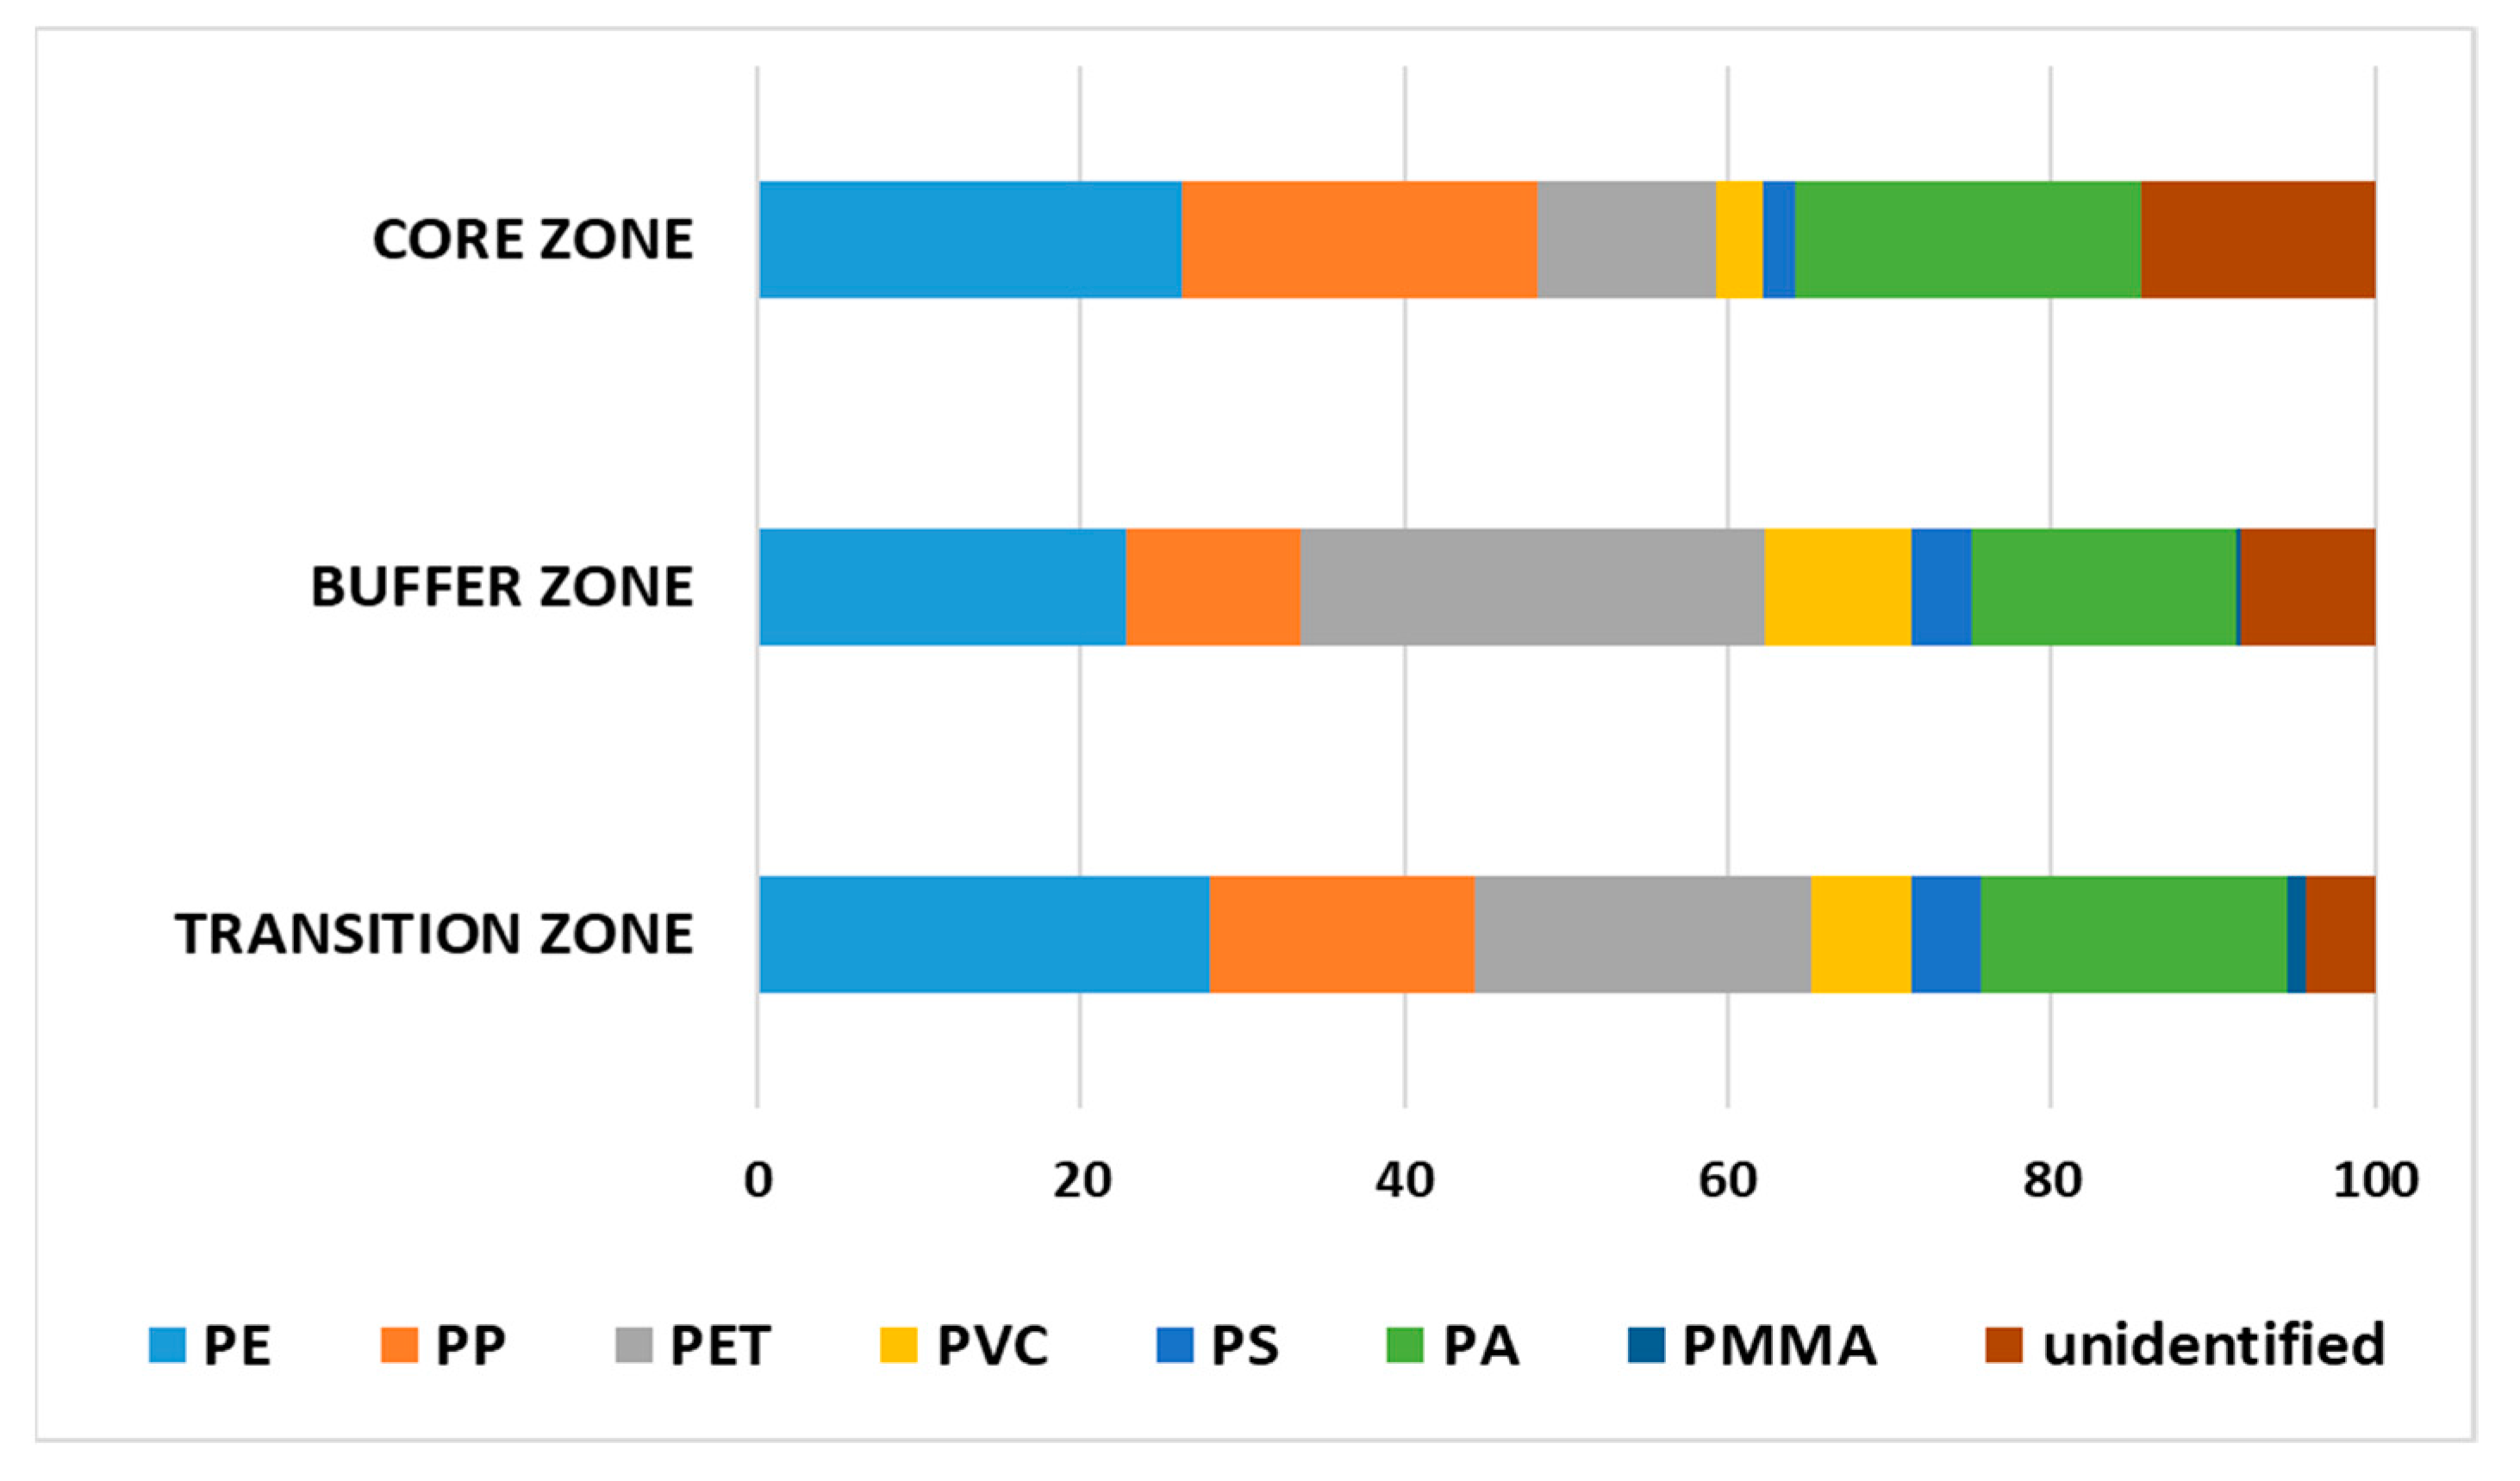
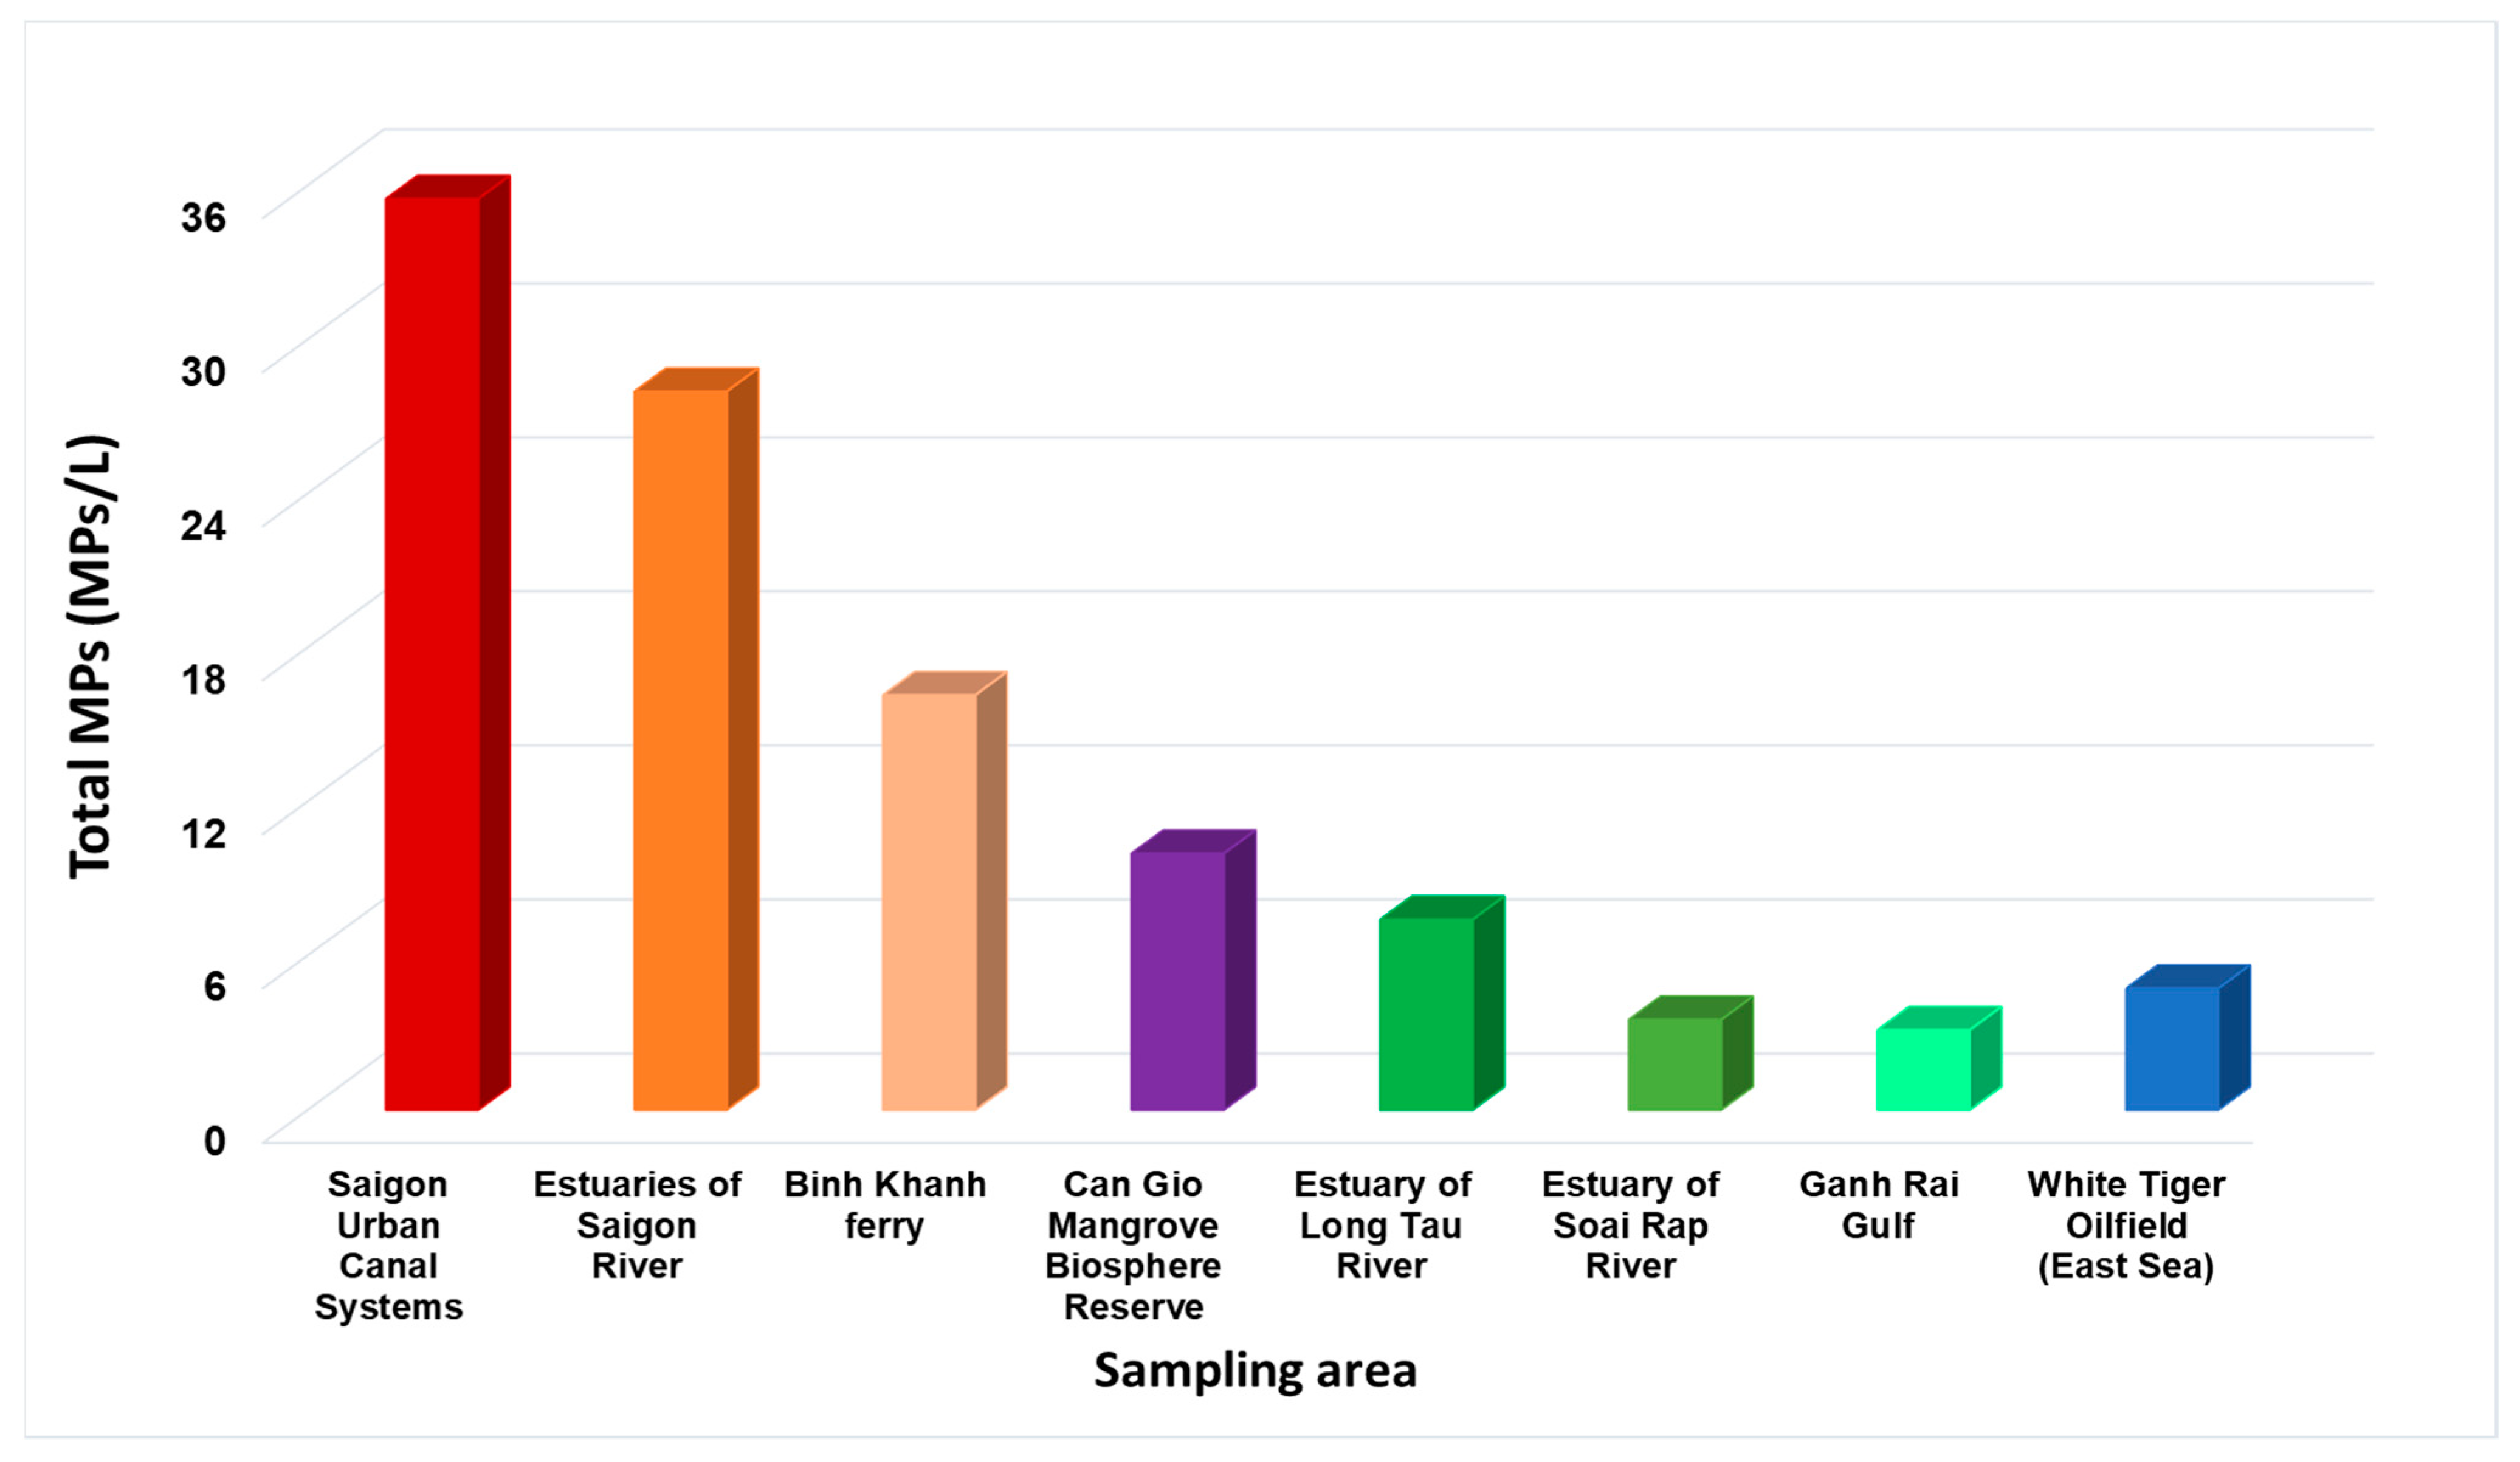
3.3. Spatial Distribution of Marine Microplastic from Can Gio Biosphere Reserve to the East Sea

The downstream of Saigon River merges with Dong Nai River to form Nha Be River and divides into two branches: Long Tau and Soai Rap Rivers, flowing to the East Sea (South China Sea) through Can Gio Mangrove. Plastic pollution sources, including direct dropping litter on land or at sea, blowing, leaching from landfills, and losses during transport, are mainly in the transition zone (from CT1 to CT8 on the map). Nevertheless, its total microplastics (10.45 ± 3.67 MPs/L) are similar to the buffer zone (from CB1 to CB5 on the map) (10.75 ± 3.13 MPs/L), where human activities are more restricted. The geographical position is proposed to be the main reason. The transition zone consists of outer areas that are strongly affected by coastal features such as winds, waves, tides and river runoff, which makes microplastics dispersed and diluted unevenly [34]. Moreover, there are no clear geographical maritime boundaries between the zones because adjacent areas share the local canals and rivers.
Figure 4 indicates the distribution of plastic types in the zones of the Can Gio reserve. PE was the most abundant type in the transition and core zones, and almost all of it was in the form of fragments and particles. PET was the largest group in the form of fibers (35%) and fragments (35%) in the buffer zone but was the second-most dominant, mainly in fibrous form (53.57%) in the transition zone and in both fibers (31.25%) and particles (31.25%) in the core zone. Fibers were found to be abundant in the transition zone, especially in coastal locations. Can Gio 30 April Beach is the most attractive recreational beach, which is considered a vital pollution source, especially of polyamide fibers [60]. Fishing is the main income source of the local people, especially in Can Thanh. Zhu et al. [41] proposed that the origin of blue nylon fibers is cables used in fishery activities. Moreover, fibers could originate from shipping [61], especially at the intersection of main rivers—Đong Tranh and Long Tau, where large ships circulate every day. In addition to plastics’ density at this location, the buoyancy effects of marine plastics in the water column were mediated by a high level of surface mixing caused by boat movement and seawater turbidity [34]. As a result, PET and PA dominated (26.53%), followed by PP (20.41%) and PE (10.2%).
In other words, microplastics were observed but in lesser numbers (7.48 ± 1.28 MPs/L) in the core zone (from CC1 to CC3 on the map) although human domestic activities are strictly prohibited. This proves microplastics can be detected in areas far from pollution sources, and their abundance would depend on the proximity to urban sources. Microplastics, therefore, could be released from outer regions and float under the natural forces of water flows and accumulated in convergent zones [34]. The sediment of mangrove forests can be a suitable environment for microplastic storage because we found some white fragments and blue fibers similar to ones in the seawater. The debris is difficult to detach from the sediment due to the sticky characteristics of the sediment. Furthermore, pollutants retained in the core zone would be difficult to return to the marine environment because the waves are attenuated, and the water surface here remains calm [62]. Some studies reported the presence of microplastics in the mangrove sediment and roots [63], but the role of mangroves as a filter of plastic debris for the seawater needs more investigation.
Figure 5 demonstrates remarkable changes in the relative abundance of microplastics from Ho-Chi-Minh City (HCMC, Saigon urban canals/rivers) through Can Gio Mangrove (Can Gio seawater) to the East Sea (Soai Rap Estuary, from Long Tau Estuary to Ganh Rai Gulf, and White Tiger Oilfield). Mangroves involve a special soil that accumulates carbon, nutrients and sediments as an “enhancer of sedimentation” [64]. Sediments deposited into mangroves come from allochthonous sediments (external sources like terrestrial or oceanic sources), and autochthonous sources (re-suspended sediments) [65]. Microplastics can be transported from the oceanic environment to the mangrove and accumulated in the sediment layers in a similar way as in the aquatic environment [13]. This is considered one of the main reasons for the low number of microplastics within the Can Gio reserve. Indeed, the decrease in the amount of plastic debris highlights the feasible role of the mangrove in retaining contaminants including microplastics.
The Tukey’s test showed a statistical difference in total MPs between Binh Khanh ferry (CT1) with Ganh Rai Gulf (ES3) (Sig. = 0.03, Table S3) and with Soai Rap estuary (Sig. = 0.03, Table S3). Tukey’s test showed a statistical difference in total MPs between Binh Khanh ferry with Ganh Rai Gulf (Sig. = 0.03, Table S3), and with Soai Rap estuary (Sig. = 0.03, Table S3); between Rach Đon Bridge (Can Gio buffer zone, CB1) and Ganh Rai Gulf (Sig. = 0.014, Table S3). The comparison tests indeed showed some statistical difference between Saigon urban canals with Can Gio Mangrove and the East Sea, for example, Bui Huu Nghia Bridge (SG5) with transition zone (C1-Sig. = 0.01, C2-Sig. = 0.038, C3-Sig. = 0.018, Table S4), with downstream of Soai Rap River (ES2) (Sig. = 0.004, Table S4), downstream of Long Tau River (ES1) (Sig. = 0.036, Table S4), Ganh Rai Gulf (ES3) (Sig. = 0.001, Table S4) and White Tiger Oilfield (ES4) (Sig. = 0.011, Table S4).
The pollution sources concentrate in HCMC, and therefore the MPs amount there was highest (nearly 40 items/L) and decreased gradually to the estuary areas. The number of microplastics in the Saigon river-estuarine system of our study falls into the range of concentrations reported by Strady et al. [31], which was 22 to 251 MPs/L. At the intersection of HCMC and Can Gio (Binh Khanh Ferry), the microplastic concentration decreased to below 20 MPs/L. The average abundance of MPs was around 10 MPs/L within Can Gio reserve, which was in the range of microplastics in Three Gorges Reservoir in China (1.597–12.611 MPs/L) [66], Taihu Lake in China (3.4–25.8 MPs/L) [33]. This comparison could be made owing to the similarity of the position of Can Gio and Taihu in terms of geographical location and human activities. Nevertheless, Taihu Lake has become one of the most severely polluted lakes in China due to the development of the local economy and industry and the presence of three wastewater treatment plants, but, in contrast, Can Gio is strictly protected by the government and UNESCO. Microplastics have eventually reached the East Sea, but in a smaller amount, from 3.1 ± 1.6 to 4.7 ± 3.2 MPs/L.
The total microplastics in Ganh Rai Gulf were much lesser than in the Jinhae Bay, South Korea (88 ± 68 MPs/L) [22], but equivalent to the Hudson River (USA) to some extent (0.625–2.45 fibers/L) [67]. Microplastics in Ganh Rai (ES3) are predicted to come from terrestrial and sea-based sources. The latter source is supposed to be maritime transport [68,69], because the sampling sites are around the intersection of cargo ships and vessels carrying imported-exported fuels and gases. However, it is still not well understood what is the main reason for the presence of plastic debris in this area. According to Browne, [70], the source of maritime shipping is much smaller than land-based sources. In fact, microfibers accounted for a larger percentage than micro-particles (Table 3), which is attributed to textile sources from the mainland. All of the investigated plastic types were encountered from the ocean surface to the depths of 3 m in the sampling locations of Ganh Rai Bay. PE dominated the sea surface, whilst PA, PET, and PVC were predominant in the sub-surface samples, 2 m and 3 m, respectively. They are subject to distribution more in the deeper seawater levels since their densities (up to 1.14, 1.3–1.5 and 1.15–1.70 g/cm3, respectively) were higher than seawater (1.023 g/cm3 in measured average) [43,71,72]. PS was found in the sub-surface seawater with a higher abundance despite its similar density to the seawater. Hence, it can be seen that the vertical distribution of microplastics depends on not only the density of virgin polymers. Their distribution is also affected by the disturbance caused by the actions of internal wave and oceanic circulation modes in the seawater [73] since any abrasion, cracking and pitting of the surface can increase the density [43].
As seen in Table 3, the majority of microplastics were fibers with various size fractions. There was a surprising similarity in their colors in most environments. White was always most predominant in all shapes of plastic types, particularly 18.1% for fibers. Pink (red), blue, purple and gray were popular colors of fibers (Figure 2), 15.7%, 14.4%, 12.4% and 10.2%, respectively. Black accounted for 7.6% of fibers. However, the black was seen with purple or blue instead of completely black as activated carbon. These colors were also commonly found in fibers in the Northeast Atlantic Ocean (blue, black, red) [34], Jinhae Bay, South Korea (green, blue, red) [22], Qatar (blue, white) [74] and the Hudson River-USA (blue, black, red) [67]. The results showed that the distribution of plastic types was not much different by depth in the water column. PE dominated in the surface samples, PET and PA were predominant in the sub-surface samples. PE, PP and many PET fragments were attributed to the breakdown products of plastic items, especially single-use water bottles and tableware. In Ganh Rai, Soai Rap and White Tiger seawater, pink fibers were dominated by PET (Figure 2e), while blue was more frequently observed in PA fibers (Figure 2d). In the water of Saigon canals, some parts of several colored fibers appeared brown, which showed the contamination of colored substances on the surface of microplastics in the environment.
Fibers were also commonly encountered in Can Gio reserve. However, their percentage (21–22%) was still lower than that of fragments (33–36%) (Table 3). The size of plastic debris in this mangrove varied from 15 μm to 53.38 μm, so smaller than those in Saigon urban canals (from 15 μm to 197.5 μm). Similarly, microfibers were only 60 μm maximum (53.43 μm on average) in the mangrove but were up to 561.23 μm (122.76 μm on average) in Saigon canal systems. The shape of fibers in locations of Can Gio and East Sea (Figure 2b–e) looked similar, that is, single colored fibers, which suggests that microfibers have dispersed in the marine environment. Differently, bundles of microfibers (Figure 2a) were quite often found in only Saigon urban canals. The small size fraction (25–50 μm) is quite common in the mangrove systems as also reported in the mangrove sediment of the Maowei Sea [63] and in Singapore’s coastal mangrove ecosystem [75]. The high percentages of small plastic fragments revealed that mangrove systems might accelerate plastic decomposition and accumulation. This, therefore, can promote harmful effects of plastic debris on the mangrove benthos to some extent.

4. Conclusions

Investigating microplastics in the aquatic environment is a time-consuming procedure of multiple steps, including sampling, separation, qualification and quantification. Raman scattering microscopy is a powerful tool to assess the microplastics in a water matrix with high specificity and low interference of water molecules. This study found that microplastic concentration decreased gradually from the urban waterborne (30–250 MPs/L) to estuaries (10–20 MPs/L) and to the sea (3–5 MPs/L), which highlights the dispersion of microplastics in the marine environment. The data showed the variability in morphology and plastic composition of marine microplastics. Polyethylene, polyester and polyamide were predominant polymers of marine debris in the estuary location of Southern Vietnam. The findings indicated that the presence of marine plastic debris was associated with not only proximity to land-based sources, population density, but also natural water circulation in the sea. Nonetheless, it is a practical challenge to determine the exact sources and fate of microplastics in the coastal and marine environment because they are distributed randomly throughout the water column, especially in the sea surface microlayer. Finally, the prevalence of very small microplastics in fibrous and non-fibrous forms in the seawater warns the risks of microplastic pollution in UNESCO Can Gio Mangrove Biosphere Reserve, which suggests that appropriate actions should be taken in time to protect the reserve and marine environment of Vietnam.

Supplementary Materials

The following supporting information can be downloaded at: https://www.mdpi.com/2673-8929/1/3/38/s1. The spectra of microplastic types investigated in the manuscript (Figure S1), pictures and sample information taken in the field trips (Figure S2, Table S1), as well as statistical analysis tables (Tables S2–S4), are included in the supplementary materials published online alongside the manuscript.

Author Contributions

Conceptualization, V.T.K.K.; Data curation, V.T.K.K.; Formal analysis, V.T.K.K., D.V.L. and H.A.L.; Investigation, V.T.K.K.; Methodology, V.T.K.K.; Project administration, C.D.; Software, D.V.L.; Supervision, C.D. and A.R.F.; Validation, H.A.L., A.R.F. and C.D.; Visualization, D.V.L. and H.A.L.; Writing—original draft, V.T.K.K.; Writing—review and editing, D.V.L., H.A.L., A.R.F. and C.D. All authors have read and agreed to the published version of the manuscript.

Funding

This work was supported by the German Academic Exchange Service (DAAD) for MSc. V.T.K.K. (Scholarship program: Sustainable Water Management 2018). This research received no external funding for article processing charges (APC). The first author (khuyen.vo@mailbox.tu-dresden.de) received an invitation from the Journal Editor to publish a paper without any fees.

Institutional Review Board Statement

Not applicable.

Informed Consent Statement

Written informed consent has been obtained from the participants to publish this paper.

Data Availability Statement

Data are contained within the article or Supplementary Material. The data presented in this study are available in this DOI’s article after the manuscript is accepted.

Acknowledgments

The authors would like to thank Cao Van Tuan and the assistant Le Thi Thanh Thuy (Ho-Chi-Minh City Urban Environment Co., Ltd.—CITENCO) for the boat sampling trips along the Saigon urban canals. We thank Ta Chau Phu and Phan Minh Chi—lecturers of Ho-Chi-Minh Cadre Academy for their sampling in Can Gio mangrove; Nguyen Chi Trinh and his navigator colleagues of Sao Mai Port Operating Company for the sampling trip to Ganh Rai Gulf, Soai Rap at the East Sea. We thank Vo Thi Thien Kim (student at University of Medicine Pham Ngoc Thach), Pham Thi Mong Dao (Nhan Dan Gia Dinh Hospital), Vo Duy Khoa (Nguyen Tri Phuong Hospital), Nguyen Huy Phuc (student at Industrial University of Ho Chi Minh City) and Vo Duy Hoang Kim (student at Vo Thi Sau High School) for their assistance in sampling trips and interview campaigns.

Conflicts of Interest

The authors declare no conflict of interest.

Abbreviations

The Abbreviations of Plastic Types
MPsMicroplastics, total microplastics
PEPoly-Ethylene
LDPE Low-Density Polyethylene
MDPE Medium-Density Polyethylene
HDPEHigh-Density Polyethylene
PPPoly-Propylene
PSPoly-Styrene
PVCPoly-Vinyl Chloride
PET (PETE)Poly-Ethylene Terephthalate
PAPoly-Amides, Nylon
PMMAPoly Methyl Metacrylate
Geographic Terms and Abbreviations
SG, HCMCHồ Chí Minh City, “Saigon” was also used alternatively
NL-TNNhiêu Lộc–Thị Nghè canal in Saigon city
BNBến Nghé canal in Saigon city
KTTẻ canal in Saigon city
LGLò Gốm canal in Saigon city
CGCần Giờ—a coastal suburban district of Ho Chi Minh City,
UNESCO Can Gio Mangrove Biosphere Reserve
East Sea East Sea, a name of Vietnamese people for South China Sea
CT Can Gio Mangrove–Transition zone
CB Can Gio Mangrove–Buffer zone
CC Can Gio Mangrove–Core zone

References

  1. Plastics Europe. Plastics—The Facts 2017: An Analysis of European plastics Production, Demand and Waste Data. 2020. Available online: https://www.plasticseurope.org/application/files/5716/0752/4286/AF_Plastics_the_facts-WEB-2020-ING_FINAL.pdf (accessed on 3 June 2022).
  2. Scalenghe, R. Resource or waste? A perspective of plastics degradation in soil with a focus on end-of-life options. Heliyon 2018, 4, e00941. [Google Scholar] [CrossRef] [PubMed]
  3. Le, D.T. Overview of Marine Plastic Debris in Vietnam in Relation to International Context FIG Working Week 2019. In Proceedings of the Geospatial Information for a Smarter Life and Environmental Resilience Hanoi, Hanoi, Vietnam, 22–26 April 2019. [Google Scholar]
  4. Jambeck, J.R.; Geyer, R.; Wilcox, C.; Siegler, T.R.; Perryman, M.; Andrady, A.; Narayan, R.; Law, K.L. Plastic waste inputs from land into the ocean. Science 2015, 347, 768–771. [Google Scholar] [CrossRef] [PubMed]
  5. Verma, R.L.; Borongan, G.; Memon, M. Municipal Solid Waste Management in Ho Chi Minh City, Viet Nam, Current Practices and Future Recommendation. Procedia. Environ. Sci. 2016, 35, 127–139. [Google Scholar] [CrossRef]
  6. Kieu-Le, T.C.; Strady, E.; Perset, M. Life Cycle of Floating Debris in the Canals of Ho Chi Minh City. PADDI. 2016. Available online: https://hal.archives-ouvertes.fr/hal-02357363/document (accessed on 3 June 2022).
  7. Cormier-Salem, M.C.; Nguyen, V.T.; Burgos, A.; Durand, J.D.; Bettarel, Y.; Klein, J.; Hoang, D.H.; Panfili, J. The mangrove’s contribution to people: Interdisciplinary pilot study of the Can Gio Mangrove Biosphere Reserve in Viet Nam. C. R. Geosci. 2017, 349, 341–350. [Google Scholar] [CrossRef]
  8. Ng, E.-L.; Lwanga, E.H.; Eldridge, S.M.; Johnston, P.; Hu, H.-W.; Geissen, V.; Chen, D. An overview of microplastic and nanoplastic pollution in agroecosystems. Sci. Total Environ. 2018, 627, 1377–1388. [Google Scholar] [CrossRef] [PubMed]
  9. Mai, L.; Bao, L.-J.; Shi, L.; Wong, C.S.; Zeng, E.Y. A review of methods for measuring microplastics in aquatic environments. Environ. Sci. Pollut. Res. Int. 2018, 25, 11319–11332. [Google Scholar] [CrossRef]
  10. Gregory, M.R. Environmental implications of plastic debris in marine settings—entanglement, ingestion, smothering, hangers-on, hitch-hiking and alien invasions. Phil. Trans. R. Soc. B. 2009, 364, 2013–2025. [Google Scholar] [CrossRef]
  11. Botterell, Z.L.R.; Beaumont, N.; Dorrington, T.; Steinke, M.; Thompson, R.C.; Lindeque, P.K. Bioavailability and effects of microplastics on marine zooplankton: A review. Environ. Pollut. 2019, 245, 98–110. [Google Scholar] [CrossRef]
  12. Udayakumar, K.V.; Gore, P.M.; Kandasubramanian, B. Foamed materials for oil-water separation. Chem. Eng. J. Adv. 2021, 5, 100076. [Google Scholar] [CrossRef]
  13. Auta, H.S.; Emenike, C.U.; Fauziah, S.H. Distribution and importance of microplastics in the marine environment: A review of the sources, fate, effects, and potential solutions. Environ. Int. 2017, 102, 165–176. [Google Scholar] [CrossRef] [PubMed]
  14. Braun, U.; Stein, U.; Schritt, H.; Altmann, K.; Bannick, C.; Becker, R.; Bitter, H.; Dierkes, G.; Enders, K.; Kyriakos, A.E. Analysis of Microplastics—Sampling, Preparation and Detection Methods. Status Report within the Framework Program Plastics in the Environment. 2021. Available online: https://bmbf-plastik.de/sites/default/files/2021-12/Status%20Report_Analysis%20of%20Microplastics_PidU_May_2021_0.pdf (accessed on 3 June 2022).
  15. Enders, K.; Lenz, R.; Stedmon, C.A.; Nielsen, T.G. Abundance, size and polymer composition of marine microplastics ≥ 10 μm in the Atlantic Ocean and their modelled vertical distribution. Mar. Pollut. Bull. 2015, 100, 70–81. [Google Scholar] [CrossRef] [PubMed]
  16. Karlsson, T.M.; Kärrman, A.; Rotander, A.; Hassellöv, M. Comparison between manta trawl and in situ pump filtration methods, and guidance for visual identification of microplastics in surface waters. Environ. Sci. Pollut. Res. 2020, 27, 5559–5571. [Google Scholar] [CrossRef] [PubMed]
  17. De Witte, B.; Devriese, L.; Bekaert, K.; Hoffman, S.; Vandermeersch, G.; Cooreman, K.; Robbens, J. Quality assessment of the blue mussel (Mytilus edulis): Comparison between commercial and wild types. Mar. Pollut. Bull. 2014, 85, 146–155. [Google Scholar] [CrossRef]
  18. Kosuth, M.; Mason, S.A.; Wattenberg, E.V. Anthropogenic contamination of tap water, beer, and sea salt. PLoS ONE 2018, 13, e0194970. [Google Scholar] [CrossRef] [PubMed]
  19. Shim, W.J.; Song, Y.K.; Hong, S.H.; Jang, M. Identification and quantification of microplastics using Nile Red staining. Mar. Pollut. Bull. 2016, 113, 469–476. [Google Scholar] [CrossRef] [PubMed]
  20. Fries, E.; Jens, H.D.; Willmeyer, J.; Nuelle, M.T.; Ebert, M.; Remy, D. Identification of polymer types and additives in marine microplastic particles using pyrolysis-GC/MS and scanning electron microscopy. Environ. Sci. Process Impacts 2013, 15, 1949–1956. [Google Scholar] [CrossRef]
  21. Erni-Cassola, G.; Gibson, M.I.; Thompson, R.C.; Christie-Oleza, J.A. Lost, but Found with Nile Red: A Novel Method for Detecting and Quantifying Small Microplastics (1 mm to 20 μm) in Environmental Samples. Environ. Sci. Technol. 2017, 51, 13641–13648. [Google Scholar] [CrossRef]
  22. Song, Y.K.; Hong, S.H.; Jang, M.; Han, G.M.; Shim, W.J. Occurrence and distribution of microplastics in the sea surface microlayer in Jinhae Bay, South Korea. Arch. Environ. Contam. Toxicol. 2015, 69, 279–287. [Google Scholar] [CrossRef]
  23. Cincinelli, A.; Scopetani, C.; Chelazzi, D.; Lombardini, E.; Martellini, T.; Katsoyiannis, A.; Fossi, M.C.; Corsolini, S. Microplastic in the surfac e waters of the Ross Sea (Antarctica): Occurrence, distribution and characterization by FTIR. Chemosphere 2017, 175, 391–400. [Google Scholar] [CrossRef]
  24. Schymanski, D.; Goldbeck, C.; Humpf, H.-C.; Fürst, P. Analysis of microplastics in water by micro-Raman spectroscopy: Rele ase of plastic particles from different packaging into mineral water. Water Res. 2018, 129, 154–162. [Google Scholar] [CrossRef]
  25. Gillibert, R.; Balakrishnan, G.; Deshoules, Q.; Tardivel, M.; Magazzù, A.; Donato, M.G.; Maragò, O.M.; de La Chapelle, M.L.; Colas, F.J.; Lagarde, F.; et al. Raman Tweezers for Small Microplastics and Nanoplastics Identification in Seawater. Environ. Sci. Technol. 2019, 53, 9003–9013. [Google Scholar] [CrossRef] [PubMed]
  26. Ribeiro-Claro, P.; Nolasco, M.M.; Catarina, A. Chapter 5—Characterization of Microplastic by Raman Spectroscopy. Compr. Anal. Chem. 2017, 75, 119–151. [Google Scholar]
  27. Käppler, A.; Fischer, D.; Oberbeckmann, S.; Schernewski, G.; Labrenz, M.; Eichhorn, K.-J.; Voit, B. Analysis of environmental microplastics by vibrational microspectroscopy: FTIR, Raman or both? Anal. Bioanal. Chem. 2016, 408, 8377–8391. [Google Scholar] [CrossRef]
  28. Shim, W.J.; Hongab, S.H.; Eo, S.E. Identification methods in microplastic analysis: A review. Anal. Methods 2017, 9, 1384–1391. [Google Scholar] [CrossRef]
  29. Hermabessiere, L.; Himber, C.; Boricaud, B.; Kazour, M.; Amara, R.; Cassone, A.-L.; Laurentie, M.; Paul-Pont, I.; Soudant, P.; Dehaut, A.; et al. Optimization, performance, and application of a pyrolysis-GC/MS method for the identification of microplastics. Anal. Bioanal. Chem. 2018, 410, 6663–6676. [Google Scholar] [CrossRef] [PubMed]
  30. Lahens, L.; Strady, E.; Le, K.T.C.; Dris, R.; Boukerma, K.; Rinnert, E.; Gasperi, J.; Tassin, B. Macroplastic and microplastic contamination assessment of a tropical river (Saigon River, Vietnam) transversed by a developing megacity. Environ. Pollut. 2018, 236, 661–671. [Google Scholar] [CrossRef]
  31. Strady, E.; Kieu-Le, T.C.; Gasperi, J.; Tassin, B. Temporal dynamic of anthropogenic fibers in a tropical river-estuarine system. Environ. Pollut. 2020, 259, 113897. [Google Scholar] [CrossRef]
  32. Strady, E.; Dang, T.H.; Dao, T.D.; Dinh, H.N.; Do, T.T.D.; Duong, T.N.; Duong, T.T.; Hoang, D.A.; Kieu-Le, T.C.; Le, T.P.Q.; et al. Baseline assessment of microplastic concentrations in marine and freshwater environments of a developing Southeast Asian country, Viet Nam. Mar. Pollut. Bull. 2021, 162, 111870. [Google Scholar] [CrossRef]
  33. Su, L.; Xue, Y.; Li, L.; Yang, D.; Kolandhasamy, P.; Li, D.; Shi, H. Microplastics in Taihu Lake, China. Environ. Pollut. 2016, 216, 711–719. [Google Scholar] [CrossRef]
  34. Lusher, A.L.; Burke, A.; O ′Connor, I.; Officer, R. Microplastic pollution in the Northeast Atlantic Ocean: Validated and opportunistic sampling. Mar. Pollut. Bull. 2014, 88, 325–333. [Google Scholar] [CrossRef]
  35. Zhao, S.; Zhu, L.; Wang, T.; Li, D. Suspended microplastics in the surface water of the Yangtze Estuary System, China: First observations on occurrence, distribution. Mar. Pollut. Bull. 2014, 86, 562–568. [Google Scholar] [CrossRef] [PubMed]
  36. Khuyen, V.T.K.; Le, D.V.; Anh, L.H.; Fischer, A.R.; Dornack, C. Investigating the Correlation of Microplastic Pollution Between Seawater and Marine Salt Using Micro-Raman Spectroscopy. Front. Mar. Sci. 2021, 8, 735975. [Google Scholar] [CrossRef]
  37. Zhao, S.; Zhu, L.; Li, D. Microscopic anthropogenic litter in terrestrial birds from Shanghai, China: Not only plastics but also natural fibers. Sci. Total Environ. 2016, 550, 1110–1115. [Google Scholar] [CrossRef] [PubMed]
  38. Chubarenko, I.; Bagaev, A.; Zobkov, M.; Esiukova, E. On some physical and dynamical properties of microplastic particles in marine environment. Mar. Pollut. Bull. 2016, 108, 105–112. [Google Scholar] [CrossRef] [PubMed]
  39. Ismail, A.; Adilah, N.M.B.; Nurulhudha, M.J. Plastic pellets along Kuala Selangor-Sepang coastline. Malays. Appl. Biol. 2009, 38, 85–88. Available online: http://psasir.upm.edu.my/id/eprint/16233 (accessed on 3 June 2022).
  40. Frias, J.P.G.L.; Sobral, P.; Ferreira, A.M. Organic pollutants in microplastics from two beaches of the Portuguese coast. Mar. Pollut. Bull. 2010, 60, 1988–1992. [Google Scholar] [CrossRef]
  41. Zhu, L.; Bai, H.; Chen, B.; Sun XQu, K.; Xia, B. Microplastic pollution in North Yellow Sea, China: Observations on occurrence, distribution and identification. Sci. Total Environ. 2018, 636, 20–29. [Google Scholar] [CrossRef]
  42. Kunz, A.; Walther, B.A.; Löwemark, L.; Lee, Y.C. Distribution and quantity of microplastic on sandy beaches along the northern coast of Taiwan. Mar. Pollut. Bull. 2016, 111, 126–135. [Google Scholar] [CrossRef]
  43. Crawford, C.B.; Quinn, B. Microplastic Pollutants, 1st ed.; Elsevier: Amsterdam, The Netherlands, 2017; pp. 101–130. [Google Scholar]
  44. Endo, S.; Takizawa, R.; Okuda, K.; Takada, H.; Chiba, K.; Kanehiro, H.; Ogi, H.; Yamashita, R.; Date, T. Concentration of polychlorinated biphenyls (PCBs) in beached resin pellets: Variability among individual particles and regional differences. Mar. Pollut. Bull. 2005, 50, 1103–1114. [Google Scholar] [CrossRef]
  45. Prata, J.C.; Costa, J.P.; Duarte, A.C.; Rocha-Santos, T. Methods for sampling and detection of microplastics in water and sediment: A critical review. TrAC Trends Anal. Chem. 2019, 110, 150–159. [Google Scholar] [CrossRef]
  46. Al-Azzawi, M.S.M.; Kefer, S.; Weißer, J.; Reichel, J.; Schwaller, C.; Glas, K.; Knoop, O.; Drewes, J.E. Validation of Sample Preparation Methods for Microplastic Analysis in Wastewater Matrices—Reproducibility and Standardization. Water 2020, 12, 2445. [Google Scholar] [CrossRef]
  47. Hu, C.; Chen, X.; Chen, J.; Zhang, W.; Zhang, M.Q. Observation of mutual diffusion of macromolecules in PS/PMMA binary films by confocal Raman microscopy. Soft Matter 2012, 8, 4780. [Google Scholar] [CrossRef]
  48. Bruckmoser, K.; Resch, K.; Kisslinger, T.; Lucyshyn, T. Measurement of interdiffusion in polymeric materials by applying Raman spectroscopy. Polym. Test. 2015, 46, 122–133. [Google Scholar] [CrossRef]
  49. Gopanna, A.; Mandapati, R.N.; Thomas, S.P.; Rajan, K.; Chavali, M. Fourier transform infrared spectroscopy (FTIR), Raman spectroscopy and wide angle X ray scattering (WAXS) of polypropylene (PP)/cyclic olefin copolymer (COC) blends for qualitative and quantitative analysis. Polym. Bull. 2019, 76, 4259–4274. [Google Scholar] [CrossRef]
  50. Daniel, J.S.; Wiebeck, H. Predicting LDPE/HDPE blend composition by CARS-PLS regression and confocal Raman spectroscopy. Polímeros 2019, 29, 1–11. [Google Scholar] [CrossRef]
  51. Gündoğdu, S. Contamination of table salts from Turkey with microplastics. Food Addit. Contam. Part A 2018, 35, 1006–1014. [Google Scholar] [CrossRef]
  52. Milani, A. Unpolarized and Polarized Raman Spectroscopy of Nylon-6 Polymorphs: A Quantum Chemical Approach. J. Phys. Chem. B. 2015, 119, 3868–3874. [Google Scholar] [CrossRef]
  53. Käppler, A.; Windrich, F.; Löder, M.G.J.; Malanin, M.; Fischer, D.; Labrenz, M.; Eichhorn, K.J.; Voit, B. Identifiation of microplastics by FTIR and Raman microscopy: A novel silicon fiter substrate opens the important spectral range below 1300 cm−1 for FTIR transmission measurements. Anal. Bioanal. Chem. 2015, 407, 6791–6801. [Google Scholar] [CrossRef]
  54. Alexiou, F.V.; Mathioudakis, G.N.; Andrikopoulos, K.S.; Beobide, A.S.; Voyiatzis, G.A. Poly(ethylene Terephthalate) Carbon-Based Nanocomposites: A Crystallization and Molecular Orientation Study. Polymers 2020, 12, 2626. [Google Scholar] [CrossRef]
  55. Solodovnichenko, V.S.; Polyboyarov, V.A.; Zhdanok, A.A.; Arbuzov, A.B.; Zapevalova, E.S.; Kryazhev Yu, G.; Likholobov, V.A. Synthesis of carbon materials by the short-term mechanochemical activation of polyvinyl chloride. Procedia Eng. 2016, 152, 747–752. [Google Scholar] [CrossRef]
  56. Emmerik, T.V.; Strady, E.; Kieu-Le, T.C.; Nguyen, L.; Gratiot, N. Seasonality of riverine macroplastic transport. Sci. Rep. 2019, 9, 13549. [Google Scholar] [CrossRef]
  57. Frère, L.; Paul-Pont, I.; Moreau, J.; Soudant, P.; Lambert, C.; Huvet, A.; Rinnert, E. A semi-automated Raman micro-spectroscopy method for morphological and chemical characterizations of microplastic litter. Mar. Pollut. Bull. 2016, 113, 461–468. [Google Scholar] [CrossRef]
  58. Barnes, K.A.D.; Galgani, F.; Thompson, R.C.; Barlaz, M. Accumulation and fragmentation of plastic debris in global environments. Phil. Trans. R. Soc. B. 2009, 364, 1985–1998. [Google Scholar] [CrossRef]
  59. Lenz, R.; Enders, K.; Stedmon, C.A.; Mackenzie, D.M.A.; Nielsen, T.G. A critical assessment of visual identification of marine microplastic using Raman spectroscopy for analysis improvement. Mar. Pollut. Bull. 2015, 100, 82–91. [Google Scholar] [CrossRef]
  60. Khuyen, V.T.K.; Le, D.V.; Fischer, A.R.; Dornack, C. Comparison of microplastic pollution in beach sediment and seawater at UNESCO Can Gio Mangrove Biosphere Reserve. Glob. Chall. 2021, 5, 2100044. [Google Scholar] [CrossRef]
  61. Lusher, A.; Tirelli, V.; O’Connor, I.; Officer, R. Microplastics in Arctic polar waters: The first reported values of particles in surface and sub-surface samples. Sci. Rep. 2015, 5, 14947. [Google Scholar] [CrossRef]
  62. Mazda, Y.; Wolanski, E. Chapter 8 Hydrodynamics and Modeling of Water Flow in Mangrove Areas. In Coastal Wetlands: An Integrated Ecosystem Approach, 1st ed.; Perillo, G., Wolanski, E., Cahoon, D., Brinson, M., Eds.; Elsevier: Amsterdam, The Netherlands, 2009; p. 244. ISBN 978-0-444-53103-2. [Google Scholar]
  63. Li, R.; Zhang, L.; Xue, B.; Wang, Y. Abundance and characteristics of microplastics in the mangrove sediment of the semi- enclosed Maowei Sea of the South China Sea: New implications for location, rhizosphere, and sediment compositions. Environ. Pollut. 2019, 244, 685–692. [Google Scholar] [CrossRef]
  64. Valiela, I.; Cole, M.L. Comparative evidence that saltmarshes and mangroves may protect sea grass meadow from land-derived nitrogen loads. Ecosystems 2002, 5, 92–102. [Google Scholar] [CrossRef]
  65. Adame, F.M.; Neil, D.; Wright, S.F.; Lovelock, C.E. Sedimentation within and among mangrove forests along a gradient of geomorphological settings. Estuar. Coast. Shelf Sci. 2010, 86, 21–30. [Google Scholar] [CrossRef]
  66. Di, M.; Wang, J. Microplastics in surface waters and sediments of the Three Gorges Reservoir, China. Sci. Total Environ. 2018, 616, 1620–1627. [Google Scholar] [CrossRef]
  67. Miller, R.Z.; Watts, A.J.; Winslow, B.O.; Galloway, T.S.; Barrows, A.P. Mountains to the sea: River study of plastic and non-plastic microfiber pollution in the northeast USA. Mar. Pollut. Bull. 2017, 124, 245–251. [Google Scholar] [CrossRef]
  68. Sheavly, S.B. Marine debris—An overview of a critical issue for our oceans. In Proceedings of the Sixth Meeting of the UN Open-ended Informal Consultative Processes on Oceans & the Law of the Sea, New York, NY, USA, 6–10 June 2005. [Google Scholar]
  69. Hasnat, M.A.; Rahman, M.A. A review paper on the hazardous effect of plastic debris on marine biodiversity with some possible remedies. Asian J. Med. Biol. Res. 2018, 4, 233–241. [Google Scholar] [CrossRef]
  70. Browne, M.A. Chapter 9 Sources and Pathways of Microplastics to Habitats. In Marine Anthropogenic Litter, 1st ed.; Melanie, B., Lars, G., Michael, K., Eds.; Springer Open: Gothenburg, Germany, 2015; pp. 229–244. [Google Scholar] [CrossRef]
  71. Weber, A.; Scherer, C.; Brennholt, N.; Reifferscheid, G.; Wagner, M. PET microplastics do not negatively affect the survival, development, metabolism and feeding activity of the freshwater invertebrate Gammarus pulex. Environ. Pollut. 2018, 234, 181–189. [Google Scholar] [CrossRef] [PubMed]
  72. Issac, M.N.; Kandasubramanian, B. Effect of microplastics in water and aquatic systems. Environ. Sci. Pollut. Res. 2021, 28, 19544–19562. [Google Scholar] [CrossRef] [PubMed]
  73. Wang, J.; Tan, Z.; Peng, J.; Qiu, Q.; Li, M. The behaviours of microplastics in the marine environment. Mar. Environ. Res. 2016, 113, 7–17. [Google Scholar] [CrossRef]
  74. Castillo, A.B.; Al-Maslamani, I.; Obbard, J.P. Prevalence of microplastics in the marine waters of Qatar. Mar. Pollut. Bull. 2016, 111, 260–267. [Google Scholar] [CrossRef]
  75. Nor, N.H.; Obbard, J.P. Microplastics in Singapore’s coastal mangrove ecosystems. Mar. Pollut. Bull. 2014, 79, 278–283. [Google Scholar] [CrossRef]
Figure 1. Geographical map of Vietnam, study areas and sampling locations. SG stands for Saigon, another name of Ho-Chi-Minh City, CT stands for Can Gio Mangrove—Transition zone, CB stands for Can Gio Mangrove—Buffer zone, CC stands for Can Gio Mangrove—Core zone, ES stands for East Sea, a name by the Vietnamese people for South China Sea. The detailed location names are found in Table S1 in Supplementary Materials.
Microplastics 01 00038 g001
Figure 2. Non-microplastics and microplastics extracted from the marine environment of Southern Vietnam: non-microplastic fibers (a); microplastics in Saigon urban canals (b), Can Gio (c), Ganh Rai (d), White Tiger oilfield (e).
Microplastics 01 00038 g002
Figure 3. Total microplastics in Saigon urban canal systems. NL-TN Canal System is from Bridge No.1 to Bach Đang Wharf; Tau Hu (TH) Canal System is from Lo Gom to Letter Y Bridge; Te Canal (KT) is from Nguyen Van Cu Bridge to Tan Thuan Bridge; Ben Nghe Canal (BN) is from Nguyen Van Cu Bridge to Khanh Hoi Bridge. The names of locations (from left to right) in Figure 3 are abbreviated as SG1, SG2, SG3, SG4, SG5, SG6, SG7, SG8, SG9, SG10, SG11, SG12, SG13, SG14 and SG15 in the map (Figure 1).
Microplastics 01 00038 g003
Figure 4. Microplastic distribution (%) in the zones of UNESCO Can Gio Biosphere Reserve.
Microplastics 01 00038 g004
Figure 5. The decrease in microplastic concentration from Saigon to the East Sea through UNESCO Can Gio Mangrove Biosphere Reserve. Binh Khanh ferry is the intersection of HCMC and Can Gio; The confluence of Soai Rap River is the natural border of Can Gio with Mekong Delta; Ganh Rai Gulf is the confluence of Long Tau River; White Tiger Oilfield is in the East Sea belonging to Đong Nai city (not HCMC).
Microplastics 01 00038 g005
Table 1. Raman band assignments of standard plastics and sampled microplastics (Figure S1 in Supplementary Materials).
PolymerRaman Bands (cm−1)Raman Bands (cm−1)Bond Assignment
of Sampled MPsof Plastic Standards
Polystyrene
(PS)
1612.871604.24phenyl ring stretch [47,48]
1015.031001.75C–C in-plane ring deformation +,
C–H out-of-plane deformation [47]
622.43621.1in-plane ring deformation [47,48]
Poly
(methyl methacrylate) (PMMA)
1679.851723.71C–O–C symmetric stretch [47]
1512.11447.51–CH2– deformation [48]
1154.131181.31C–C–C–C stretch [48]
835.31808.67C=O stretch [47]
Polypropylene
(PP)
2886.52889.14–CH3 stretch [49]
1451.791458.89–CH2– deformation [48]
1325.161328.97C–C stretch [49]
1150.511153.82–CH3 rock [49]
805.23808.67–CH2– rock [48]
Polyethylene
(LDPE)
2928.92884.5–CH2– stretch [50]
1442.631441.9–CH2– wag [50]
1293.131296.25–CH2– twist [50]
1172.351124.36C–C stretch [50]
1069.691060.97C–C stretch [50]
Polyamide-6,
nylon-6
(PA-6)
2895.672900.2–CH2– stretch [51]
1680.051633.39unknown group [51]
1440.221441.9–CH2– [51,52]
1383.021430.49–CH2– bend [51,52]
1094.93928.73–CH2– twist [52]
Poly-ethylene terephthalate
(PET)
1753.591725.34C=O stretch [53,54]
1602.31614.52Microplastics 01 00038 i001 C=C [54]
1302.581288.21C–C
846.1855.4C=C [53]
693.92628.46Microplastics 01 00038 i002 [53]
Polyvinyl chloride
(PVC)
2892.782852.09C–H stretch [55]
1436.721430.19–CH2– bend [51,55]
1360.331319.11unknown group [55]
693.92632.64C–Cl
Table 2. Compositions of microplastics extracted from main Saigon urban canals.
Plastic CompositionNhieu Loc–
Thi Nghe (NL)
Tau Hu
(TH)
Ben Nghe (BN)Te Canal
(KT)
Total microplastics (MPs/L)35.58 ± 4.7545.19 ± 10.3033.83 ± 10.5443.41 ± 7.93
PE (%)14.3512.2314.6817.41
PP (%)13.4812.6611.5111.34
PET (%)21.7418.348.737.283
PVC (%)5.656.1111.514.86
PS (%)3.042.184.761.21
PA (%)22.1723.5814.6817.41
PMMA (%)1.310.870.791.21
Unidentifed (%)18.2624.0233.3339.27
Table 3. Comparisons of parameters of microplastics in Saigon urban canals, Can Gio Reserve and East Sea.
ParametersSaigon Urban Canals
(Saigon River)
Can Gio ReserveDownstream of
Soai Rap River
Ganh Rai Gulf
(East Sea)
White Tiger Oilfield (East Sea)
Plastic compositionsPA > PET > PE >
PP > PVC > PS > PMMA
PET > PE > PA > PP > PVC > PS > PMMAPE > PP > PET >
PA > PVC = PS > PMMA
PET > PE > PA >
PP > PVC ≥ PS > PMMA
PET > PA > PP > PE > PVC > PS = PMMA
Common shapes (%)Fiber: 35.4
Fragment: 20.6
Fiber: 27.7
Fragment: 34.2
Fiber: 31.3
Particle: 21.8
Fiber: 42.4
Particle: 20.14
Fiber: 44.1
Particle: 26.5
Common colorswhite > gray > brown > green > pink white > gray > blue > pink > brownwhite > pink > blue > purple > yellowwhite > blue > pink > gray > greenwhite > gray > pink > blue > purple
Size range (μm)Fiber: 14.1–561.2
Non-fibers: 15.7–188.4
Fiber: 25–60
Non-fibers: 14–53.4
Fiber: 19.7–58.3
Non-fibers: 21.9–94.5
Fiber: 25–436.9
Non-fibers: 23.5–265
Fiber: 36.1–184.7
Non-fibers: 22–92
Publisher’s Note: MDPI stays neutral with regard to jurisdictional claims in published maps and institutional affiliations.

