Article

Low-Density Polyethylene Migration from Food Packaging on Cured Meat Products Detected by Micro-Raman Spectroscopy

by
Klytaimnistra Katsara
1,2,
George Kenanakis
2,
Eleftherios Alissandrakis
1,3 and
Vassilis M. Papadakis
2,3,4,*
1
Department of Agriculture, Hellenic Mediterranean University, Estavromenos, GR-71410 Heraklion, Greece
2
Institute of Electronic Structure and Laser, Foundation for Research and Technology—Hellas, N. Plastira 100, GR-70013 Heraklion, Greece
3
Institute of Agri-Food and Life Sciences, Hellenic Mediterranean University Research Centre, GR-71410 Heraklion, Greece
4
Institute of Molecular Biology and Biotechnology, Foundation for Research and Technology—Hellas, N. Plastira 100, GR-70013 Heraklion, Greece
*
Author to whom correspondence should be addressed.
Microplastics 2022, 1(3), 428-439; https://doi.org/10.3390/microplastics1030031
Submission received: 9 June 2022 / Revised: 15 July 2022 / Accepted: 9 August 2022 / Published: 12 August 2022
(This article belongs to the Collection Current Opinion in Microplastics)

Abstract

:
Food packaging has been demonstrated as a crucial issue for the migration of microplastics (MPs) into foodstuffs, concerning human health risk factors. Polymeric materials called plastics are continuously utilized in food packaging. Polyethylene (PE) is commonly used as a food packaging material, because it offers easy handling during transportation and optimal storage conditions for food preservation. In this work, three types of cured meat products of different fat compositions and meat processing methods—bacon, mortadella, and salami—were studied using spectroscopic methods (Raman and FT–IR/ATR) to determine the migration of low-density polyethylene (LDPE) from plastic packaging to the surface of the meat samples. The experimental duration of this study was set to be 28 days owing to the selected meat samples’ degradation, which started to become visible to the human eye after 10 days of storage in vacuum LDPE packaging, under refrigerated conditions at 4 °C. Spectroscopic measurements were performed at 0, 3, 9, 12, 15, and 28 days of storage to obtain comparative results. We demonstrated that the Raman spectral peaks of LDPE firstly appeared as a result of polymeric migration on day 9 in Bacon, on day 15 in Salami, and finally on day 28 in Mortadella. On day 28, all meat samples were tainted, with a layer of bacterial outgrowth developed, as proven by bright–field microscopic observation. Food packaging migration to the surface of cured meat samples was validated using Raman vibrational spectroscopy. To ensure minimal consumption of MPs in cured meat products stored in plastic packaging, while at the same time maintaining good food quality, they should be kept in refrigerated conditions and consumed within a short period of time. In this work, the migration of MPs from food packaging to the surface of cured meat samples was observed using micro-Raman spectroscopy.

1. Introduction

Plastic packaging is eco-toxic and unhealthy for humans [1,2,3,4]. However, the use of plastic for food packaging has many advantages, such as being lightweight and thus allowing easy transportation, design freedom, durability, and cost-effectiveness [5]. The most common plastics used by the food packaging industry are as follows: polyethylene terephthalate (PET), high-density polyethylene (HDPE), low-density polyethylene (LDPE), polycarbonate (PC), polyvinylidene chloride (PVDC), polypropylene (PP), and polystyrene (PS) [6,7,8,9,10,11]. From polymer sciences, we know that different polymers have different properties. PE and especially LDPE is produced in thinner layers compared with some other polymers, but it remains stable in our experimental temperature range of 4–40 °C. Moreover, LDPE is very flexible and tough. For this reason, it is used in many applications of food packaging, in grocery stores for fruit and vegetable bags, in beverages, as well as in cured meat products under vacuum packaging [12], among others [13,14]. It can be observed from the literature that LDPE is a very flexible material by its nature, has no addition of plasticizers, and has a melting point at a temperature of 85 °C [15].
However, we already know that plasticizers and MPs [16] have been identified in food, migrating [17] from food plastic packaging to the food surface [18,19]. Migration of plasticizers [20] from plastic packaging to roasted chicken meat was observed in 2018. Moreover, various studies have been conducted concerning the migration of MPs and nanoparticles from plastic packaging to food simulants [21,22,23,24]; since 1989 [25], olive oil and corn oil have been used as food simulants, instead of real samples, for fatty foods [26]. It is known that MPs are more prone to migrate into oily foodstuffs owing to hydrophobic interactions [27]. This is the reason that, in this work, we chose to study LDPE migration to real meat samples to prove that oily meats are more prone to experience faster migration of MPs. The choice of the cured meats for LDPE migration from plastic packaging was based on the popularity of their consumption; bacon, mortadella, and salami were selected. Vibrational spectroscopic methods (ATR/FT–IR and Raman) are commonly used for food studies [28], as well as MP analysis [29,30,31] and meat discrimination [32]. For this reason, as in a previous cheese study [33], Raman spectroscopy was used to determine the migration of MPs to three types of cured meat (bacon, mortadella, and salami).
According to our results, it is evident that LDPE surely migrates from food packaging to all of the cured meat samples while being kept at refrigeration temperatures (~4 °C). For each meat sample, migration was observed in different time periods, detectable by the Raman spectroscopy technique. In these experiments, real food samples were used for the migration of MPs to the cured meat surface, so the results simulate high-rate, real-life situations.

2. Materials and Methods

2.1. Samples and Experiment Preparation

The experimental design was based on the fat composition and the meat processing methods of our samples. The experimental duration was set to 28 days to observe the cured meats’ behavior and to check if bacterial growth could affect MPs’ detection on the oily surface of the meat. This approach resulted in six time points for each cured meat, named as follows: day 0, where the MPs’ migration should be zero; day 3, day 9, day 12, and day 15, where the migration should be detectable for bacon, mortadella, and salami; and finally day 28, for the observation of cured meat degradation using Raman microscopy.
Generally, bacon has up to 50% fat [34], mortadella has up to 30% fat [35], and salami has up to 50% fat [36]. In our experiment, the materials used were as follows: (i) smoked and fatty bacon with a 20% fat content, (ii) boiled mortadella with a 26% fat content, and (iii) air-dried fatty salami with a 29.5% fat content. Owing to the meat processing of mortadella, the water content is preserved, and the lipid distribution into mortadella’s meat volume is more uniform than that of bacon and salami. On the contrary, during air drying, water is not preserved, and the lipid distribution is sparse, resulting in denser areas. Smoked bacon has a greater water content than salami, but lower water content than mortadella. Eighteen (18) resealable air-tight LDPE pouches, commercially available in Greek stores as packaging pouches, were prepared and pre-marked with the assigned measurement day and meat type. Those polymeric pouches have previously been characterized for their chemistry (FT-IR/ATR and Raman) and structure (XRD) [33]. For this experiment, three different kinds of cured meats, bacon, mortadella, and salami, were prepared. Initially, to avoid any contamination with MPs from the environment, the work area was under a hood, sterilized with pure ethanol; nitrile gloves and a cotton lab coat were used each time during the entire experimental process, and hair was caught in a bun. Consequently, all of the surfaces of the cured meat samples in contact with the original packaging were removed. The cleaned meat was cut into small square pieces with a sterilized metallic knife and then placed into the pre-marked LDPE pouches, as shown in Figure 1. Only fatty areas of the meat samples were used for this experiment. Air was manually removed from the plastic package with a vacuum pump. To accomplish this, a needle was placed at the end of the vacuum pump tube to remove all of the air from the plastic pouches, ensuring direct contact with the sample’s surface. To avoid any possibility of polymer migration on day 0, the first sample from each cured meat type was measured right after being cut, without coming into contact with the LDPE pouch. For reference purposes, the meat surface spectral information was acquired on day 0, where the meat surface was intact and free of any LDPE contamination. The remaining samples were stored under refrigerated conditions at 4 °C, and they were measured on the corresponding measurement day that was previously marked on the LDPE pouch.
On the measurement day, each sample was carefully taken out of the plastic packaging and placed on a sterilized stainless metallic microscopic slide for Raman measurements. Based on the previously mentioned fatty characteristics of the samples, it was expected that migration of MPs from the plastic packaging to the fattier surface areas of the meats would take place earlier [27], so the measurement points selected focused on those sample areas. Only one side of the sample area was measured in multiple different places to increase the possibility of MPs’ detection, as the other side was touching the metallic plate, and MPs from the metal–sample interface could be left on the metallic slide.

2.2. Data Acquisition

Measurements were performed with a state-of-the-art instrument located in our premises; specifically, we used a modified Raman microscope (LabRAM HR; HORIBA FRANCE SAS, Longjumeau, France).

LabRAM HR Raman Microscope Instrument Description and Acquisition Settings

Raman measurements were performed with a modified LabRAM HR Raman Spectrometer (HORIBA Scientific, Kyoto, Japan). Raman excitation was achieved with a 532 nm central wavelength solid-state laser module with a maximum laser output power of 90 mW. The microscope was coupled with a 50× microscopic objective lens with 0.5 numerical aperture and 10.6 mm working distance (LMPlanFLN 50X/0.5, Olympus), delivering the excitation light and collecting the Raman signals. A neutral density filter of 5% transmittance was used, which resulted in 1 mW of power on the sample (3.2% from a maximum power of 35 mW). The laser spot size, referring to the microscope resolution, was approximately 1.7 μm laterally and 2 μm axially. A 600 groves/mm grating resulted in a Raman spectral resolution of around 2 cm−1. The Raman spectral range was set to be from 40 to 3050 cm−1, resulting in two optical windows per point. The acquisition time for each measurement was 15 s, with three accumulations in each point.
The Raman signal detector was the Syncerity CCD Deep Cooled Camera (HORIBA Scientific, Lille, France), operating at −50 °C. Before each experiment, spectral calibration of the Raman instrument was performed with an Si reference target, presenting a single peak at 520.7 cm−1. All measurements were performed under a constant environmental temperature at 22.5 °C and a humidity range between 32 and 48%. At the time of measurement, samples were placed onto a stainless-steel microscope slide using metallic forceps, maintaining the orientation they had in the LDPE pouches. From each sample, nine measurements at different points were acquired to check for Raman signal consistency. All measurements were acquired from the fattiest areas of each sample. Good signals were received only with absolute focused laser light and in flat areas.

2.3. Data Processing and Analysis

2.3.1. Raman Spectral References

In Figure 2, the Raman spectrum of LDPE is presented. The major LDPE Raman peaks are indicated with dashed green lines. Raman peak numbering is according to the ascending wavenumber order.
According to KnowItAll Informatics System by Bio–Rad Laboratories database, the identified Raman peaks of LDPE are presented in Table 1. For the identification of the LDPE Raman assignments also found in meat studies, a literature study was performed. These assignments together with the associated references are presented in Table 1. Bold peaks did not exist in meat samples.

2.3.2. Spectra Processing and Analysis

LabSpec v6 Raman software, made by Horiba (HORIBA FRANCE SAS, Longjumeau, France), was used for all Raman spectra, visualization, procedure, and analysis. All manuscript figures were generated through OriginLab 2021 pro.

Raman Spectra Processing and Analysis

The processing methodology is very important for comparing signaling results. The following processing methodology was used for each Raman spectrum: (a) smoothing under a Gaussian filter with a kernel of five points (denoise at 5) was used, where cosmic rays were removed; (b) background was removed using a baseline correction at the ninth order polynomial function; (c) a shift to zero was applied; and, finally, (d) a unit vector. Moreover, for each meat sample on every measurement day, an average spectrum from nine measurement points was determined. Finally, all of the original average day 0 Raman spectra were then removed by the average day x spectrum (day x to day 0) to observe only the Raman spectral changes throughout the experiment.

3. Results and Discussion

3.1. Raman Spectroscopic Analysis

3.1.1. Consistency/Repeatability Tests

Initially, consistency/repeatability tests of the Raman measurements on the same sample were performed. For this reason, nine measurements at different locations were acquired from each meat sample. The averages of these measurements are presented in Figure 3. As shown, measurement repeatability was found to be consistent. Some of the inconsistencies were mainly due to the spatial inhomogeneity of the sample, most probably due to the protein/fatty ratio of the tissue. In general, Raman measurements followed the same pattern between the same sample, presenting a strong level of repeatability. Day 0 was chosen for the consistency/repeatability measurements, where there was no MP migration or bacterial growth.
Furthermore, on day 9, bacon and mortadella samples presented some microstructural differentiations in fatty measurement areas, observed by Raman microscope. These differentiations are possibly related to the presence of bacterial growth such as Salmonella [41], lactic acid bacteria, Carnobacterium maltaromaticum, Staphylococcus [42], and other bacteria. In bacon, the most common bacteria during prolonged storage are Serratia, Carnobacterium, and Leuconostoc [42]. In vacuum-packed and refrigerated meat products, meat spoilage arises owing to the interaction among lactic acid bacteria (the dominant flora) and Enterobacteriaceae, Pseudomonads, Brochothrix thermosphacta, and other bacterial species [42]. In salami, some common bacteria in abundance are Lactobacilli and Staphylococci [43].
Salami samples did not seem to have such bacterial growth at the early stages of the experiment. On day 28, all samples had some spherical and fibrous microstructures. These structures were not present before day 9; therefore, we assume that they indicate the start of bacterial growth. Three selected pictures are presented in Figure 4 below.

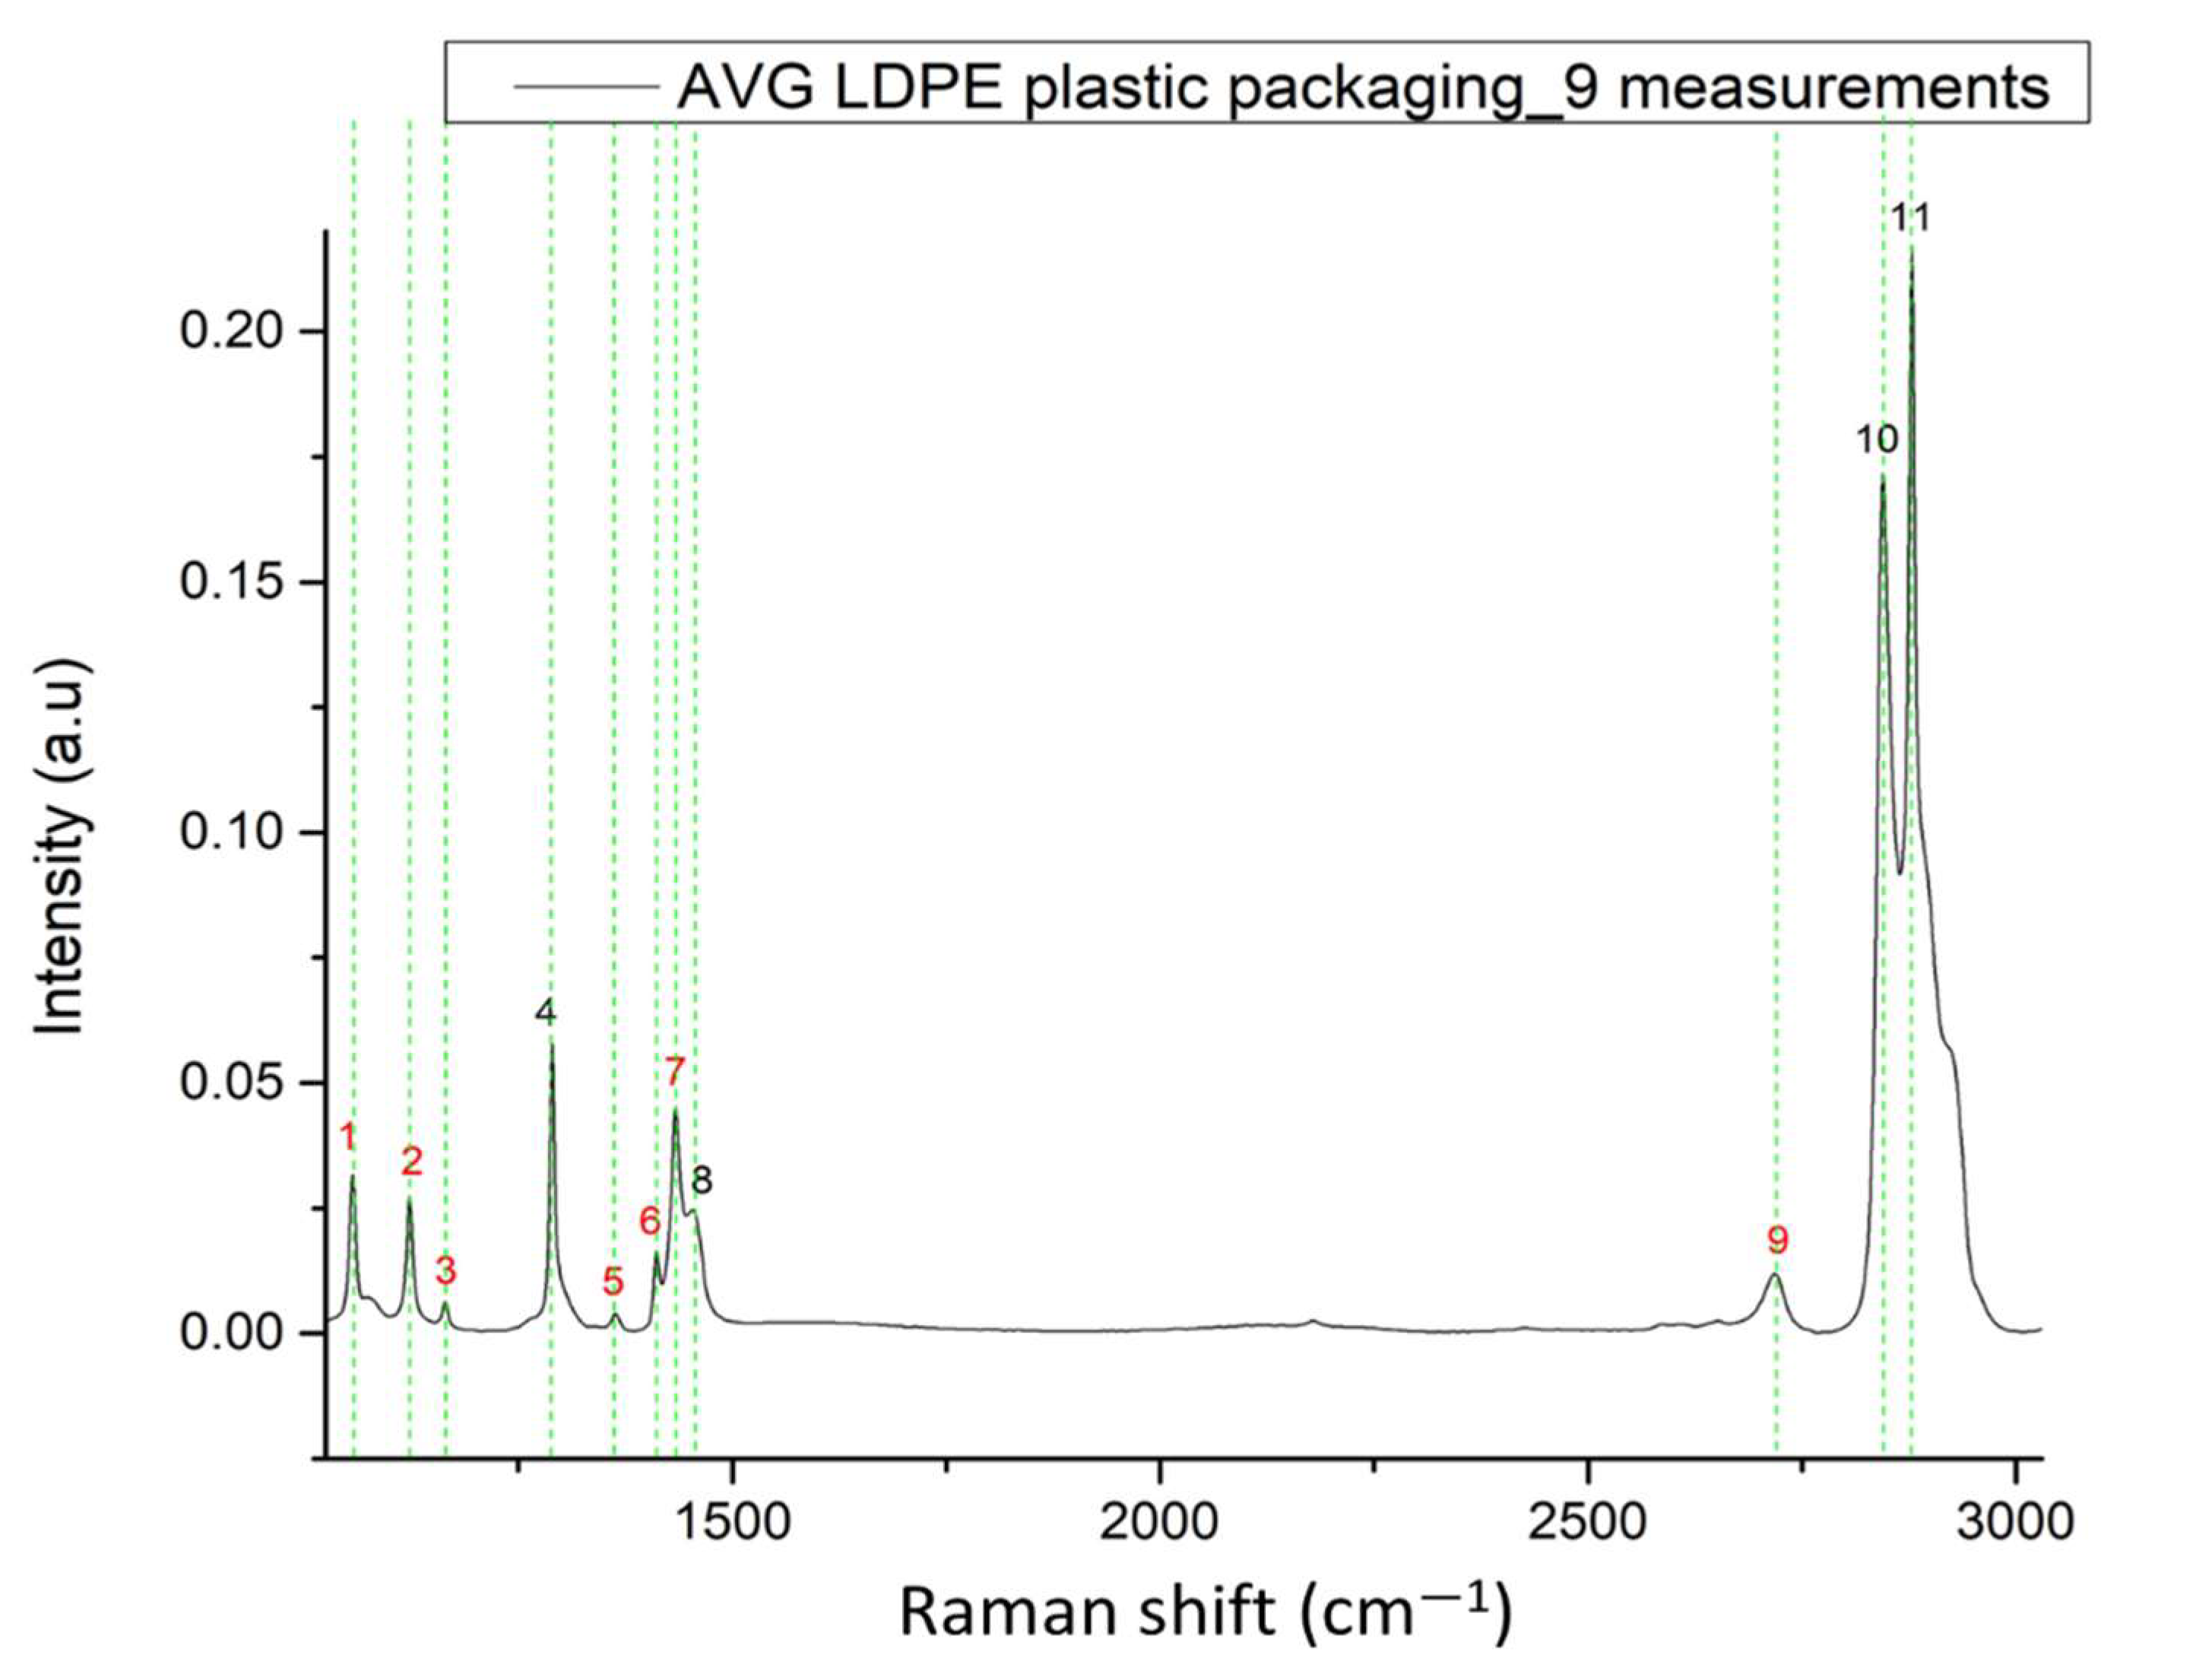
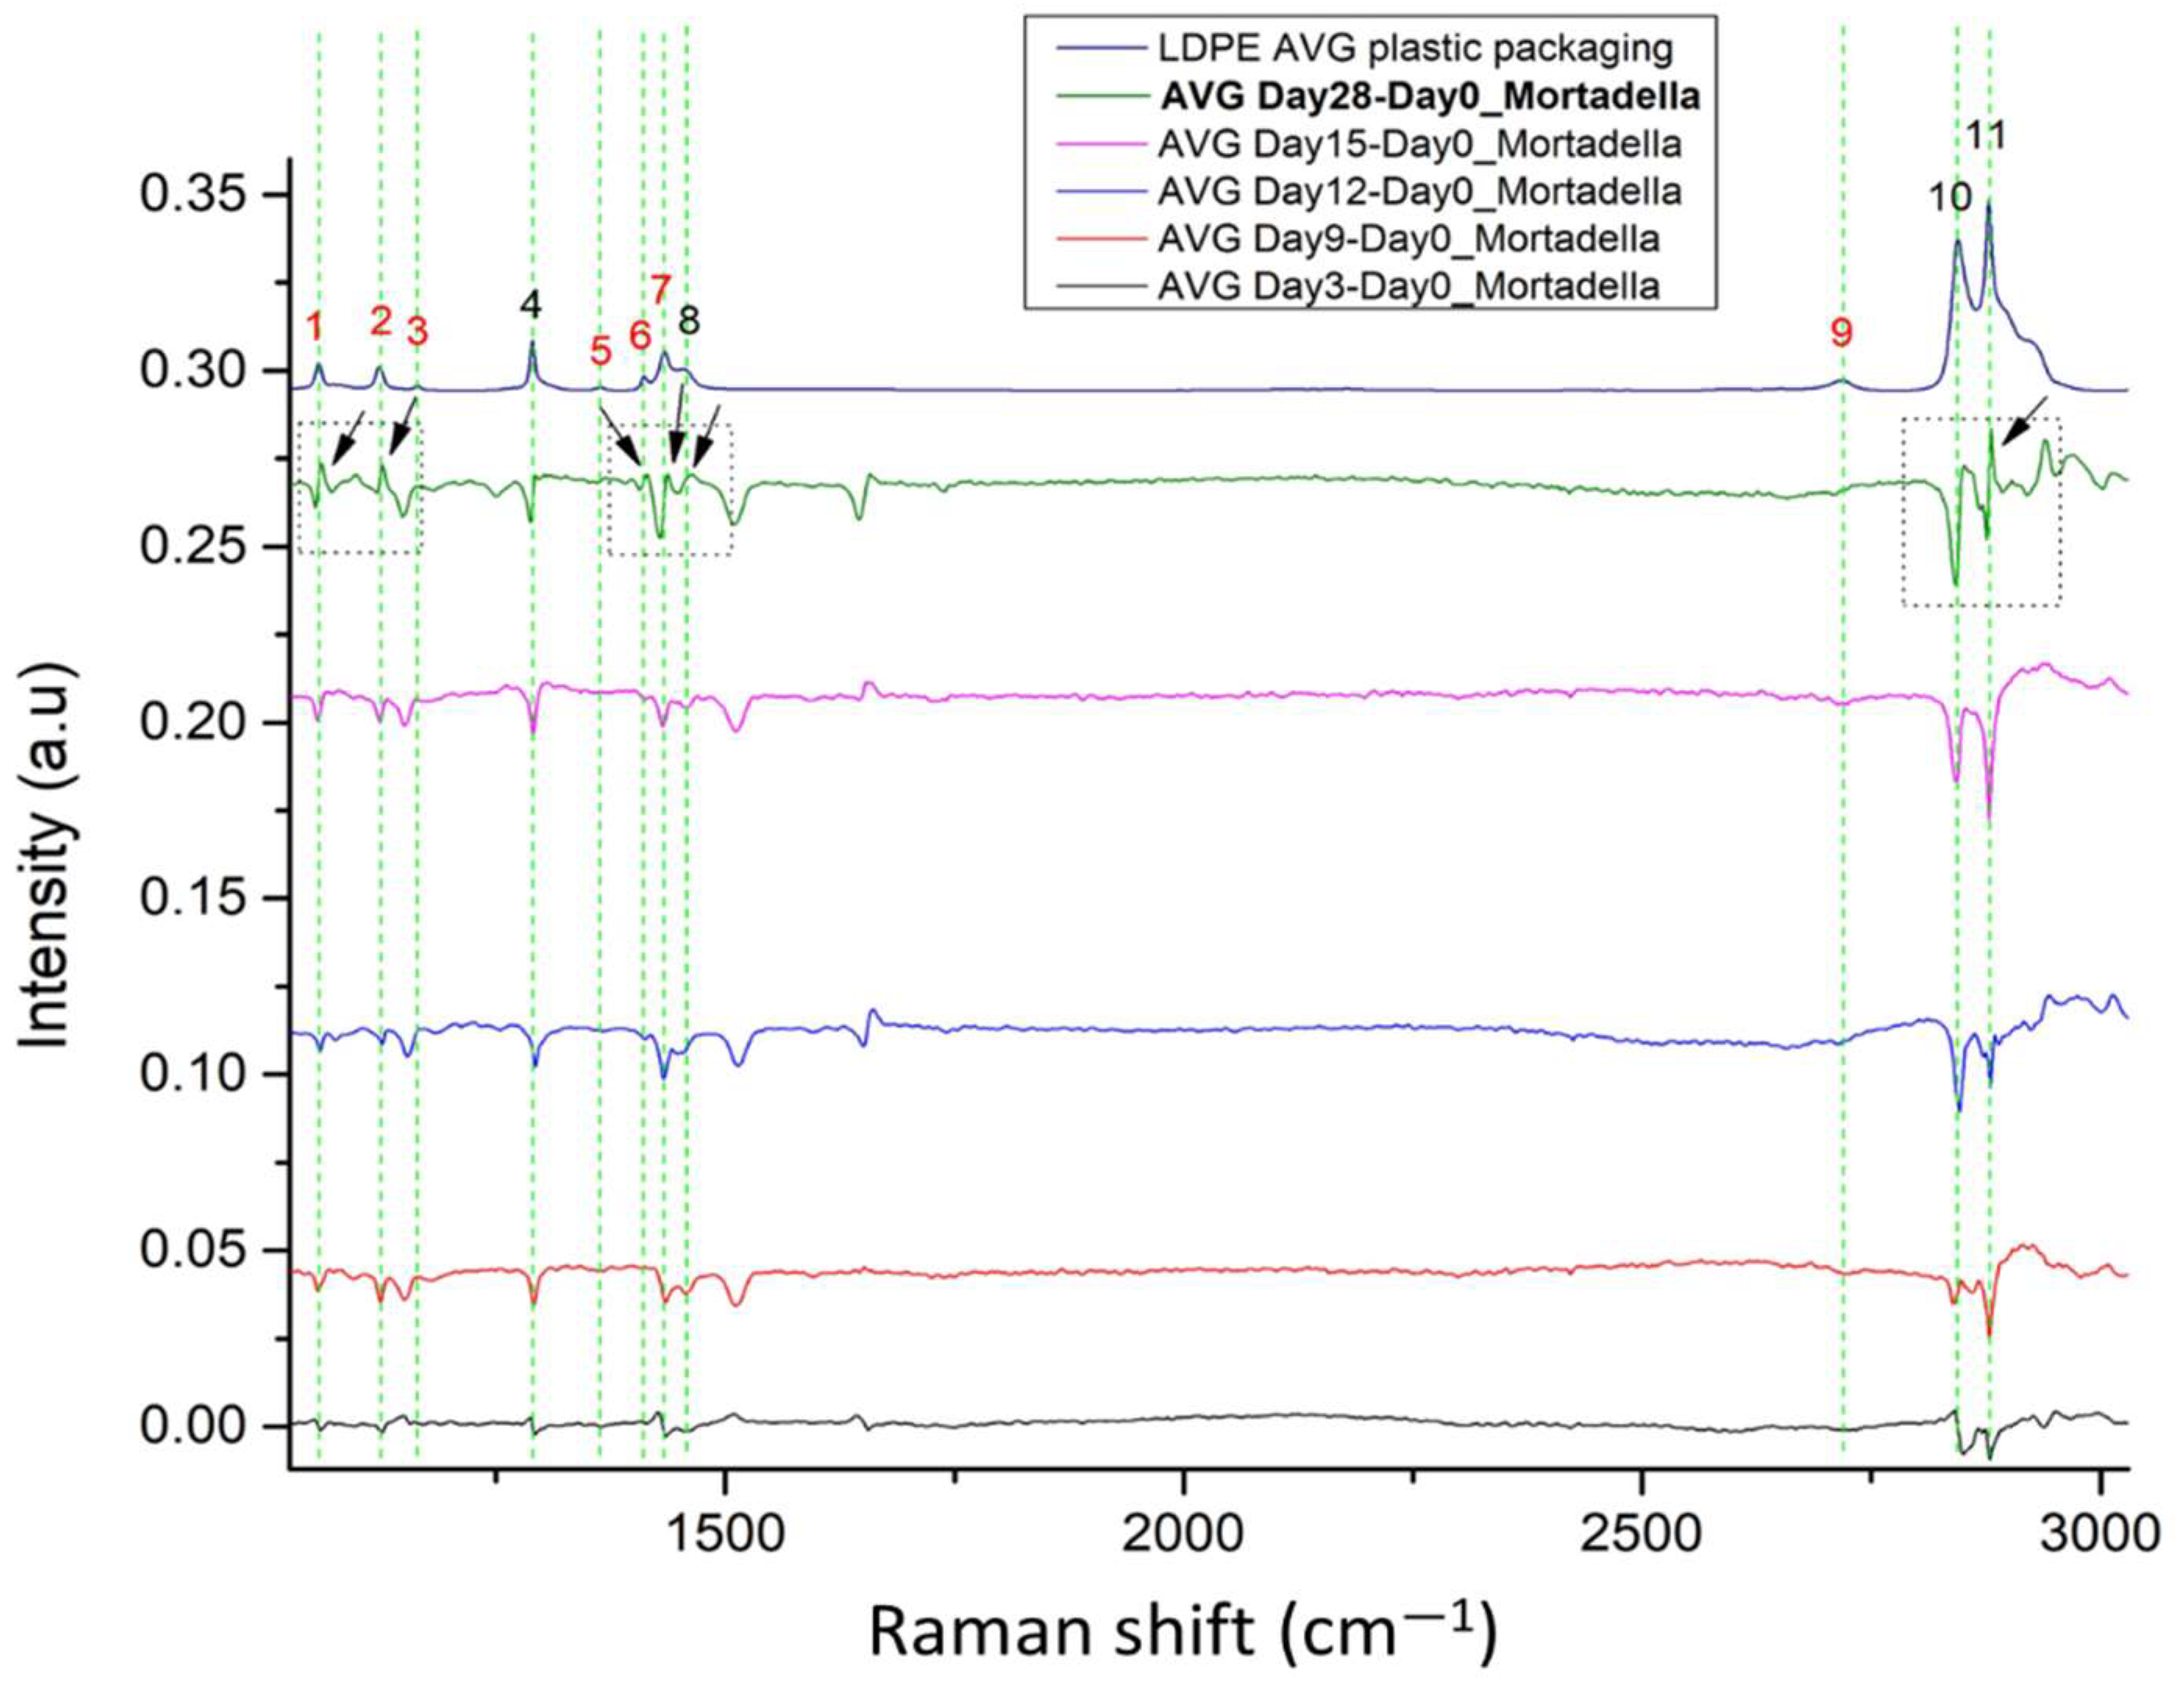
3.1.2. LDPE Detection

Initially, all meat samples were measured on day 0 and compared with the characteristic Raman signal of LDPE to understand if there were any overlapping peaks. The Raman measurements are presented in Figure 5. As can be observed, all 11 Raman peaks of LDPE are not present in the sample’s spectrum, except from number 4 at 1290 cm−1, number 10 at 2844 cm−1, and number 11 at 2879 cm−1, where their wavenumbers are close to sample peaks (1288, 2845, and 2877 cm−1, respectively). Although these Raman peaks are not different from the ones of LDPE, MPs’ migration can be detected through changes in those peak intensities.
Important Note: All of the meat samples were also measured by ATR/FT–IR spectroscopy, but, most probably because of the large spatial spot size, MPs were not detected. Nevertheless, all ATR/FT–IR instrument description and settings are described in S2.1 and Figure S1. The results from the sample measurements can be found in the Supplementary Document (S3.2 and Figure S2) of this work.
As we observe in Figure 6 bellow, almost all Raman LDPE peaks start to appear at on day 9 in bacon and, on day 12, these peaks continue to appear. This means that we have detectable migration of MPs from plastic packaging to the bacon surface on day 9. On day 15, the LDPE peaks are reversed, probably because of the presence of bacterial growth of some developing species [42], causing bacon spoilage [44]. Finally, on day 28, we observe again the appearance of LDPE peaks, because MPs have accumulated on so many days. Concurrently, these peaks are not less prominent on day 28, owing to the parallel extended bacterial growth (see Figure 4).
Different behavior was found in mortadella meat. As we observe in Figure 7, the first detection of the migration of MPs was on day 28. Before then, we did not observe any LDPE peak on days 3, 9, 12 or 15. This fact can be explained as follows: mortadella has a more uniform fat content distribution with less dense areas than bacon, where the migration of LDPE was first detected on day 9. Moreover, mortadella was boiled, not smoked or dried, which has probably caused a significant amount of lipids to be redistributed during the boiling process. For these reasons, mortadella can be preserved for longer periods in the fridge, the development of bacterial growth is more difficult, and the migration of MPs is delayed because of the uniform distribution of lipids. It is noteworthy that mortadella is a cooked meat product with a shelf life of up to 60 days when stored at 4 °C [27,45].
Salami meat was the most stable, concerning the development of bacterial growth, compared with mortadella and bacon. Migration of MPs was detected sooner compared with mortadella, but later compared with bacon samples. On day 15, LDPE peaks increased and were observed for the first time, as can be seen in Figure 8 below. On day 28, these peaks were less distinct, probably because of the bacterial growth that covers the LDPE signal (see Figure 8 below).
Based on the spectral differences from day 0, we believe that an interplay between the LDPE characteristic peaks and the behavior of the Raman signals from the meat samples could not possibly exist throughout the days. Additionally, the measured LDPE spectral features have no direct correlation with the spectral features from Raman spectra present in the later experimental days, where the bacterial growth starts to develop and the spoilage of the meat begins. These observations, in combination with the fact that the most important LDPE peaks are present from day 9 in bacon, day 15 in salami, and day 28 in mortadella, prove that the Raman spectra identified are most probably from the polymer itself. However, this result is due to Raman instrument sensitivity, which managed to detect those peaks only after day 9. Migration of MPs from plastic packaging to the surface of cured meat samples could have possibly started earlier in the timeline even though the concentration of the polymeric migration may have not been sufficient to be detected with Raman spectroscopy.
It must be noted that the aim of our work is to show that microplastics indeed migrate from food packaging to processed food (fatty food) while being kept under refrigerated conditions. Any correlation with human health is out of the scope of this work and should be studied in the future.

4. Conclusions

In this work, we showed that LDPE migration from LDPE food packaging indeed occurs in three different cured meat samples being kept under refrigeration temperatures (4 °C). We managed to observe this polymeric migration over time, based on Raman spectroscopy instrumentation. MPs were first identified on day 9 in bacon, later on day 15 in salami, and finally on day 28 in Mortadella. LDPE migration was validated with Raman spectroscopy, but not through ATR/FT–IR spectroscopy. With Raman spectroscopy, a simple, fast, and efficient vibrational spectral measurement methodology was developed, which enabled us to detect the migration of MPs to foodstuffs through Raman signal analysis. Our findings indicate that MPs migrate from LDPE packaging to processed meat while being kept under refrigerated storage conditions.

Supplementary Materials

The following supporting information can be downloaded at https://www.mdpi.com/article/10.3390/microplastics1030031/s1, Figure S1: Sample preparation process for ATR measurement; Figure S2: ATR measurements of meat samples compared with LDPE peaks.

Author Contributions

Conceptualization and methodology, G.K. and V.M.P.; bibliographic investigation, K.K., G.K., E.A. and V.M.P.; experimental characterization and analysis, K.K., G.K. and V.M.P.; manuscript reviewing, G.K., E.A. and V.M.P.; funding acquisition, G.K. and V.M.P. All authors have read and agreed to the published version of the manuscript.

Funding

This work was financially supported by the project “Advanced Research Activities in Biomedical and Agro alimentary Technologies” (MIS 5002469), which is implemented under the “Action for the Strategic Development on the Research and Technological Sector”, funded by the Operational Programme “Competitiveness, Entrepreneurship, and Innovation” (NSRF 2014–2020) and co-financed by Greece and the European Union (European Regional Development Fund); the BIOIMAGING-GR (MIS 5002755) implemented under “Action for Strengthening Research and Innovation Infrastructures”, funded by the Operational Programme ”Competitiveness, Entrepreneurship, and Innovation” (NSRF 2014–2020) and co-financed by Greece and the European Union (European Regional Development Fund). Finally, the authors Κ.Κ. and G.K. acknowledge the project “NanoBioPack” (MIS 5056214), funded from GSRT special actions: Aquaculture—Industrial materials—Open innovation culture, Greek General Secretariat for Research and Technology (GSRT), Greece.

Institutional Review Board Statement

Not applicable.

Informed Consent Statement

Not applicable.

Data Availability Statement

All data reported here can be made available upon request.

Conflicts of Interest

The authors declare no conflict of interest.

References

  1. Pironti, C.; Ricciardi, M.; Motta, O.; Miele, Y.; Proto, A.; Montano, L. Microplastics in the Environment: Intake through the Food Web, Human Exposure and Toxicological Effects. Toxics 2021, 9, 224. [Google Scholar] [CrossRef]
  2. Zhang, Y.; Wang, S.; Olga, V.; Xue, Y.; Lv, S.; Diao, X.; Zhang, Y.; Han, Q.; Zhou, H. The potential effects of microplastic pollution on human digestive tract cells. Chemosphere 2022, 291, 132714. [Google Scholar] [CrossRef] [PubMed]
  3. Meng, X.; Zhang, J.; Wang, W.; Gonzalez-Gil, G.; Vrouwenvelder, J.S.; Li, Z. Effects of nano- and microplastics on kidney: Physicochemical properties, bioaccumulation, oxidative stress and immunoreaction. Chemosphere 2022, 288, 132631. [Google Scholar] [CrossRef] [PubMed]
  4. Gouin, T.; Ellis-Hutchings, R.; Hampton, L.M.T.; Lemieux, C.L.; Wright, S.L. Screening and prioritization of nano- and microplastic particle toxicity studies for evaluating human health risks—Development and application of a toxicity study assessment tool. Microplastics Nanoplastics 2022, 2, 2. [Google Scholar] [CrossRef] [PubMed]
  5. POMA. Advantages and Disadvantages of Plastic Packaging. Available online: http://poma.com.vn/en/advantages-and-disadvantages-of-plastic-packaging/ (accessed on 1 May 2022).
  6. Cruz, R.M.S.; Rico, B.P.M.; Vieira, M.C. 9—Food Packaging and Migration. In Food Quality and Shelf Life; Galanakis, C.M., Ed.; Academic Press: Cambridge, MA, USA, 2019; pp. 281–301. [Google Scholar] [CrossRef]
  7. PACKCON.org. Polymers In Food Packaging. Available online: http://packcon.org/index.php/en/articles/102-2016/192-polymers-in-food-packaging (accessed on 1 May 2022).
  8. Dey, A.; Dhumal, C.V.; Sengupta, P.; Kumar, A.; Pramanik, N.K.; Alam, T. Challenges and possible solutions to mitigate the problems of single-use plastics used for packaging food items: A review. J. Food Sci. Tech. Mys. 2020, 58, 3251–3269. [Google Scholar] [CrossRef]
  9. Din, M.I.; Ghaffar, T.; Najeeb, J.; Hussain, Z.; Khalid, R.; Zahid, H. Potential perspectives of biodegradable plastics for food packaging application-review of properties and recent developments. Food Addit. Contam. Part A 2020, 37, 665–680. [Google Scholar] [CrossRef] [PubMed]
  10. Matthews, C.; Moran, F.; Jaiswal, A.K. A review on European Union’s strategy for plastics in a circular economy and its impact on food safety. J. Clean. Prod. 2021, 283, 125263. [Google Scholar] [CrossRef]
  11. Yates, J.; Deeney, M.; White, H.; Joy, E.; Kalamatianou, S.; Kadiyala, S. PROTOCOL: Plastics in the food system: Human health, economic and environmental impacts. A scoping review. Campbell Syst. Rev. 2019, 15, e1033. [Google Scholar] [CrossRef]
  12. Machinery, K.P. Sausage Packaging Solution. Available online: https://kbtfoodpack.com/food-related-technology/sausage-packaging-solution/ (accessed on 12 May 2022).
  13. Robertson, G.L. Food Packaging Principles and Practice, 2nd ed.; CRC Press, Taylor and Francis Group: Boca Raton, FL, USA, 2006. [Google Scholar]
  14. Crompton, T.R. Additive Migration from Plastics into Food, 1st ed.; Shawbury, S., Ed.; Smithers Rapra Technology Limited: Shropshire, UK, 2007. [Google Scholar]
  15. Scientific, T.F. Low Density Polyethylene (LDPE) Labware. Available online: https://www.thermofisher.com/gr/en/home/life-science/lab-plasticware-supplies/plastic-material-selection/low-density-polyethylene-ldpe-labware.html (accessed on 23 June 2022).
  16. Vitali, C.; Peters, R.; Janssen, H.-G.; Nielen, M.W. Microplastics and nanoplastics in food, water, and beverages; part I. Occurrence. TrAC Trends Anal. Chem. 2022, 116670. [Google Scholar] [CrossRef]
  17. El-Ziney, M.G. Migration Levels of Monostyrene from Polystyrene Containers to Dairy Products. MOJ Food Process. Technol. 2016, 3, 267–271. [Google Scholar] [CrossRef]
  18. Yakes, B.J.; Moskowitz, J.; Crump, E.; Ellsworth, Z.; Carlos, K.; Begley, T. Evaluation of portable vibrational spectroscopy for identifying plasticizers in dairy tubing. Food Addit. Contam. A 2022, 39, 817–827. [Google Scholar] [CrossRef] [PubMed]
  19. Rubio-Armendáriz, C.; Alejandro-Vega, S.; Paz-Montelongo, S.; Gutiérrez-Fernández, J.; Carrascosa-Iruzubieta, C.J.; la Torre, A.H.-D. Microplastics as Emerging Food Contaminants: A Challenge for Food Safety. Int. J. Environ. Res. Public Health 2022, 19, 1174. [Google Scholar] [CrossRef]
  20. Guerreiro, T.M.; de Oliveira, D.N.; Melo, C.F.O.R.; Lima, E.D.O.; Catharino, R.R. Migration from plastic packaging into meat. Food Res. Int. 2018, 109, 320–324. [Google Scholar] [CrossRef] [PubMed]
  21. Paraskevopoulou, D.; Achilias, D.S.; Paraskevopoulou, A. Migration of styrene from plastic packaging based on polystyrene into food simulants. Polym. Int. 2012, 61, 141–148. [Google Scholar] [CrossRef]
  22. Simon, P.; Chaudhry, Q.; Bakos, D. Migration of engineered nanoparticles from polymer packaging to food—A physicochemical view. J. Food Nutr. Res. 2008, 47, 105. [Google Scholar]
  23. Ščetar, M.; Daniloski, D.; Tinjić, M.; Kurek, M.; Galić, K. Effect of Ultrasound Treatment on Barrier Changes of Polymers before and after Exposure to Food Simulants. Polymers 2022, 14, 990. [Google Scholar] [CrossRef]
  24. Fasihnia, S.H.; Peighambardoust, S.H.; Oromiehie, A.; Soltanzadeh, M.; Peressini, D. Migration analysis, antioxidant, and mechanical characterization of polypropylene-based active food packaging films loaded with BHA, BHT, and TBHQ. J. Food Sci. 2020, 85, 2317–2328. [Google Scholar] [CrossRef]
  25. Castle, L.; Mayo, A.; Crews, C.; Gilbert, J. Migration of Poly(ethylene terephthalate) (PET) Oligomers from PET Plastics into Foods during Microwave and Conventional Cooking and into Bottled Beverages. J. Food Prot. 1989, 52, 337–342. [Google Scholar] [CrossRef]
  26. Hahladakis, J.N.; Velis, C.A.; Weberb, R.; Iacovidoua, E.; Purnella, P. An overview of chemical additives present in plastics: Migration, release, fate and environmental impact during their use, disposal and recycling. J. Hazard. Mater. 2018, 344, 179–199. [Google Scholar] [CrossRef]
  27. Wang, Q.; Storm, B.K. Migration Study of Polypropylene (PP) Oil Blends in Food Simulants. Macromol. Symp. 2006, 242, 307–314. [Google Scholar] [CrossRef]
  28. Huang, Y.; Chapman, J.; Deng, Y.; Cozzolino, D. Rapid measurement of microplastic contamination in chicken meat by mid infrared spectroscopy and chemometrics: A feasibility study. Food Control 2020, 113, 107187. [Google Scholar] [CrossRef]
  29. Kumar, B.V.; Löschel, L.A.; Imhof, H.K.; Löder, M.G.; Laforsch, C. Analysis of microplastics of a broad size range in commercially important mussels by combining FTIR and Raman spectroscopy approaches. Environ. Pollut. 2021, 269, 116147. [Google Scholar] [CrossRef] [PubMed]
  30. Tympa, L.-E.; Katsara, K.; Moschou, P.; Kenanakis, G.; Papadakis, V. Do Microplastics Enter Our Food Chain Via Root Vegetables? A Raman Based Spectroscopic Study on Raphanus sativus. Materials 2021, 14, 2329. [Google Scholar] [CrossRef] [PubMed]
  31. Lu, J.; Xue, Q.; Bai, H.; Wang, N. Design of a confocal micro-Raman spectroscopy system and research on microplastics detection. Appl. Opt. 2021, 60, 8375–8383. [Google Scholar] [CrossRef] [PubMed]
  32. Robert, C.; Fraser-Miller, S.J.; Jessep, W.T.; Bain, W.E.; Hicks, T.M.; Ward, J.F.; Craigie, C.R.; Loeffen, M.; Gordon, K.C. Rapid discrimination of intact beef, venison and lamb meat using Raman spectroscopy. Food Chem. 2021, 343, 128441. [Google Scholar] [CrossRef] [PubMed]
  33. Katsara, K.; Kenanakis, G.; Viskadourakis, Z.; Papadakis, V. Polyethylene Migration from Food Packaging on Cheese Detected by Raman and Infrared (ATR/FT-IR) Spectroscopy. Materials 2021, 14, 3872. [Google Scholar] [CrossRef]
  34. Kris Gunnars, H. Is Bacon Bad for You, or Good? The Salty, Crunchy Truth. Available online: https://www.healthline.com/nutrition/is-bacon-bad-or-good (accessed on 16 May 2022).
  35. Saldaña, E.; Siche, R.; Pinto, J.S.D.S.; de Almeida, M.A.; Selani, M.M.; Rios-Mera, J.; Contreras-Castillo, C.J. Optimization of lipid profile and hardness of low-fat mortadella following a sequential strategy of experimental design. J. Food Sci. Technol. 2018, 55, 811–820. [Google Scholar] [CrossRef]
  36. Loizzo, M.R.; Spizzirri, U.G.; Bonesi, M.; Tundis, R.; Picci, N.; Restuccia, D. Influence of packaging conditions on biogenic amines and fatty acids evolution during 15 months storage of a typical spreadable salami (’Nduja). Food Chem. 2016, 213, 115–122. [Google Scholar] [CrossRef]
  37. Pour, S.O.; Fowler, S.M.; Hopkins, D.L.; Torley, P.J.; Gill, H.; Blanch, E.W. Investigation of chemical composition of meat using spatially off-set Raman spectroscopy. Analyst 2019, 144, 2618–2627. [Google Scholar] [CrossRef] [PubMed]
  38. Ruiz-Capillas, C.; Herrero, A. Development of Meat Products with Healthier Lipid Content: Vibrational Spectroscopy. Foods 2021, 10, 341. [Google Scholar] [CrossRef]
  39. Robert, C.; Jessep, W.; Sutton, J.J.; Hicks, T.M.; Loeffen, M.; Farouk, M.; Ward, J.F.; Bain, W.E.; Craigie, C.R.; Fraser-Miller, S.J.; et al. Evaluating low- mid- and high-level fusion strategies for combining Raman and infrared spectroscopy for quality assessment of red meat. Food Chem. 2021, 361, 130154. [Google Scholar] [CrossRef] [PubMed]
  40. Gao, F.; Ben-Amotz, D.; Yang, Z.; Han, L.; Liu, X. Complementarity of FT-IR and Raman spectroscopies for the species discrimination of meat and bone meals related to lipid molecular profiles. Food Chem. 2021, 345, 128754. [Google Scholar] [CrossRef]
  41. Okoń, A.; Szymański, P.; Zielińska, D.; Szydłowska, A.; Siekierko, U.; Kołożyn-Krajewska, D.; Dolatowski, Z.J. The Influence of Acid Whey on the Lipid Composition and Oxidative Stability of Organic Uncured Fermented Bacon after Production and during Chilling Storage. Antioxidants 2021, 10, 1711. [Google Scholar] [CrossRef] [PubMed]
  42. Li, X.; Xiong, Q.; Zhou, H.; Xu, B.; Sun, Y. Analysis of Microbial Diversity and Dynamics During Bacon Storage Inoculated with Potential Spoilage Bacteria by High-Throughput Sequencing. Front. Microbiol. 2021, 12, 713513. [Google Scholar] [CrossRef]
  43. Połka, J.; Rebecchi, A.; Pisacane, V.; Morelli, L.; Puglisi, E. Bacterial diversity in typical Italian salami at different ripening stages as revealed by high-throughput sequencing of 16S rRNA amplicons. Food Microbiol. 2015, 46, 342–356. [Google Scholar] [CrossRef]
  44. Li, X.; Li, C.; Ye, H.; Wang, Z.; Wu, X.; Han, Y.; Xu, B. Changes in the microbial communities in vacuum-packaged smoked bacon during storage. Food Microbiol. 2019, 77, 26–37. [Google Scholar] [CrossRef] [PubMed]
  45. Junior, A.C.D.S.; de Oliveira, R.F.; Henry, F.D.C.; Junior, J.D.A.M.; Moulin, M.M.; Della Lucia, S.M.; Quirino, C.R.; Martins, M.L.L.; Rampe, M.C.C. Physicochemical composition, lipid oxidation, and microbiological quality of ram mortadella supplemented with Smallanthus sonchifolius meal. Food Sci. Nutr. 2020, 8, 5953–5961. [Google Scholar] [CrossRef]
Figure 1. Sample preparation process.
Microplastics 01 00031 g001
Figure 2. Raman spectrum of LDPE. Peaks in bold do not exist in meat samples.
Microplastics 01 00031 g002
Figure 3. Raman consistency/repeatability average measurements of meat samples, from the nine different measurement points on day 0. Spectra are presented in stack-line format, with an offset between them, in order to present the full spectral details in each sample. For this reason, the intensity axis is in arbitrary units. Standard deviation is depicted as green shadows.
Microplastics 01 00031 g003
Figure 4. Bright-field picture of the meat samples from the Raman microscope: left picture, mortadella on day 12; middle picture, salami on day 28; and right picture, bacon on day 28. The point of the Raman measurement is depicted as a green dot in the center of the picture.
Microplastics 01 00031 g004
Figure 5. Average of reference Raman spectra from meat samples at day 0 and LDPE. Spectra are presented in stack-line format, with an offset between them, in order to present the full spectral details in each sample. For this reason, the intensity axis is in arbitrary units.
Microplastics 01 00031 g005
Figure 6. Raman spectra of bacon on different days, in comparison with LDPE spectrum. The Raman spectrum is presented in stack-line format, with an offset between them, in order to present the full spectral details in each sample. For this reason, the intensity axis is in arbitrary units.
Microplastics 01 00031 g006
Figure 7. Raman spectra of mortadella on different days, in comparison with the LDPE spectrum. The Raman spectrum is presented in stack-line format, with an offset between them, in order to present the full spectral details in each sample. For this reason, the intensity axis is in arbitrary units.
Microplastics 01 00031 g007
Figure 8. Raman spectra of salami on different days, in comparison with the LDPE spectrum. The Raman spectrum is presented in stack-line format, with an offset between them, in order to present the full spectral details in each sample. For this reason, the intensity axis is in arbitrary units.
Microplastics 01 00031 g008
Table 1. List of the major Raman peak assignments commonly found in meat and LDPE.
NoLDPE Major Raman Peaks (cm−1)Raman Peak Assignments Found in Meat Studies (cm−1)
110561056 → it does not exist in meat samples
1064 → v(C–C) of lipids [37]
211231123 → it does not exist in meat samples
1129 Proteins, lipids, ν(C–N), ν(C–C) [37]
311641164 → it does not exist in meat samples
1171 Proteins, ν(C–N), ν(C–C) [37]
412901297 Amide III, protein α–helix [37]
1225–1350 Amide III vibrational modes [38]
513631363 → it does not exist in meat samples
614111411 → it does not exist in meat samples
714351435 → it does not exist in meat samples
1443 CH2 twisting modes of lipids [38], scissoring mode of methylene δ(CH2) in fats [37]
814531451 CH2 and CH3 bending vibration in lipids and protein [39]
1449 Proteins, lipids, δ(CH2, CH3) [37]
927182718 → it does not exist in meat samples
1028442850 CH2 symmetric stretching motion of lipids [38]
2950~2800 C–H (CH2 and CH3) stretching vibrations of lipids [40]
1128792950~2800 → C–H (CH2 and CH3) stretching vibrations of lipids [40]
Publisher’s Note: MDPI stays neutral with regard to jurisdictional claims in published maps and institutional affiliations.

