
An Alignment-Free Explanation for Collective Predator Evasion in Moving Animal Groups


Abstract
:1. Introduction
2. Model and Methods
- 1.
- 2.
- The particles are initialized in a polarized configuration (as observed in experiments) moving clockwise (CW) in the annular region. See Figure 1a;
- 3.
- As the group of particles approach a specified point with coordinates located inside the annular region ahead of the moving group, a predator attack is simulated at a specified time . All particles that are within a distance of from the predator attack point detect the predator when it becomes active at time and are strongly repelled directly away from it. See Figure 1b,c. More specifically, if a particle i is within of the predator point, its heading update has an additional predator evasion term added to Equation (1) in [43]. The most general form of the heading update formula used here iswhere is particle i’s current heading, is the normalized direction towards the local center of mass of its neighbors except those in the blind zone, is the normalized average heading of its neighbors, is a local distance dependent repulsion term, is the repulsion directly away from the predator, is a heading noise term, and the parameters a, b, c, e, r, specify the relative strengths of the different interaction terms. For a detailed description of all terms except the predator repulsion term see [43,44]. The predator repulsion term has exactly the same form as the local repulsion term , but is calculated using only the predator coordinate instead of the coordinates of all neighbors of the particle;
- 4.
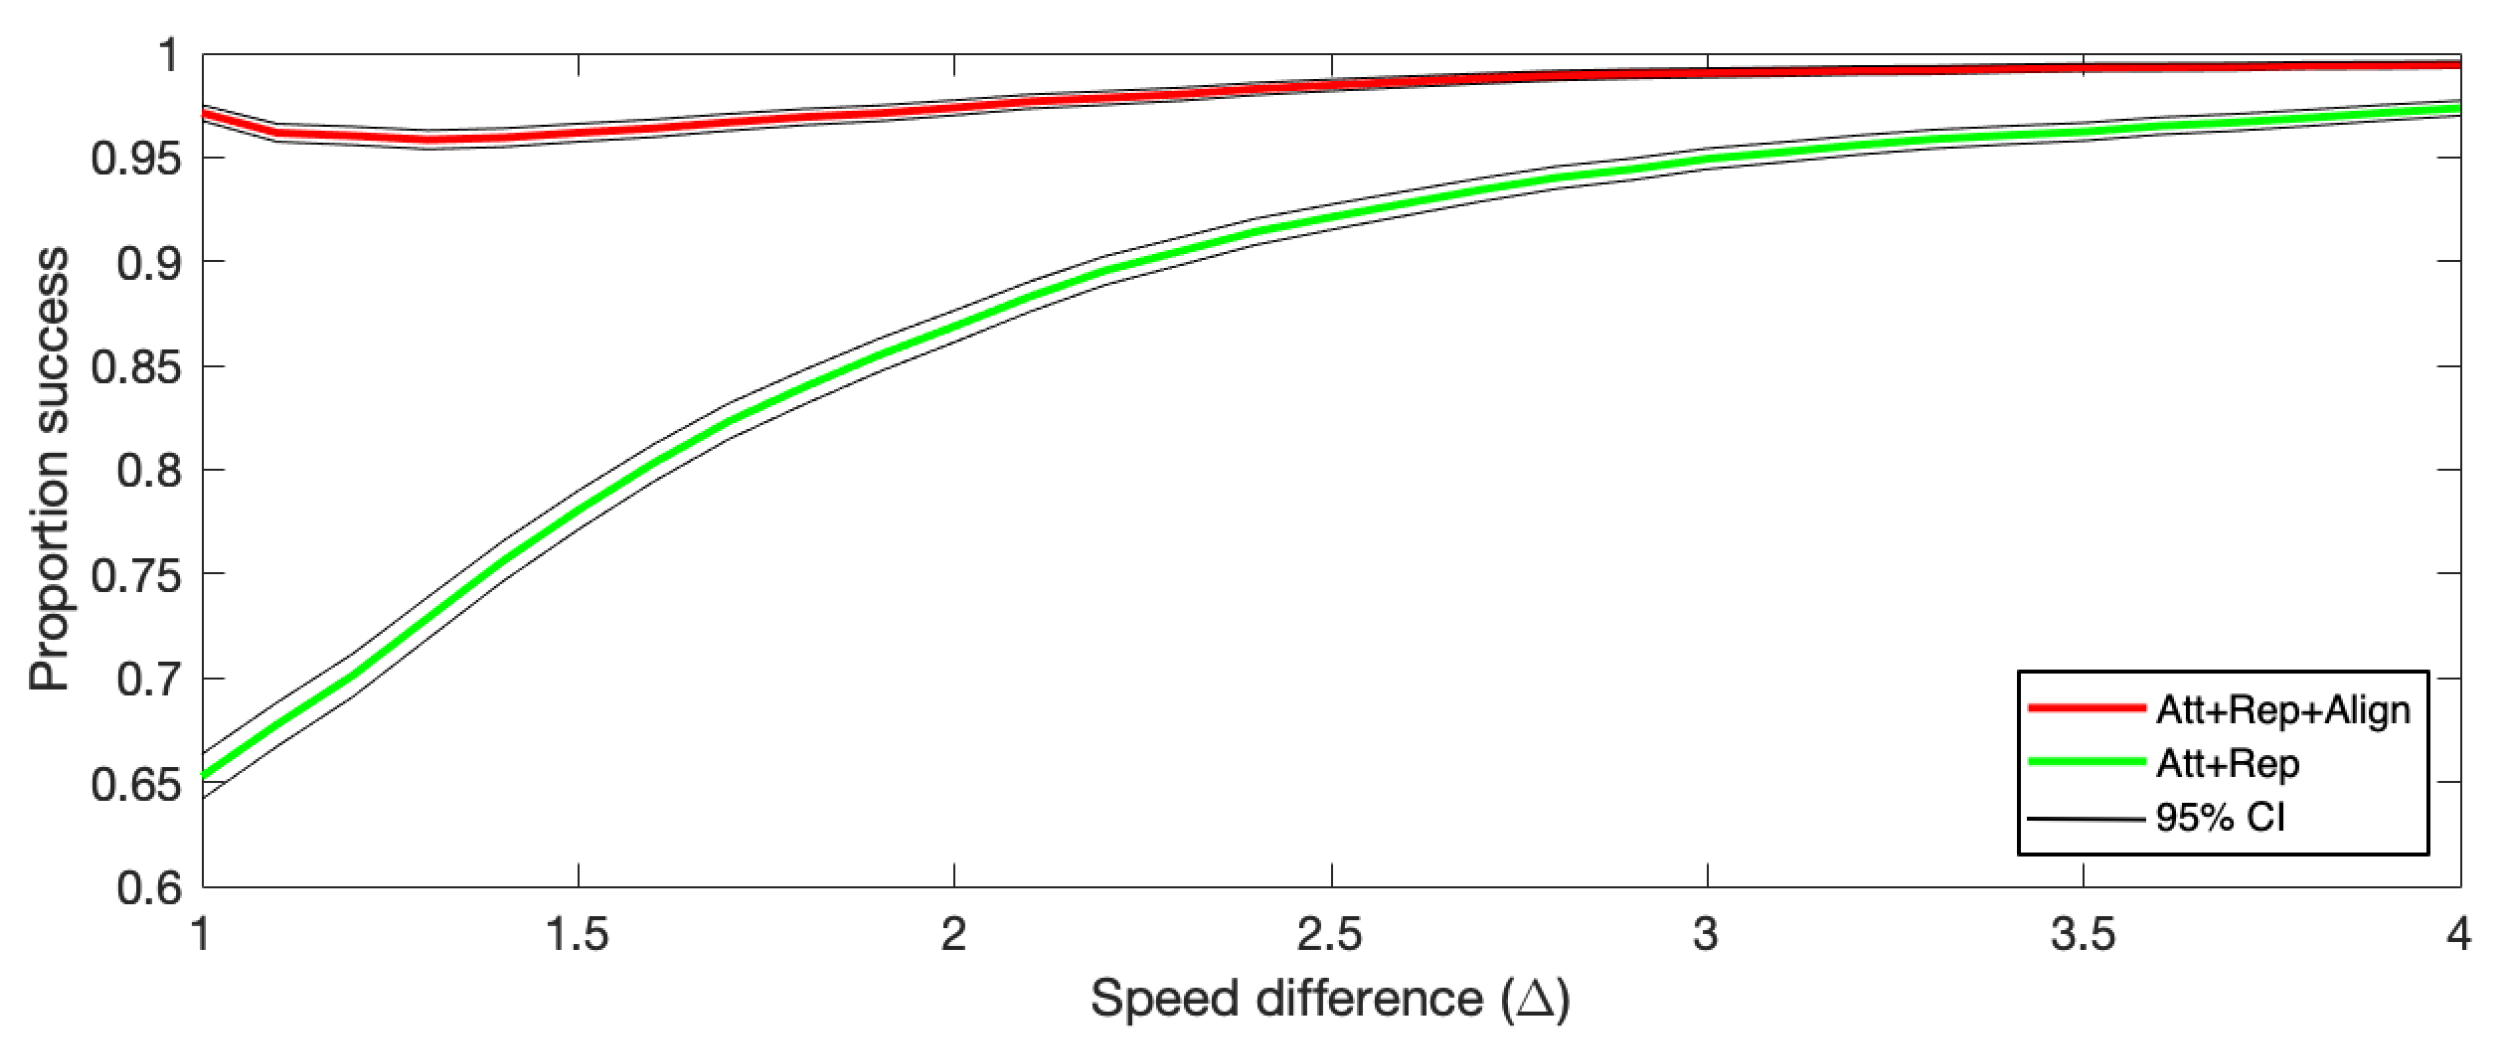
- To investigate the potential impacts of a difference in speeds between particles that have and those that have not detected the predator, we add a parameter in some analyses. We denote the ratio of the speed of particles that have detected the predator () and the speed of those that have not () by . So, if there is no difference in speed between those that have detected it and those that have not, then , if those that have detected it moves twice as fast as those that have not, then , and so on.
2.1. Measures
- 1.
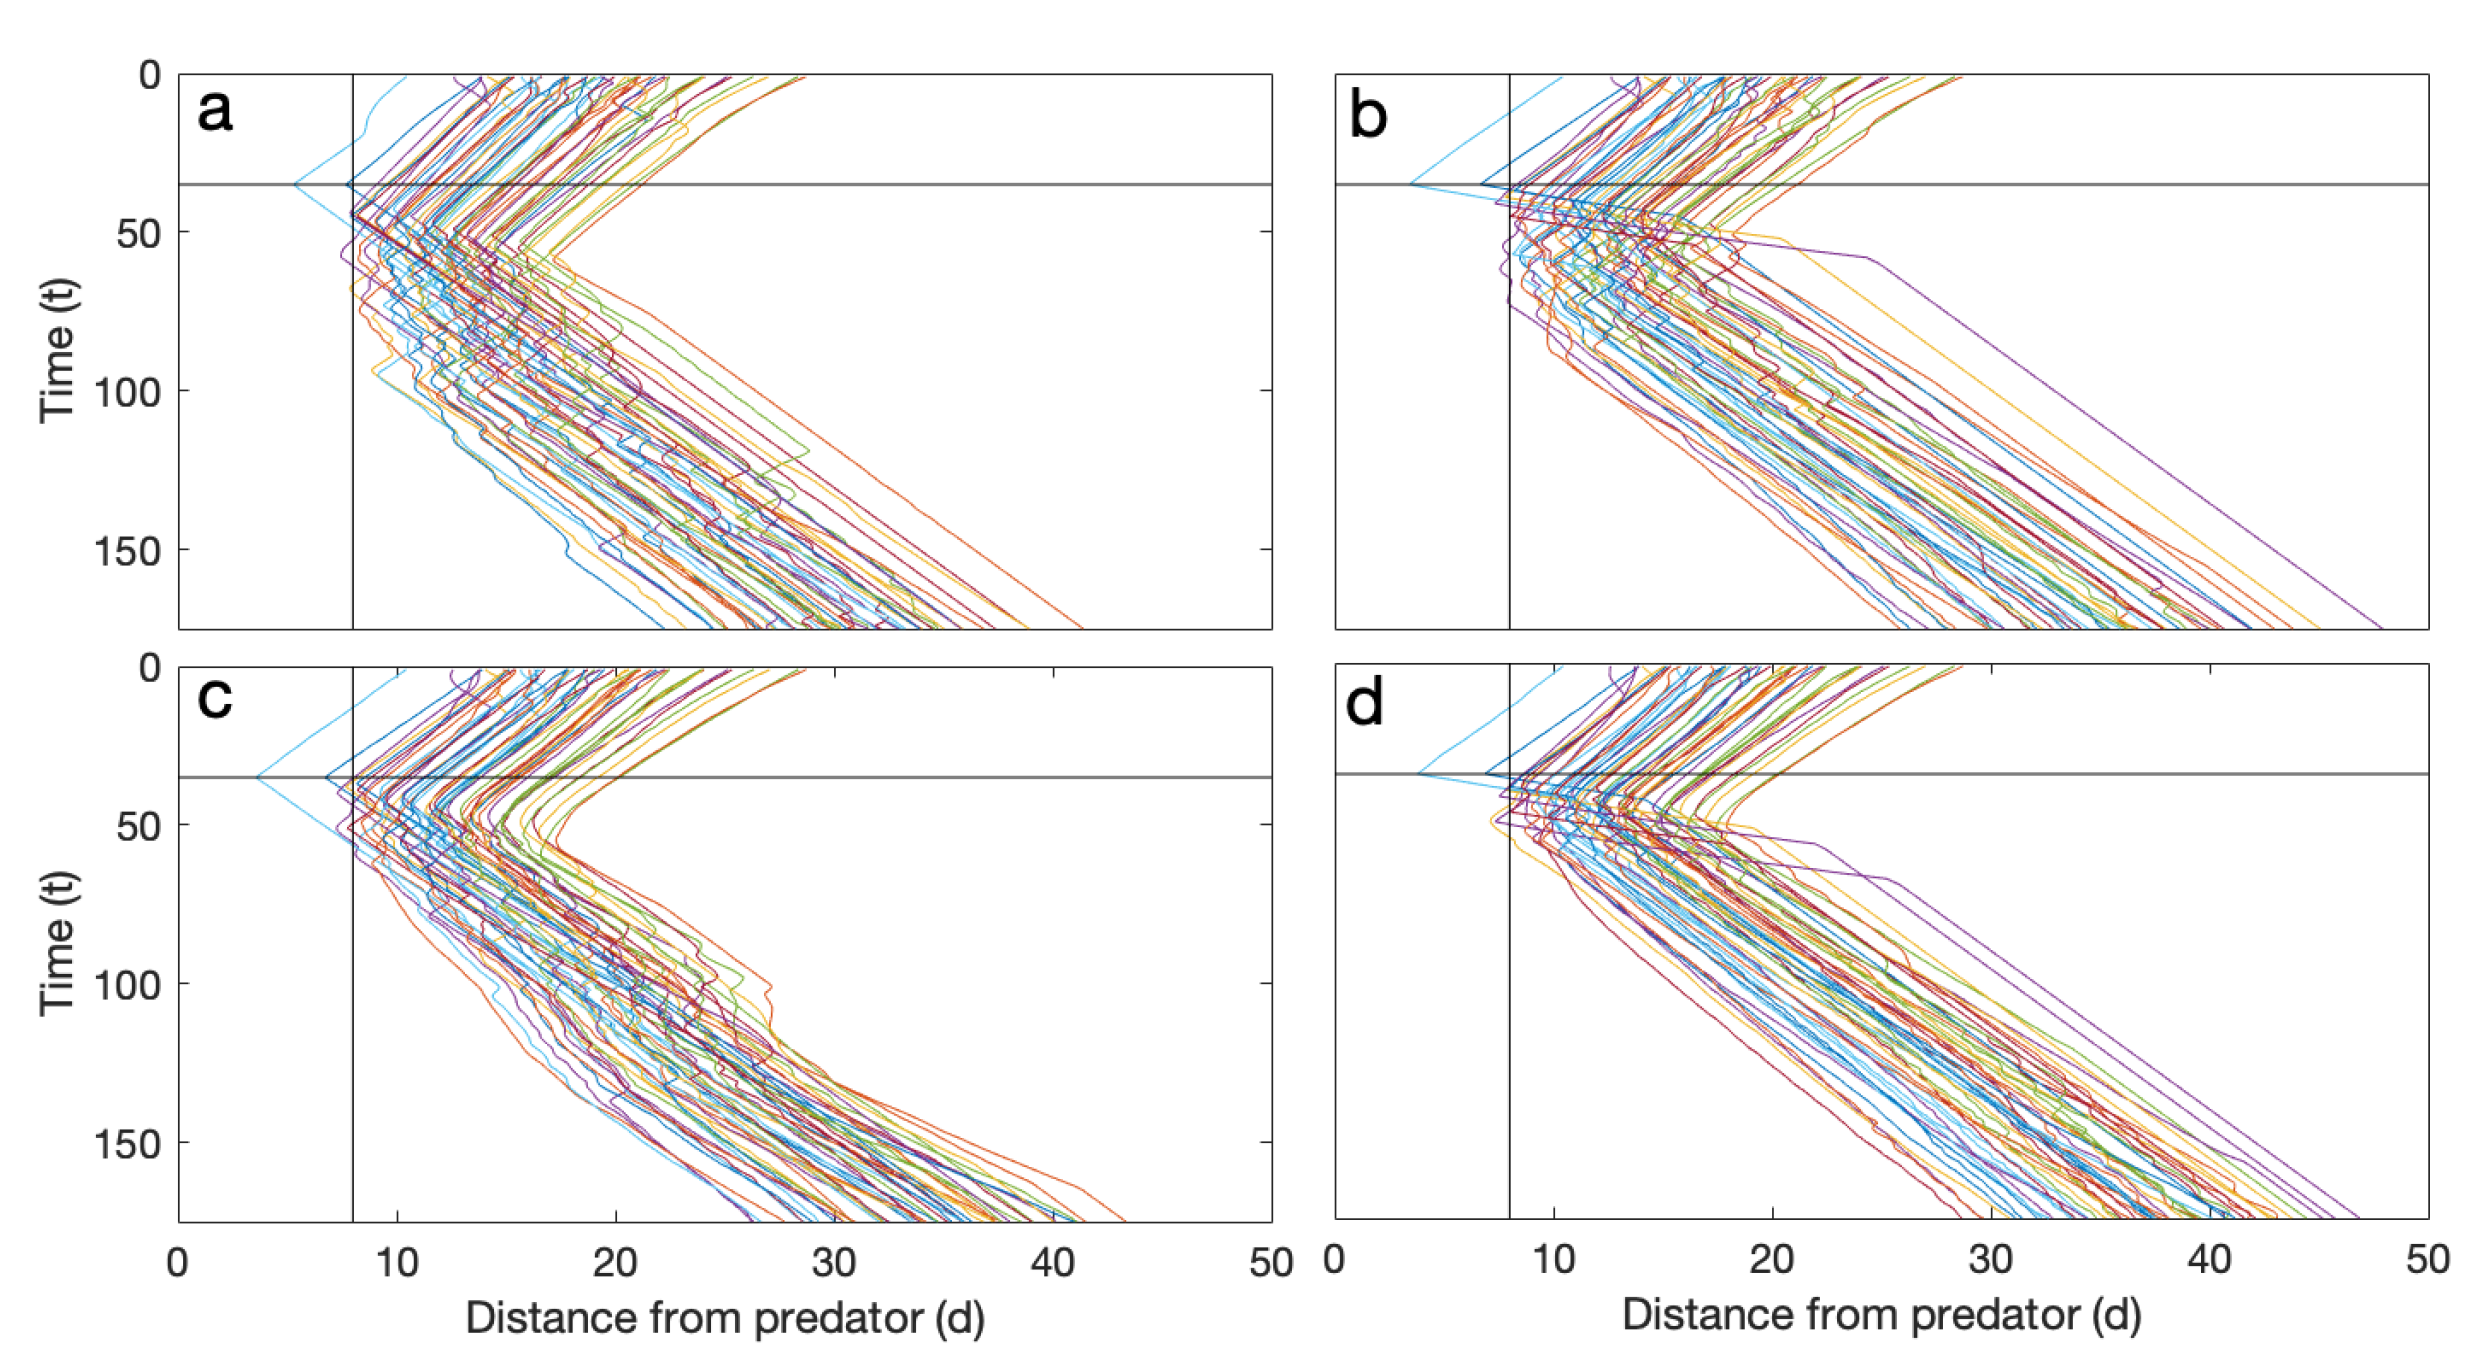
- The arc distance between an individual particle i and the predator point at time t, which we denote by . is calculated as the length of circular arc between the angle of the predator point and the angle of particle i at time t, with radius equal to the Euclidean distance from fish i’s coordinates at time t to the center of the annular region ;
- 2.
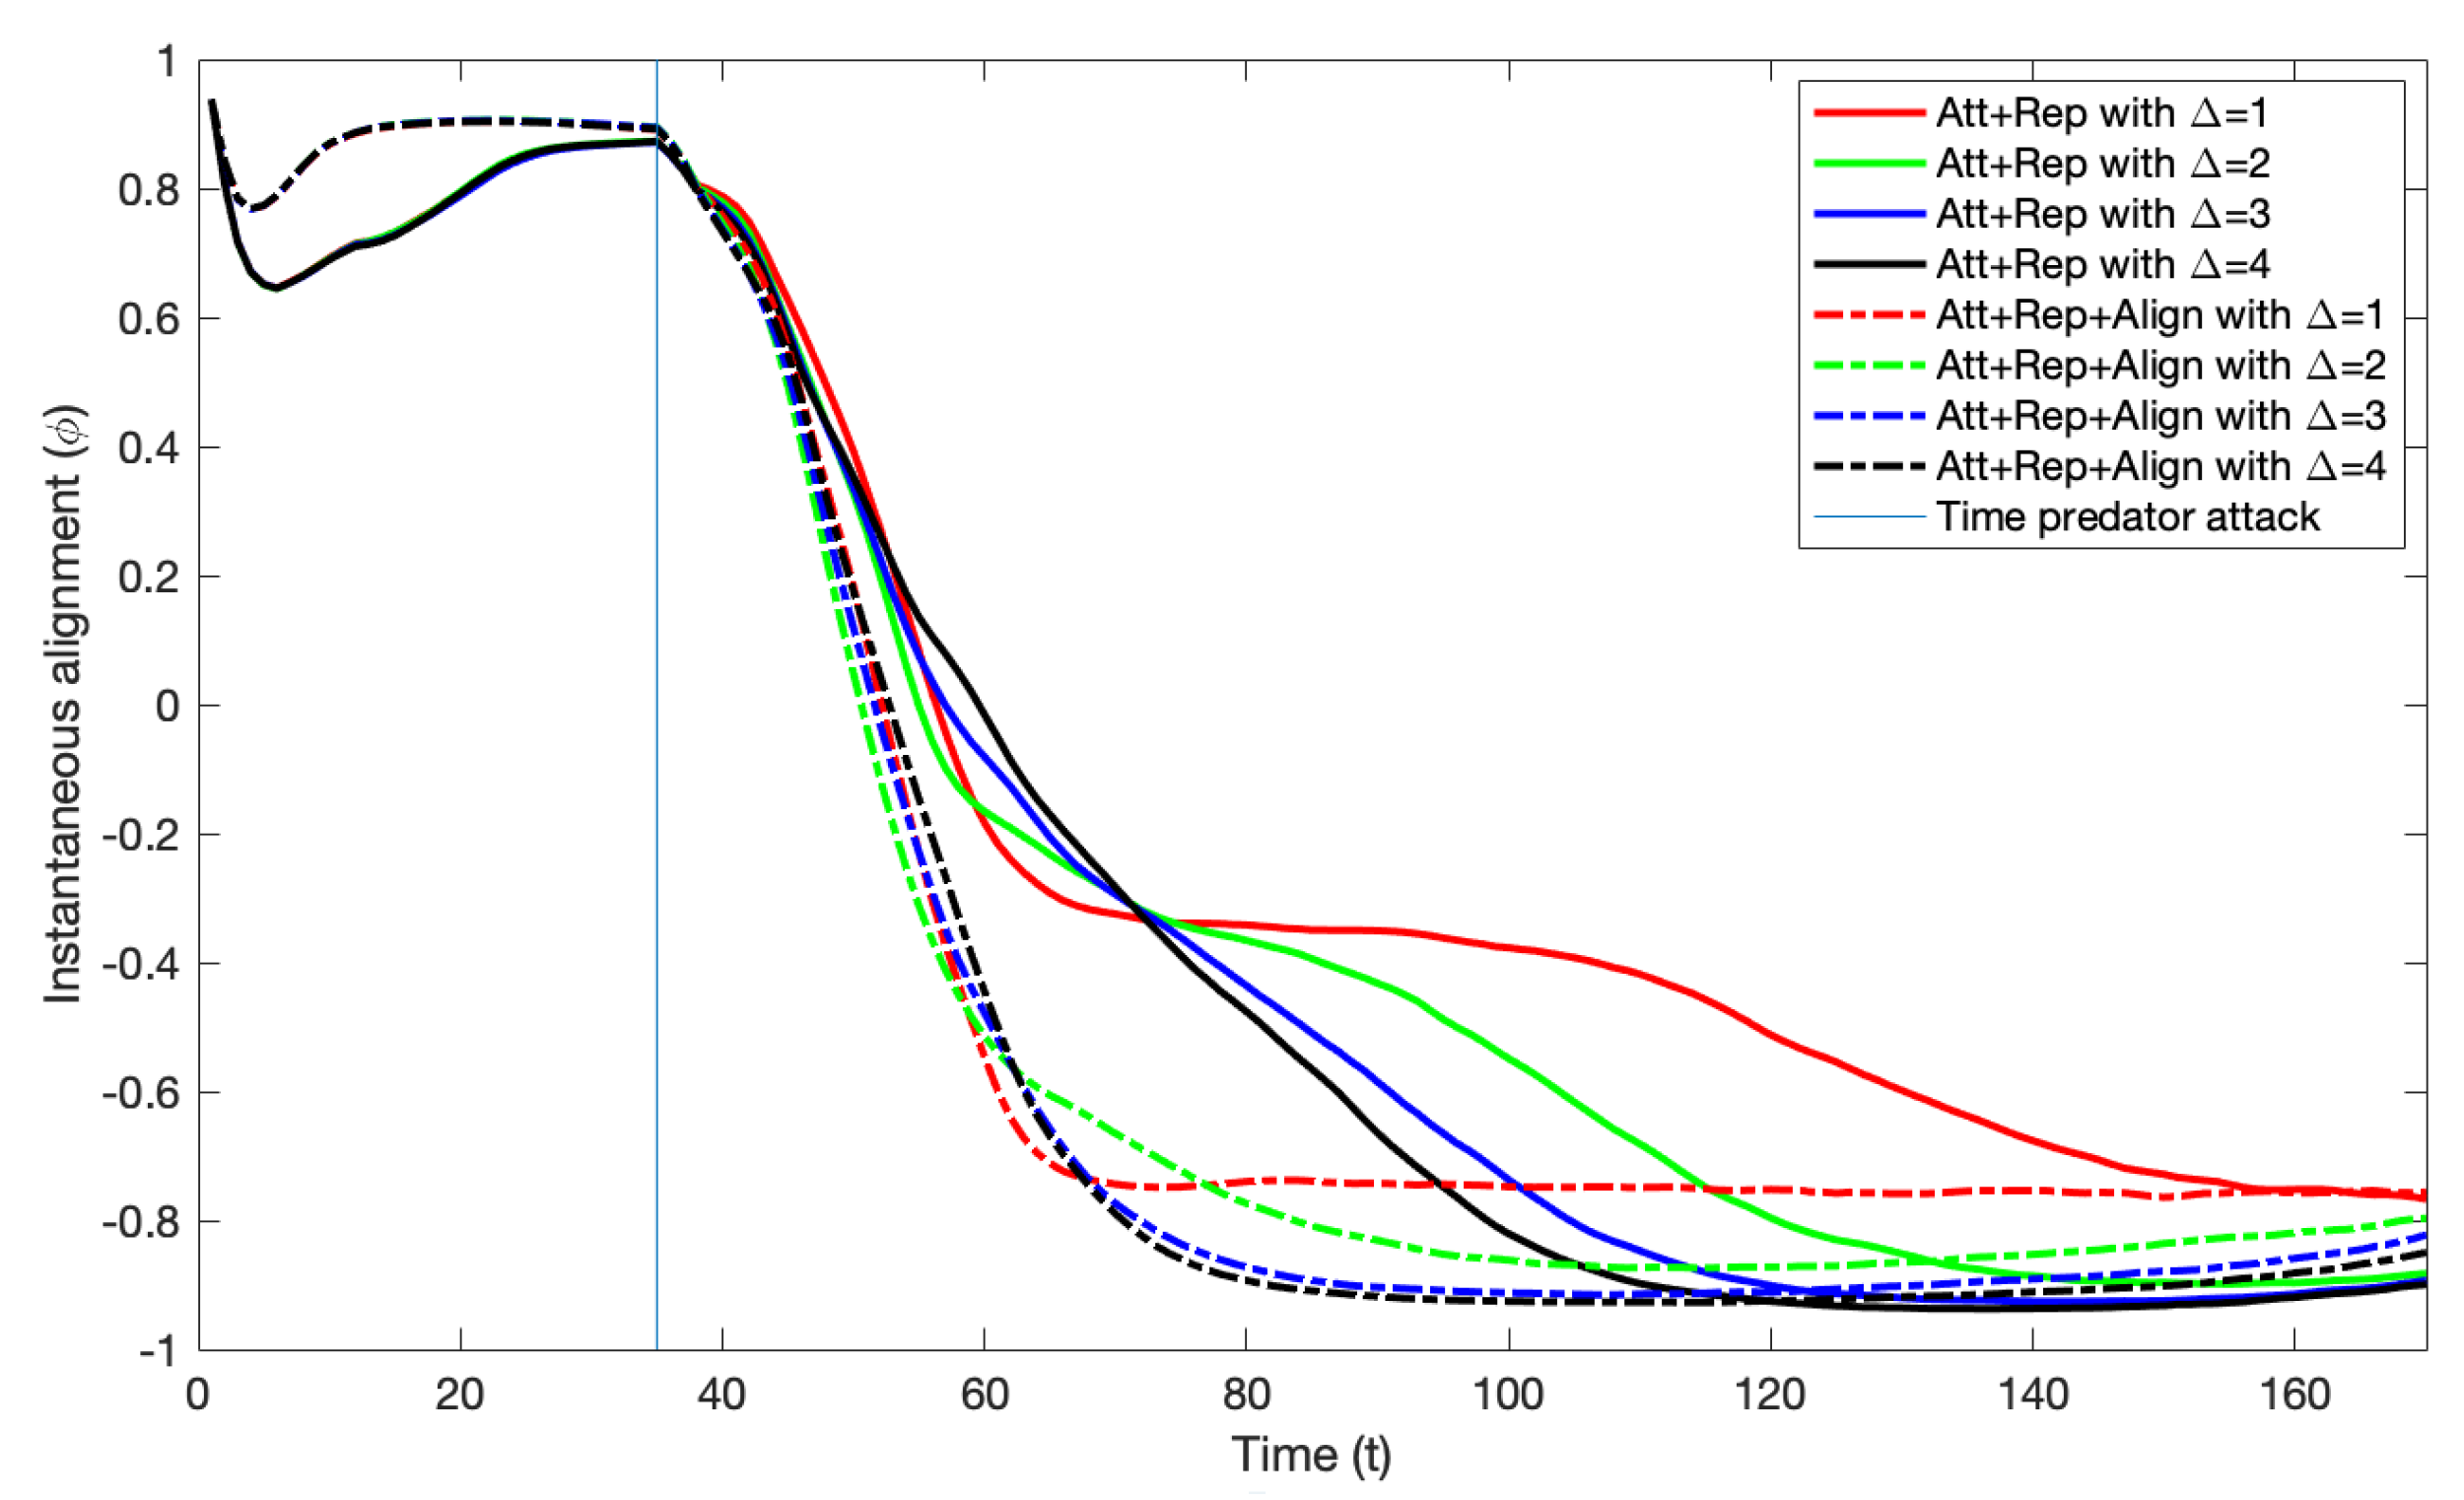
- The instantaneous alignment of the group at time t () can be used to determine whether the group is moving clockwise (CW) or counterclockwise (CCW) in the annular region. It is calculated by first calculating the relative orientation of each particle i at time t via , where is the angle of the particle and is the angle of the annular region radius going through the particle position at time t. if the particle is moving CW and if it is moving CCW. The instantaneous alignment of the group at time t is then calculated as the average of the relative orientations of all the N particles at time t through
2.2. Simulations
3. Results
4. Discussion
Supplementary Materials
Author Contributions
Funding
Data Availability Statement
Conflicts of Interest
Abbreviation
| spp | self-propelled particle |
References
- Camazine, S.; Deneubourg, J.L.; Franks, N.R.; Sneyd, J.; Theraula, G.; Bonabeau, E. Self-Organization in Biological Systems; Princeton University Press: Princeton, NJ, USA, 2001. [Google Scholar]
- Sumpter, D.J.T. Collective Animal B; Princeton University Press: Princeton, NJ, USA, 2010. [Google Scholar]
- Shaw, E. Schooling fishes: The school, a truly egalitarian form of organization in which all members of the group are alike in influence, offers substantial benefits to its participants. Am. Sci. 1978, 66, 166–175. [Google Scholar]
- Heppner, F.H. Avian flight formations. Bird-Banding 1974, 45, 160–169. [Google Scholar] [CrossRef]
- Ward, A.; Webster, M. Sociality: The Behaviour of Group-Living Animals; Springer: Berlin/Heidelberg, Germany, 2016. [Google Scholar]
- Herbert-Read, J.E. Understanding how animal groups achieve coordinated movement. J. Exp. Biol. 2016, 219, 2971–2983. [Google Scholar] [CrossRef]
- Ward, A.J.; Herbert-Read, J.E.; Sumpter, D.J.; Krause, J. Fast and accurate decisions through collective vigilance in fish shoals. Proc. Natl. Acad. Sci. USA 2011, 108, 2312–2315. [Google Scholar] [CrossRef]
- Flack, A.; Nagy, M.; Fiedler, W.; Couzin, I.D.; Wikelski, M. From local collective behavior to global migratory patterns in white storks. Science 2018, 360, 911–914. [Google Scholar] [CrossRef]
- Couzin, I.D. Collective animal migration. Curr. Biol. 2018, 28, R976–R980. [Google Scholar] [CrossRef]
- Evans, J.C.; Torney, C.J.; Votier, S.C.; Dall, S.R. Social information use and collective foraging in a pursuit diving seabird. PLoS ONE 2019, 14, e0222600. [Google Scholar] [CrossRef]
- Procaccini, A.; Orlandi, A.; Cavagna, A.; Giardina, I.; Zoratto, F.; Santucci, D.; Chiarotti, F.; Hemelrijk, C.K.; Alleva, E.; Parisi, G.; et al. Propagating waves in starling, Sturnus vulgaris, flocks under predation. Anim. Behav. 2011, 82, 759–765. [Google Scholar] [CrossRef]
- Sumpter, D.; Buhl, J.; Biro, D.; Couzin, I. Information transfer in moving animal groups. Theory Biosci. 2008, 127, 177–186. [Google Scholar] [CrossRef]
- Beauchamp, G. Flock size and density influence speed of escape waves in semipalmated sandpipers. Anim. Behav. 2012, 83, 1125–1129. [Google Scholar] [CrossRef]
- Radakov, D.V. Schooling in the Ecology of Fish; John Wiley & Sons: Hoboken, NJ, USA, 1973. [Google Scholar]
- Marras, S.; Batty, R.S.; Domenici, P. Information transfer and antipredator maneuvers in schooling herring. Adapt. Behav. 2012, 20, 44–56. [Google Scholar] [CrossRef]
- Herbert-Read, J.E.; Buhl, J.; Hu, F.; Ward, A.J.; Sumpter, D.J. Initiation and spread of escape waves within animal groups. R. Soc. Open Sci. 2015, 2, 140355. [Google Scholar] [CrossRef]
- Treherne, J.E.; Foster, W.A. Group transmission of predator avoidance behaviour in a marine insect: The Trafalgar effect. Anim. Behav. 1981, 29, 911–917. [Google Scholar] [CrossRef]
- Aoki, I. A simulation study on the schooling mechanism in fish. Bull. Jpn. Soc. Fish. 1982, 48, 1081–1088. [Google Scholar] [CrossRef]
- Huth, A.; Wissel, C. The simulation of the movement of fish schools. J. Theor. Biol. 1992, 156, 365–385. [Google Scholar] [CrossRef]
- Couzin, I.D.; Krause, J.; James, R.; Ruxton, G.D.; Franks, N.R. Collective memory and spatial sorting in animal groups. J. Theor. Biol. 2002, 218, 1–11. [Google Scholar] [CrossRef] [PubMed]
- Vicsek, T.; Zafeiris, A. Collective motion. Phys. Rep. 2012, 517, 71–140. [Google Scholar] [CrossRef]
- Reynolds, C.W. Flocks, herds and schools: A distributed behavioral model. Siggraph Comput. Graph 1987, 21, 25–34. [Google Scholar] [CrossRef]
- D’Orsogna, M.R.; Chuang, Y.L.; Bertozzi, A.L.; Chayes, L.S. Self-propelled particles with soft-core interactions: Patterns, stability, and collapse. Phys. Rev. Lett. 2006, 96, 104302. [Google Scholar] [CrossRef]
- Romenskyy, M.; Herbert-Read, J.E.; Ward, A.J.; Sumpter, D.J. Body size affects the strength of social interactions and spatial organization of a schooling fish (Pseudomugil signifer). Open Sci. 2017, 4, 161056. [Google Scholar] [CrossRef]
- Cambui, D.S. Collective behavior states in animal groups. Mod. Phys. Lett. B 2017, 31, 1750054. [Google Scholar] [CrossRef]
- Newman, J.P.; Sayama, H. Effect of sensory blind zones on milling behavior in a dynamic self-propelled particle model. Phys. Rev. E 2008, 78, 011913. [Google Scholar] [CrossRef] [PubMed]
- Couzin, I.D.; Krause, J.; Franks, N.R.; Levin, S.A. Effective leadership and decision-making in animal groups on the move. Nature 2005, 433, 513–516. [Google Scholar] [CrossRef] [PubMed]
- Papadopoulou, M.; Hildenbrandt, H.; Sankey, D.W.; Portugal, S.J.; Hemelrijk, C.K. Emergence of splits and collective turns in pigeon flocks under predation. R. Soc. Open Sci. 2022, 9, 211898. [Google Scholar] [CrossRef]
- Papadopoulou, M.; Hildenbrandt, H.; Sankey, D.W.; Portugal, S.J.; Hemelrijk, C.K. Self-organization of collective escape in pigeon flocks. PLoS Comput. Biol. 2022, 18, e1009772. [Google Scholar] [CrossRef]
- Hemelrijk, C.K.; van Zuidam, L.; Hildenbrandt, H. What underlies waves of agitation in starling flocks. Behav. Ecol. Sociobiol. 2015, 69, 755–764. [Google Scholar] [CrossRef] [PubMed]
- Hildenbrandt, H.; Carere, C.; Hemelrijk, C.K. Self-organized aerial displays of thousands of starlings: A model. Behav. Ecol. 2010, 21, 1349–1359. [Google Scholar] [CrossRef]
- Inada, Y.; Kawachi, K. Order and flexibility in the motion of fish schools. J. Theor. Biol. 2002, 214, 371–387. [Google Scholar] [CrossRef]
- Herbert-Read, J.E.; Perna, A.; Mann, R.P.; Schaerf, T.M.; Sumpter, D.J.; Ward, A.J. Inferring the rules of interaction of shoaling fish. Proc. Natl. Acad. Sci. USA 2011, 108, 18726–18731. [Google Scholar] [CrossRef]
- Katz, Y.; Tunstrøm, K.; Ioannou, C.C.; Huepe, C.; Couzin, I.D. Inferring the structure and dynamics of interactions in schooling fish. Proc. Natl. Acad. Sci. USA 2011, 108, 18720–18725. [Google Scholar] [CrossRef]
- Romanczuk, P.; Couzin, I.D.; Schimansky-Geier, L. Collective motion due to individual escape and pursuit response. Phys. Rev. Lett. 2009, 102, 010602. [Google Scholar] [CrossRef] [PubMed]
- Strömbom, D. Collective motion from local attraction. J. Theor. Biol. 2011, 283, 145–151. [Google Scholar] [CrossRef] [PubMed]
- Ferrante, E.; Turgut, A.E.; Dorigo, M.; Huepe, C. Elasticity-based mechanism for the collective motion of self-propelled particles with springlike interactions: A model system for natural and artificial swarms. Phys. Rev. Lett. 2013, 111, 268302. [Google Scholar] [CrossRef] [PubMed]
- Barberis, L.; Peruani, F. Large-scale patterns in a minimal cognitive flocking model: Incidental leaders, nematic patterns, and aggregates. Phys. Rev. Lett. 2016, 117, 248001. [Google Scholar] [CrossRef]
- Strömbom, D.; Hassan, T.; Hunter Greis, W.; Antia, A. Asynchrony induces polarization in attraction-based models of collective motion. R. Soc. Open Sci. 2019, 6, 190381. [Google Scholar] [CrossRef]
- Strömbom, D.; Antia, A. Anticipation induces polarized collective motion in attraction based models. Northeast. J. Complex Syst. (NEJCS) 2021, 3, 2. [Google Scholar] [CrossRef]
- Strömbom, D.; Tulevech, G. Attraction vs. alignment as drivers of collective motion. Front. Appl. Math. Stat. 2022, 7, 717523. [Google Scholar] [CrossRef]
- Strömbom, D.; Nickerson, S.; Futterman, C.; DiFazio, A.; Costello, C.; Tunstrøm, K. Bistability and switching behavior in moving animal groups. Northeast. J. Complex Syst. (NEJCS) 2022, 4, 1. [Google Scholar] [CrossRef]
- Strömbom, D.; Tulevech, G.; Giunta, R.; Cullen, Z. Asymmetric Interactions Induce Bistability and Switching Behavior in Models of Collective Motion. Dynamics 2022, 2, 462–472. [Google Scholar] [CrossRef]
- Strömbom, D.; Siljestam, M.; Park, J.; Sumpter, D.J. The shape and dynamics of local attraction. Eur. Phys. J. Spec. Top. 2015, 224, 3311–3323. [Google Scholar] [CrossRef]
- Tunstrøm, K.; Katz, Y.; Ioannou, C.C.; Huepe, C.; Lutz, M.J.; Couzin, I.D. Collective states, multistability and transitional behavior in schooling fish. PLoS Comput. Biol. 2013, 9, e1002915. [Google Scholar] [CrossRef] [PubMed]
- Gautrais, J.; Ginelli, F.; Fournier, R.; Blanco, S.; Soria, M.; Chaté, H.; Theraulaz, G. Deciphering interactions in moving animal groups. PLoS Comput. Biol. 2012, 8, e1002678. [Google Scholar] [CrossRef] [PubMed]
- Michaelsen, T.C.; Byrkjedal, I. ’Magic carpet’ flight in shorebirds attacked by raptors on a migrational stopover site. Ardea 2002, 90, 167–171. [Google Scholar]
- O’Brien, D. Description of escape responses of krill (Crustacea: Euphausiacea), with particular reference to swarming behavior and the size and proximity of the predator. J. Crustac. Biol. 1987, 7, 449–457. [Google Scholar] [CrossRef]
- Mann, R.P. Bayesian inference for identifying interaction rules in moving animal groups. PLoS ONE 2011, 6, e22827. [Google Scholar] [CrossRef]


| Att + Rep | 0.6527 | 0.8728 | 0.9483 | 0.9736 |
| Att + Rep + Align | 0.9713 | 0.9744 | 0.9907 | 0.9945 |
Disclaimer/Publisher’s Note: The statements, opinions and data contained in all publications are solely those of the individual author(s) and contributor(s) and not of MDPI and/or the editor(s). MDPI and/or the editor(s) disclaim responsibility for any injury to people or property resulting from any ideas, methods, instructions or products referred to in the content. |
© 2023 by the authors. Licensee MDPI, Basel, Switzerland. This article is an open access article distributed under the terms and conditions of the Creative Commons Attribution (CC BY) license (https://creativecommons.org/licenses/by/4.0/).
Share and Cite
Strömbom, D.; Futterman, C. An Alignment-Free Explanation for Collective Predator Evasion in Moving Animal Groups. Dynamics 2023, 3, 793-802. https://doi.org/10.3390/dynamics3040043
Strömbom D, Futterman C. An Alignment-Free Explanation for Collective Predator Evasion in Moving Animal Groups. Dynamics. 2023; 3(4):793-802. https://doi.org/10.3390/dynamics3040043
Chicago/Turabian StyleStrömbom, Daniel, and Catherine Futterman. 2023. "An Alignment-Free Explanation for Collective Predator Evasion in Moving Animal Groups" Dynamics 3, no. 4: 793-802. https://doi.org/10.3390/dynamics3040043