Article

Biomechanical Upper Limb Model for Postural Tremor Absorber Design

1
Lab Navier, ENPC, CNRS, Université Gustave Eiffel, F-77447 Marne-la-Vallée, France
2
SDM Research Group, International University of Beirut BIU, Beirut 146404, Lebanon
3
Mechanical Department, Lebanese International University LIU, Bekaa 1803, Lebanon
4
Faculté de Médecine, Institut du Cerveau et de la Moëlle Épinière, Sorbonne Université, UMR S 1127, Inserm U 1127, UMR CNRS 7225, F-75013 Paris, France
5
Département de Neurologie, Hôpital Pitié-Salpêtrière, AP-HP, F-75013 Paris, France
*
Author to whom correspondence should be addressed.
Dynamics 2022, 2(3), 234-251; https://doi.org/10.3390/dynamics2030012
Submission received: 20 April 2022 / Revised: 24 July 2022 / Accepted: 26 July 2022 / Published: 1 August 2022

Abstract

:
The current work promotes the use of non-invasive devices for reducing involuntary tremor of human upper limb. It concentrates on building up an upper limb model used to reflect the measured tremor signal and is suitable for the design of a passive vibration controller. A dynamic model of the upper limb is excited by the measured electromyography signal scaled to reach the wrist joint angular displacement measured by an inertial measurement unit for a patient with postural tremor. A passive tuned-mass-damper (TMD) placed on the hand is designed as a stainless-steel beam with a length of 91 mm and a cross-sectional diameter of 0.79 mm, holding a mass of 14.13 g. The damping ratio and mass position of the TMD are optimized numerically. The fundamental frequency of the TMD is derived and validated experimentally through measurements for different mass positions, with a relative error of 0.65%. The modal damping ratio of the beam is identified experimentally as 0.14% and increases to 0.26–0.46% after adding the mass at different positions. The optimized three TMDs reduce 97.4% of the critical amplitude of the power spectral density at the wrist joint.

1. Introduction

Modeling of the upper limb is gaining much attention in the fields of biomechanical engineering [1]. It can be used to solve problems in the neurological research domain [2] and assist in problems related to musculoskeletal disorders and movement control [3,4]. Upper limb modeling can also serve to design and develop vibration absorbers used to reduce the essential tremor motion of the hand, which is one of the most frequent movement disorders [5].
Park et al. [6] reported the first linear three degrees-of-freedom (DOF) system to model the forearm and wrist and reflect the passive dynamics of a healthy person with experimental validation. They were the first to provide reliable and accurate quantitative impedance values for forearm and wrist motions. Chan et al. [7] characterized the multi-DOF relative motion of the hand-arm tremor with respect to the joint angular displacement. They used a tremor measurement system that provided reliable results in comparison to those obtained for rest, postural, and task-specific tremors measurements of 38 Parkinson’s disease (PD) patients.
The non-invasive devices are studied theoretically or experimentally to reduce the involuntary tremor as alternatives to treatments by medications or surgery [8] instead of applying electrical stimulations directly to the patient’s muscles, which can cause inaccurate motor control [9] and unnecessary discomfort [10]. Hashemi et al. [11] designed an experimental arm formed of two rigid links in the horizontal plane to reflect the rest hand position of a PD patient. Model parameters and passive muscle elements were chosen to obtain the natural frequency of the arm-linkage system within the known frequency range of rest tremor (RT). The system was excited near the fundamental frequency using a sinusoidal torque. The experimental results of the experimental arm manufactured with a 300 g passive tuned vibration absorber (TVA) were qualitatively similar to the numerical results. The absorber experimentally caused an 80% reduction in the angular displacement amplitude of the system in the frequency domain. Buki et al. [12] manufactured a forearm to have a natural frequency in the PD tremor frequency range, which was measured between 4.4 and 5.78 Hz using an inertial measurement unit (IMU). The arm was manufactured as an inertial rod and excited by a direct current motor. A 280 g passive Vib-bracelet tuned at the resonance frequency reduced the amplitude of the pronation-supination tremor at 4.75 Hz by 86%. Nonlinear controllers can be used to operate under a wide frequency bandwidth [13]. Gebai et al. [14] recently suggested the use of the non-smooth nonlinear energy sink (NES) to reduce the essential tremor of a modeled upper limb system. Gebai et al. [15] showed that the effective time of the previously mentioned NES increases with an increase in its mass, leading to a sudden reduction in the amplitude of the system due to the bifurcations.
Passive TMD might be useful for patients with mild or moderate essential tremor (postural or kinetic tremor) and is suggested as an alternative approach for pharmacological treatment, which failed to be efficient, and its risk–benefit ratio is against neurosurgical lesion. This study aims to prove the performance ability of a non-invasive and passive device in reducing the postural tremor (PT) at the hand of the patient. A simple design is a TMD is used to absorb the tremor’s vibrational energy. The TMD is modeled as a thin cantilever beam and a mass of an adjustable position along the beam, providing its operational frequency. The fundamental frequency of the absorber is derived using Dunkerley’s formula and validated experimentally through measurements done by using a vibrometer for different mass positions, while the damping ratio is also identified. The TMD is placed at the hand of a modeled upper limb system. The modeled system is excited using the extensor carpi radialis (ECR) muscle signal, measured by electromyography (EMG), for a patient with PT. PT signal of this patient was reproduced using an analytical formula. The damping ratio and mass position of the TMD is optimized numerically so that the flexion-extension angular motion of a modeled upper limb system is minimized. The percentage of reduction in the response of the modeled upper limb system is calculated to quantify its efficiency and to prove the importance of developing a wearable passive device used for involuntary tremor control.

2. Methods

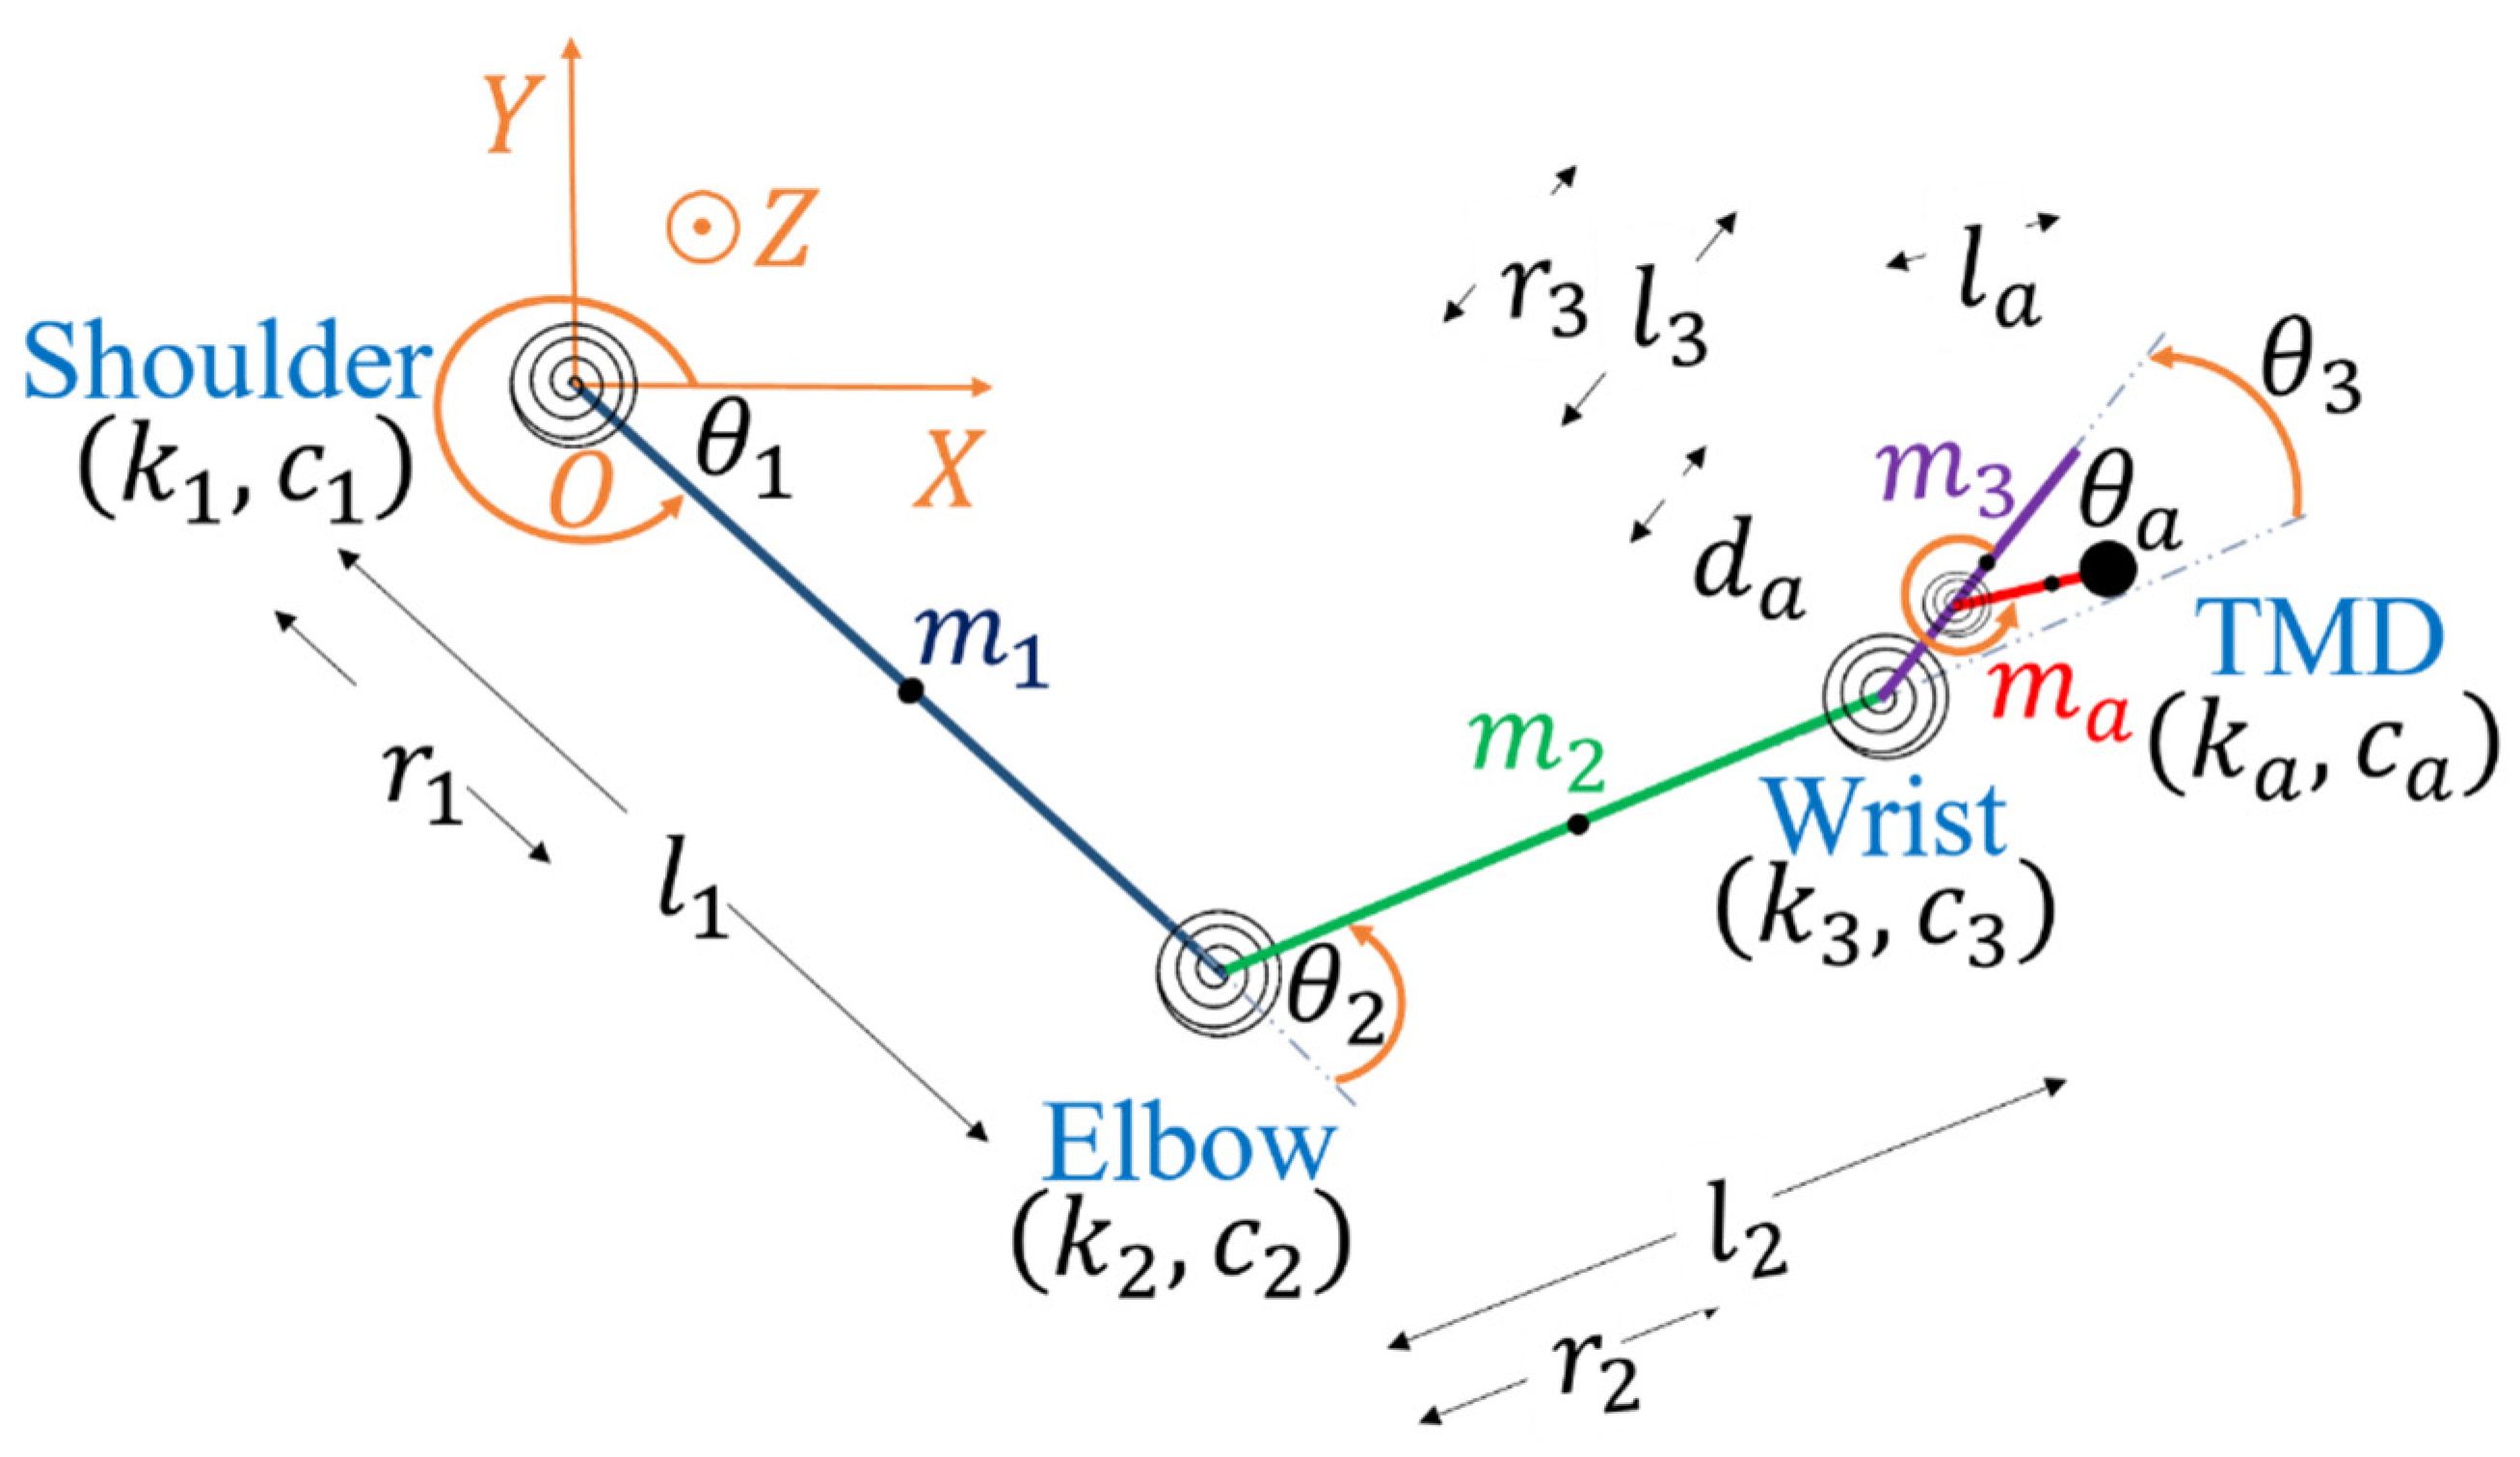
2.1. Biodynamic Hand Model

The human upper limb is modeled in the vertical plane as a system of three rigid bodies allowing the flexion-extension angular displacement motion at the shoulder ( θ 1 ), elbow ( θ 2 ), and wrist ( θ 3 ) joints, as shown in Figure 1. The rigid bodies are connected together by torsional springs to represent the internal passive torque of the muscle T m and the system is excited by the ECR signal to represent the generated active torque T a . IMU measurements are used to specify the required amplitude of the responses for this biodynamic model. The three-DOF dynamic system, reflecting the skeleton of the upper limb, is used to simulate the motion of the PT. It is an extension of the model proposed by Jackson et al. [16] and Hirashima [17] by considering the motion of the wrist joint to increase from a two-DOF to a three-DOF model.
The upper limb parameters determined experimentally by Harless [18] were used as a reference to the anthropometric size of the body segment parameters [19,20,21]. The parameters of the upper limb segments listed in Table 1 represent the length l i and the centroid r i used directly, and the mass m i calculated from the density of each segment using the data provided by Harless [18]. The geometrical dimensions of the upper arm, ulna, and radius as truncated cones [22] are used to calculate their mass moment of inertia I i . The one, two, and three indices i are related to the upper arm, forearm, and hand, respectively.
The resistive torques of the muscles T m at the joints are modeled according to Jackson et al. [16] as:
T m = { T m 1 T m 2 T m 3 } T
where
T m i = Ψ ( 0.9 θ i + 0.1 Ω i )
θ i is the angular displacement at the joint index i due to flexion-extension motion, and Ω i is the angular velocity. Ψ is the parameter determining the size of the resistive torque, it ranges between 0.1–10 N·m/rad. The constant value of 5.74 N·m/rad found by Goddard et al. [23], which belongs to the range determined by Jackson et al. [16], is selected for the size of resistive torque Ψ used in this study. Another passive torque acting on the joint T g results from the gravitational potential energy due to the mass concentrated at the centroid of each segment [24], which is defined as:
T g = G θ
where θ = { θ 1 θ 2 θ 3 } T and
G = [ G 1 G 2 G 3 ]
so that
G 1 = G 2 g ( m 1 r 1 + m 2 l 1 + m 3 l 1 ) sin ( θ 1 ( 0 ) ) { 1 0 0 } G 2 = G 3 g ( m 2 r 2 + m 3 l 2 ) sin ( θ 1 ( 0 ) + θ 2 ( 0 ) ) { 1 1 0 } G 3 = g m 3 r 3 sin ( θ 1 ( 0 ) + θ 2 ( 0 ) + θ 3 ( 0 ) ) { 1 1 1 }
The resultant torque T r , is the difference between the active torque T a and total passive torque T p [25], written as:
T r = T a T p , T p = T m T g
where
T a = { T a 1 T a 2 T a 3 } T
T a 1 , T a 2 , and T a 3 are the active input torques of the muscles at the shoulder, elbow, and wrist joints, respectively. The active torques T a i at the joints are assumed to be the same and will be measured or modeled analytically.
Equations of motion describing the upper limb dynamics can be derived using the Lagrangian formalism [16]. For control strategy requirements, the dynamic equations of the human upper limb are linearized using the Taylor series multi-variable linearization method [26]. The linearized equation of motion in matrix form derived using the Lagrangian formulation for the system in Figure 1 is obtained:
M α = Δ T r ,   Δ T r = T r T r ( 0 )
where α is the angular acceleration at the joints of the system.
The mass moment of inertia matrix M is:
M = M 0 + M 1 cos ( θ 2 ( 0 ) ) + M 2 cos ( θ 2 ( 0 ) + θ 3 ( 0 ) ) + M 3 cos ( θ 3 ( 0 ) )
where
M 0 = [ M 11 M 12 M 13 M 21 M 22 M 23 M 31 M 32 M 33 ]
with
M 11 = ( I 1 + m 1 r 1 2 ) + ( I 2 + m 2 r 2 2 ) + ( I 3 + m 3 r 3 2 ) + m 2 l 1 2 + m 3 ( l 1 2 + l 2 2 ) M 12 = ( I 2 + m 2 r 2 2 ) + ( I 3 + m 3 r 3 2 ) + m 3 l 2 2 M 13 = ( I 3 + m 3 r 3 2 )
and
M 1 = l 1 ( m 2 r 2 + m 3 l 2 ) [ 2 1 0 1 0 0 0 0 0 ] ,   M 2 = m 3 l 1 r 3 [ 2 1 1 1 0 0 1 0 0 ] ,   M 2 = m 3 l 2 r 3 [ 2 2 1 2 2 1 1 1 0 ]
The natural frequencies f p , calculated for the upper limb are:
f p = { 0.75 1.93 4.01 }   Hz
and its damping ratios ζ p , reflecting an underdamped system, are:
ζ p = { 0.36 0.43 1.17 }   %

2.2. Patient Tremor Measurements

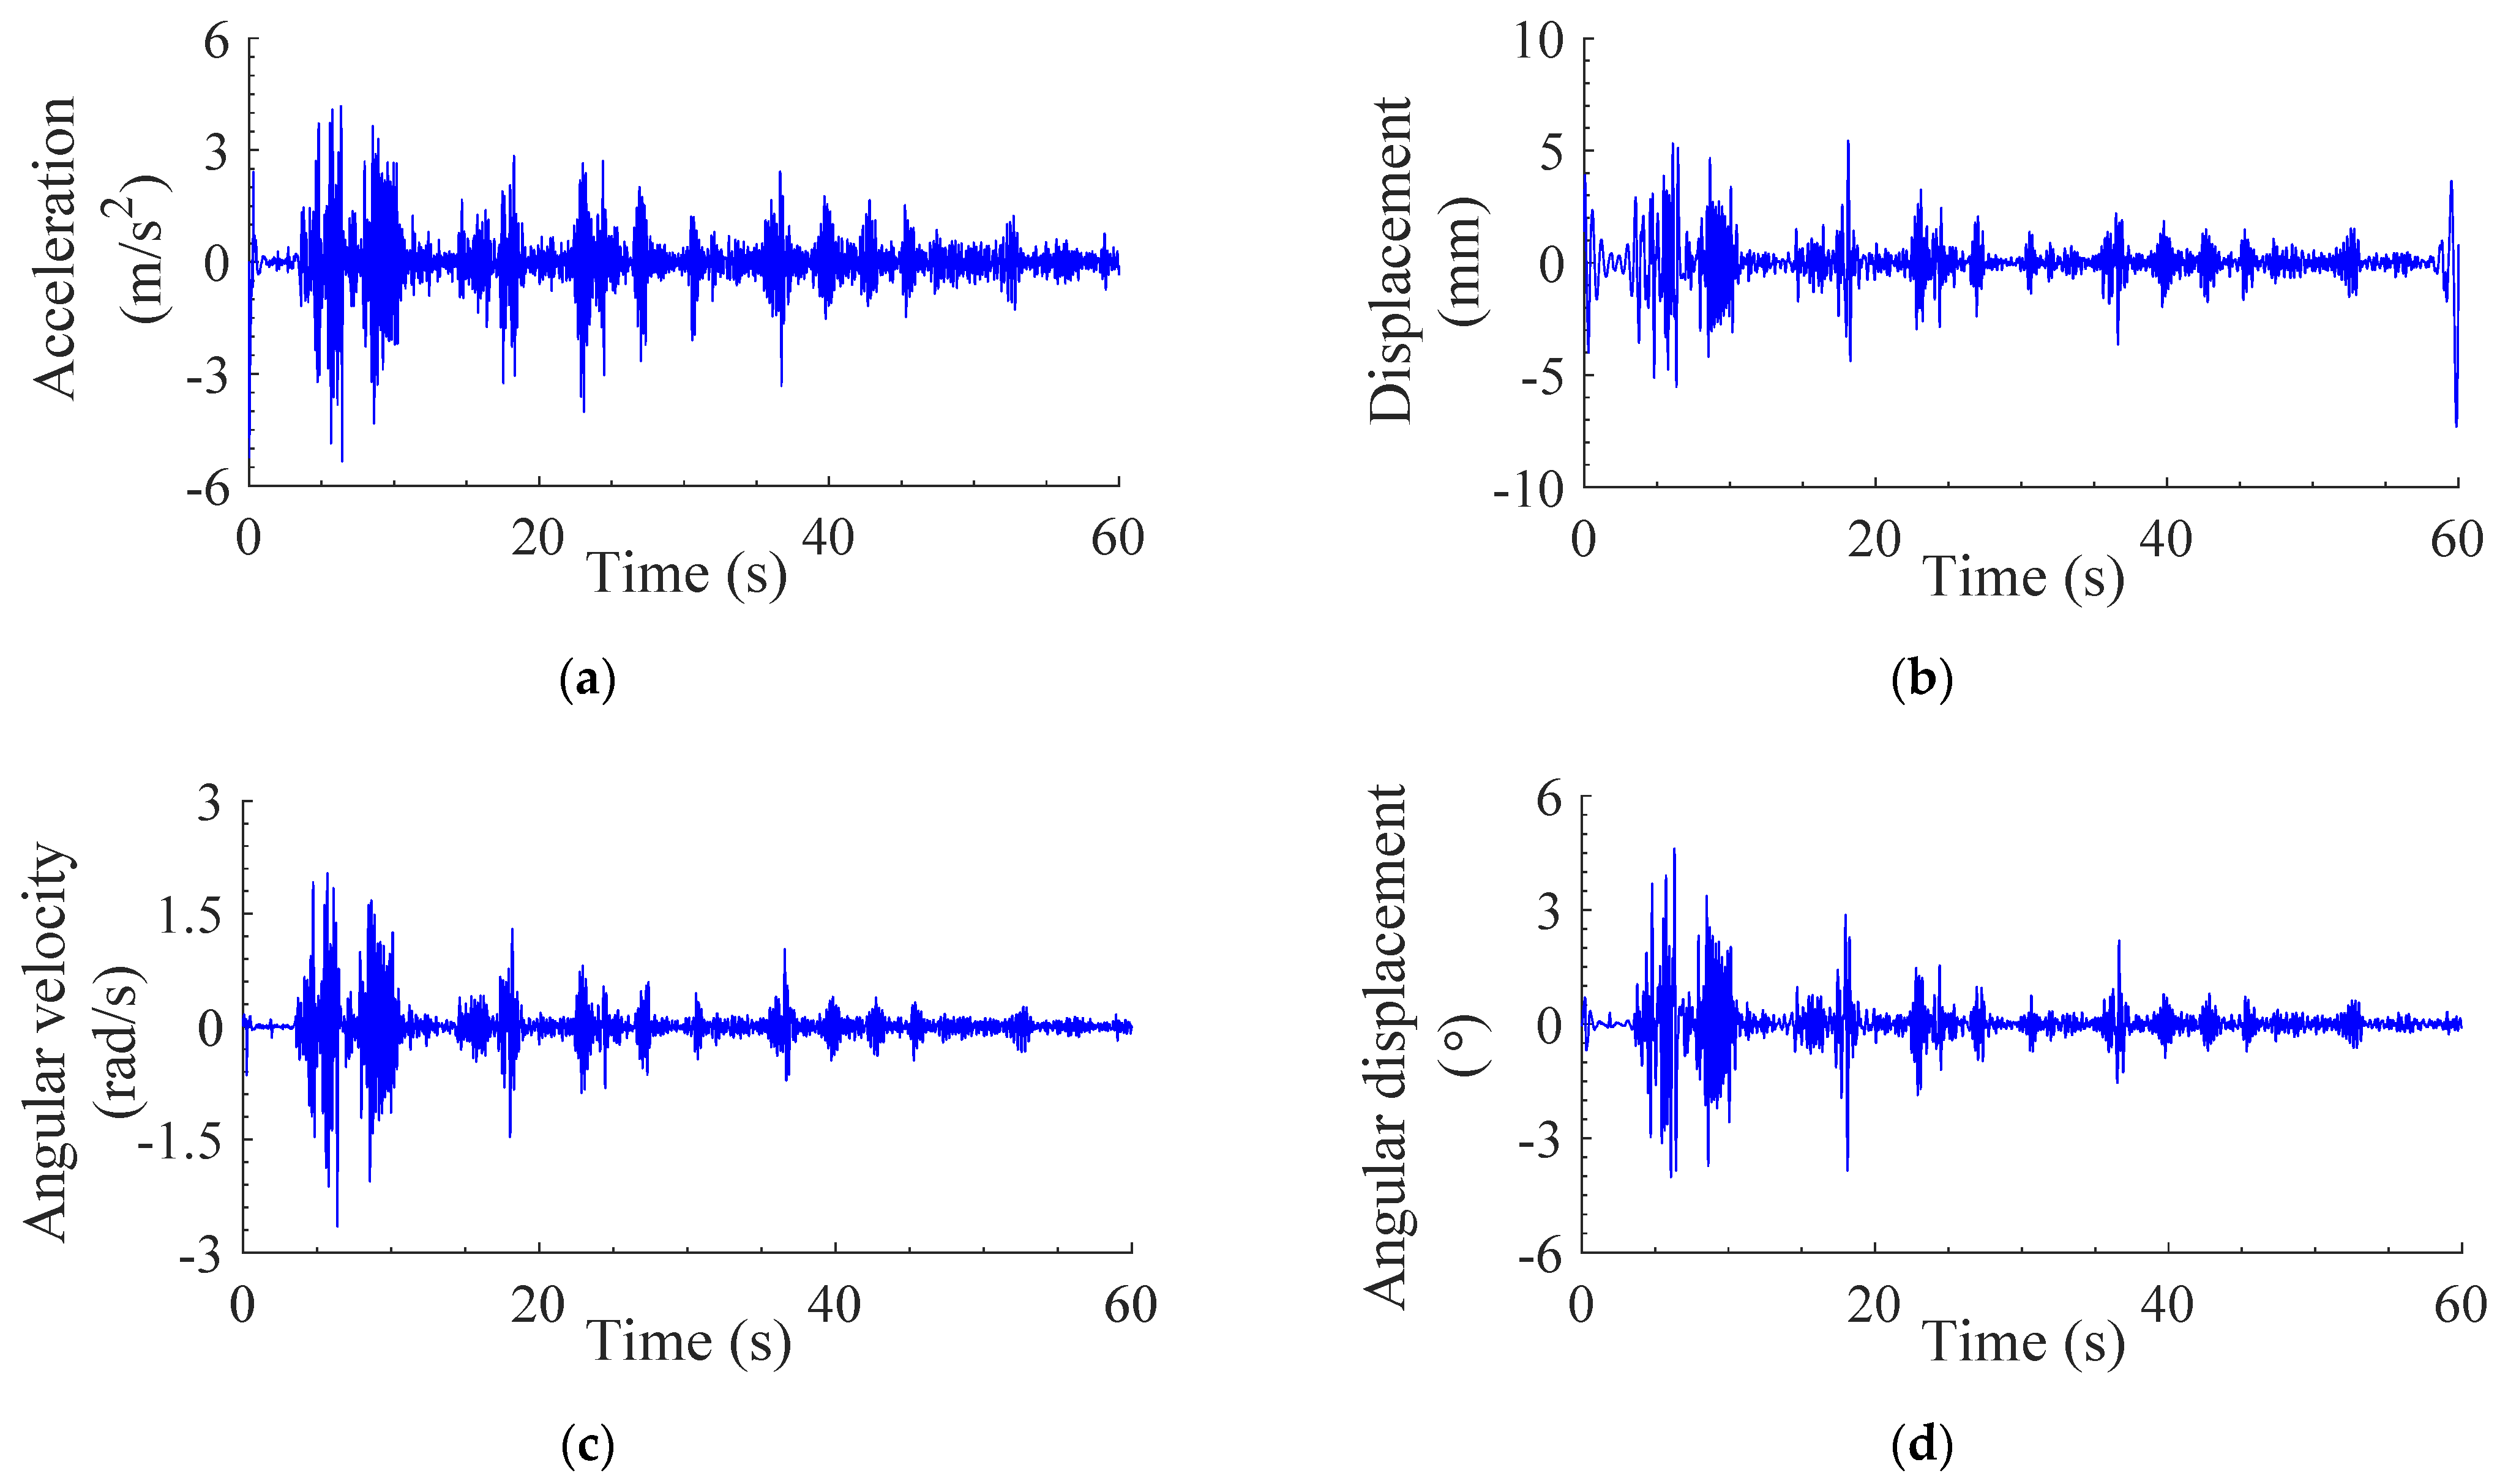
2.2.1. Acceleration and Angular Velocity

A 77-year-old patient, suffering from the essential tremor, provided voluntary informed consent to record measurement of the tremor signals in the department of neurology at Pitié-Salpêtrière Hospital (Paris) under the oversight from an ethics review board. Hikob Fox IMUs are used to measure the three-axis acceleration and three-axis angular velocity signals at the forearm and the hand of a patient during the postural position of his left upper limb, as shown in Figure 2. Measurements are repeated twice, where the results used in this study are those corresponding to signals with no disturbance due to hand drifts. The accelerometer and gyrometer of the IMU have ±2 g and ±500°/s measurement full-scale ranges with 12 mg and 17.5 m°/s resolutions, respectively. The tremor data of the patient are recorded for 60 s with a sampling frequency of 1.3 kHz for the acceleration and 800 Hz for the angular velocity. The acceleration and angular velocity signals were downsampled by a ratio of 25 and 16, respectively, to obtain a sampling frequency of 50 Hz. The upper limb in Figure 1 is designed to obtain the amplitudes of the flexion-extension angular displacement of the wrist joint within an acceptable range compared to those measured using the IMU.

2.2.2. Electromyography
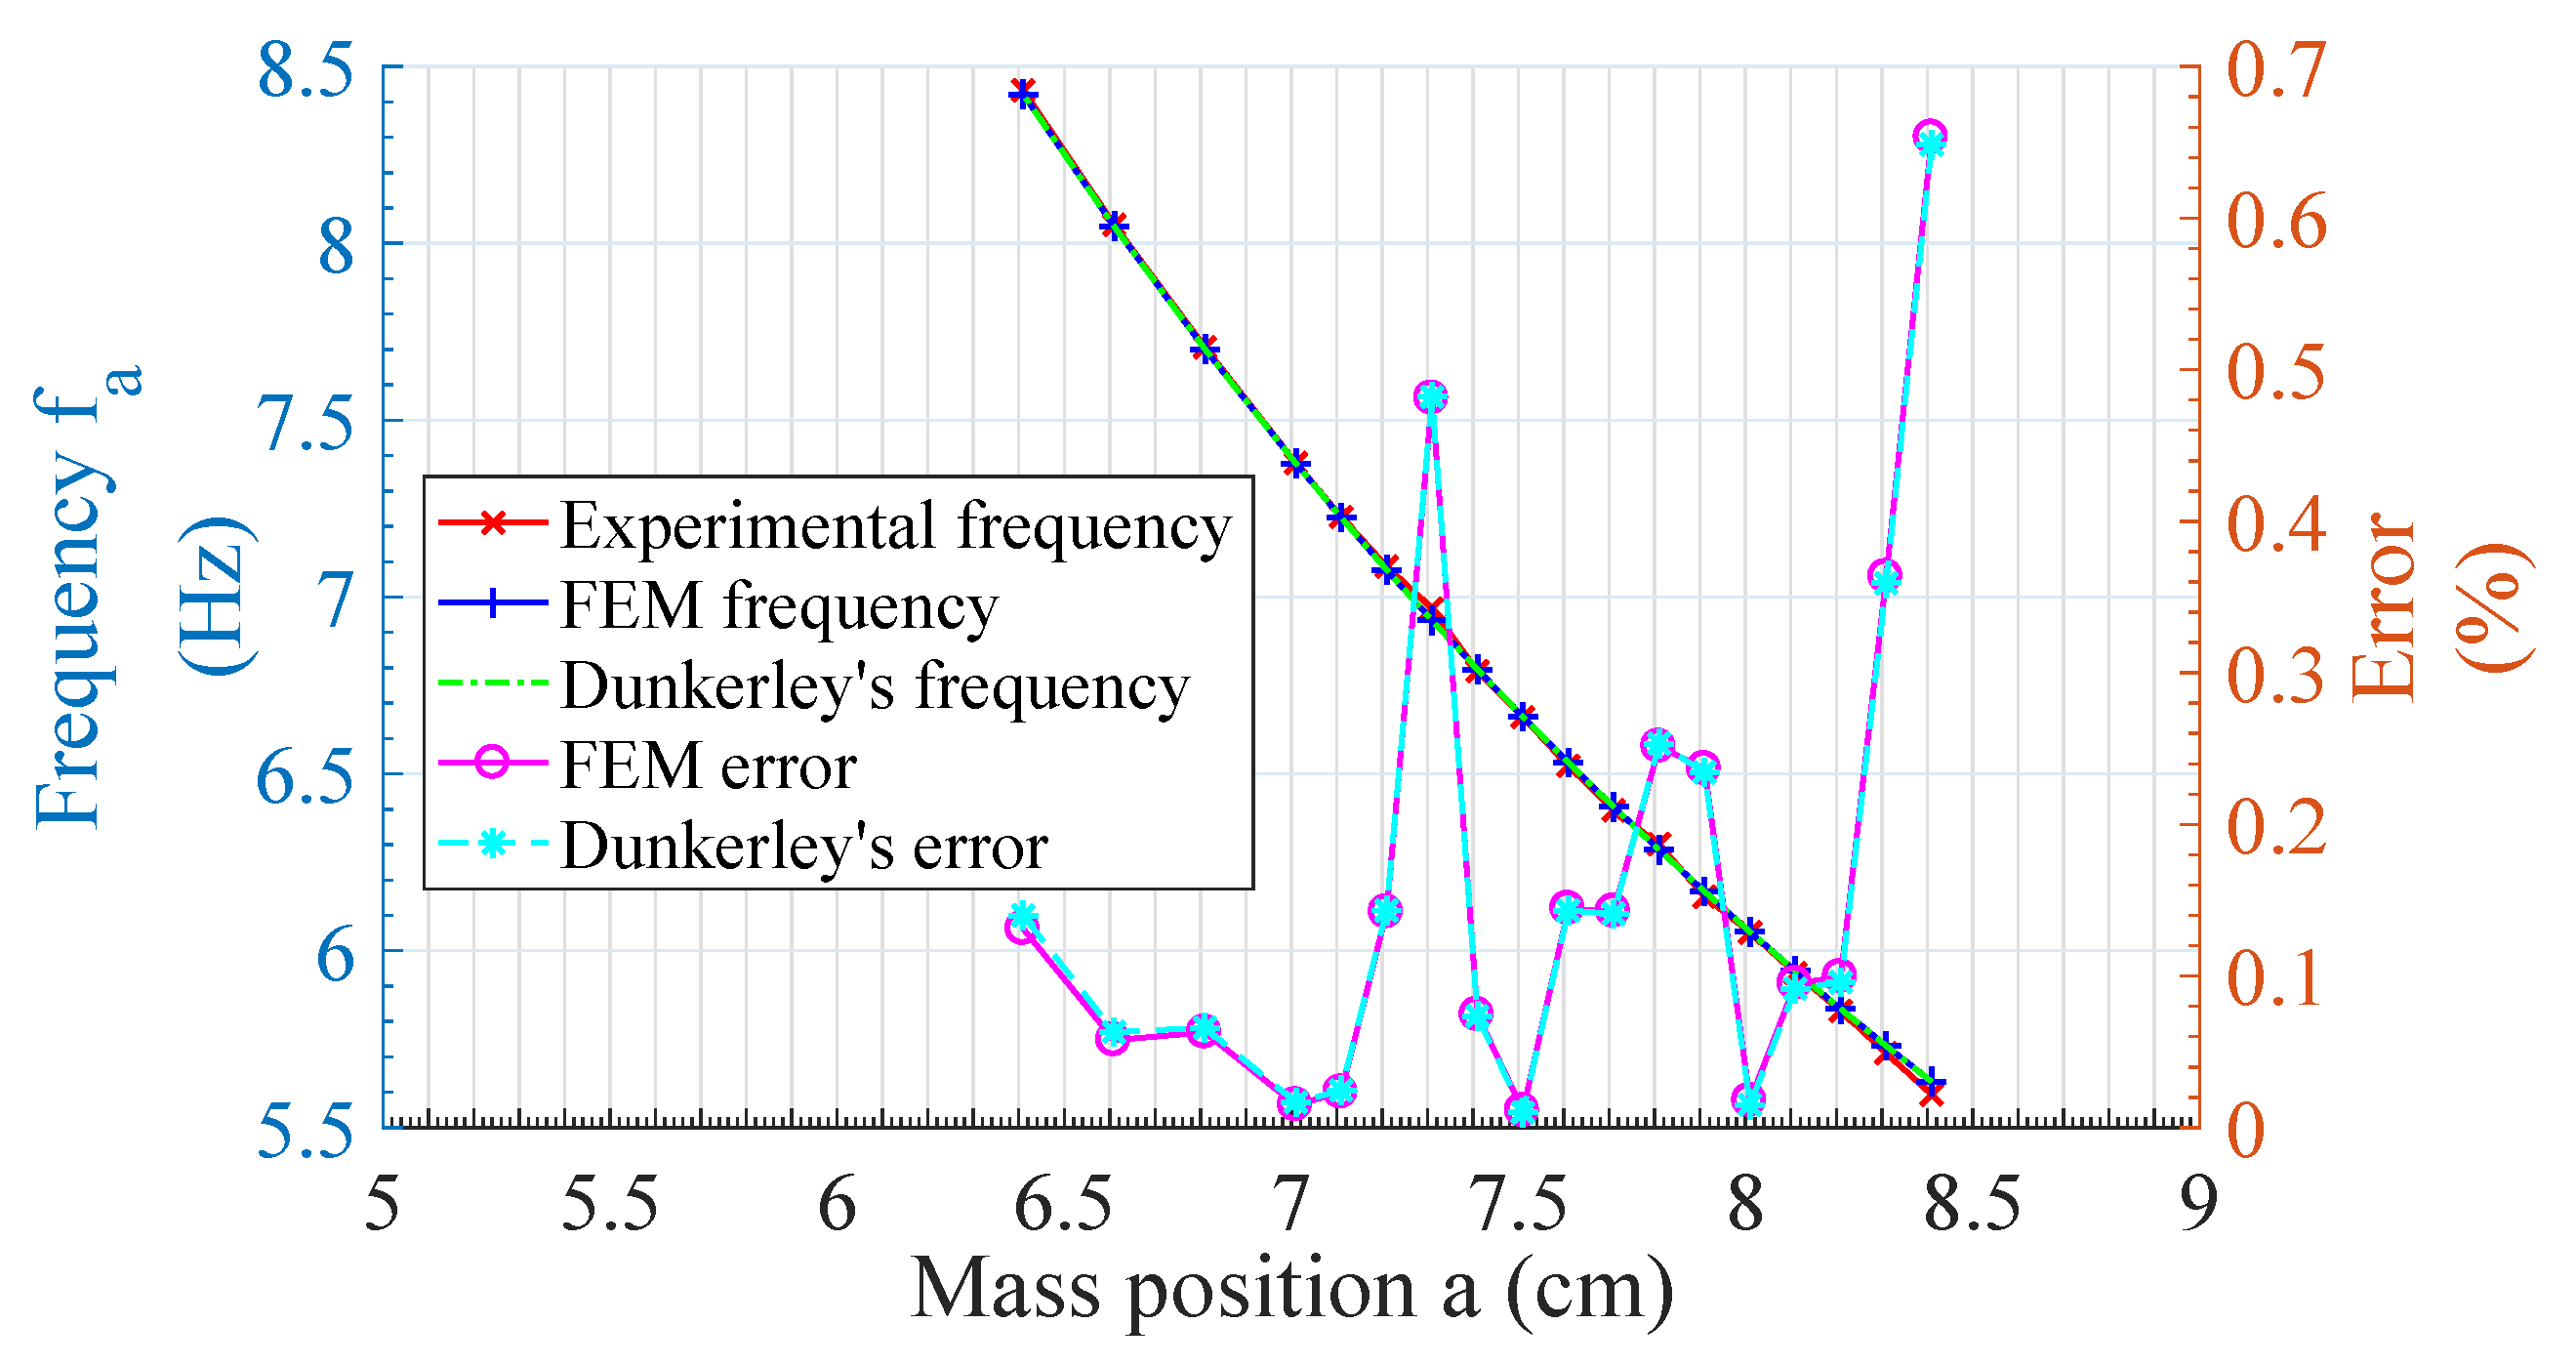
The EMG for the ECR muscle was recorded for 60 s with a sampling frequency of 5 kHz. As previously done for the IMU measurements. The time signal is downsampled by a ratio of 100 to obtain a sampling frequency of 50 Hz. The EMG measurements are used to reflect the neural active torque of the muscle at the joints [27]. The ECR is considered as the active input signal for the modeled system because the Flexor Carpi Radialis (FCR) signal of this patient shows negligible amplitudes in comparison to that of the ECR with response having the same frequency contents [28].
The ECR signal is scaled so that the simulated and measured flexion-extension angular displacement at the wrist joint reaches the same amplitude level. To reach an acceptable range of tremor amplitude, the ECR signal is amplified by a factor of 8.91, which leads to the active muscle torque signal T a used for the numerical study. This scaling value includes the effect of the muscle’s force-length factor, and force-velocity factor [29], in addition to the amplification level that was required to reach the objective. The fast Fourier transform (FFT) of the active torque T a is used as the active input for the modeled system while solving its response in the frequency domain, i.e., while applying the Laplace transformation for (8).
Analytical modeling of the force generated by the muscle can help in solving problems of motor control and clinical restoration of motion [30]. A simple method is proposed to determine an analytical formula representing the response of the muscle’s signal in the frequency domain. It uses the underdamped response behavior of the ECR signals, and FCR signals as well, deduced from a study of 144 measurements conducted under the oversight from an ethics review board for three different patients [28].
The formula suggested to describe the muscle’s response operating at two frequencies (n = 2) is:
u ( t ) = n u 0 n e ϕ n ζ n ω d r n t sin ( ω d r n t + θ n )
ω d r n represent the driving angular frequencies present in the power spectral density (PSD) of the ECR signal, which is determined using Welch’s method with a Hamming window of 256 points with 80% overlap for a sampling frequency of 5 kHz. ζ n is the damping ratio for the two peaks presented in the PSD calculated for the active muscle torque signal, identified using the half-power bandwidth method [31]. u 0 n , θ n , and ϕ n are the amplitude, phase angle, and shift angle of the signal, respectively. n is the number of critical peaks. The Laplace transform of (13) is written as follows:
T a i ( s ) = n u 0 n ( s . sin θ n + ω d r n cos θ n ) s 2 + 2 j ϕ n ζ n ω d r n s + ω d r 2 ( 1 ζ n 2 )
given that s = j ω where ω represents the angular frequencies, and j is a complex number. The parameters of the analytical formulation are obtained, such that: u 0 1 = 2.70 × 10⁻⁵ N·m, u 0 2 = 1.21 × 10⁻⁴ N·m, ζ 1 = 2.16%, ζ 2 = 1.15%, f d r 1 = 6.63 Hz, f d r 2 = 13.28 Hz, ϕ 1 = 0.20 rad, ϕ 2 = 0.90 rad, θ 1 = 2.38 rad, and θ 2 = 1.37 rad, where the driving frequency f d r i = ω d r i / 2 π .

2.3. Design of TMD

The parameters of the TMD will be designed depending on the flexion-extension angular displacement response of the wrist joint. The TMD chosen to reduce the tremor of the patient is modeled as a cantilever Euler-Bernoulli beam with a mass located at a suitable position to provide the optimal frequency required. It is called cantilever-type TMD. Dunkerley’s semi-analytical approximate formula [32] is applied to the fundamental angular frequency ω a of the cantilever-type TMD by dividing the system into a cantilever beam of fundamental angular frequency ω 1 b e a m and a massless rod with an additional mass of angular frequency ω l o a d . Dunkerley’s formula is written as:
1 ω a 2 1 ω 1 b e a m 2 + 1 ω l o a d 2
The fundamental frequency is expressed according to the linear stiffness k x , and the total effective mass m a , as follows:
ω a = k x m a 3 E b e a m I 0 a 3 m p + 3 ( β 1 l a ) 4 ( l a a ) 3 m b e a m
where, E b e a m and I 0 are the mass, Young’s modulus, and the cross-section area moment of inertia of the beam, respectively. β 1 l a 1.875 is the solution of the transcendental equation corresponding to the boundary conditions [33]. a is the position of the mass m p , modeled as a concentrated load, from the fixed end of the beam. To avoid an excessive effective length for the TMD, the maximum position a to be considered takes into account the width of the mass.
The effect of the TMD length l a , diameter d , and mass position a on the TMD’s operating frequency f a is shown in Figure 3a. A vertical line is drawn at 6.63 Hz, which represents the tremor frequency of a specific patient. For a beam with a length of 91 mm, a diameter of 0.75 mm is suitable to operate over all the PT range (5–12 Hz [34]), and a diameter of 0.79 mm as well. A diameter of 0.85 mm is enough to obtain the tremor frequency of the patient by taking into account a shift in the frequency due to the changes in the PT tasks, as investigated in [28]. These TMDs can reach the frequency of the patient when the mass is located at a = 7.5 cm. The manufactured TMD in Figure 3b is composed of a mass of 14.13 g and a stainless-steel beam of a length of 91 mm with a diameter of 0.79 mm.
Measurements are recorded using a vibrometer (PDV-100 from Polytec) to verify the expression (16) of the fundamental frequency of the cantilever-type TMD derived using Dunkerley’s semi-analytical formula. The beam is excited at its free end by an initial condition in displacement. The data acquisition is conducted using a LabVIEW interface with a sampling rate of 1707 Hz. The incident ray of the vibrometer strikes the beam at 15 mm from the clamped end of the beam. The measured signal is downsampled by a ratio of ten to obtain a sampling frequency of 170 Hz, greater than twice the first frequency of the beam.
The response of the beam without the mass is measured for 10 s. The FFT of the beam’s response is shown in Figure 4a. The modal damping ratio and frequency for the first mode are identified and equal to 0.14% and 67.3 Hz, respectively.
For the beam with a mass of 14.13 g, the measurements are recorded for 60 s. The response of the beam with the mass located in contact with its free end is shown in Figure 4b. The minimum critical frequency of the TMD (for the mass near the free end) is 5.60 Hz, which corresponds to a = 8.4 cm. The frequency calculated using Dunkerley’s Formula (16) for this position is 5.63 Hz, which is very close to the value obtained from the experimental measurements. The modal damping ratio is equal to 0.27%. Similar measurements are performed for the 18 different mass positions along the beam, with values a included between 6.4 cm and 8.4 cm.
A wavelet transform analysis [35] is performed to track the changes in the natural frequency of the manufactured TMD during a free decay test. It is conducted to ensure the linearity of the behavior of the TMD that we assumed. The instantaneous frequency obtained from the velocity signal drawn in Figure 4b is depicted in Figure 5.
The determination of the critical frequency and damping ratio of the TMD is done for different mass positions along the beam, starting near its free end towards the fixed end. The measured frequencies of the TMD are compared to those derived using the analytical Formula (16) and obtained numerically using the finite element method (FEM) implemented in Matlab. The mass is modeled as a concentrated load placed at the centroid position in both Dunkerley’s and FEM methods. The obtained results are presented in Figure 6. The left y-axis is for the natural frequency obtained experimentally and by FEM and Dunkerley’s calculations. The right y-axis is for the error between the FEM and Dunkerley’s results and the experimental ones.
The damping ratios depicted in Figure 7 for the cantilever-type TMD are identified using the FFT of the measured velocity signal for different mass positions along the beam. As shown, the values of the damping ratio vary between 0.26 and 0.46% for positions of the mass between 6.41 and 8.41 cm. A comparison is made to check the effect of the TMD having optimal and measured modal damping ratios.

2.4. Optimization of TMD

The PSD for the measurements of the tremor does not present the natural frequencies of the upper limb but just the driving frequencies [28], so the natural frequencies (see (11)) are filtered in the simulated signals obtained from the model. A band-pass filter is applied between 5.06 and 7.23 Hz, which represents the operational bandwidth around the driving frequencies deduced from the measurements. Thus, the filtered response of the wrist joint is used to design its parameters.
The performance of the designed TMD in reducing the amplitude of the tremor is tested numerically when it is located at the hand segment, 45% away from the wrist joint [36]. This distance can be a suitable position that does not disturb the patient. The dimensions and mass of the manufactured TMD are considered the same in the numerical study. The beam is 91 mm long with a diameter of 0.79 mm. Each TMD has an additional mass of 14.13 g, which represents a total mass ratio of 0.37% (TMD(s)-to-principle system mass ratio). The parameters to be optimized for each cantilever-type TMD are the position of the mass f a , affecting the stiffness coefficient and so its natural frequency a . Another parameter needed in the optimization is the damping ratio ζ a , reflecting the damping coefficient c a , that must be provided by the beam’s material. The beam used in the experiments has a diameter close to the optimal diameter required, equal to 0.81 mm. Thus, the diameter is imposed in the numerical study and is equal to 0.79 mm.
The parameters of the TMD (called x i ) to be optimized are mainly the stiffness and damping coefficients. The optimization process is applied to the frequency domain to minimize the wrist joint amplitude. The following steps are used in a Matlab program to search for the optimal parameters x o p t i :
(1)
The FFT of the ECR muscle signal is used as an input for the Laplace transform of the equation of motion (8);
(2)
For random initial parameters x i , the responses of the system with and without TMD(s) are obtained;
(3)
The inverse fast Fourier transforms (IFFT) of the responses in the frequency domain are used to obtain the corresponding time signals;
(4)
The PSD of the time signals, with and without TMD(s), are computed;
(5)
The reduction in the amplitude of the peak for the global system due to x i is then calculated;
(6)
The procedure is repeated to obtain the maximum possible reduction in the amplitude while the parameters of the TMD converge.
By using this procedure, the time response of the system, due to the input muscle signal, is optimized indirectly. After obtaining the optimal parameters, the time response can also be computed by solving (8) to compare the reduction obtained in the time domain.
A Matlab code is developed to implement and solve the equations of motion of the upper limb after the addition of several TMDs on the hand segment and to optimize their parameters. It is not practical to use a new material required to provide the optimized damping ratio for each TMD. So, the same stainless steel beam materials with damping ratios deduced from the measurements will be used after obtaining the optimal value.

3. Results

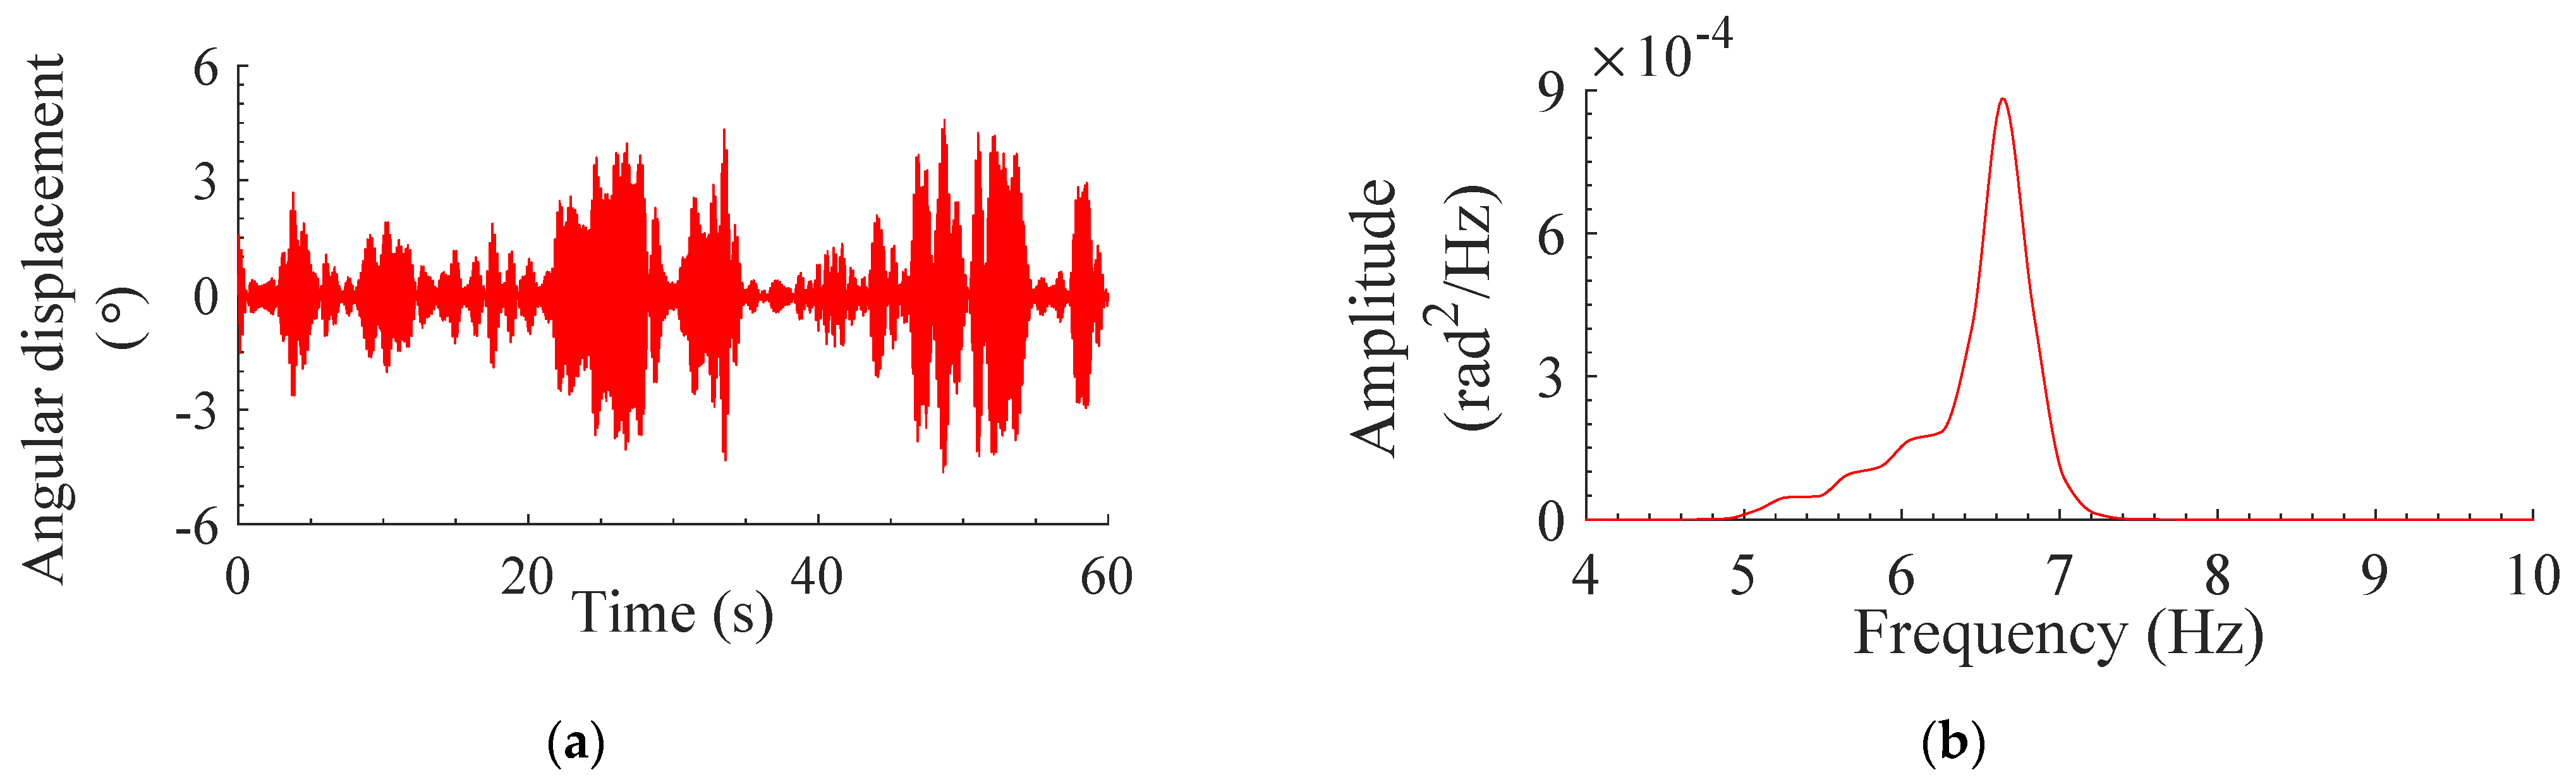
3.1. Measured Signals

The response of the upper limb is compared for the flexion-extension angular motion at the wrist joint and the linear displacement in the y-axis (vertical) at the free end of the hand segment in Figure 1. The amplitude ranges of these responses in mentioned directions are compared with measured ones. By referring to the upper limb of the patient in Figure 2, we discuss the z-axis linear acceleration and displacement (after double integration of the acceleration) signals and the flexion-extension angular motion (displacement and velocity) around the y-axis obtained from measurements done using the IMU placed at the wrist joint. The IMU measurements for the patient show that the z-axis acceleration signal varies between −5.34 m/s2 and 4.18 m/s2, and the z-axis displacement varies between −5.53 mm and 5.44 mm, as depicted in Figure 8a,b, respectively. The measured signal of the angular velocity of flexion-extension (about y-axis in Figure 2) of the wrist in Figure 8c varies between −2.66 rad/s and 2.04 rad/s. The y-axis angular displacement signal (after integration) varies between −4.02° and 4.61°, as shown in Figure 8d.
The active muscle torque T a of the ECR signal, amplified such that the simulated response reaches the amplitude level for the measurement in Figure 8d, is shown in Figure 9a. The damping coefficient of the muscle ( ζ 1 = 2.16%), identified based on the PSD of the ECR muscle signal and used for its analytical modeling, belongs to the range of 2.1 ± 0.7% (mean ± standard deviation) determined from a study performed for three PT patients, with 48 measurements for each [28]. A comparison between the analytical model of the input torque in (14) and the FFT applied for the measured signal of the ECR muscle, is shown in Figure 9b.

3.2. Response of Modeled System

The flexion-extension angular displacement signal at the wrist joint and its PSD obtained using the scaled torque T a , are shown in Figure 10a,b, respectively. The angular displacement at the wrist joint varies between −4.32° and 4.33°. The PSD of the angular displacement signal has a critical peak of amplitude of 8.82 × 10⁻⁴ rad2/Hz at a frequency of 6.63 Hz due to the ECR operating frequency. The parameters of the TMD are designed to reduce the amplitude at the peak presented in the PSD of the wrist joint angular displacement response.
The simulated displacement signal at the end of the hand segment is bounded between −1.85 mm and 1.59 mm (Figure 11a). The simulated angular velocity of the wrist shows a variation between −4.32 rad/s and 4.33 rad/s (Figure 11b).
The variation of the natural frequency of the designed cantilever-type TMD, shown in Figure 5, is analyzed within the interval of 2.8–55 s, as outside this interval, the variation is due to edge effects. The variation of the natural frequency, calculated as the relative variation between the highest and lowest values in the interval, is 0.59%. Thus, the behavior of the TMD can be considered linear. The analytical values of natural frequencies obtained for the different mass positions of the TMD along its beam match with the numerical ones obtained using the FEM, as shown in Figure 6. Both methods give natural frequencies very close to the experimental values. The highest error of 0.65% is observed for the mass located at the free end of the beam.

3.3. Effect of Optimized TMD

The wrist joint response is shown in Figure 12a–c after the addition of one, two, and three TMDs, respectively, where each TMD has a mass of 14.13 g. The response for which the damping coefficient(s) of the TMD(s) is optimized ζ a o p t i is compared to that for which the damping coefficients are equal to the measured one ζ a m e a s . After optimization, the damping ratio of the TMD corresponding to the optimal position a o p t i , can be selected or interpolated using Figure 7. The effect of replacing ζ a o p t i by ζ a m e a s becomes less noticeable as the number of TMDs increases. The one, two, and three TMDs with the measured damping ratios were able to reduce 75.7%, 92.5%, and 97.4% of the amplitude of the dominant peak of the PSD at the wrist joint, respectively.
From the numerical study with prior knowledge of the damping ratio, the three-TMD system with a total mass ratio of only 1.12% is a suitable choice for reducing the amplitude of the tremor. The optimal positions of the mass a o p t i of the three TMD system, the calculated fundamental frequencies f a , the optimal damping ratios ζ a o p t i , and the measured ones ζ a m e a s are listed in Table 2.
The angular displacement signals at the shoulder, elbow, and wrist joints of the upper limb with the three TMD system, having the measured values of damping ratios, are depicted in Figure 13a, Figure 13b, and Figure 13c, respectively. The highest reduction in the tremor amplitude is observed for the signal of the wrist joint since the optimization was based on its response in the frequency domain. The responses at the shoulder and elbow joints were not considered in the optimization process; however, the peak amplitudes of their calculated PSD are reduced by 89.5% and 86.7%, respectively.
The effect of the three TMD (black lines) on the response of the upper limb model is shown in Figure 14. It shows the vertical (y-axis) response at the tip of the hand segment (Figure 14a) and the angular velocity at the wrist joint (Figure 14b). As a result of the reduced angular displacement responses at the wrist joints, the angular velocity and linear displacement signals as well experienced a reduction in their amplitudes.

4. Discussion

The range of flexion-extension angular displacement signal at the wrist joint obtained numerically for the modeled upper limb system (Figure 10a) has a very close range to the corresponding response obtained from the measurements (Figure 8d). The vertical displacement response at the hand link end (Figure 11a) was lower than that of the measurements (Figure 8b). The simulated flexion-extension angular velocity response at the wrist joint (Figure 11b) has a rather wider amplitude range compared to that of the measurement (Figure 8c).
The modeled upper limb system is reliable for the flexion-extension angular displacement signal of the wrist joint. This response is chosen to be the closest to that of the measurements because the TMD parameters are designed depending on this response. These comparable ranges in the angular displacement responses were reached by scaling well the EMG voltage signal to reflect the input torque (Figure 9a) used for the dynamic model of the upper limb (Figure 1). As shown in Figure 9b, the analytical model of the input torque in (14) fits quite well the FFT of the ECR signal. Thus, as a first approximation, the muscle’s motion can be simply modeled by a second-order linear oscillation [37] with additional dynamic noise [38].
The damping ratios of the cantilever-type TMD (Figure 7) have a mean value of 0.33% for the different mass positions. The damping ratios of the cantilever-type TMD are different than the damping ratio obtained for the beam alone (0.14%). The value of the damping ratio of the TMD is affected by the additional mass and its position. The one TMD system using ζ a m e a s , shown in Figure 12a, causes an increase in the amplitude of the PSD at around 7.2 Hz. However, the changes due to the modification of the damping ratios slightly affect the response when two and three TMDs are used, as shown in Figure 12b,c, respectively. Therefore, the response of the system is less sensitive to changes in modal damping ratios when multi-TMDs are used.
Hashemi et al. [11] used a passive TMD modeled as a pendulum. Its parameters were tuned to reduce the amplitude of the resonant frequency of the two DOF upper limb model excited by sinusoidal signal. A high reduction of 80% in the amplitude of the system was obtained experimentally for a TMD having 300 kg. Instead, TMDs of optimal parameters were designed in this study based on a reliable response corresponding to measurements of PT. Thus, a lightweight TMD system of high reduction ability was obtained. Three optimal TMDs having a total mass of 42.4 g were able to cause a 97.4% reduction in the critical angular displacement amplitude of the PSD of the wrist joint response. Although Buki et al. [12] also tuned their 280 g TMD system depending on the resonant frequency modeled as a sinusoidal signal, an interesting design of a wearable vibrating system used to reduce the pronation-supination tremor was introduced. A parametric study for the TMD is conducted by Gebai et al. [36] to evaluate the effect of its parameters on the reduction of the postural tremor amplitude at the joints of the upper limb model. The study also considers the robustness of an optimized three TMD system due to a 0.6 Hz wide change in the excitation frequency of the ECR signal [28]. It shows that a 0.3 Hz gradual decrease in the excitation frequency can gradually decrease the efficiency of the TMD system, whereas the 0.3 Hz decrease causes an increase in the efficiency. However, the overall system shows to be robust to a 0.6 Hz wide range of changes in the excitation frequency. Despite that, the multiple linear TMDs needed for the robustness of the passive absorber system could be replaced by a single nonlinear TMD of a sufficiently wide bandwidth, as proposed by Gebai et al. [14,15].

5. Conclusions

The study presented in the article combines the numerical modeling of the upper limb and the measured signal of the muscle to get a reliable response used for PT control. The derived equation of motion for the biodynamic model of the upper was able to reproduce the PT response when the ECR muscle’s signal measured on a patient served as an excitation. This response is used to test the ability of a passive TMD to reduce such an unusual type of excitation signal. A lightweight three TMD system was designed as thin cantilever beams with a total mass of 42.4 g and 91 mm long beams. A passive three TMD system was able numerically to reduce 97.4% of the critical angular displacement amplitude of the PSD at the wrist joint of a system excited by the PT signals of a patient. It is recommended to replace the proposed geometry of this passive TMD with a more feasible design suitable for daily usage.
An experimental arm is manufactured, and experiments will be conducted using the signal of the patient as excitation. The three TMD system, partially optimized in this study, will be tested to verify the reliability of the model of the upper limb proposed to provide the TMD parameters to reduce postural tremor and to validate the numerical results experimentally. As the interest in three-dimensional printing techniques to meet clinical needs is growing, it can be important to provide a flexible structural design using low-cost material, which can rapidly be adapted to each patient and is convenient to manufacture [39]. Thus, the stainless-steel beams with a low modal damping ratio, having some disadvantages for a lightweight TMD system distributed over a small number of beams, could be replaced by three-dimensional printed materials with higher modal damping ratios.

Author Contributions

Conceptualization, S.G., G.C., M.H. and G.F.; Data curation, S.G.; Investigation, S.G., G.C., M.H. and G.F.; Methodology, S.G. and G.C.; Resources, S.G.; Software, S.G.; Supervision, G.C., M.H. and G.F.; Validation, G.C.; Visualization, E.R. and E.H.; Writing—original draft, S.G.; Writing—review and editing, S.G., G.C., M.H., G.F., E.R. and E.H. All authors have read and agreed to the published version of the manuscript.

Funding

This research received no external funding.

Institutional Review Board Statement

Not applicable.

Informed Consent Statement

Not applicable.

Data Availability Statement

The data are contained within the article.

Conflicts of Interest

The authors declare no conflict of interest.

References

  1. Blache, Y.; Begon, M. Influence of shoulder kinematic estimate on joint and muscle mechanics predicted by musculoskeletal model. IEEE Trans. Biomed. Eng. 2017, 65, 715–722. [Google Scholar] [CrossRef] [PubMed] [Green Version]
  2. Blache, Y.; Michaud, B.; Rogowski, I.; Monteil, K.; Begon, M. Sensitivity of shoulder musculoskeletal model predictions to muscle–tendon properties. IEEE Trans. Biomed. Eng. 2018, 66, 1309–1317. [Google Scholar] [CrossRef] [PubMed]
  3. Bolsterlee, B.; Veeger, D.H.; Chadwick, E.K. Clinical applications of musculoskeletal modelling for the shoulder and upper limb. Med. Biol. Eng. Comput. 2013, 51, 953–963. [Google Scholar] [CrossRef] [PubMed]
  4. Bolsterlee, B.; Veeger, H.E.J.; van der Helm, F.C. Modelling clavicular and scapular kinematics: From measurement to simulation. Med. Biol. Eng. Comput. 2014, 52, 283–291. [Google Scholar] [CrossRef] [PubMed]
  5. Louis, E.D.; Ferreira, J.J. How common is the most common adult movement disorder? Update on the worldwide prevalence of essential tremor. Mov. Disord. 2010, 25, 534–541. [Google Scholar] [CrossRef]
  6. Park, K.; Chang, P.H.; Kang, S.H. In vivo estimation of human forearm and wrist dynamic properties. IEEE Trans. Neural. Syst. Rehabil. Eng. 2017, 25, 436–446. [Google Scholar] [CrossRef]
  7. Chan, P.Y.; Ripin, Z.M.; Abdul Halim, S.; Tharakan, J.; Muzaimi, M.; Ng, K.S.; Kamarudin, M.I.; Eow, G.B.; Hor, J.Y.; Tan, K.; et al. An in–laboratory validity and reliability tested system for quantifying hand–arm tremor in motions. IEEE Trans. Neural. Syst. Rehabil. Eng. 2018, 26, 460–467. [Google Scholar] [CrossRef] [PubMed]
  8. Abbasi, M.; Afsharfard, A.; Arasteh, R.; Safaie, J. Design of a noninvasive and smart hand tremor attenuation system with active control: A simulation Study. Med. Biol. Eng. Comput. 2018, 56, 1315–1324. [Google Scholar] [CrossRef]
  9. Sagi-Dolev, A.M.; Prutchi, D.; Nathan, R.H. Three-dimensional current density distribution under surface stimulation electrodes. Med. Biol. Eng. Comput. 1995, 33, 403–408. [Google Scholar] [CrossRef]
  10. Triolo, R.J.; Liu, M.Q.; Kobetic, R.; Uhlir, J.P. Selectivity of intramuscular stimulating electrodes in the lower limbs. J. Rehabil. Res. Develop. 2001, 38, 533–544. [Google Scholar]
  11. Hashemi, S.M.; Golnaraghi, M.F.; Patla, A.E. Tuned vibration absorber for suppression of rest tremor in Parkinson’s disease. Med. Biol. Eng. Comput. 2004, 43, 61–70. [Google Scholar] [CrossRef]
  12. Buki, E.; Katz, R.; Zacksenhouse, M.; Schlesinger, I. Vib-bracelet: A passive absorber for attenuating forearm tremor. Med. Biol. Eng. Comput. 2018, 56, 923–930. [Google Scholar] [CrossRef]
  13. Bucolo, M.; Buscarino, A.; Fortuna, L.; Frasca, M. Multiple hysteresis jump resonance in a class of forced nonlinear circuits and systems. Int. J. Bifurc. Chaos 2020, 30, 2050258. [Google Scholar] [CrossRef]
  14. Gebai, S.; Savadkoohi, A.T.; Lamarque, C.H. Involuntary Tremor Control Using Passive Non-Smooth Absorber. In Proceedings of the 15ème Colloque National en Calcul des Structures, Giens, France, 16–20 May 2022; pp. 1–7. [Google Scholar]
  15. Gebai, S.; Savadkoohi, A.T.; Lamarque, C.H. Passive Nonlinear Energy Sink for Pathological Tremor Reduction. In Proceedings of the the 10th European Nonlinear Dynamics Conference, Lyon, France, 17–22 July 2022. [Google Scholar]
  16. Jackson, K.M.; Joseph, J.T.; Wyard, S.J. A mathematical model of arm swing during human locomotion. J. Biomech. 1978, 11, 277–289. [Google Scholar] [CrossRef]
  17. Hirashima, M. Induced Acceleration Analysis of Three-Dimensional Multi-Joint Movements and Its Application to Sports Movements. In Theoretical Biomechanics; Klika, V., Ed.; IntechOpen: London, UK, 2011. [Google Scholar]
  18. Harless, E. The static moments of human limbs. Treatsises Math.-Phys Cl. R. Acad. Sci. Bavaria 1860, 8, 69–96. [Google Scholar]
  19. Contini, R. Body segment parameters, Part II. Artif. Limbs 1972, 16, 1–19. [Google Scholar]
  20. Clauser, C.E.; Mc Conville, J.T.; Young, J.W. Weight, Volume, and Center of Mass of Segments of the Human Body; Wright-Patterson Air Force Base; (NTIS NO. AD-710 622); Yellow Springs, OH, USA; Antioch Coll: Yellow Springs, OH, USA, 1969. [Google Scholar]
  21. Velandia, C.; Celedón, H.; Tibaduiza, D.A.; Torres-Pinzón, C.; Vitola, J. Design and control of an exoskeleton in rehabilitation tasks for lower limb. In Proceedings of the 2016 XXI Symposium on Signal Processing, Images and Artificial Vision (STSIVA), Bucaramanga, CO, USA, 31 August–2 September 2016; IEEE: Piscataway, NJ, USA, 2016; pp. 1–6. [Google Scholar]
  22. Pandis, P. Musculoskeletal Biomechanics of the Shoulder in Functional Activities. Ph.D. Thesis, Imperial College London, London, UK, 2013. [Google Scholar]
  23. Goddard, R.; Dowson, D.; Longfield, M.D.; Wright, V. The measurement of stiffness in human joints. Rheologica. Acta 1969, 8, 229–234. [Google Scholar] [CrossRef]
  24. Zernicke, R.F.; Schneider, K.; Buford, J.A. Intersegmental dynamics during gait: Implications for control. Adv. Psychol. 1991, 78, 187–202. [Google Scholar]
  25. Carmichael, M.G.; Liu, D. Estimating physical assistance need using a musculoskeletal model. IEEE Trans. Biomed. Eng. 2013, 60, 1912–1919. [Google Scholar] [CrossRef]
  26. Babiarz, A.; Bieda, R.; Jaskot, K.; Klamka, J. The dynamics of the human arm with an observer for the capture of body motion parameters. Bull. Pol. Acad Sci.-Tech. 2013, 61, 955–971. [Google Scholar] [CrossRef]
  27. Clancy, E.A.; Liu, L.; Liu, P.; Moyer, D.V.Z. Identification of constant-posture EMG–torque relationship about the elbow using nonlinear dynamic models. IEEE Trans. Biomed. Eng. 2012, 59, 205–212. [Google Scholar] [CrossRef]
  28. Gebai, S.; Cumunel, G.; Hammoud, M.; Foret, G.; Apartis, E.; Flamand-Roze, E.; Hainque, E. S Analysis of Pathological Tremor Behavior: Application to Design a Passive Tremor Attenuator. In Proceedings of the 12th International Workshop on Structural Health Monitoring, Stanford, CA, USA, 10–12 September 2019; pp. 619–626. [Google Scholar]
  29. Chadwick, E.K.; Blana, D.; van den Bogert, A.J.; Kirsch, R.F. A real-time, 3-D musculoskeletal model for dynamic simulation of arm movements. IEEE Trans. Biomed. Eng. 2008, 56, 941–948. [Google Scholar] [CrossRef] [Green Version]
  30. Mohammed, G.A.; Hou, M. Optimization of active muscle force–length models using least squares curve fitting. IEEE Trans. Biomed. Eng. 2016, 63, 630–635. [Google Scholar] [CrossRef]
  31. Wu, B. A correction of the half-power bandwidth method for estimating damping. Arch. Appl. Mech. 2014, 85, 315–320. [Google Scholar] [CrossRef]
  32. Atzori, B. Dunkerley’s formula for finding the lowest frequency of vibration of elastic systems. J. Sound Vib. 1974, 36, 563–564. [Google Scholar] [CrossRef]
  33. Inman, D.J. Engineering Vibrations; Virginia Tech: Blacksburg, VA, USA; Prentice Hall: Upper Saddle River, NJ, USA, 2008. [Google Scholar]
  34. Morrison, S.; Kerr, G.; Silburn, P. Bilateral tremor relations in Parkinson’s disease: Effects of mechanical coupling and medication. Parkinsonism Rel. Disord. 2008, 14, 298–308. [Google Scholar] [CrossRef]
  35. Argoul, P.; Le, T.P. Instantaneous indicators of structural behaviour based on the continuous Cauchy wavelet analysis. Mech. Syst. Signal Proses. 2003, 17, 243–250. [Google Scholar] [CrossRef]
  36. Gebai, S.; Cumunel, G.; Hammoud, M.; Foret, G.; Roze, E.; Hainque, E. Upper Limb Involuntary Tremor Reduction Using Cantilever Beam TMDs. J. Vib. Control. 2022. [CrossRef]
  37. Timmer, J.; Häußler, S.; Lauk, M.; Lücking, C.H. Pathological tremors: Deterministic chaos or nonlinear stochastic oscillators? Chaos Interdiscip. J. Nonlinear Sci. 2000, 10, 278–288. [Google Scholar]
  38. Gao, J.B. Analysis of amplitude and frequency variations of essential and Parkinsonian tremors. Med. Biol. Eng. Comput. 2004, 42, 345–349. [Google Scholar] [CrossRef]
  39. Huang, T.Y.; Pan, L.L.H.; Yang, W.W.; Huang, L.Y.; Sun, P.C.; Chen, C.S. Biomechanical Evaluation of Three-Dimensional Printed Dynamic Hand Device for Patients with Chronic Stroke. IEEE Trans. Neural Syst. Rehabil. Eng. 2019, 27, 1246–1252. [Google Scholar] [CrossRef] [PubMed]
Figure 1. Biodynamic model of the upper limb in the vertical plane.
Dynamics 02 00012 g001
Figure 2. IMU measurements at the forearm and hand.
Dynamics 02 00012 g002
Figure 3. (a) Variation of the first frequency as a function of the mass position for several cantilever-type TMD. (b) Manufactured cantilever-type TMD.
Dynamics 02 00012 g003
Figure 4. FFT of the signal measured using a vibrometer. (a) Cantilever beam alone. (b) Cantilever beam with the screw located in contact with its free end.
Dynamics 02 00012 g004
Figure 5. Instantaneous frequency obtained from the vibrometer’s velocity signal for the beam with a mass located in contact with the free end.
Dynamics 02 00012 g005
Figure 6. Dunkerley’s and FEM fundamental frequency of the TMD with the percentage of error compared to the frequency obtained experimentally for different mass positions along the beam.
Dynamics 02 00012 g006
Figure 7. Variation of TMD equivalent percentage of damping ratio for each mass position along the beam.
Dynamics 02 00012 g007
Figure 8. IMU measurements at the hand of the patient. (a) Vertical (z-axis) acceleration signal. (b) Vertical (z-axis) displacement signal. (c) Angular velocity signal in flexion-extension direction (y-axis). (d) Angular displacement signal in flexion-extension direction (y-axis).
Dynamics 02 00012 g008
Figure 9. ECR signal of the patient used to excite the dynamic model. (a) Scaled signal used the input torque. (b) FFT of the measured signal and curve fitting with an analytical representation.
Dynamics 02 00012 g009
Figure 10. Response due to the scaled torque. (a) Angular displacement signal at wrist joint θ 3 . (b) PSD of (a).
Dynamics 02 00012 g010
Figure 11. (a) Vertical (y-axis) displacement at the distal end of the hand. (b) Angular velocity of the wrist joint Ω 3 .
Dynamics 02 00012 g011
Figure 12. PSD of the wrist joint signal after the addition of TMD(s) with optimized damping ratio ζ a o p t i compared to those obtained with the measured damping ratio ζ a m e a s . (a) One TMD; (b) two TMDs; (c) three TMDs.
Dynamics 02 00012 g012
Figure 13. Angular displacement signals at the joints of the modeled upper limb without (colored lines) and with (black lines) the three TMD system having measured values of damping ratios. (a) Shoulder θ 1 . (b) Elbow θ 2 . (c) Wrist θ 3 .
Dynamics 02 00012 g013
Figure 14. Simulated time responses without (colored lines) and with (black lines) the three TMD system having measured values of damping ratios. (a) Vertical (y-axis) displacement signal at the distal end of the hand. (b) Angular velocity at the wrist joint Ω 3 .
Dynamics 02 00012 g014
Table 1. Parameters of the upper limb.
Length (cm)Centroid (m)Mass (kg)
Upper arm l 1 36.4 r 1 0.427 l 1 m 1 2.07
Forearm l 2 29.9 r 2 0.417 l 2 m 2 1.16
Hand l 3 20.3 r 3 0.361 l 3 m 3 0.54
Table 2. Parameters of the three TMD system.
Three TMD SystemTMD#1TMD#2TMD#3
a (cm)7.97.77.6
f a (Hz)6.446.716.85
ζ a o p t i (%)1.270.151.28
ζ a m e a s (%)0.330.380.37
Publisher’s Note: MDPI stays neutral with regard to jurisdictional claims in published maps and institutional affiliations.

