
Asymptomatic Patients and Immune Subjects


Department of Neurosciences, Biomedicine and Movement Sciences, Verona University, 10 Sq. L.A.Scuro, 37134 Verona, Italy
*
Author to whom correspondence should be addressed.
Encyclopedia 2022, 2(1), 109-126; https://doi.org/10.3390/encyclopedia2010008
Submission received: 15 November 2021
/
Revised: 21 December 2021
/
Accepted: 7 January 2022
/
Published: 11 January 2022
(This article belongs to the Collection Encyclopedia of COVID-19)
Definition
:An asymptomatic patient is someone who contracts a disease but shows no symptoms. An immune subject is a person who is free from virus infection. Both of these categories of people experience the limitations of government imposed by a pandemic situation, with one important difference. Probably only the first subjects contribute, in spite of themselves, to the spread of the disease and to the contagion of the people most susceptible to the virus. This implies that their detection is essential to limit infections. Therefore, knowing the characteristics of these people and those immune to the virus can be extremely useful in mitigating the effects of the disease and/or defeating it.
1. Introduction
The spread of a disease in a country can depend on the effectiveness of the measures put in place to contain it and on the characteristics of the health system of the country itself. In the case of COVID-19, a disease resulting from a new virus, the whole world reacted by taking drastic measures, such as repeated total lockdowns during peaks of contagion.
The analysis of the data on infections, hospitalizations, and deaths showed that the virus has had very different effects from country to country. Overall, an immediate attempt was made to identify and protect the people who could be at increased risk of contracting this disease. It was quickly realized that the most severe forms of COVID-19 affected people over the age of 60 and/or with health conditions, such as lung or heart disease, diabetes, or conditions affecting the immune system [1]. However, country-to-country differences emerged on the groups of people at greatest risk.
This is the case, for example, of people with diabetes, who were listed in second place in the top 10 groups of people at risk of developing severe and life-threatening forms of COVID-19 by the European Union’s European Center for Disease Prevention and Control (ECDC) of the European Union [2], while they ranked eighth among people who could be most at risk of serious illness by the Centers for Disease Control and Prevention (CDC) of the United States of America [3].
It should be emphasized that the containment measures adopted by the different countries have been different. The peaks of contagion occurred at different times, resulting in non-coincident lockdown periods in adjacent countries. The same political choices of the moment of initiation of the individual lockdowns, of their duration, and of the number of people authorized to continue essential work activities could have influenced both the contagion and mortality rates. The health protocols implemented in the various hospitals could also have played a decisive role in this regard.
These considerations lead to the conclusion that people with a certain pathology could be more at risk in some countries than in others. However, there may be other pre-existing factors that may have made some people more or less susceptible to the disease than others, leading to the development of mild forms of infection. Furthermore, it should not be forgotten that, as with all viruses, even for SARS-CoV-2 there can be people who are immune.
Immune subjects have undergone all forms of containment, to no effect, but this can be considered an acceptable price given the gravity of the situation.
Patients who have developed mild forms of COVID-19, paucisymptomatic or asymptomatic, are instead those who have probably contributed, in spite of themselves, to the spread of the disease and to the contagion of the most susceptible people.
Perhaps early characterization of both of these two groups of subjects could have mitigated the effects of SARS-CoV-2 and could, however, still be useful in explaining its spread dynamics.
Taking all these considerations into account, we analyzed the contagion and mortality data from Italy, relating to the first wave of infections, in order to identify which people were less susceptible to the virus. The characteristics of these people were then also observed on a global scale to understand whether the data found for Italy were general or specific for this country.
2. Italy
2.1. First Wave of Infections
Why Italy? Because Italy is the first country in Europe where SARS-CoV-2 spread. Probably also for this reason it is the country that has suffered the greatest damage, presenting both a diffusion rate and a mortality rate among the highest, both in the European continent and in the whole world [4].
Italy is divided in three parts: north, center, and south. These areas are not geographically divided, and there is a high mobility between the different regions, both for business reasons and for tourism factors. The first generalized lockdown in Italy took place in the period of 11 March–3 May 2020 [5,6]. Although the characteristics of this country did not hinder the spread of SARS-CoV-2, the first wave of COVID-19 in the various Italian areas was not homogeneous, and there was a greater spread and aggression, especially in the north compared to southern Italy (Table 1).
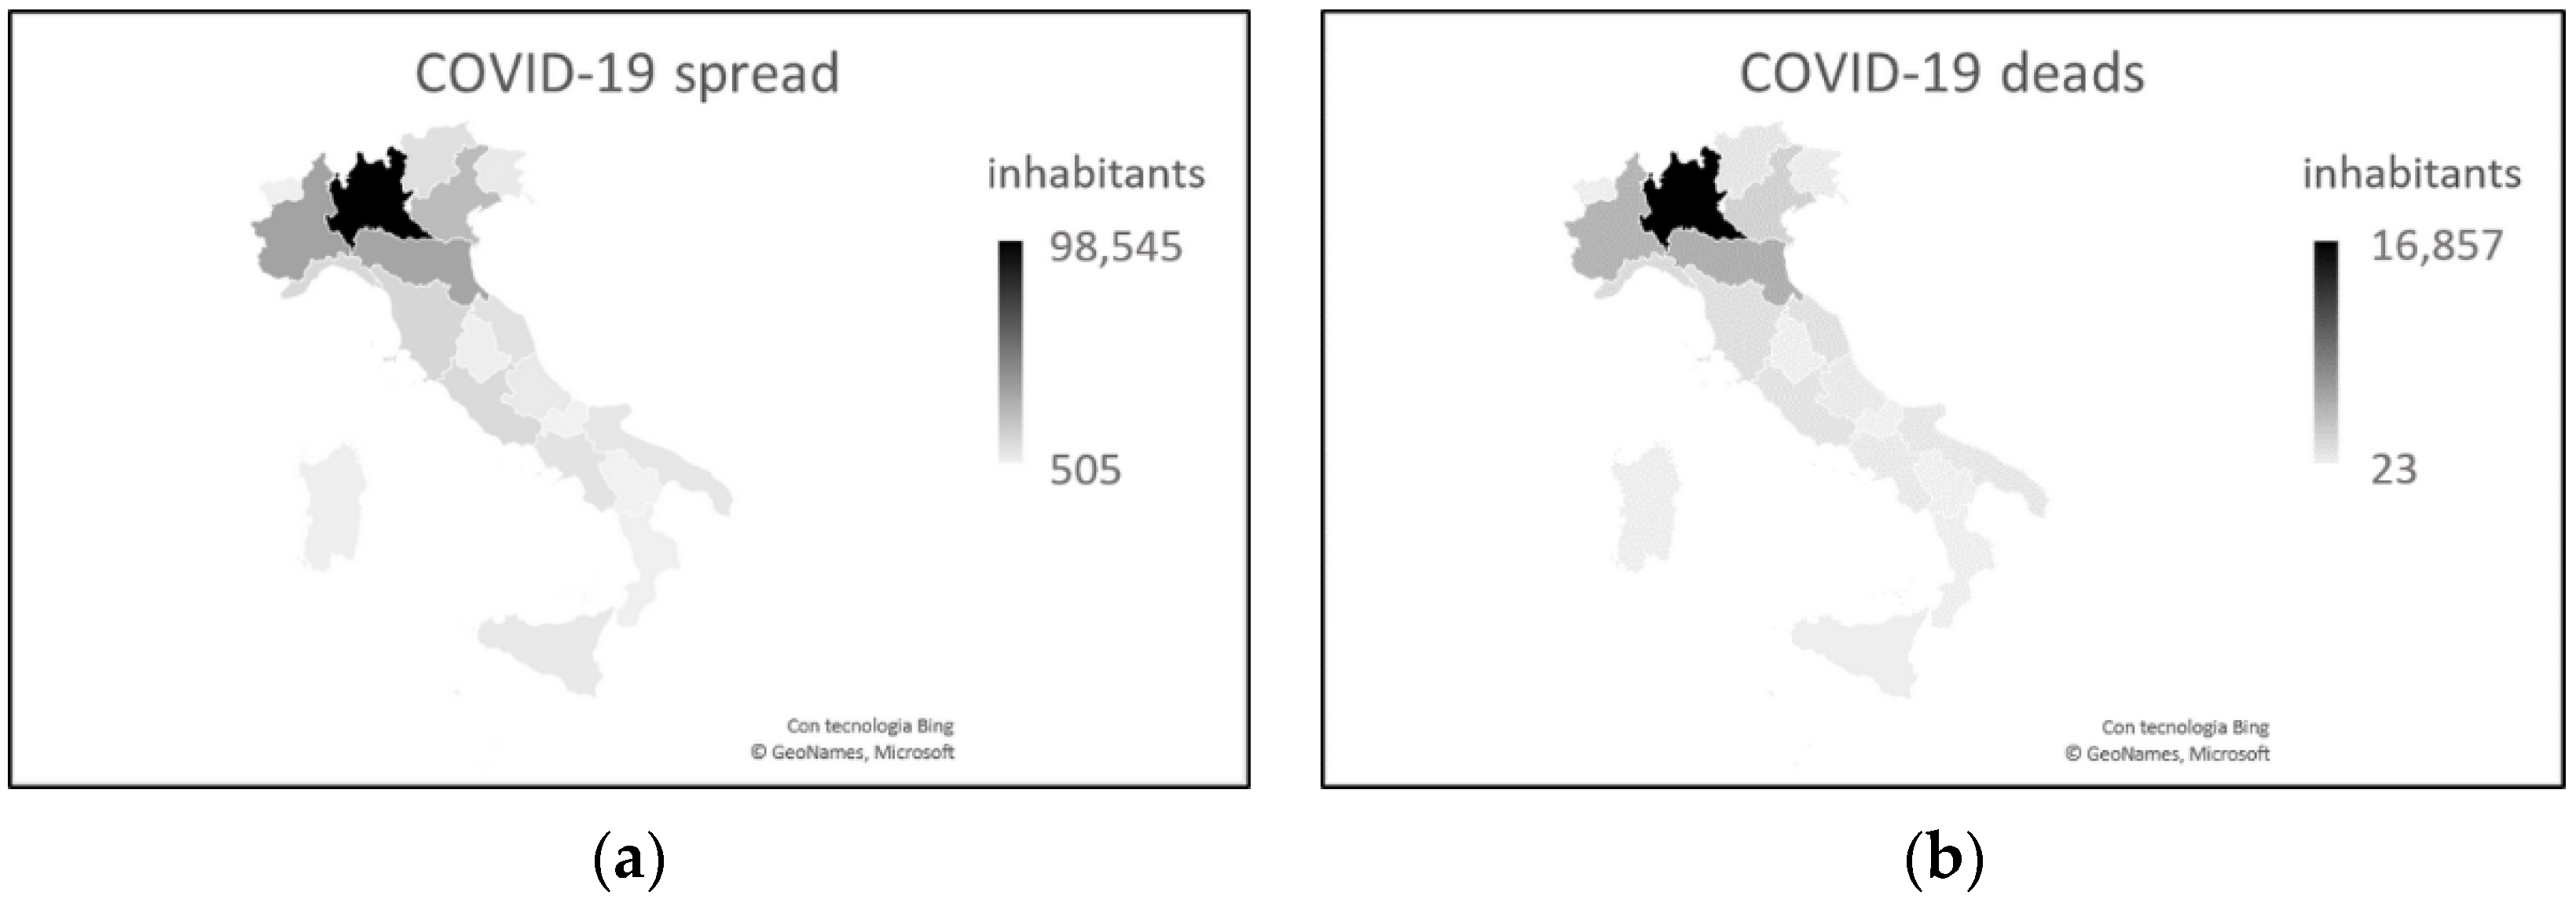
From the beginning of the pandemic to 25 August 2020, the date of full resumption of socio-economic activities, keeping the prevention measures active, the spread of the disease was more than ten times higher in the north than in the south (mean = 0.697, sd = 0.232, min = 0.300, max = 0.980 in the north vs. mean = 0.129, sd = 0.067, min = 0.072, max = 0.279 in the south) (Figure 1a). The death rate was 15 times higher in the north than in the south, with the death-to-infection ratio higher in the north (Figure 1b) [4].
What caused these differences?
Northern and southern Italy have different demographic and socio-economic characteristics.
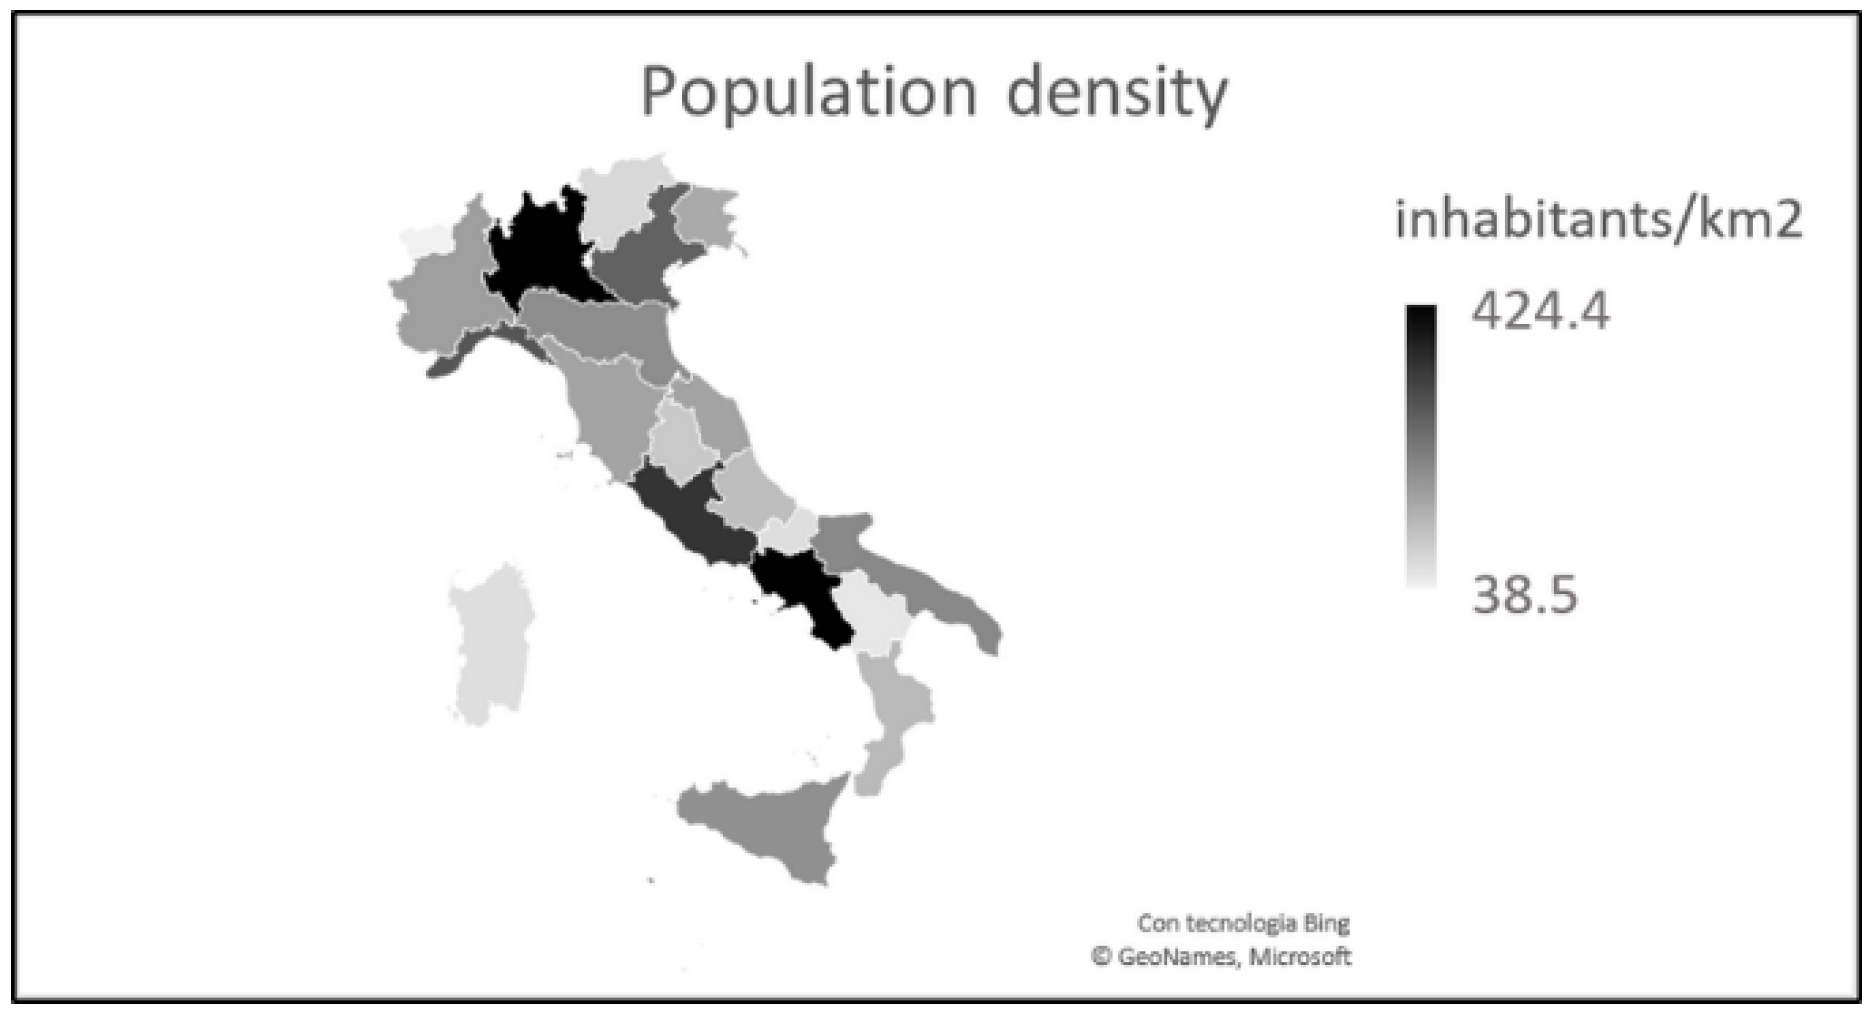
Compared to the south, the north has a higher number of inhabitants (27,746,113 vs. 20,597,424) and a greater population density (202 vs. 140 inhabitants/km2) (Figure 2). There is no doubt that, in the areas with the highest population density, the contagion is more widespread, even if protection and prevention measures are adopted.
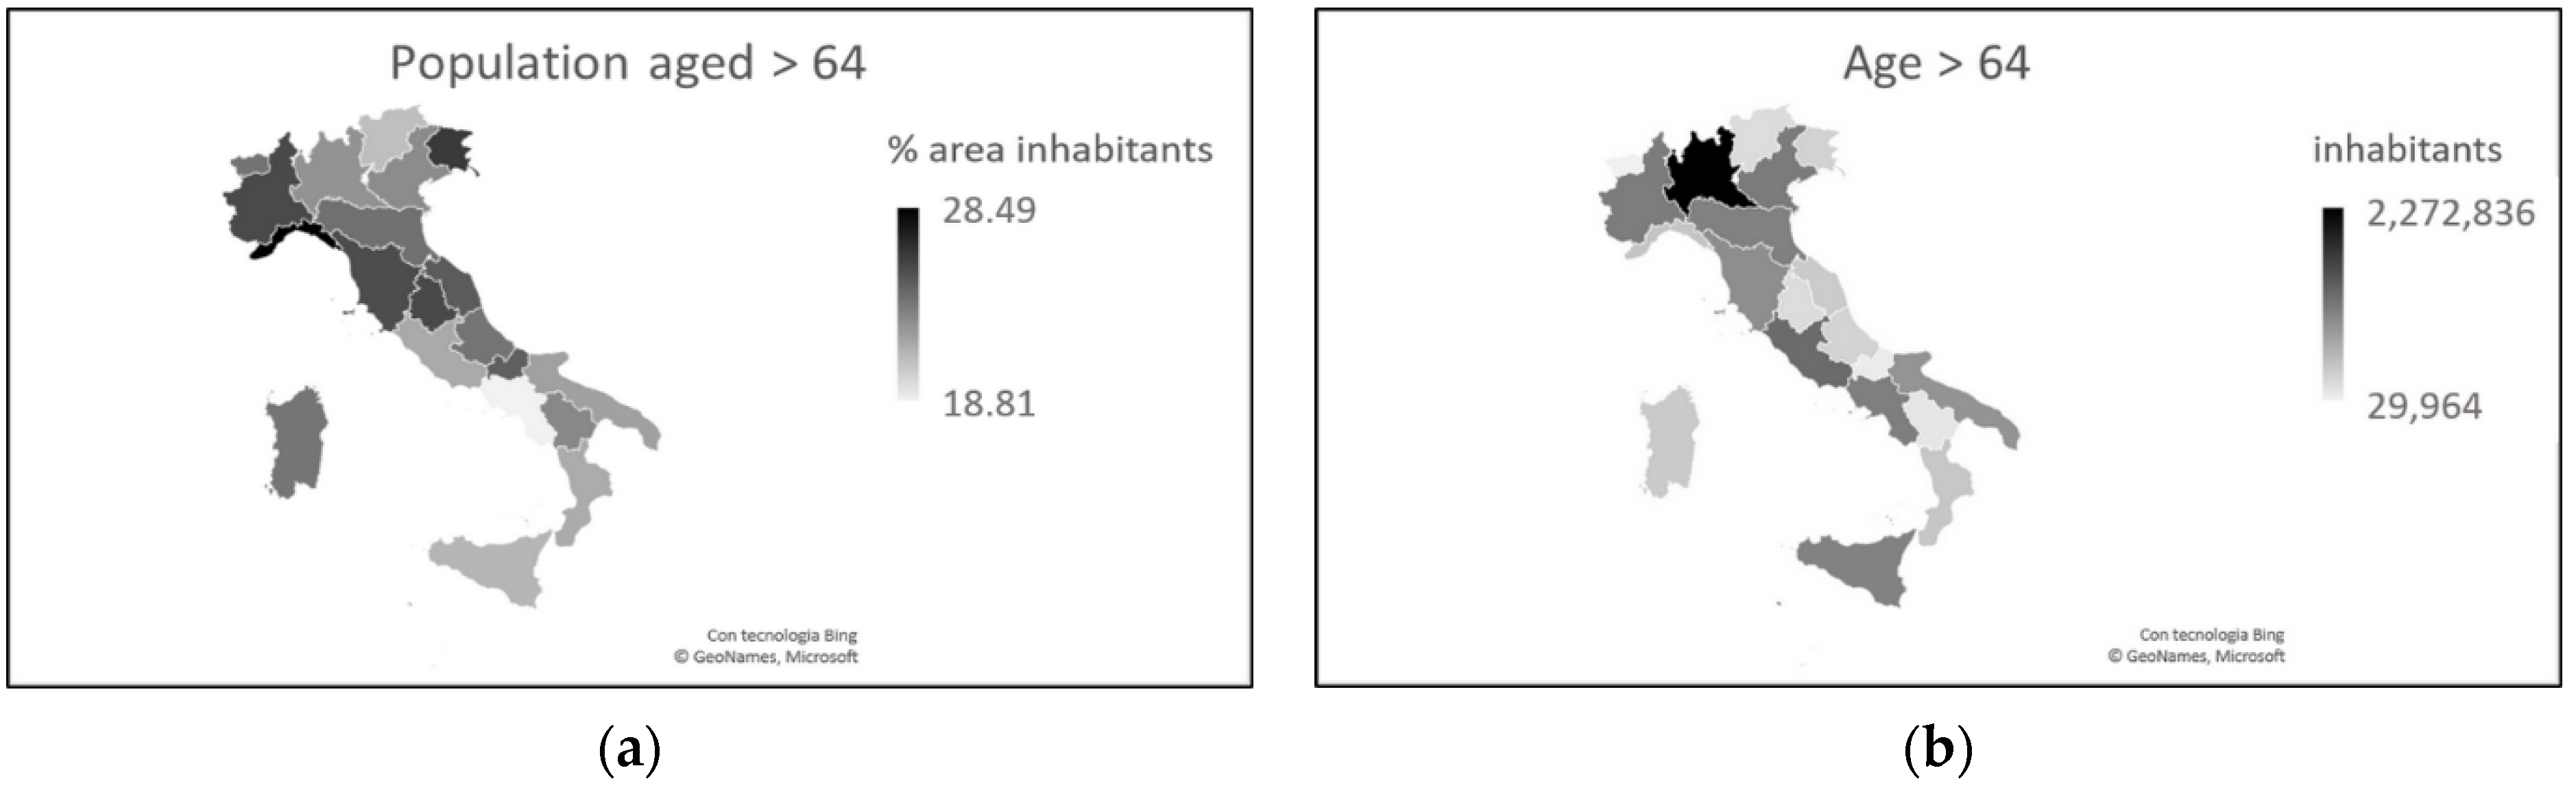
Furthermore, in percentage terms, the population is older in the north than in the south [7]. The greater number of inhabitants and the difference in age distribution mean that in the north there are 2.2 million more inhabitants aged > 64 years (Figure 3). Given the greater susceptibility to SARS-CoV-2 of people aged > 60 years, these data are compatible with the greater severity highlighted in northern Italy [4], even if they are not sufficient to explain the huge gap between the two areas.
Another peculiarity of COVID-19 in Italy concerns the gender difference. It quickly emerged that although infections affected men and women at the same rate [8], the death rate was lower for the latter [9]. These data have been tracked over time and were still valid as of 17 September 2021.
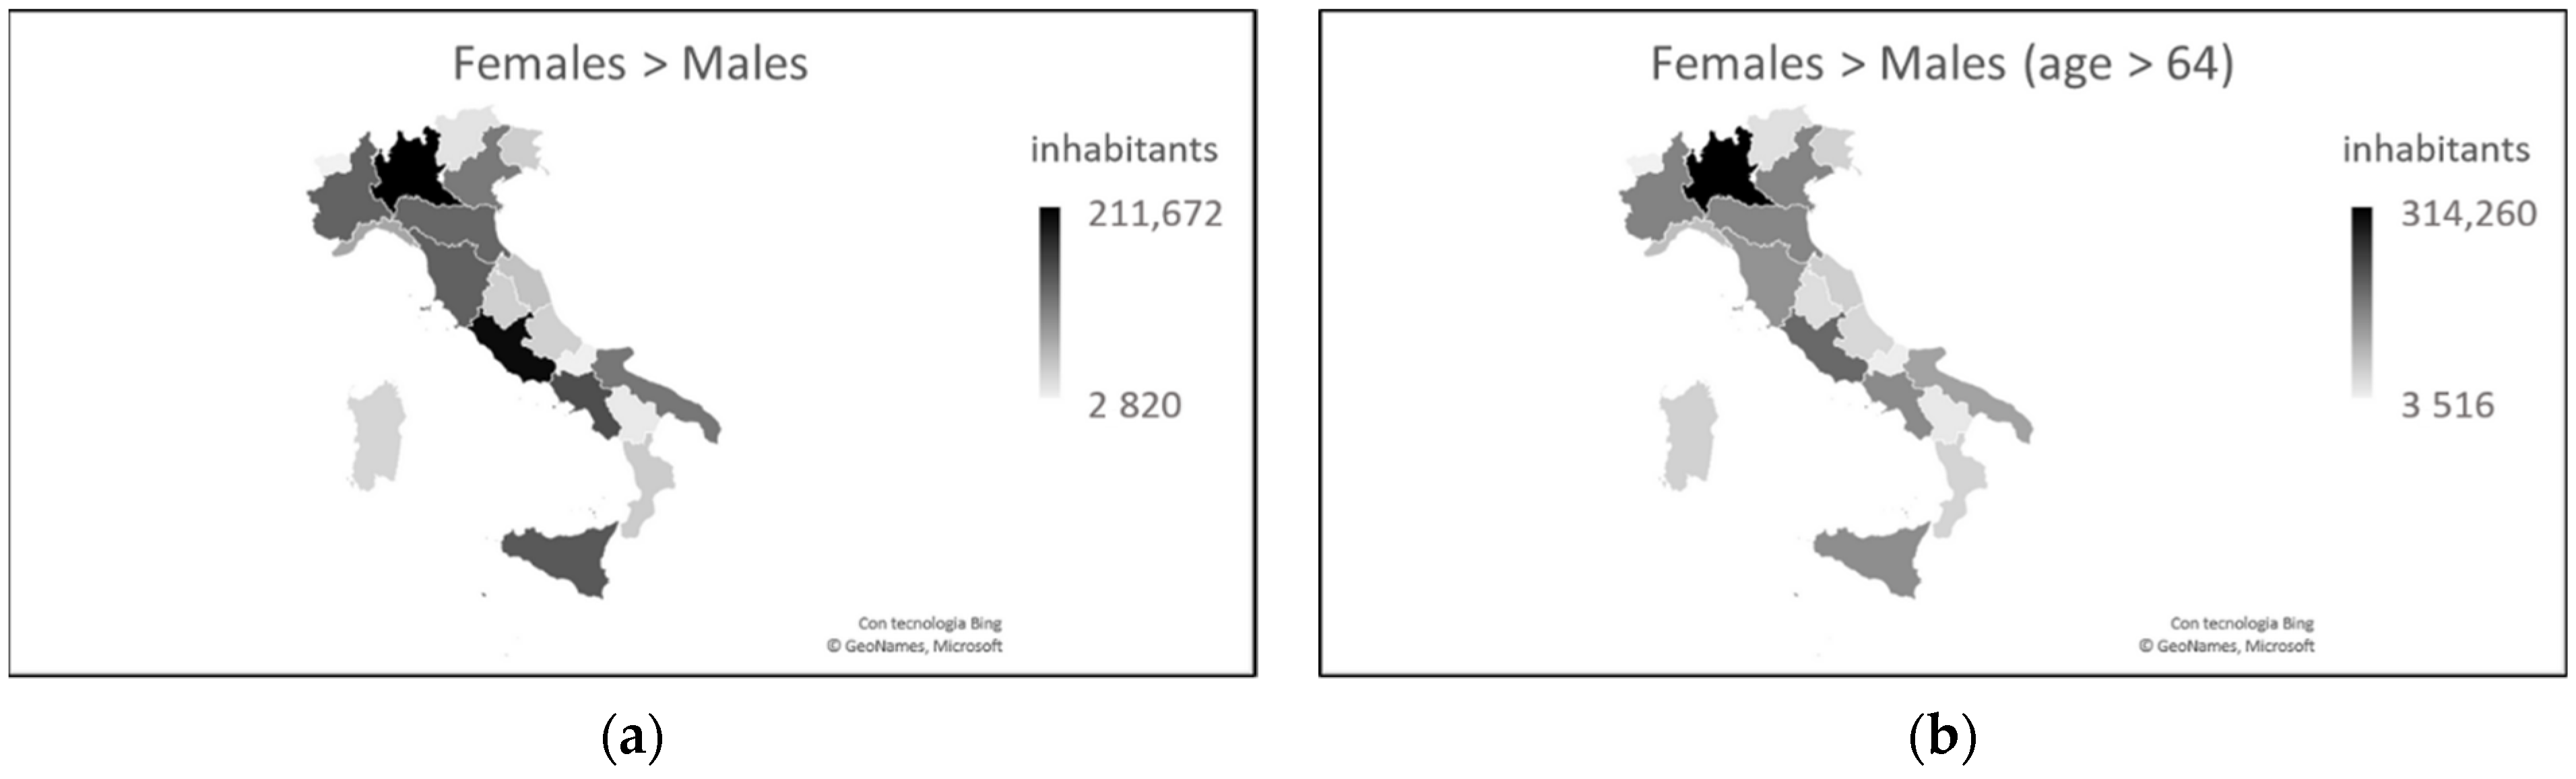
The national percentage distribution of the male and female population indicates homogeneity throughout the territory, with a presence of only 2.63% more females than males. These data, however, mainly concern the population > 64 years, in which there are 2.97% more women than men. This percentage is higher in the north than in the south (3.20% vs. 2.53%) and implies that, in the north compared to the south, there are 1.3 million more women than men and a total of 0.9 million more women than men aged > 64 years [7] (Figure 4).
The graphs in Figure 4 are similar to the graphs in Figure 1 on SARS-CoV-2 prevalence and COVID-19 mortality. This seems to be in contrast to the higher male mortality figure because where there are more females, fewer deaths should be expected. Given that the number of infections is equally distributed between the sexes, although the number of females is greater, can it be assumed that females are less susceptible than males to contracting the virus, and therefore female mortality is lower than male mortality?
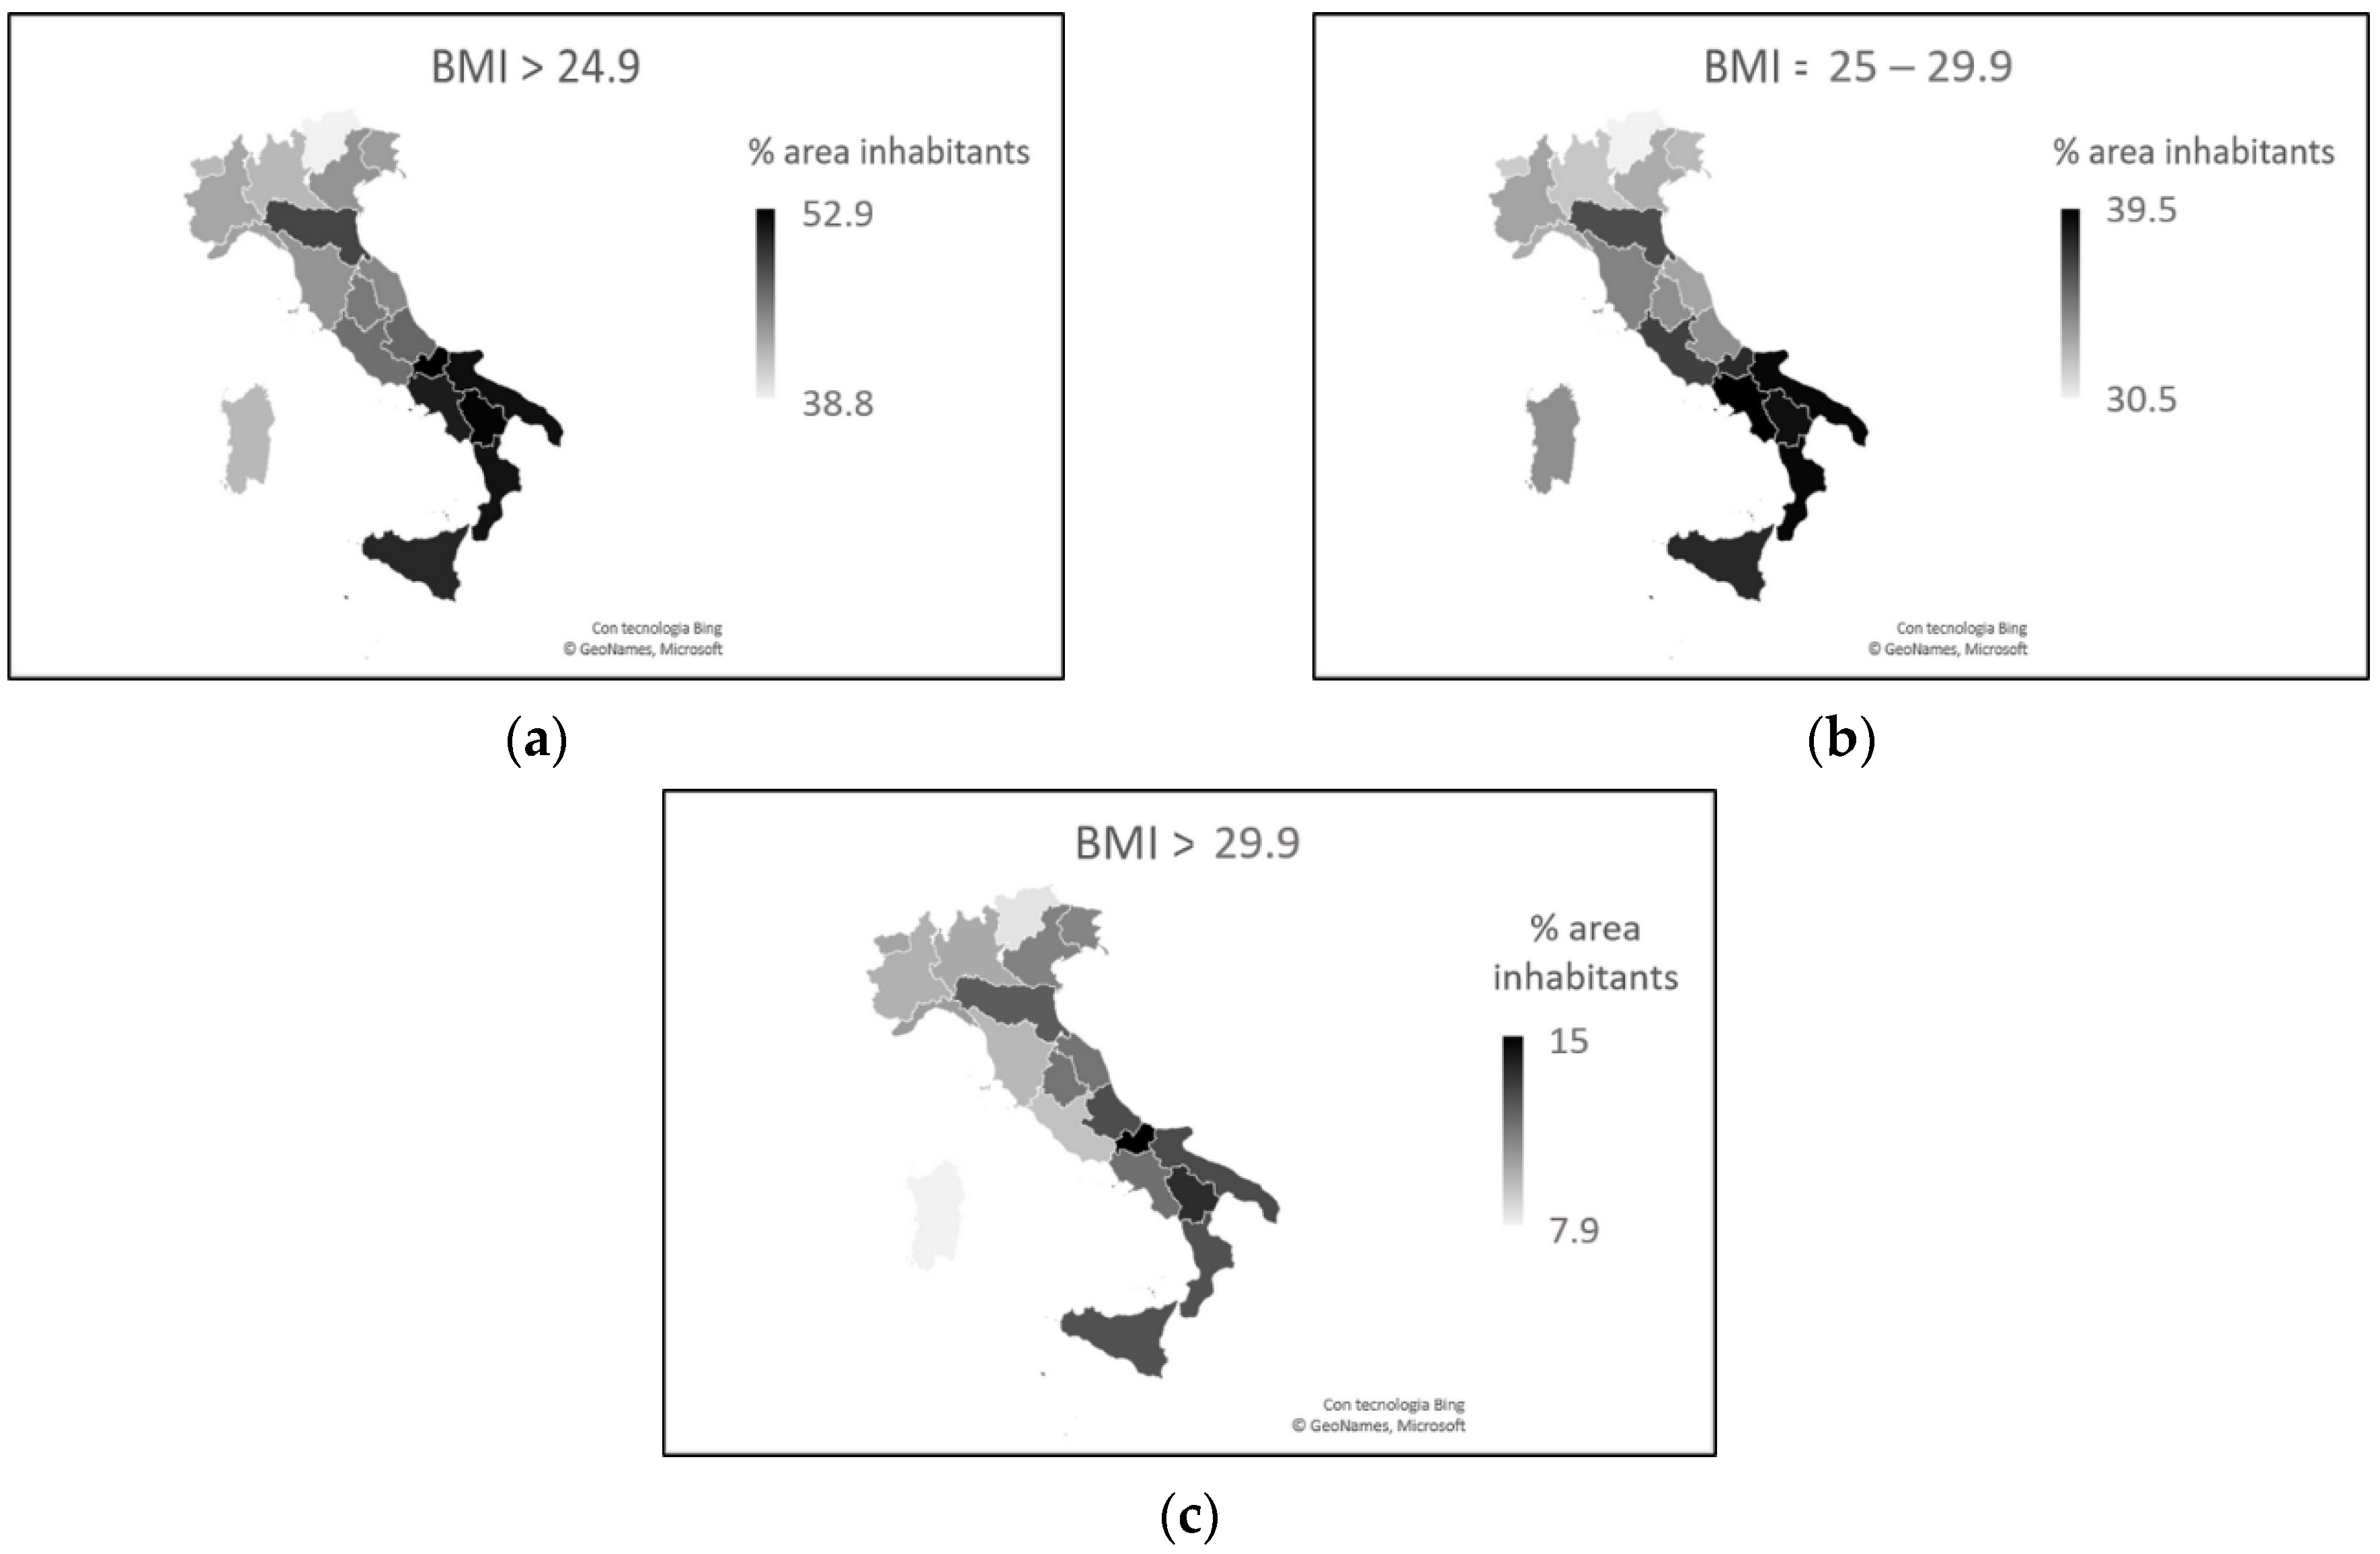
Another characteristic aspect of Italy is food, and there is a clear difference between north and south in terms of culinary culture, a difference which is reflected in weight problems. From the Italian population, 46.3% have weight problems. Furthermore, 35.4% of people have a body mass index (BMI) within the limits of overweight (BMI = 25–29.9 kg/m2), and 10.7% are obese (BMI > 30 kg/m2). The population of northern Italy appears to be in better physical condition than that of the south. Compared to the national value, all the southern regions except Sardinia have a higher percentage of problems, while all the northern regions present lower values [10].
The figure worsens considering only the adult population (>18 years). The regions of northern Italy have lower overweight percentages than the regions of southern Italy, excluding Sardinia. This trend is also valid for the data relating to obesity, with the exception of Veneto, Friuli-Venezia Giulia, and Emilia-Romagna, which have obesity rates similar to those of the southern regions (Figure 5).
Overweight rates increase as people reach 74. From the age of 75, the trend reverses and rates decrease. The number of overweight males is greater than the number of overweight females, and over 64 years of age, the difference (overweight males—overweight females) is 12%. Obesity rates also increase with people’s age up to 64 years. From the age of 65, the trend changes and rates fall. Males are more obese than females up to 74 years of age. From the age of 75, the percentage of obese males and females is the same [10].
Comparing data on the prevalence and death rates of COVID-19 with data on BMI, an almost surprising inverse relationship emerges. During the first phase of the infection in Italy, COVID-19 was more prevalent and more lethal in areas where the population had lower BMI rates. People aged > 74, for whom overweight rates decline, and people aged > 64, for whom obesity rates decline, were the most affected by the virus and had the worst disease outcomes. Does this mean that excess visceral adipose tissue may be a protective factor against SARS-CoV-2?
However, males aged > 64 with more weight problems than females had higher mortality rates. Can excess visceral fat protect a person from contracting the disease, but aggravate symptoms if he/she becomes infected?
The last two aspects that we consider, looking for a correlation with COVID-19 in Italy, are the blood group and the pathological states related to the levels of iron in the blood in the different geographical areas.
A link between blood groups and susceptibility to COVID-19 has already been described, and blood group A was more susceptible to the disease than group O, which appears to be more immune [11]. These data are in line with what has already been demonstrated for other diseases, such as Helicobacter pylori and norovirus infections, and for cholera and malaria [12,13]. In his work, Anstee (2010) states that protection against these infectious diseases derives from the inheritance of polymorphisms in the genes that encode and regulate the expression of ABH and Lewis antigens in body secretions [12]. Cooling (2015) highlighted the possible protective mechanisms deriving from the gene polymorphism of blood groups [13].
In Italy, the most common blood group is group A. North and south differ in the diffusion rate of group A, which is double in the north compared to the south (Table 2) [14]. This evidence could help explain COVID-19′s lower southern spread.
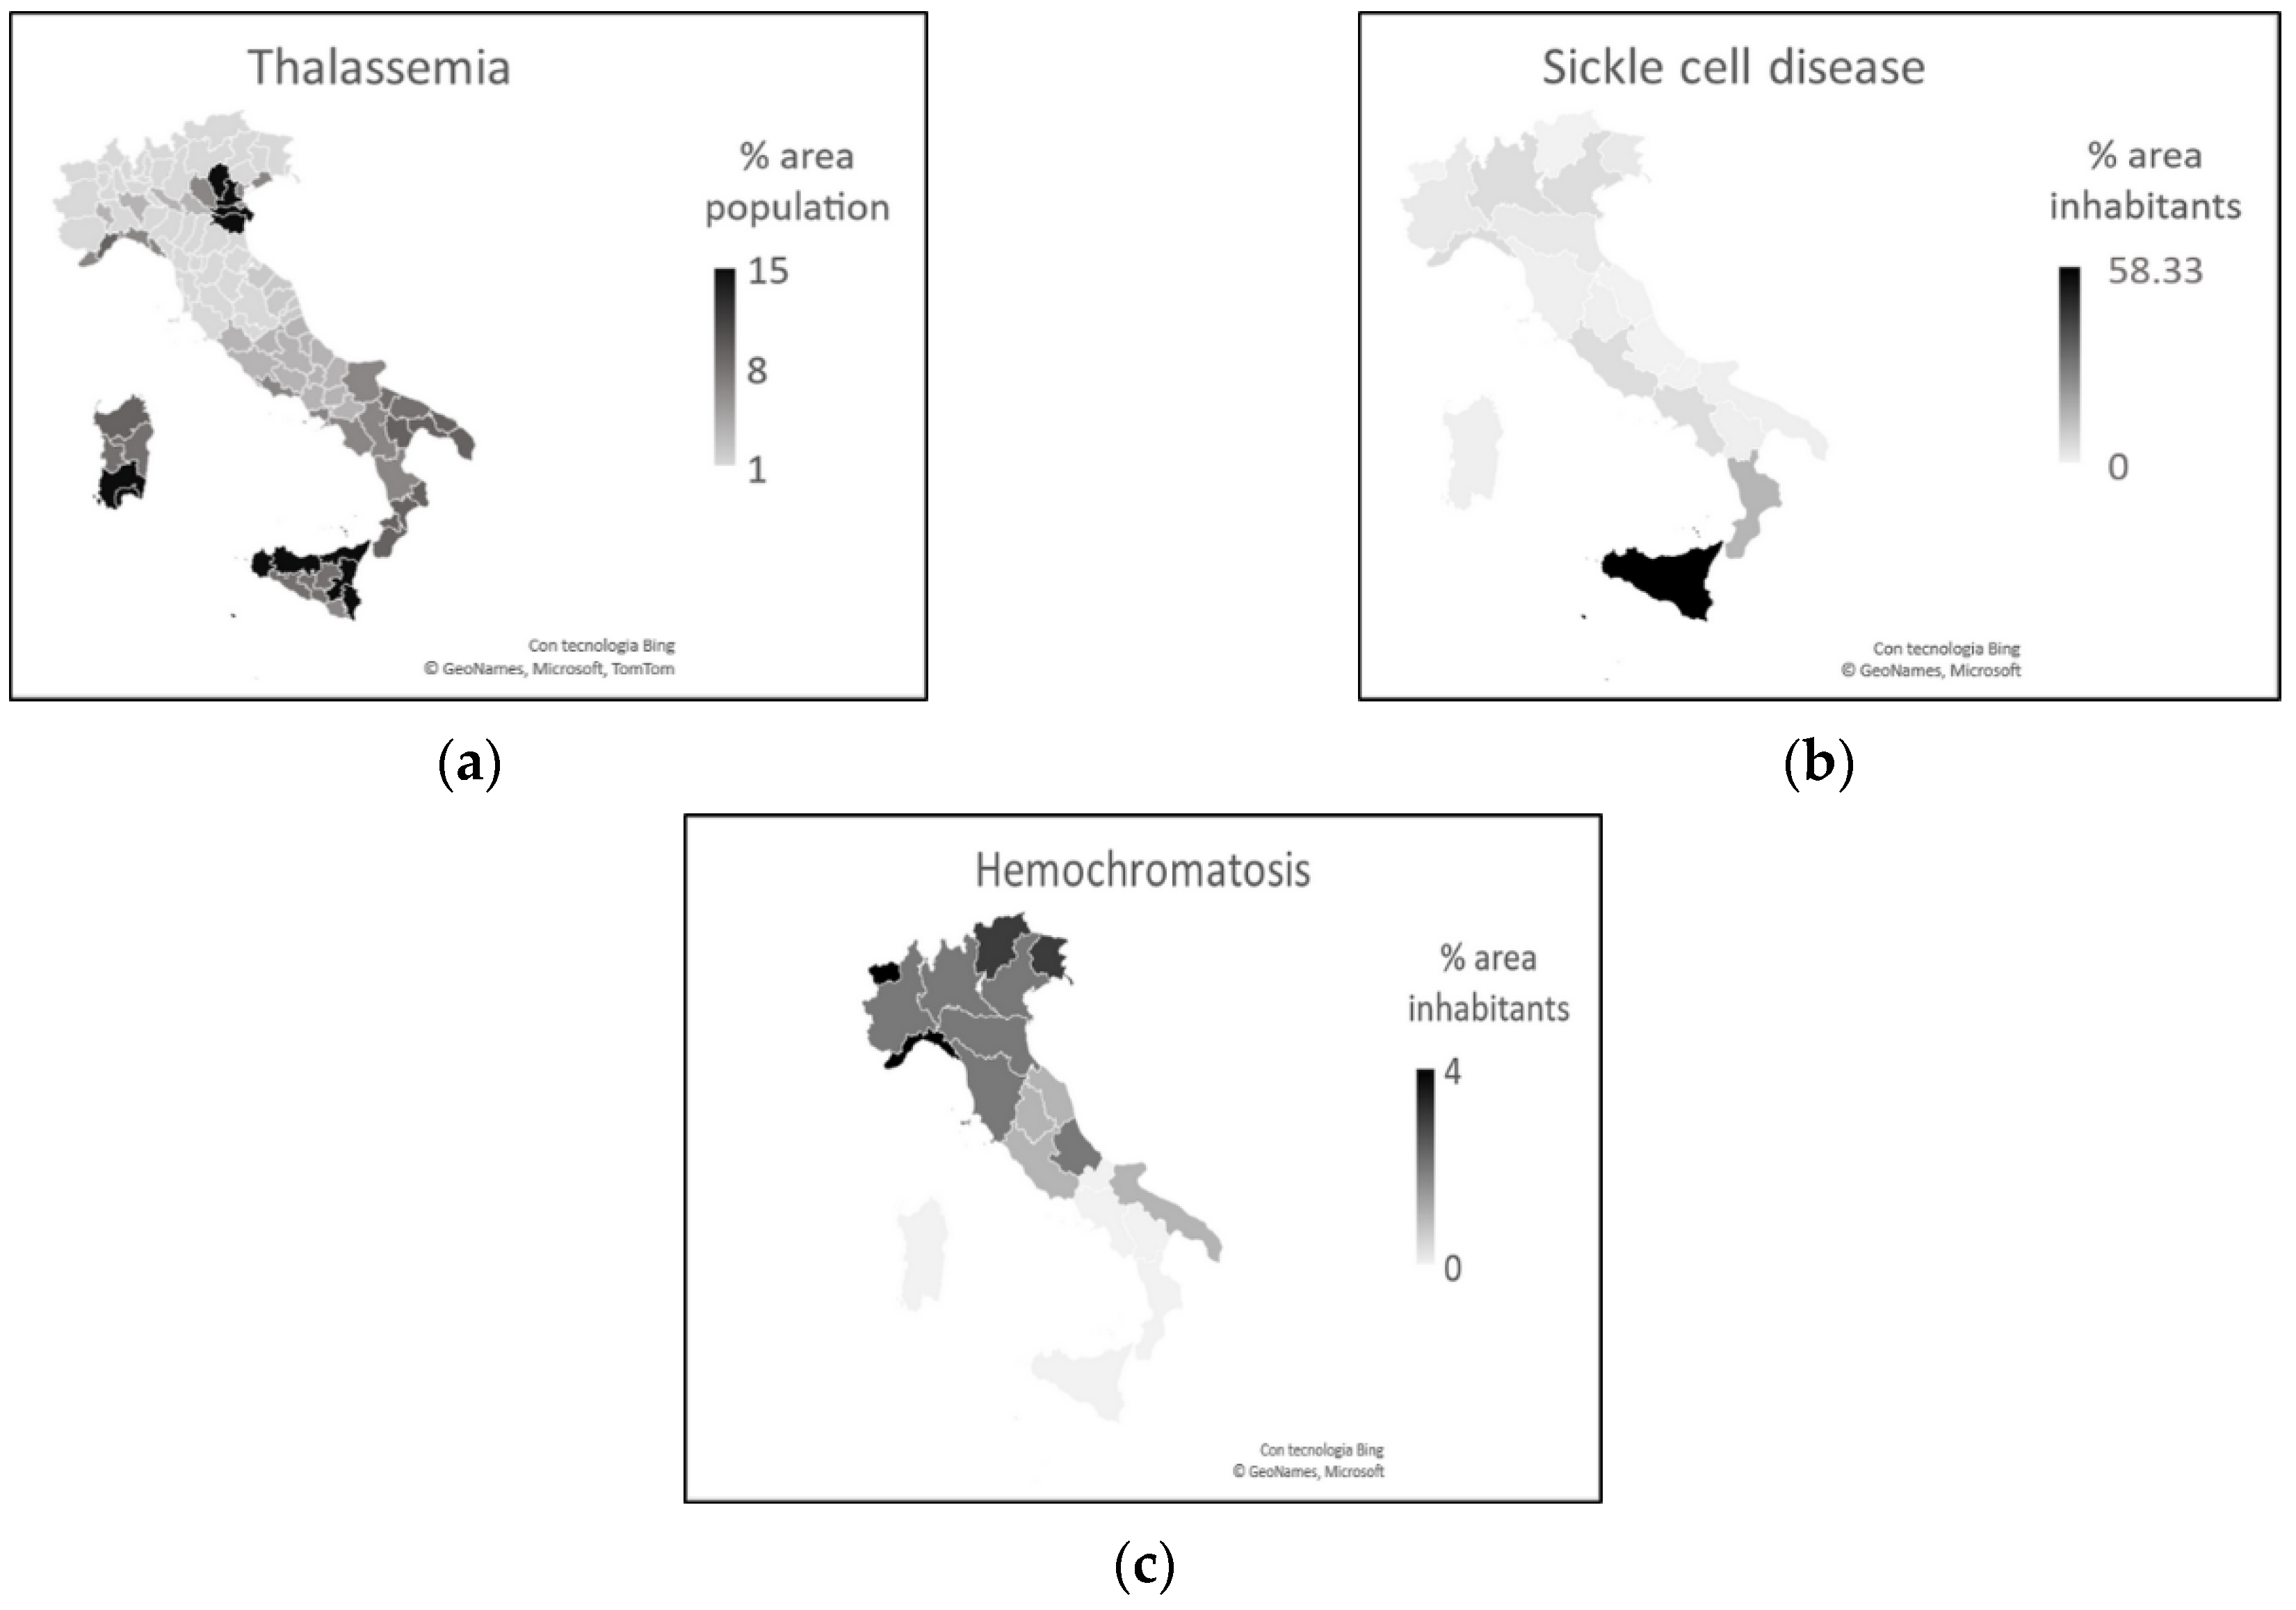
Another aspect seems to be linked to the greater spread of SARS-CoV-2 in the north and less in the south: pathologies related to iron levels in the blood. Southern Italy is part of the thalassemia prevalence area [15,16], and in general, anemia is more common here than in northern Italy [17,18]. Thalassemia is present in the north almost exclusively in southern Veneto and northern Emilia-Romagna, up to 20% of population [15,16,19]. Of the people with anemia, 80% are of predominantly Sicilian origin and from Southern Italy [17].
Figure 6a,b show, respectively, the distribution of thalassemia and anemia in the different areas of Italy. Figure 6c represents the distribution of hemochromatosis in Italy.
Hemochromatosis and other iron overload diseases are more common in the north than in southern Italy. In particular, the spread of these diseases decreases from north to south [20,21,22,23,24,25,26,27].
There is a clear similarity between Figure 1 and Figure 6 of the areas where COVID-19 had the least impact and the areas with the highest rates of people with thalassemia and anemia. That similarity is also present between areas where COVID-19 had a significant impact and areas with higher percentages of people with iron overload disease.
How can these data be explained? Why is the amount of iron in the blood important for SARS-CoV-2?
In the rest of the chapter, we will explore the complex aspect of anemic forms, and as regards iron overload diseases, we can hypothesize that they can favor the contagion and negative outcome of COVID-19 because they are generally associated with other diseases, such as diabetes, hepatic dysfunction, and cardiac dysfunction [26,27], which are all morbidities considered risk factors for the development of severe forms of COVID-19 [1,2,3].
2.2. 17 September 2021
After the first wave of infections, there were two more waves of COVID-19 in Italy until 17 September 2021 [28,29,30,31], and SARS-CoV-2 has continued to mutate [32]. Did the considerations made on the basis of the analysis of the data relating to the first wave remain valid over time?
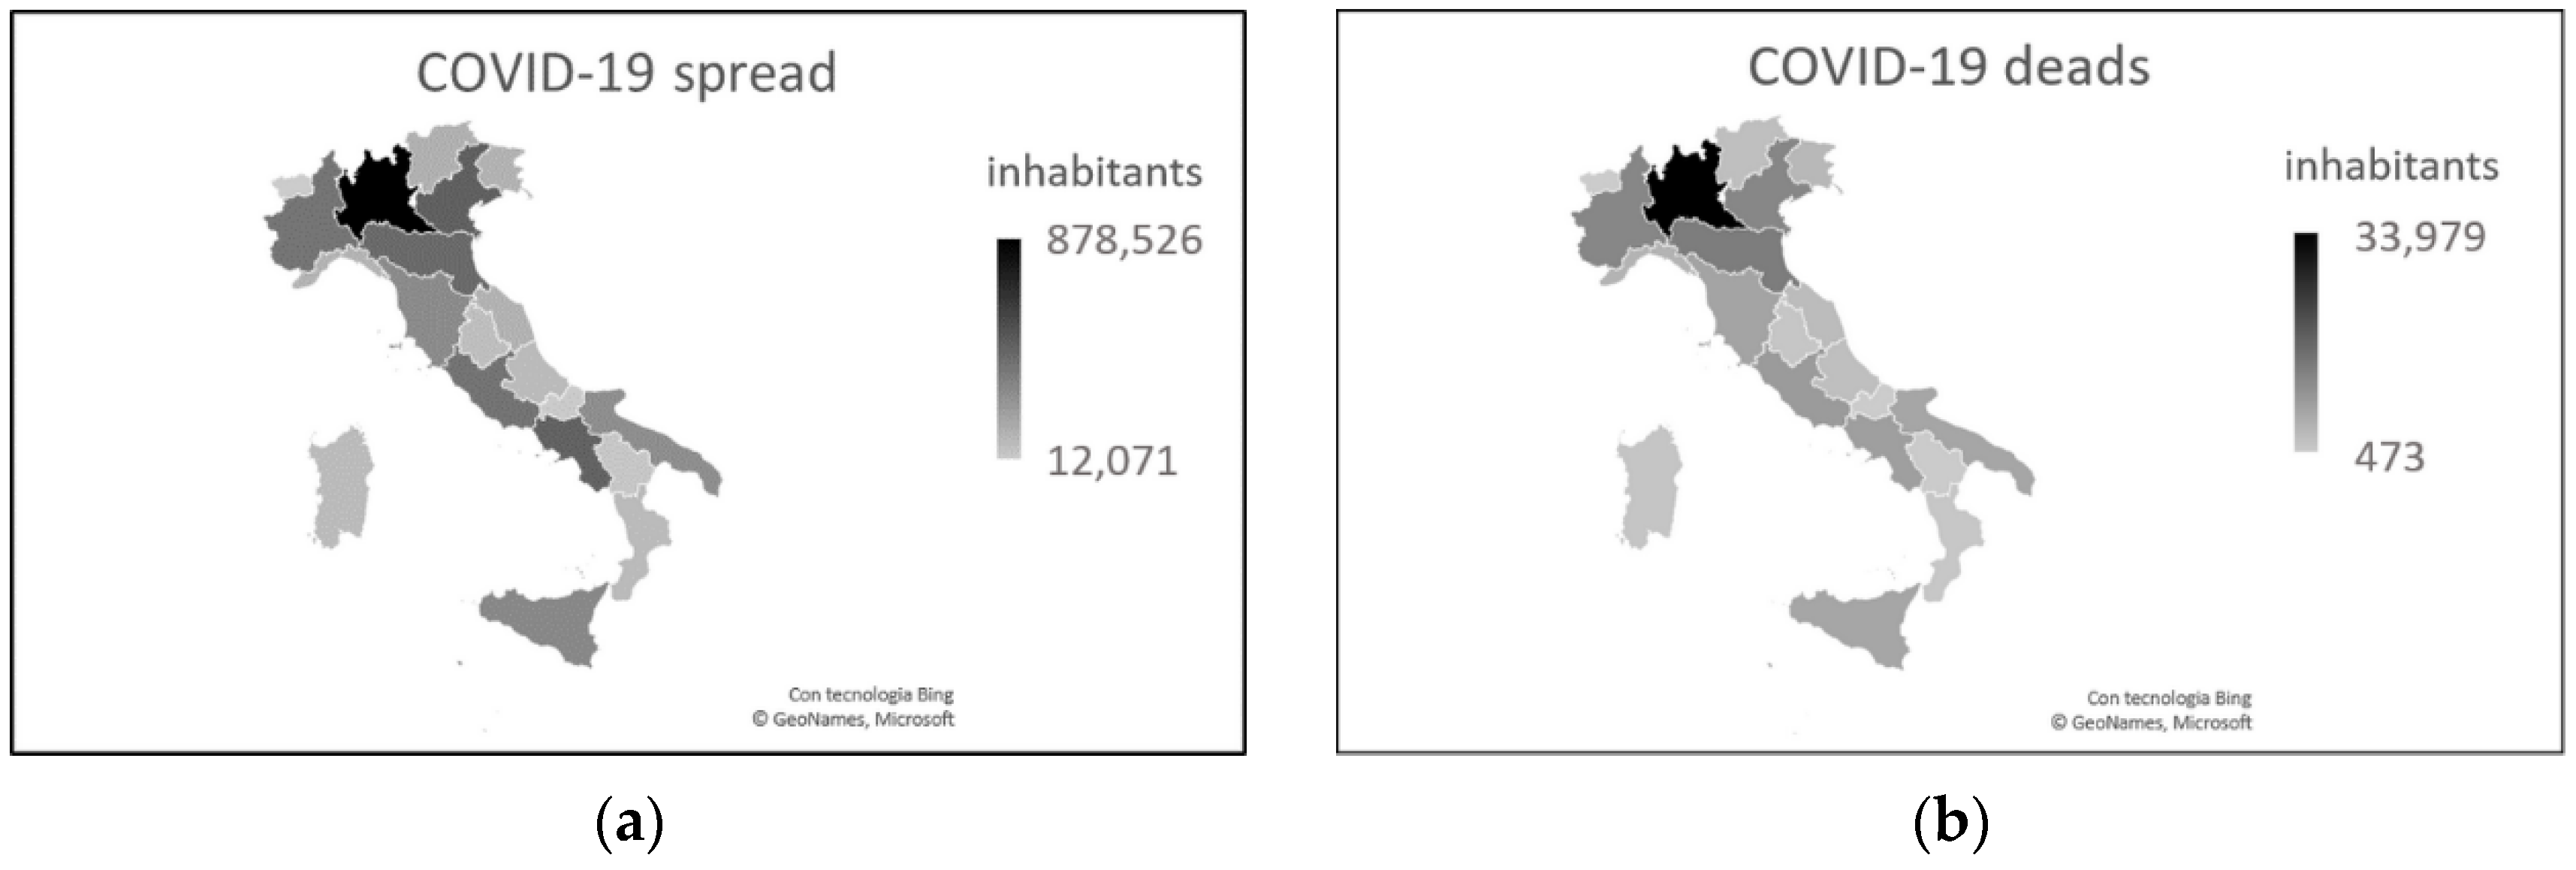
Figure 7 presents the situation of infections and the number of deaths in Italy, as of 17 September 2021, after three waves of infections, with relative lockdowns, and after 6 months from the start of the vaccination campaign.
In some regions of southern Italy, such as Campania, Apulia, and Sicily, the levels of contagion have increased significantly, reaching similar percentages to some regions of northern Italy. However, if we compare the number of infections and deaths with respect to the total population of the different areas, we note that northern Italy continues to be more affected than southern Italy [4]. Furthermore, the number of deaths among patients seems to show a lower aggressiveness of the virus in the south (Table 3).
The disease spread model reflects the percentages of population density, especially considering the large cities of southern Italy. There is also a notable similarity between Figure 7 and Figure 3b and Figure 4, with regards to the age and sex characteristics of the population. The considerations inherent to these two aspects are therefore confirmed, as are those related to BMI, blood groups, and diseases related to the concentration of iron in the blood. It should be noted, in particular, that in the regions of southern Italy that have reached a number of infections similar to that of the northern regions, both the percentage of infections in the total population and the percentage of deaths (in the total population, and in the total of infections) are lower than the same variables in the north (Table 4).
3. What Can Be Concluded by Observing the Italian Situation?
From the data considered, it seems to emerge that, in Italy, despite the spread occurring throughout the national territory, the highest rates of contagion occurred in areas with greater population density, where there was also a greater number of elderly people. In the areas of southern Italy, less affected by the first wave, the spread took place in the later stages. However, the number of infections and mortality rates indicate a lower severity of the disease. An excess of visceral fat accumulation, within the limits of overweight (not obese), seems to have mitigated the effects of the disease. This is also the case with the presence of thalassemia and forms of anemia, while iron overload diseases appear to have worsened the outcome of the disease.
4. Rest of the World
Extending the research done for a small country to the rest of the world may seem pretentious. Each country has its own peculiarities that can tip the balance, in this case, in the number of infections and in the number of deaths from COVID-19.
Given that the aspects examined for Italy are general socio-demographic aspects, the extension of the survey is possible and may prove useful.
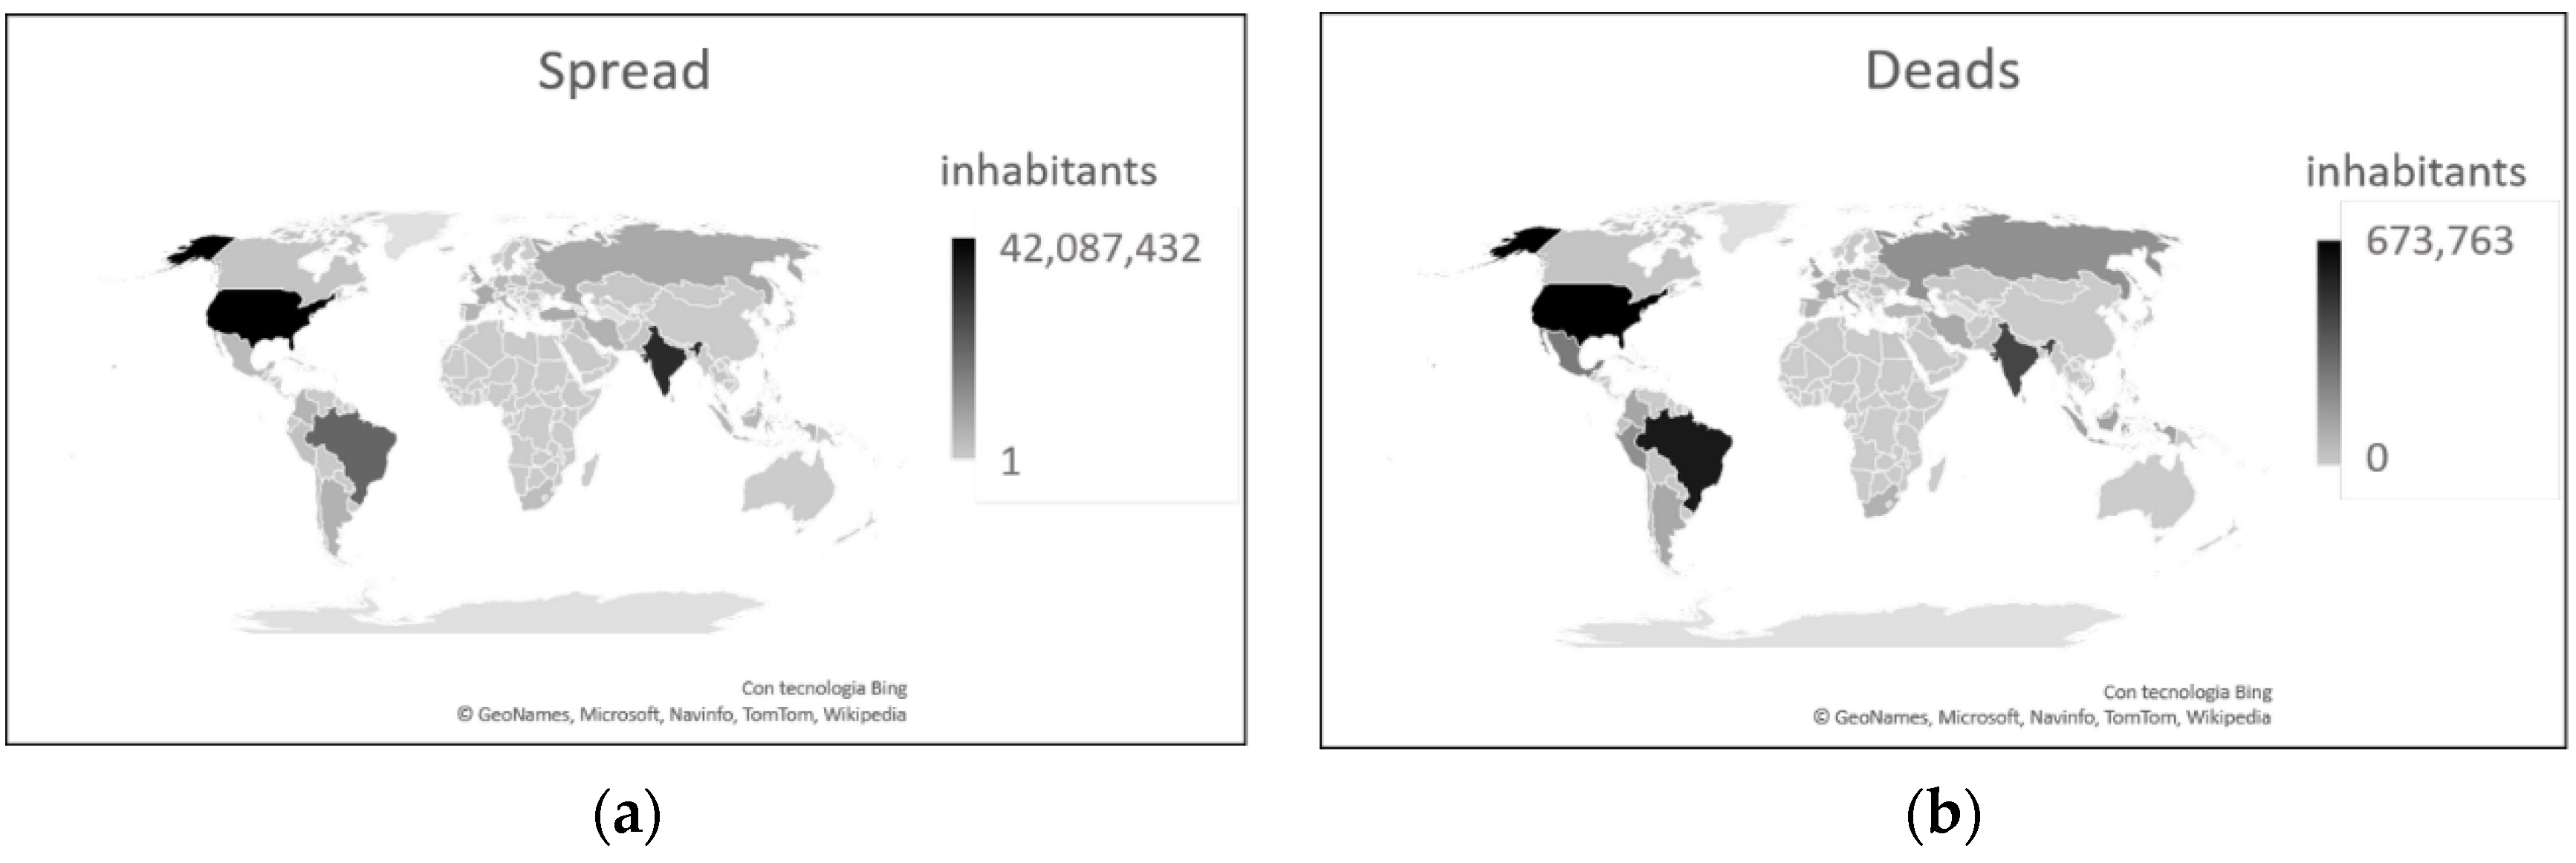
The spread of the COVID-19 pandemic to the rest of the world has not been uniform. As of 17 September 2021, American states have been particularly affected, both in terms of the number of infected and the number of deaths. To this date, the United States and Brazil alone accounted for 27.71% of cases and 26.95% of deaths worldwide. Both of these countries had a higher contagion rate than Italy (12.72% for USA and 9.99% for Brazil vs. 7.83% for Italy), and while Brazil had approximately the same rate of lethality (Brazil 2.79% vs. Italy 2.81%), the United States had a much lower lethality rate than Italy (only 1.60%) [4]. What made the difference?
India, the second country in the world for the number of infections, had an infection rate of 2.43% and a lethality rate of 1.33% [4]. This means that despite the large number of infections and deaths linked to the total number of inhabitants of this country, the virus here seems to have failed to spread and manifest itself in a serious manner. Given the situation in this country, however, it is necessary to use the conditional because it is not possible to be sure that all cases have actually been registered.
The values, however, underline how the pandemic has evolved extremely differently on the American and Asian continents.
Considering African countries, the lowest number of infections in the world was recorded here, despite this continent presenting the highest mortality rate compared to the rest of the world (2.52% vs. 2.05%). The latter figure is undoubtedly linked to health problems and the very low level of assistance available on this continent. It is striking that South Africa alone, the most European of African countries, accounts for 35.32% of infections and 41.83% of deaths on its continent. If the data relating to this country are added to the data relating to Morocco and Tunisia, two other countries that have numerous interactions with Europe, we obtain that the three countries alone represent 55.17% of infections and 60.47% of deaths in Africa [4].
The question arises whether the virus in the first variant that spread in Europe was more aggressive and lethal than the one that arrived in Africa at a later time. There is also the possibility that not all cases from the latter continent are known, and, therefore, it is only possible to estimate the severity of COVID-19 in Africa. There is also, however, the possibility that the population here actually contracted the virus less and developed less severe forms of the disease.
The number of infected and deceased people is shown in Figure 8.
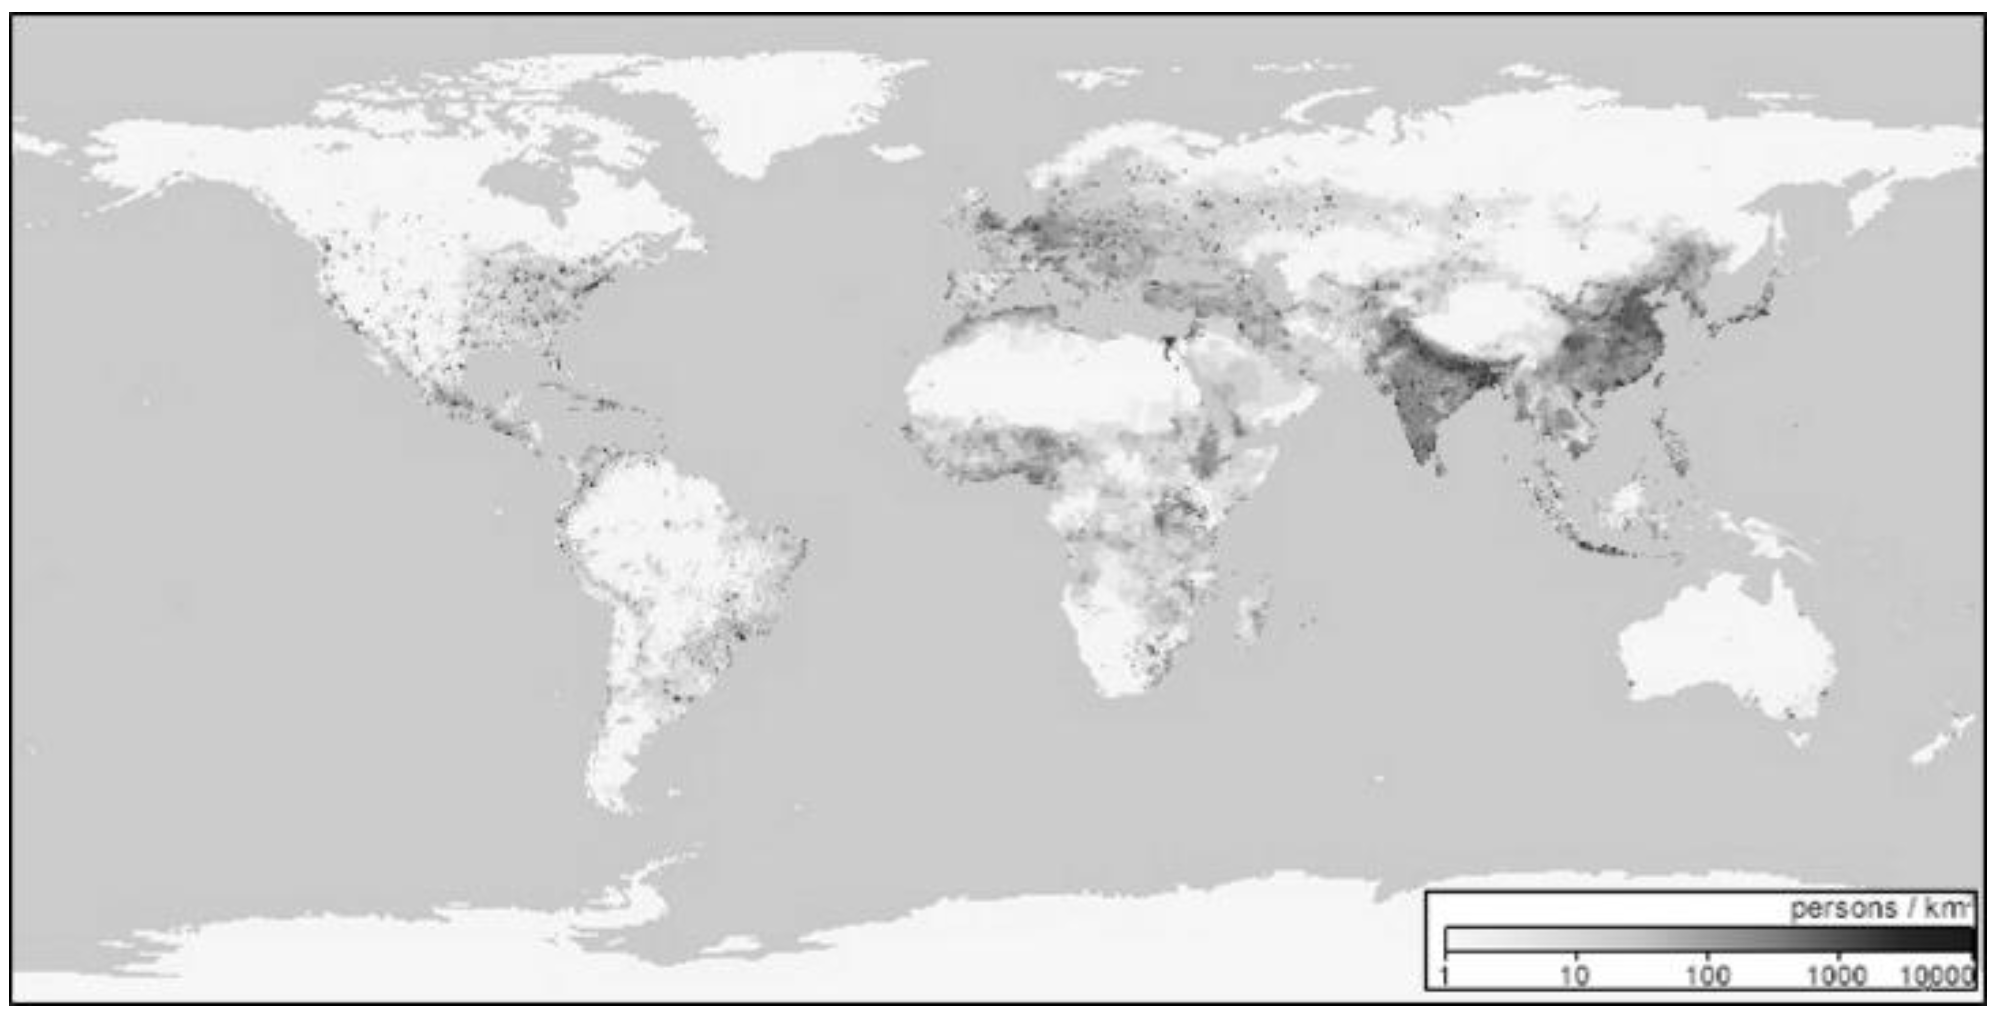
Considering the population density in the world, the highest values are recorded in Europe and Asia. The areas of the world with the lowest population density are Russia, Canada, and some African states (Figure 9) [33,34].
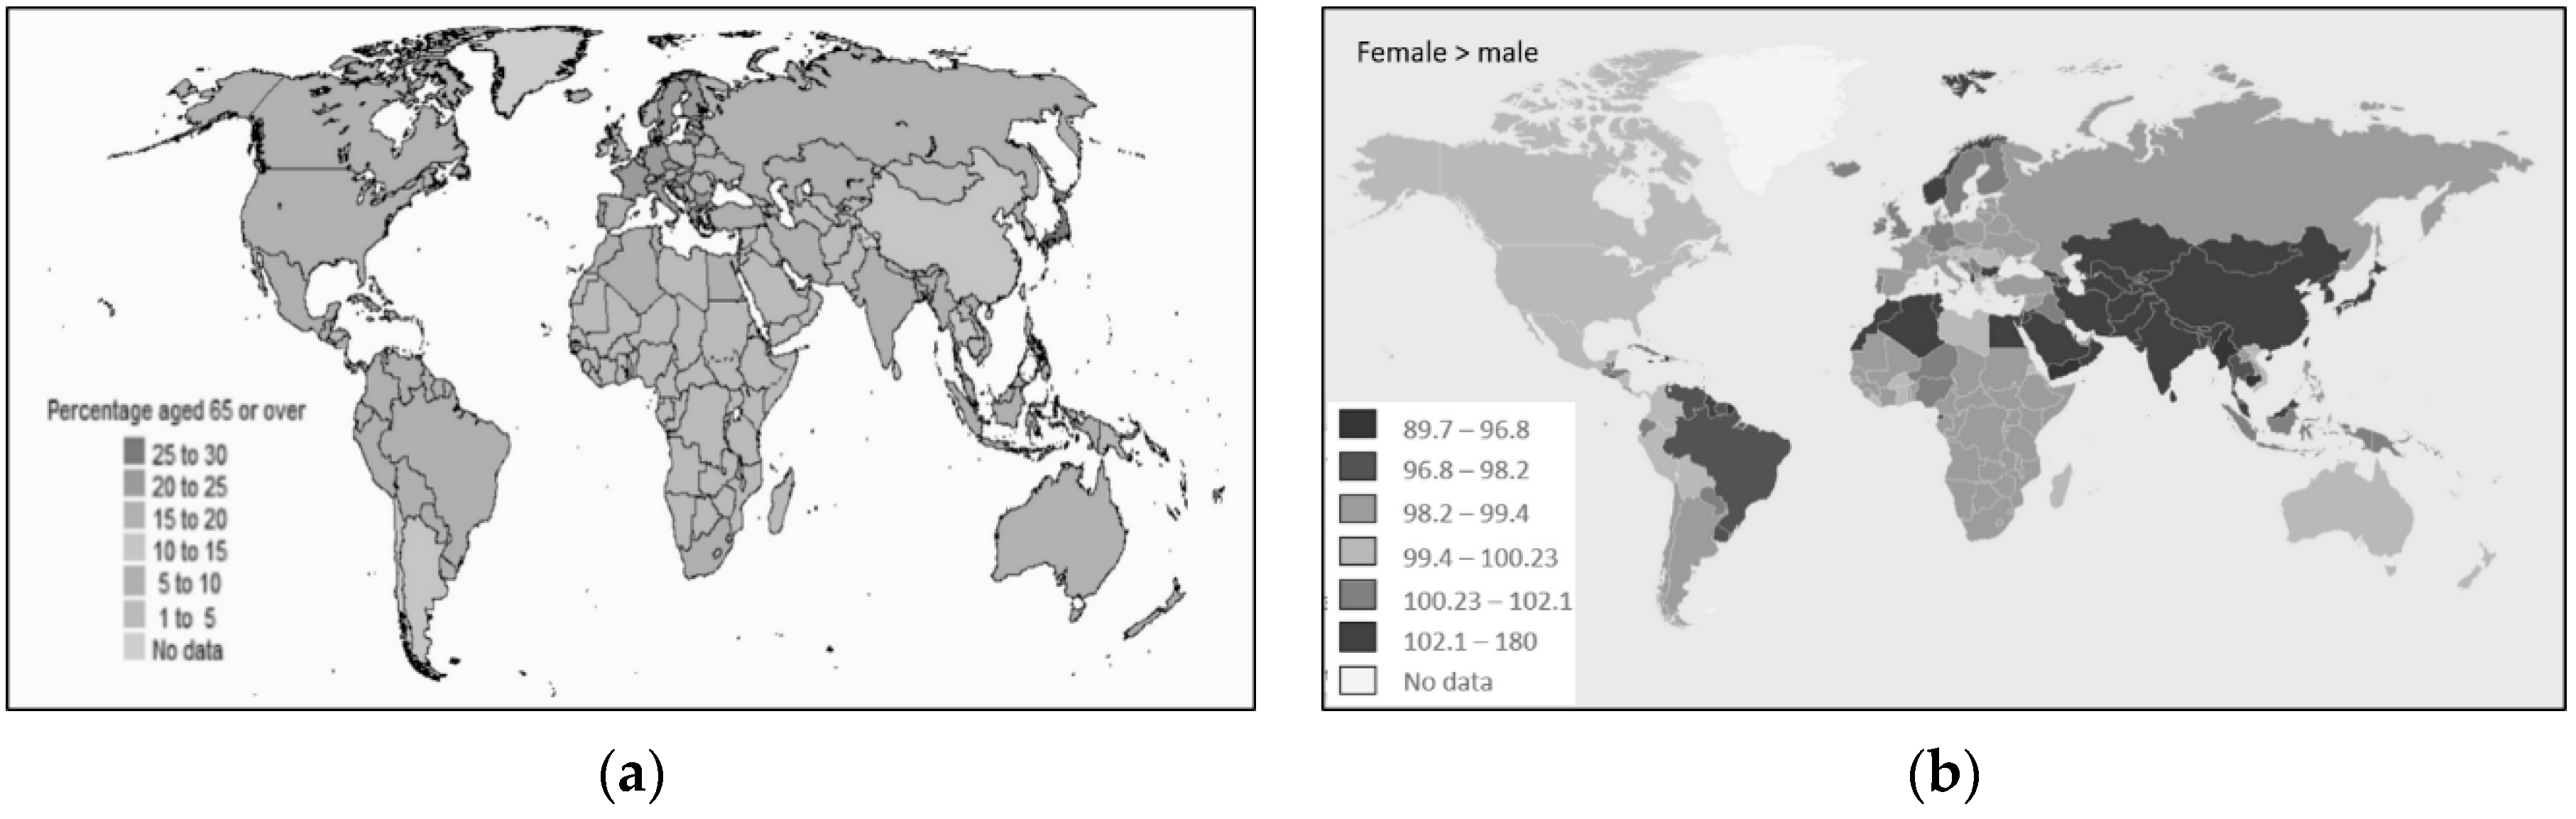
In terms of gender and age of the population, overall, there are a total of 51.6 million more males than females in the world. Up to the age of 54, there are more males than females (143.9 million). Over the age of 54, the trend reverses with 92.3 million more women than men. There are more males than females in Asia and in many North African states, considering both the overall population and the population aged > 64 [35]. People live longer in European countries, Canada, Oceania, and Japan than in African countries [33], and mean age values align with survival rates [33,35]. From this it follows that, in these countries, there are more people aged > 64 years (Figure 10).
The statistics on the age of the population in Italy and in the rest of the world are in line with the spread of COVID-19, which is lower in countries where the average age is lower (e.g., Africa) [33,35]. A different trend is found only in South Asia, where the spread is high compared to Europe [4], despite the average age of the Asian population being lower than that of the European population [33]. However, the death rate in Asia is lower than in Europe [4].
The fact that in the world there is a greater presence of women aged > 64 years compared to males, and that the number of infections is the same between males and females, while it should be higher for women (who are in greater numbers), supports the hypothesis that women are more immune or develop COVID-19 more frequently than males in asymptomatic or paucisymptomatic forms, forms that are not detected. Data on the higher death rate for males than for females [36] seem to confirm a tendency for females to develop less severe forms of the disease.
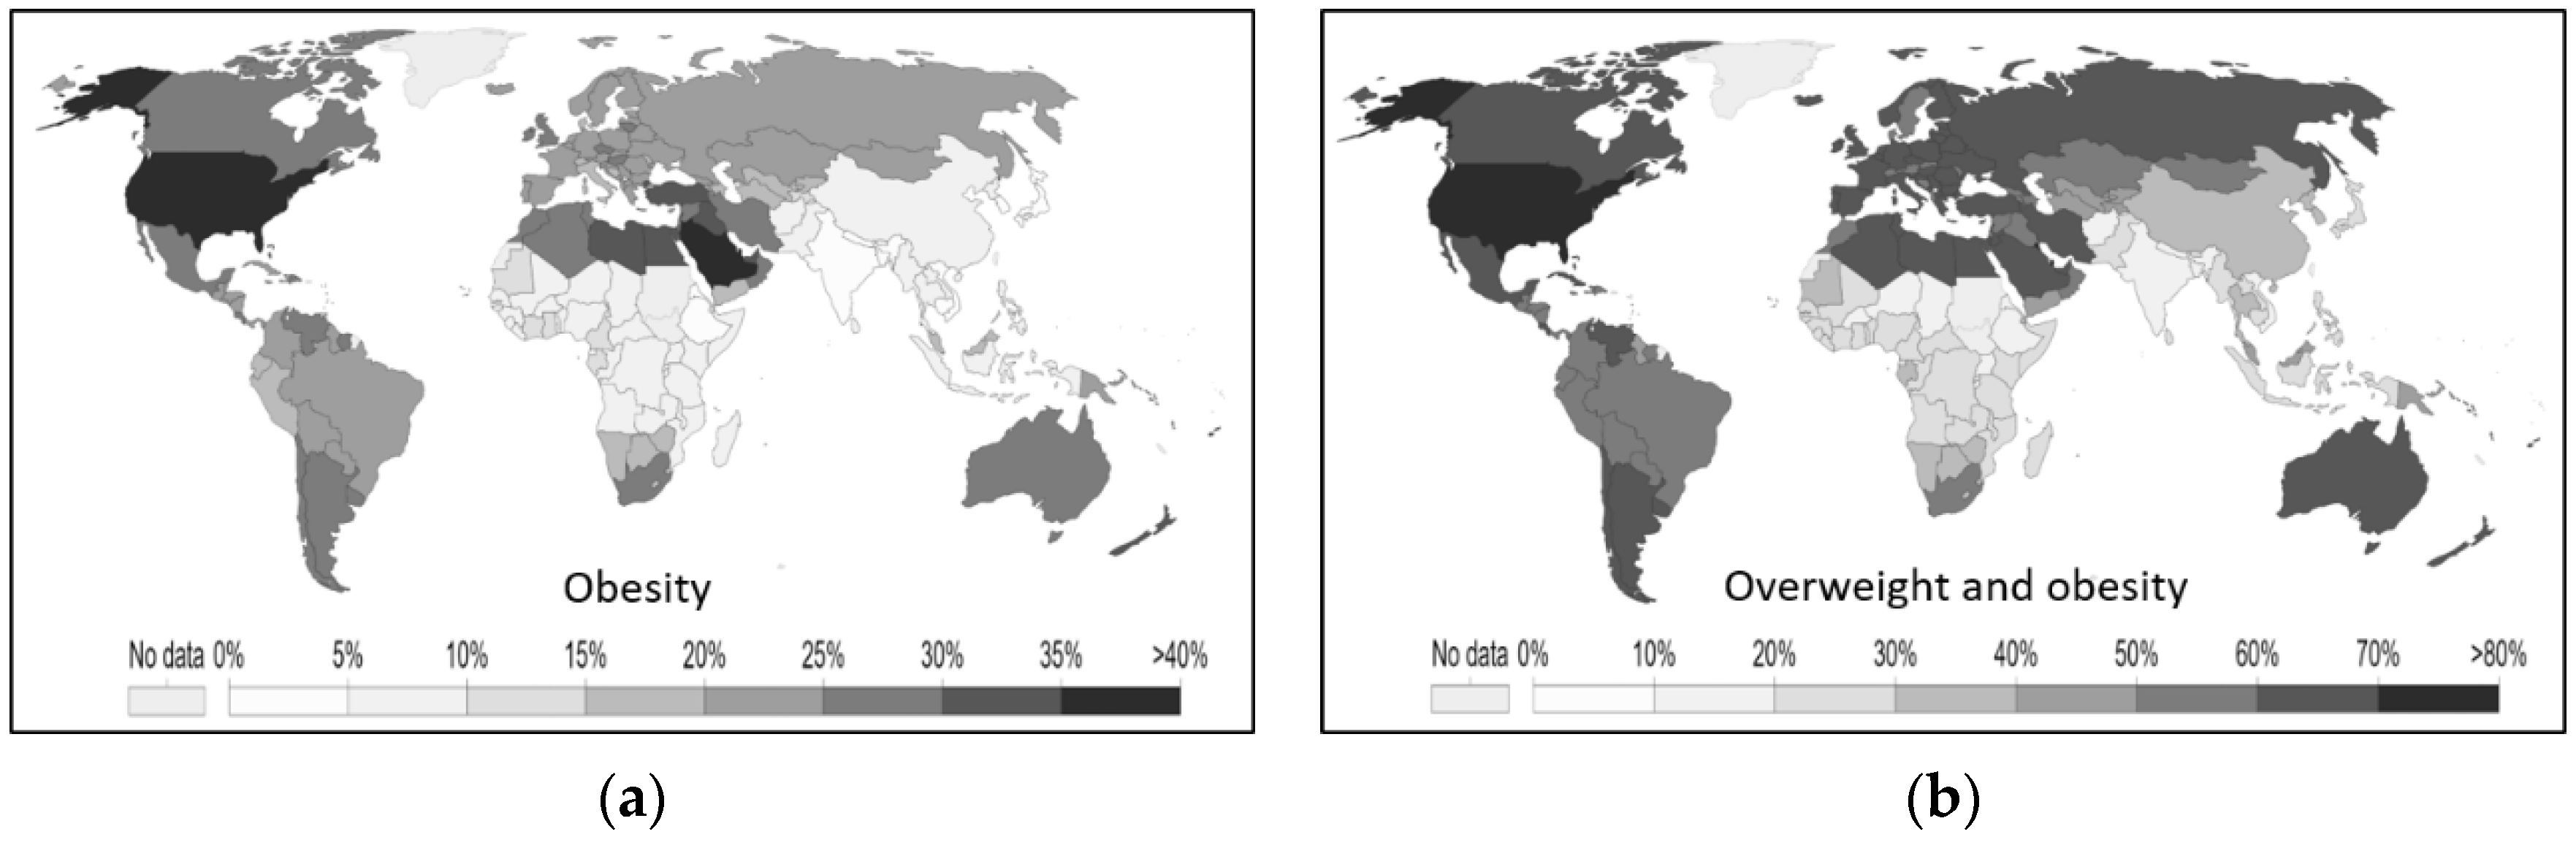
Analyzing data on the weight of the population in the world, the obesity rate is highest in the United States and Saudi Arabia. The problem of obesity is more relevant in the American states, in Europe, in Australia, and in the countries of the Mediterranean area. Problems of malnutrition, on the other hand, are more common in Africa and in the countries of South Asia [37] (Figure 11).
While in Italy the number of infections and deaths seems to indicate excess weight as a protective factor against SARS-CoV-2, the data in the rest of the world do not seem to match. It should be noted that the number of cases of serious and morbid obesity is much lower in Italy than in many other countries of the world [38]. In the United States, where the obesity problem is most severe [37], obesity is listed among the top eight risk factors for COVID-19 [3]. In Europe, where obesity problems, although present, are less prominent than in America, obesity ranks eleventh on the list of risk factors [2]. The spread could affect more obese people in countries where there are actually more obese people. Obesity could, therefore, become a risk factor only when it exceeds a certain degree, such as to induce other pathological states, as it is easier for people aged > 60 years to develop these [39]. There is little data on the impact of obesity on COVID-19 severity [40].
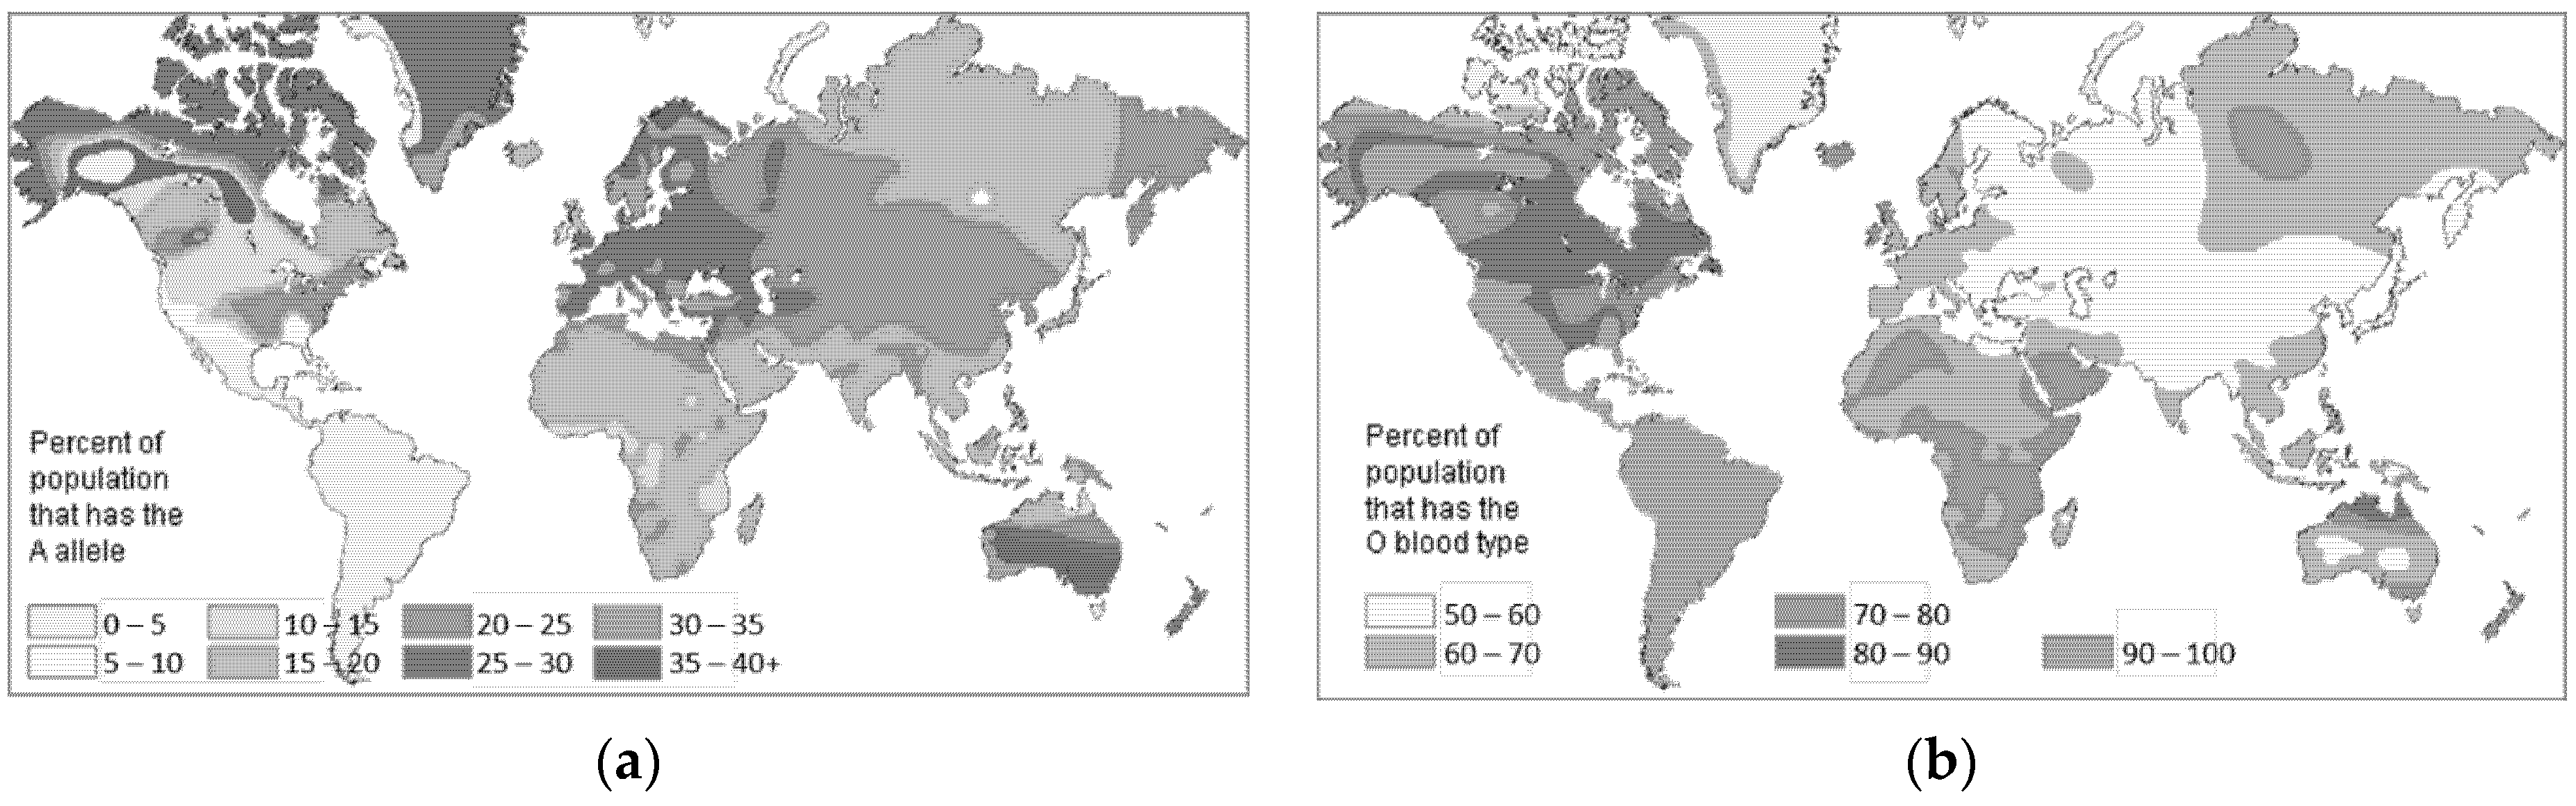
As far as haematological characteristics are concerned, blood group O is the most widespread in the world and is found, in particular, in America, Africa, and eastern Russia. Group A is more common in Europe, Australia, and the far north of America. Group B is the least widespread in the world and is found in Asia, Eastern Europe, and, to a lesser extent, Africa (Figure 12) [41].
In Italy, the different distribution of blood groups between north and south confirms the greater susceptibility to COVID-19 in people with blood type A compared to people with blood type O. The prevalence of blood group O and not A in Chinese, American, and African populations seems to explain why, despite the high number of infections, the mortality rate is relatively low [42].
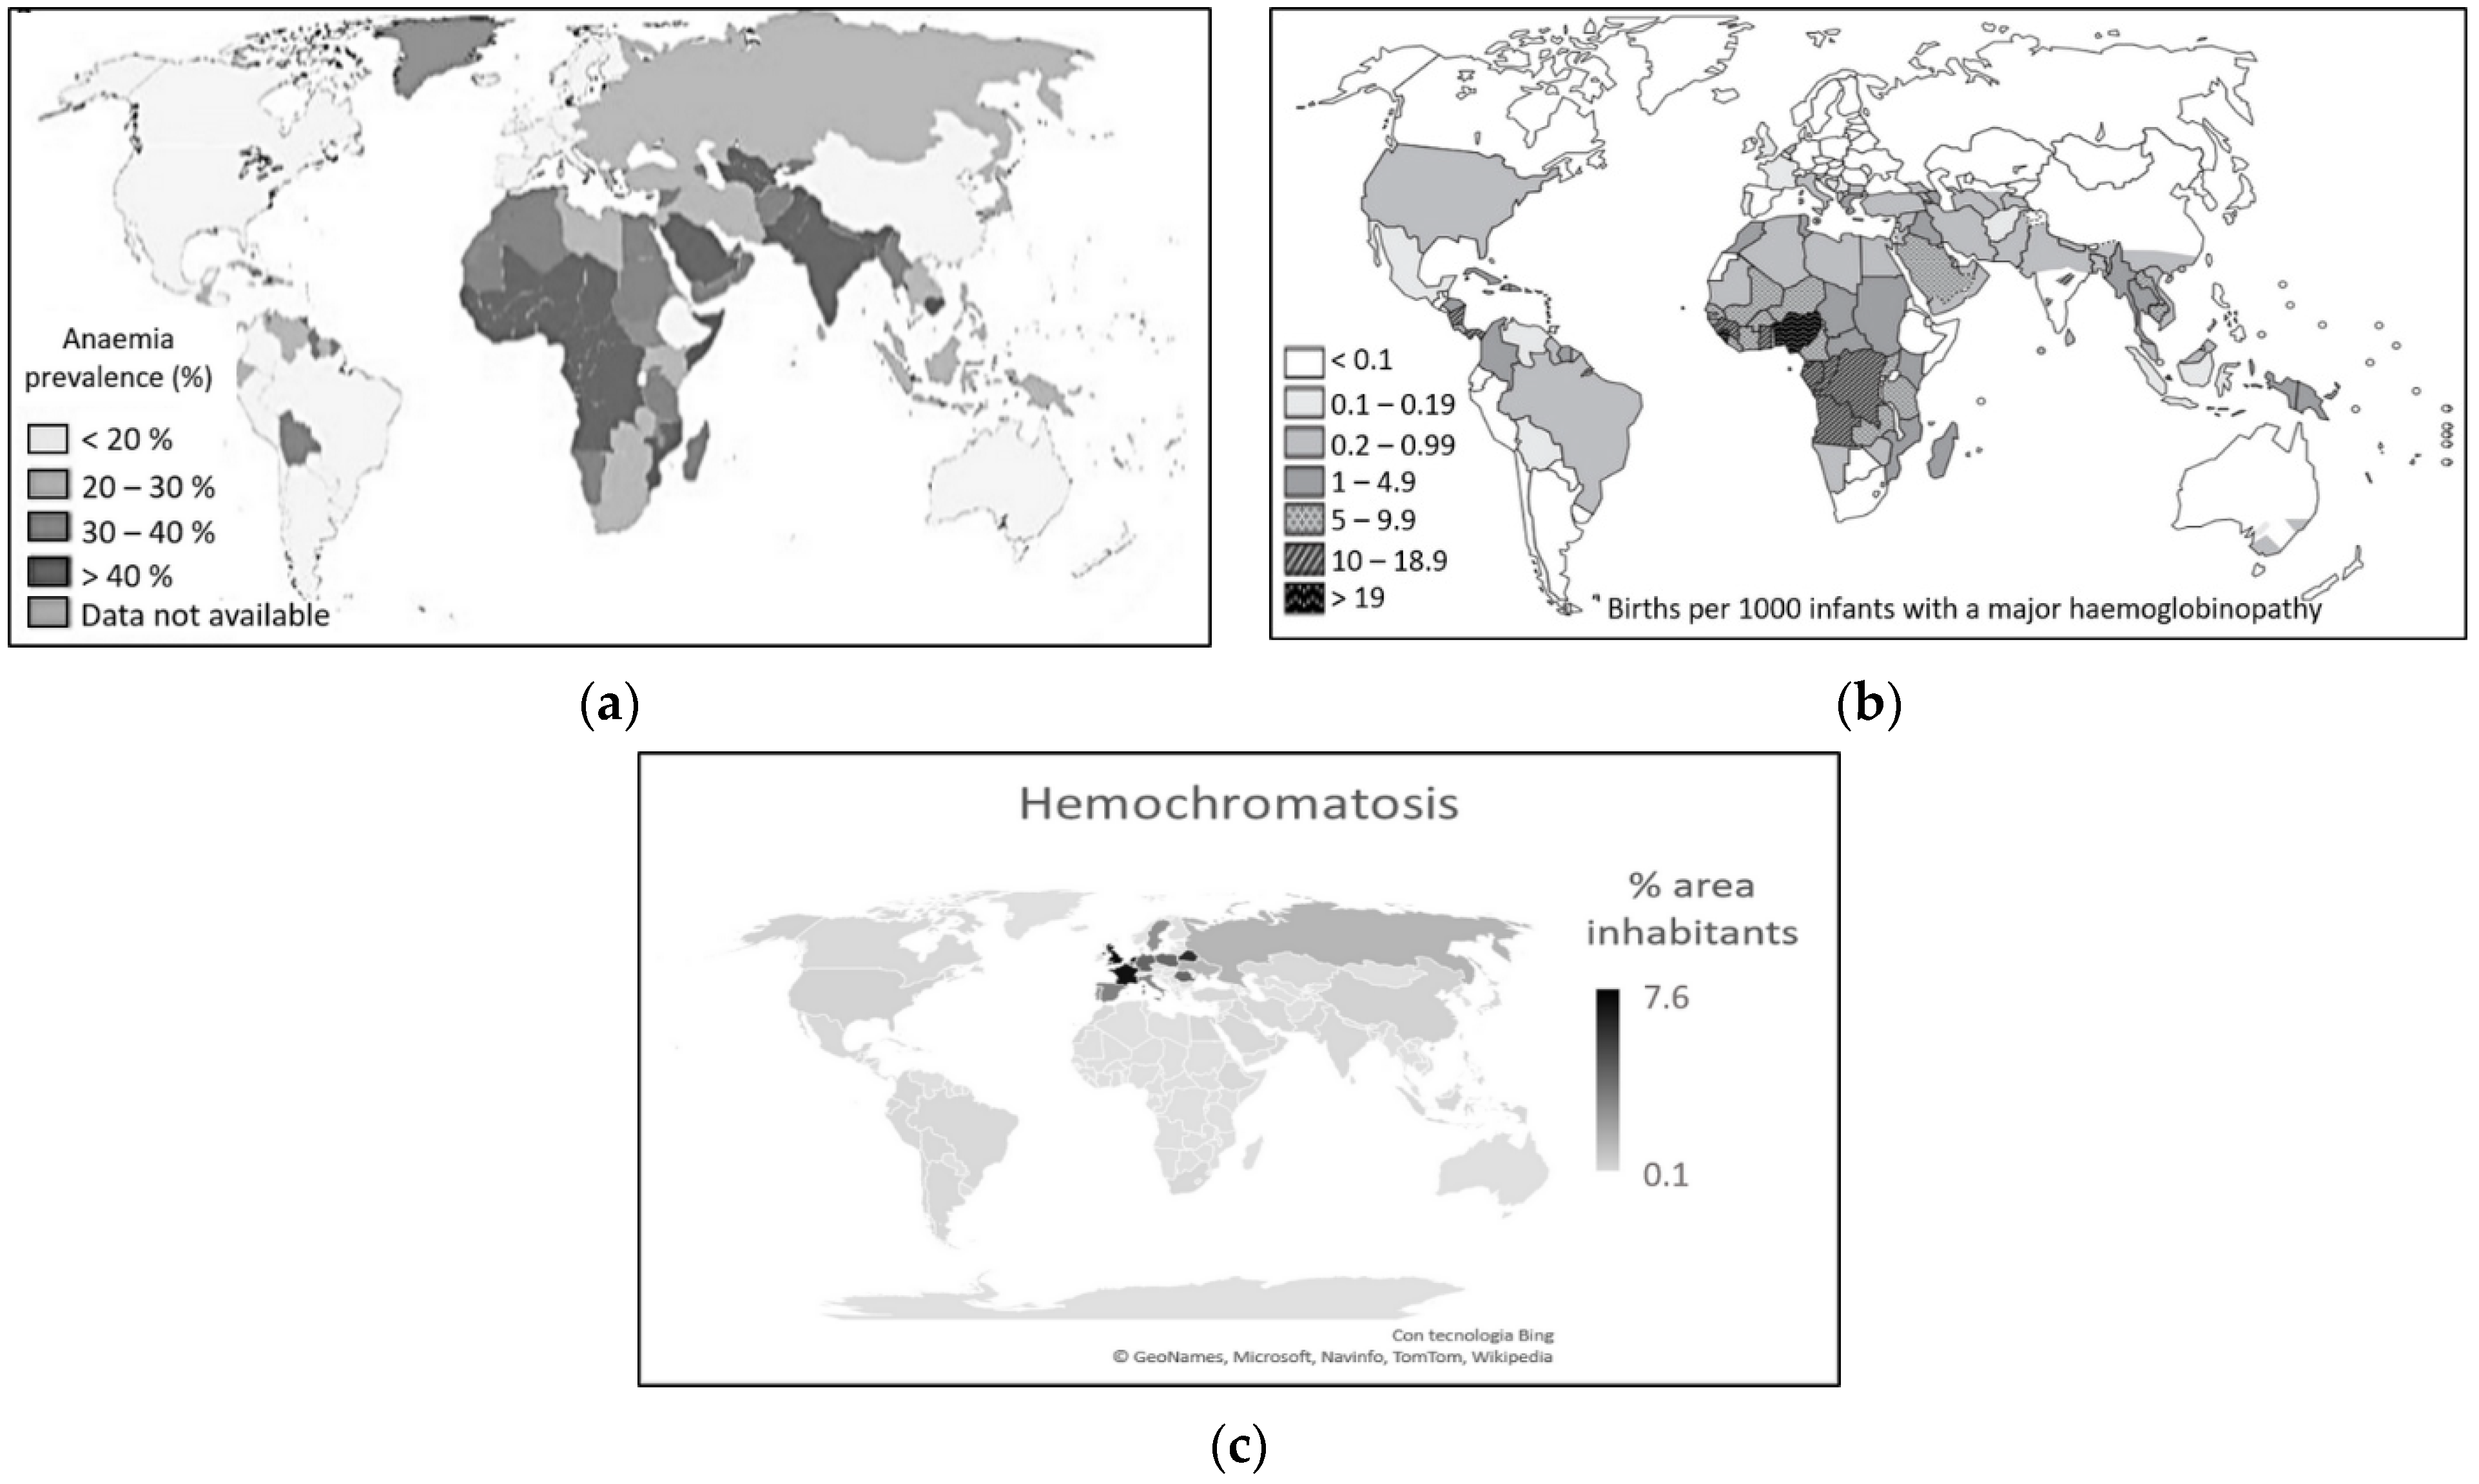
All the considerations made so far do not explain why SARS-CoV-2 affects more men and older people. The data relating to the incidence of hemochromatosis in northern Italy and anemia and thalassemia in the south seem to answer this question [15,16,17,19,21,22,23,24,25,26,27]. In Europe, the countries of the Mediterranean area, where anemic forms prevail among the population [43,44], record lower mortality rates than the countries of Northern Europe, where iron overload diseases are more frequent (Figure 13) [23,24,25,26,27].
This is despite the fact that the rates of contagion among the population are sometimes higher in the countries of the Mediterranean area than in the countries of northern Europe [4]. Here, on the other hand, hemochromatosis and iron overload diseases are more frequent [46]. For these diseases, the incidence decreases progressively in non-Hispanic whites, Native Americans, blacks, Pacific Islanders, up to Asians, in which they are practically absent [47]. Conversely, Asians, particularly from the south-east; Africans; and populations of the eastern Mediterranean area are more prone to diseases such as thalassemia and forms of anemia [42,43,44,45]. Even in American countries, data on blood group distribution [41] and incidence of iron overload disease [25] and forms of anemia [43,44] appear to be related to a reduced death rate from COVID-19 [4].
Hemochromatosis causes excessive absorption of iron by the intestine, resulting in the accumulation of this metal in other organs and tissues. Males show much more frequent and more severe symptoms than women, with the first manifestations of the disease between the ages of 40 and 50. In women, before menopause, the clinical picture is ten times less frequent than in men due to the loss of iron during menstruation and during pregnancy. Therefore, women develop signs and symptoms of hemochromatosis-related organ damage approximately 10 years after men [48]. This could really be linked to the greater severity of COVID-19 in males, more prone to pathological forms linked to the accumulation of iron in the body.
Extremely interesting is the relationship that seems to exist between the levels of iron present in people’s blood, both in terms of deficiency and in terms of excess, and the severity of COVID-19. Many viruses have been shown to hijack cells for replication, and efficient replication requires an iron-filled host [49,50]. Indeed, iron-filled cells turn out to be good sites for viruses. Conditions such as hemochromatosis or iron overload disease, in which the serum iron level is increased, compromise host defenses and increase susceptibility to various infectious diseases [50]. In populations where the incidence of hemochromatosis is high, a virus such as SARS-CoV-2 could find a perfect environment to live in, causing the disease to spread widely. In thalassemic and anemic subjects, on the other hand, the proliferation of the virus would be more difficult, in the former due to cyclic blood transfusions (15–20 days) associated with chelating agents (to eliminate the abnormal accumulation of iron in the organs) which is commonly used as a therapy and causes blood purification [42], and in the latter due to the absence of iron.
The data in the literature seem to confirm these observations [51,52]. However, anemic patients are not immune to COVID-19 and, if infected, their picture is immediately severe [53]. On the other hand, the inflammatory state induced by SARS-CoV-2 [54], which worsens with the duration of the disease [55], is often accompanied by systemic hypoferritinemia [56,57]. This obviously strongly compromises an already anemic patient.
The particular link between COVID-19 and blood, and the iron contained in it, really seems to explain why women have a lower death rate than men, but also why children are less affected than adults. In fact, in children, the rates of anemia are very high [43,44]. It is, however, mandatory to use the conditional, since this disease can be defined in many ways, except simple, the greater or lesser mortality in a country is not attributable to a single factor.
It should be emphasized that the resistance of anemic subjects to COVID-19 has been observed by other researchers. Particular attention was paid to sickle cell disease (SCD), which we analyze below.
5. Sickle Cell Disease and COVID-19
There are several forms of anemia dependent on different causes. There may be anemia due to excess bleeding, such as in the case with pregnancy and breastfeeding, some surgeries, and trauma. There may be sickle cell anemia and hemolytic anemias due to excessive destruction of red blood cells. There can be aplastic anemias due to reduced or impaired production of red blood cells and hemoglobin, as in the case of nutritional deficiencies (iron, vitamin B12, and folic acid) or diseases (which induce poor absorption of iron, vitamin B12, and folic acid), such as Crohn’s disease or celiac disease.
SCD is particular because it is a genetic disease. If people with SCD were truly immune to COVID-19, then we would have a favorable genetic condition against this disease. Some genetic diseases are known to show resistance to some infectious diseases [58], and in this case, the term heterozygous advantage is used. SCD already presents the heterozygous advantage over falciparum malaria [59,60]. Could it be that it also has this advantage against COVID-19?
We analyzed the data available in literature on the incidence and lethality of COVID-19 for subjects with SCD. We performed a literature search on the PubMed database, considering all the works published from the beginning of the pandemic until March 2021, one year after the diffusion of COVID-19 in Italy. For the research, we used the terms “sickle cell,” “COVID-19,” and “SARS-CoV-2.” Non-English articles, articles that did not contain patient numbers, and articles for which full text could not be obtained were excluded. With the literature research, we identified ninety-two articles, and, applying the exclusion criteria, we selected 43 articles. Among these, 28 studies were single case or case reports with a limited number of patients (≤10 patients).
Of particular interest is the study of de Sanctis et al. [51], conducted on 9499 patients with hemoglobinopathies, followed in 17 centers in 10 different countries. Only 13 patients contracted SARS-CoV-2, with an incidence of 0.14%. Other studies in adults [61,62,63,64] and children [62,64,65] showed a favorable outcome of COVID-19, with milder clinical presentations than the general population had [61,62,63,66]. The published data are such as to raise the question of whether SCD really increases the risk of SARS-CoV-2 infection [67] or, conversely, may be a protective factor against COVID-19 [62,68,69,70].
Opinions contrary to the previous observations were found in Minniti et al. [71], and Panepinto et al. [72], which reported a worsening of the course of COVID-19 in patients with SCD, and in three other studies [73,74,75], which reported no differences in either symptomatology or outcome between subjects with and without SCD from COVID-19.
Possible factors that may play a role in the adaptation of the immune response of SCD patients to COVID-19 were well elucidated in Azerad et al. [68], and citations in other articles are summarized in Table 5.
Unfortunately, it is not possible to perform a statistical analysis because some articles are mini-reviews where there are duplicate values.
The lack of data is, however, compatible with a very low incidence of SARS-CoV-2 in patients with SCD. This value could actually indicate a lower susceptibility of these patients to contract the virus, although the causes of this lower propensity are not yet certain. However, this value could only be linked to greater prevention and protection of these subjects, followed in national reference centers, which often have tightened the health protocols necessary for patient care and adopted forms of remote monitoring and support through applications of telemedicine. The same patients, aware of their fragility, have adopted more careful behaviors and have correctly used individual protection tools (for example face masks) since the beginning of the COVID-19 pandemic. These attentions have undoubtedly contributed to a lower incidence of SARS-CoV-2 in these subjects.
Regarding the lower severity of COVID-19, in Table 5, we have summarized some of the hypotheses that have already been formulated to explain this finding, but further studies are needed to clarify this aspect. In fact, to date, the data present in the literature are mainly statistical or hypothetical.
6. Conclusions
There is no doubt that until September 2021, women and especially children had a lower susceptibility to SARS-CoV-2 and developed COVID-19 less severely than men. The causes of this are unclear. All these subjects can fall into the category of asymptomatic or paucisymptomatic subjects. None of these individuals are truly immune to COVID-19.
There are multiple factors that determine susceptibility to a virus and the severity of a disease. In this chapter, we have analyzed various socio-demographic aspects. Two unexpected factors that deserve further investigation are the correlation with body fat and the amount of iron in the blood. Evidence related to SCD also indicates that genetics play a role, perhaps not a secondary one.
Undoubtedly, it is the overlap of the aspects considered in this chapter and of many other socio-demographic aspects that determine the consequences of the COVID-19 in people affected.
7. Highlights
- SARS-CoV-2 has spread more to areas with higher population density and an older population.
- Although women and men had the same infection rate, the former developed less severe forms of COVID-19.
- Children appear to be immune to SARS-CoV-2 and/or manifest COVID-19 predominantly in asymptomatic and paucisymptomatic forms.
- In Italy, an excess of visceral fat accumulation, within the limits of overweight or mildly obese, seems to have mitigated the outcome of COVID-19.
- Worldwide, excess visceral fat in non-mild forms of obesity appears to have worsened the outcome of COVID-19, possibly due to obesity-related conditions.
- Worldwide, the presence of thalassemia and forms of anemia appear to have mitigated the effects of COVID-19.
- Worldwide, iron overload diseases appear to have worsened the outcome of COVID-19.
Author Contributions
Conceptualization, S.V. and A.S.; investigation, S.V. and A.S.; writing—original draft preparation, S.V. and A.S.; writing—review and editing, S.V. and A.S. All authors have read and agreed to the published version of the manuscript.
Funding
This research received no external funding.
Data Availability Statement
The data presented in this study are publicly available on the various Internet sites cited in the work. The links are present in the references.
Conflicts of Interest
The authors declare no conflict of interest.
Entry Link on the Encyclopedia Platform
References
- World Health Organization. COVID-19: Vulnerable and High Risk Groups. Available online: https://www.who.int/westernpacific/emergencies/covid-19/information/high-risk-groups (accessed on 8 September 2021).
- ECDPC-European Centre for Disease Prevention and Control. COVID-19 Surveillance Report. Updated 2 September 2021. Available online: https://covid19-surveillance-report.ecdc.europa.eu/#5_risk_groups_most_affected (accessed on 8 September 2021).
- CDC-Centers for Disease Control and Prevention, U.S. Department of Health and Human Service. Underlying Medical Conditions Associated with High Risk for Severe COVID-19: Information for Healthcare Providers. Updated 13 May 2021. Available online: https://www.cdc.gov/coronavirus/2019-ncov/hcp/clinical-care/underlyingconditions.html (accessed on 8 September 2021).
- Lab24, Il Sole 24 Ore. Coronavirus in Italy: Updated Map and Case Count. 2021. Available online: https://lab24.ilsole24ore.com/coronavirus/en/ (accessed on 9 September 2021).
- “Coronavirus, Conte: “In Italia Fino al 25 Marzo Chiusi i Negozi Tranne Alimentari e Farmacie. Sui Trasporti Possibili Riduzioni. Effetti tra 14 Giorni”” [Coronavirus, Conte: “In Italy until March 25, Shops Except Food and Pharmacies are Closed. Possible Reductions on Transport. Effects for 14 Days”]. La Repubblica (In Italian). Available online: https://www.repubblica.it/politica/2020/03/11/news/coronavirus_conte_italia_governo_misure-250988471/?ref=RHPPTP-BL-I250988111-C12-P1-S1.12-T1 (accessed on 11 March 2020).
- “Italy Extends Lockdown until May 3rd Despite Pressure from Business”. The Local.it. 2020. Available online: https://www.thelocal.it/20200410/italy-set-to-extend-lockdown-until-early-may/ (accessed on 11 April 2020).
- UrbiStat, S.r.l. Maps, Analysis and Statistics about the Resident Population. 2019. Available online: https://ugeo.urbistat.com/AdminStat/it/it/demografia/dati-sintesi/italia/380/1 (accessed on 13 September 2021).
- The COVID-19 Task Force of the Department of Infectious Diseases and the IT Service, Italian Higher Institute of Health. COVID-19 Integrated Surveillance Data in Italy. 2021. Available online: https://www.epicentro.iss.it/en/coronavirus/sars-cov-2-dashboard (accessed on 13 September 2021).
- COVID-19 Surveillance Group, Italian Higher Institute of Health. Characteristics of COVID-19 Patients Dying in Italy. Report Based on Available Data on 21 July 2021. Available online: https://www.epicentro.iss.it/en/coronavirus/bollettino/Report-COVID-2019_21_july_2021.pdf (accessed on 13 September 2021).
- Osservatorio Nazionale Sulla Salute Nelle Regioni Italiane. Rapporto Osservasalute 2020. Fumo, Alcol, Alimentazione, Eccesso Ponderale e Prevenzione. Updated 17 May 2021. Available online: https://www.osservatoriosullasalute.it/osservasalute/rapporto-osservasalute-2020 (accessed on 13 September 2021).
- Severe Covid-19 GWAS Group; Ellinghaus, D.; Degenhardt, F.; Bujanda, L.; Buti, M.; Albillos, A. Genomewide association study of severe Covid-19 with respiratory failure. N. Engl. J. Med. 2020, 383, 1522–1534. [Google Scholar] [CrossRef] [PubMed]
- Anstee, D.J. The relationship between blood groups and disease. Blood 2010, 115, 4635–4643. [Google Scholar] [CrossRef]
- Cooling, L. Blood groups in infection and host susceptibility. Clin. Microbiol. Rev. 2015, 28, 801–870. [Google Scholar] [CrossRef]
- AVIS Comunale Forlì. I Gruppi Sanguigni. Available online: https://www.avisforli.it/gruppi-sanguigni-avis-forli_34c18.html (accessed on 13 September 2021).
- Mento, C.; Piraino, B.; Rizzo, A.; Vento, R.; Rigoli, L.; Moschella, E.; Salpietro, C.; Settineri, S. Affective control and life satisfaction in thalassemics. Int. J. Psychol. Res. 2015, 8, 90–97. [Google Scholar] [CrossRef]
- Associazione PieraCutino. La Talassemia in Cifre. Available online: http://www.pieracutino.it/la-talassemia-in-cifre/ (accessed on 13 September 2021).
- Russo-Mancuso, G.; Romeo, M.A.; Guardabasso, V.; Schilirò, G. Survey of sickle cell disease in Italy. Haematologica 1998, 83, 875–881. [Google Scholar]
- Russo, G.; De Franceschi, L.; Colombatti, R.; Rigano, P.; Perrotta, S.; Voi, V.; Palazzi, G.; Fidone, C.; Quota, A.; Graziadei, G.; et al. Current challenges in the management of patients with sickle cell disease—A report of the Italian experience. Orphanet. J. Rare Dis. 2019, 14, 120. [Google Scholar] [CrossRef] [PubMed]
- Del Senno, L.; Pirastu, M.; Barbieri, R.; Bernardi, F.; Buzzoni, D.; Marchetti, G.; Perrotta, C.; Vullo, C.; Kan, Y.W.; Conconi, F. beta (+)-Thalassaemia in the Po river delta region (northern Italy): Genotype and beta globin synthesis. J. Med. Genet. 1985, 22, 54–58. [Google Scholar] [CrossRef]
- Serre, J.L. Diagnostic Techniques in Genetics; John Wiley & Sons: Hoboken, NJ, USA, 2007. [Google Scholar]
- Piperno, A.; Sampietro, M.; Pietrangelo, A.; Arosio, C.; Lupica, L.; Montosi, G.; Vergani, A.; Fraquelli, M.; Girelli, D.; Pasquero, P.; et al. Heterogeneity of hemochromatosis in Italy. Gastroenterology 1998, 114, 996–1002. [Google Scholar] [CrossRef]
- De Gobbi, M.; D’Antico, S.; Castagno, F.; Testa, D.; Merlini, R.; Bondi, A.; Camaschella, C. Screening selected blood donors with biochemical iron overload for hemochromatosis: A regional experience. Haematologica 2004, 89, 1161–1167. [Google Scholar]
- Lucotte, G.; Dieterlen, F. A European allele map of the C282Y mutation of hemochromatosis: Celtic versus Viking origin of the mutation? Blood Cells Mol. Dis. 2003, 31, 262–267. [Google Scholar] [CrossRef]
- Distante, S.; Robson, K.J.; Graham-Campbell, J.; Arnaiz-Villena, A.; Brissot, P.; Worwood, M. The origin and spread of the HFE-C282Y haemochromatosis mutation. Hum. Genet. 2004, 115, 269–279. [Google Scholar] [CrossRef]
- Ulvik, R.J. Hereditary haemochromatosis through 150 years. Tidsskr. Nor. Legeforen. 2016, 136, 2017–2021. [Google Scholar] [CrossRef] [PubMed]
- Arthritis Research. Type 1 Haemochromatosis. Available online: https://www.arthritisresearch.us/haemolytic-anaemia/type-1-haemochromatosis.html (accessed on 13 September 2021).
- TeamHaem. Case 71–Summary. Available online: https://teamhaem.com/2017/01/27/case-71-summary/ (accessed on 13 September 2021).
- Tondo, L. Italy at a Crossroads as Fears Grow of Covid-19 Second Wave. The Guardian. 2020. Available online: https://www.theguardian.com/world/2020/aug/19/italy-at-a-crossroads-as-fears-grow-of-covid-19-second-wave (accessed on 20 August 2020).
- Boffey, D.; Carroll, R.; Connolly, K.; Giuffrida, A.; Henley, J.; Jones, S.; Oltermann, P.; Rankin, J.; Smith, H.; Walker, S.; et al. As Covid Cases Rise Again, How Are Countries in Europe Reacting? The Guardian. 2020. Available online: https://www.theguardian.com/world/2020/sep/23/as-covid-cases-rise-again-how-are-countries-in-europe-reacting (accessed on 24 September 2020).
- BBC News. Covid-19: Italy Returns to Strict Lockdown for Easter. 2021. Available online: https://www.bbc.com/news/world-europe-56621342 (accessed on 4 April 2021).
- Kington, T. A Year after COVID-19 Slammed Italy, a Third Wave Is Making It Deja vu All Over Again. Los Angeles Time. 2021. Available online: https://www.latimes.com/world-nation/story/2021-03-19/italy-deja-vu-year-after-coronavirus-first-hit (accessed on 20 March 2021).
- DeSimone, D.C. COVID-19 Variants: What’s the Concern?-What’s the Concern about the New COVID-19 Variants? Are They More Contagious? Mayo Foundation for Medical Education and Research (MFMER). FAQ-20505779. 2021. Available online: https://www.mayoclinic.org/diseases-conditions/coronavirus/expert-answers/covid-variant/faq-20505779 (accessed on 10 September 2021).
- UN—United Nations, Department of Economic and Social Affairs, Population Division. World Population Prospects 2019. Online Edition. Rev. 1. Available online: https://population.un.org/wpp/Download/Standard/Population/ (accessed on 24 September 2021).
- NEO—NASA Earth Observations. Population Density. Available online: https://neo.sci.gsfc.nasa.gov/view.php?datasetId=SEDAC_POP (accessed on 24 September 2021).
- CIA—Central Intelligence Agency—United States of America. The World Factbook. Available online: https://www.cia.gov/the-world-factbook/ (accessed on 24 September 2021).
- UN Women—United Nations Women. COVID-19: Emerging Gender Data and Why It Matters. Available online: https://data.unwomen.org/resources/covid-19-emerging-gender-data-and-why-it-matters (accessed on 24 September 2021).
- Ritchie, H.; Roser, M. Obesity. Published Online at OurWorldInData.org. Available online: https://ourworldindata.org/obesity (accessed on 24 September 2021).
- NCD-RisC—Non-Communicable Disease-Risk Factor Collaboration. Adult Body-Mass Index. Available online: http://ncdrisc.org/data-visualisations-adiposity.html (accessed on 24 September 2021).
- Seidu, S.; Gillies, C.; Zaccardi, F.; Kunutsor, S.K.; Hartmann-Boyce, J.; Yates, T.; Singh, A.K.; Davies, M.J.; Khunti, K. The impact of obesity on severe disease and mortality in people with SARS-CoV-2: A systematic review and meta-analysis. Endocrinol. Diabetes Metab. 2020, 4, e00176. [Google Scholar] [CrossRef] [PubMed]
- Peres, K.C.; Riera, R.; Martimbianco, A.L.C.; Ward, L.S.; Cunha, L.L. Body Mass Index and Prognosis of COVID-19 Infection. A Systematic Review. Front. Endocrinol. 2020, 11, 562. [Google Scholar] [CrossRef]
- O’Neil, D. Modern Human Variation: An Introduction to Contemporary Human Biological Diversity. Distribution of Blood Types. Available online: https://www2.palomar.edu/anthro/vary/vary_3.htm (accessed on 24 September 2021).
- Modell, B.; Darlison, M. Global epidemiology of haemoglobin disorders and derived service indicators. Bull. World Health Organ. 2008, 86, 480–487. [Google Scholar] [CrossRef] [PubMed]
- WHO—World Health Organization. The Global Prevalence of Anaemia in 2011. Available online: https://apps.who.int/iris/bitstream/handle/10665/177094/9789241564960_eng.pdf (accessed on 24 September 2021).
- Benoist, B.; McLean, E.; Egll, I.; Cogswell, M. Worldwide Prevalence of Anaemia 1993–2005: WHO Global Database on Anaemia. Available online: http://apps.who.int/iris/bitstream/handle/10665/43894/9789241596657_eng.pdf?sequence=1 (accessed on 24 September 2021).
- WHO—World Health Organization. Global Distribution of Haemoglobin Disorders, in Terms of Births of Affected Infants per 1000 Births. Available online: https://www.who.int/genomics/public/Maphaemoglobin.pdf (accessed on 10 January 2022).
- Adams, D.M.; Reboussin, J.C.; Barton, C.E.; McLaren, C.E.; Eckfeldt, J.H.; McLaren, G.D.; Dawkins, F.W.; Acton, R.T.; Harris, E.L.; Gordeuk, V.R.; et al. Hemochromatosis and iron-overload screening in a racially diverse population. N. Engl. J. Med. 2005, 352, 1769–1778. [Google Scholar] [CrossRef]
- Zacharski, L.R.; Ornstein, D.L.; Woloshin, S.; Schwartz, L.M. Association of age, sex, and race with body iron stores in adults: Analysis of NHANES III data. Am. Heart J. 2000, 140, 98–104. [Google Scholar] [CrossRef] [PubMed]
- Powell, L.W.; Seckington, R.C.; Deugnier, Y. Haemochromatosis. Lancet 2016, 388, 706–716. [Google Scholar] [CrossRef]
- Drakesmith, H.; Prentice, A. Viral infection and iron metabolism. Nat. Rev. Microbiol. 2008, 6, 541–552. [Google Scholar] [CrossRef]
- Khan, F.A.; Fisher, M.A.; Khakoo, R.A. Association of hemochromatosis with infectious diseases: Expanding spectrum. Int. J. Infect. Dis. 2007, 11, 482–487. [Google Scholar] [CrossRef]
- de Sanctis, V.; Canatan, D.; Corrons, J.L.V.; Karimi, M.; Daar, S.; Kattamis, C.; Soliman, A.T.; Wali, Y.; Alkindi, S.; Huseynov, V.; et al. Preliminary data on COVID-19 in patients with hemoglobinopathies: A multicentre ICET-A study. Mediterr. J. Hematol. Infect. Dis. 2020, 12, e2020046. [Google Scholar] [CrossRef] [PubMed]
- Motta, I.; Migone De Amicis, M.; Pinto, V.M.; Balocco, M.; Longo, F.; Bonetti, F.; Gianesin, B.; Graziadei, G.; Cappellini, M.D.; De Franceschi, L.; et al. SARS-CoV-2 infection in beta thalassemia: Preliminary data from the Italian experience. Am. J. Hematol. 2020, 95, E198–E199. [Google Scholar] [CrossRef] [PubMed]
- Mendy, A.; Apewokin, S.; Wells, A.A.; Morrow, A.L. Factors associated with hospitalization and disease severity in a racially and ethnically diverse population of COVID-19 patients. MedRxiv 2020. [Google Scholar] [CrossRef]
- Huang, I.; Pranata, R.; Lim, M.A.; Oehadian, A.; Alisjahbana, B. C-reactive protein, procalcitonin, D-dimer, and ferritin in severe coronavirus disease-2019: A meta-analysis. Ther. Adv. Respir. Dis. 2020, 14, 1753466620937175. [Google Scholar] [CrossRef] [PubMed]
- Zhou, F.; Yu, T.; Du, R.; Fan, G.; Liu, Y.; Liu, Z.; Xiang, J.; Wang, Y.; Song, B.; Gu, X.; et al. Clinical course and risk factors for mortality of adult inpatients with COVID-19 in Wuhan, China: A retrospective cohort study. Lancet 2020, 395, 1054–1062. [Google Scholar] [CrossRef]
- Litton, E.; Lim, J. Iron metabolism: An emerging therapeutic target in critical illness. Crit. Care. 2019, 23, 81–88. [Google Scholar] [CrossRef]
- Northrop-Clewes, C.A. The Interpretation of Indicators of Iron Status during an Acute Phase Response. Annex 4 in Assessing the Iron Status of Populations, 2nd ed.; WHO: Geneva, Switzerland, 2007; Available online: https://www.who.int/publications/i/item/9789241596107 (accessed on 10 January 2022).
- Withrock, I.C.; Anderson, S.J.; Jefferson, M.A.; McCormack, G.R.; Mlynarczyk, G.S.A.; Nakama, A.; Lange, J.K.; Berg, C.A.; Acharya, S.; Stock, M.L.; et al. Genetic diseases conferring resistance to infectious diseases. Genes Dis. 2015, 2, 247–254. [Google Scholar] [CrossRef]
- Allison, A.C. Polymorphism and natural selection in human populations. Cold Spring Harb. Symp. Quant. Biol. 1964, 29, 137–149. [Google Scholar] [CrossRef] [PubMed]
- Gong, L.; Parikh, S.; Rosenthal, P. Biochemical and immunological mechanisms by which sickle cell trait protects against malaria. Malar. J. 2013, 12, 317–325. [Google Scholar] [CrossRef]
- Al Yazidi, L.S.; Al Hinai, Z.; Al Waili, B.; Al Hashami, H.; Al Reesi, M.; Al Othmani, F.; Al Noobi, B.; Al Tahir, N.; Elsidig, N.; Al Barwani, L.; et al. Epidemiology, characteristics and outcome of children hospitalized with COVID-19 in Oman: A multicenter cohort study. Int. J. Infect. Dis. 2021, 104, 655–660. [Google Scholar] [CrossRef]
- Arlet, J.B.; de Luna, G.; Khimoud, D.; Odièvre, M.H.; de Montalembert, M.; Joseph, L.; Chantalat-Auger, C.; Flamarion, E.; Bartolucci, P.; Lionnet, F.; et al. Prognosis of patients with sickle cell disease and COVID-19: A French experience. Lancet Haematol. 2020, 7, e632–e634. [Google Scholar] [CrossRef]
- Balanchivadze, N.; Kudirka, A.A.; Askar, S.; Almadhoun, K.; Kuriakose, P.; Fadel, R.; Dabak, V. Impact of COVID-19 infection on 24 patients with sickle cell disease. One center urban experience, Detroit, MI, USA. Hemoglobin 2020, 44, 284–289. [Google Scholar] [CrossRef]
- McCloskey, K.A.; Meenan, J.; Hall, R.; Tsitsikas, D.A. COVID-19 infection and sickle cell disease: A UK centre experience. Br. J. Haematol. 2020, 190, e57–e58. [Google Scholar] [CrossRef]
- Vilela, T.S.; Braga, J.A.P.; Loggetto, S.R. Hemoglobinopathy and pediatrics in the time of COVID-19. Hematol. Transfus. Cell Ther. 2020, 43, 87–100. [Google Scholar] [CrossRef]
- Chakravorty, S.; Padmore-Payne, G.; Ike, F.; Tshibangu, V.; Graham, C.; Rees, D.; Stuart-Smith, S. COVID-19 in patients with sickle cell disease-a case series from a UK Tertiary Hospital. Haematologica 2020, 105, 2691–2693. [Google Scholar] [CrossRef]
- Menapace, L.A.; Thein, S.L. COVID-19 and sickle cell disease. Haematologica 2020, 105, 2501–2504. [Google Scholar] [CrossRef]
- Azerad, M.A.; Bayoudh, F.; Weber, T.; Minon, J.M.; Ketelslegers, O.; Hoyoux, M.; Ren, X.; Kaye, O.; De Marneffe, N.; Fraipont, V.; et al. Sickle cell disease and COVID-19: Atypical presentations and favorable outcomes. EJHaem 2020, 1, 338–341. [Google Scholar] [CrossRef] [PubMed]
- Hussain, F.A.; Njoku, F.U.; Saraf, S.L.; Molokie, R.E.; Gordeuk, V.R.; Han, J. COVID-19 infection in patients with sickle cell disease. Br. J. Haematol. 2020, 189, 851–852. [Google Scholar] [CrossRef]
- Justino, C.C.; Campanharo, F.F.; Augusto, M.N.; Morais, S.C.; Figueiredo, M.S. COVID-19 as a trigger of acute chest syndrome in a pregnant woman with sickle cell anemia. Hematol. Transfus. Cell Ther. 2020, 42, 212–214. [Google Scholar] [CrossRef]
- Minniti, C.P.; Zaidi, A.U.; Nouraie, M.; Manwani, D.; Crouch, G.D.; Crouch, A.S.; Callaghan, M.U.; Carpenter, S.; Jacobs, C.; Han, J.; et al. Clinical predictors of poor outcomes in patients with sickle cell disease and COVID-19 infection. Blood Adv. 2021, 5, 207–215. [Google Scholar] [CrossRef] [PubMed]
- Panepinto, J.A.; Brandow, A.; Mucalo, L.; Yusuf, F.; Singh, A.; Taylor, B.; Woods, K.; Payne, A.B.; Peacock, G.; Schieve, L.A. Coronavirus disease among persons with sickle cell disease, United States, March 20–May 21, 2020. Emerg. Infect. Dis. 2020, 26, 2473–2476. [Google Scholar] [CrossRef] [PubMed]
- Alkindi, S.; Elsadek, R.A.; Al-Madhani, A.; Al-Musalhi, M.; AlKindi, S.Y.; Al-Khadouri, G.; Al Rawahi, B.; Al-Ruqeishi, S.; Al-Yazeedi, J.; Wali, Y.A.; et al. Impact of the coronavirus 2019 (COVID-19) on vasooclusive crisis in patients with sickle cell anaemia. Int. J. Infect. Dis. 2021, 106, 128–133. [Google Scholar] [CrossRef] [PubMed]
- Singh, A.; Brandow, A.M.; Panepinto, J.A. COVID-19 in individuals with sickle cell disease/trait compared with other Black individuals. Blood Adv. 2021, 5, 1915–1921. [Google Scholar] [CrossRef] [PubMed]
- Tezol, O.; Unal, S. Anxiety level and clinical course of patients with sickle cell disease during the COVID-19 outbreak. Arch. Pediatr. 2021, 28, 136–140. [Google Scholar] [CrossRef] [PubMed]
Figure 1.
COVID-19 data as of 25 August 2020. (a) Number of cases. (b) Number of deaths. Both graphs show the greatest severity in northern Italy, particularly in the Lombardy region.
Figure 1.
COVID-19 data as of 25 August 2020. (a) Number of cases. (b) Number of deaths. Both graphs show the greatest severity in northern Italy, particularly in the Lombardy region.

Figure 2.
Italian population density (updated to 2019). Some regions of central-southern Italy have a high population density which, in reality, is linked to the presence of large urban centers (such as Rome in Lazio and Naples in Campania).
Figure 2.
Italian population density (updated to 2019). Some regions of central-southern Italy have a high population density which, in reality, is linked to the presence of large urban centers (such as Rome in Lazio and Naples in Campania).

Figure 3.
Distribution of the Italian population aged > 64 in percentage (a) and absolute (b) terms (updated to 2019).
Figure 3.
Distribution of the Italian population aged > 64 in percentage (a) and absolute (b) terms (updated to 2019).

Figure 4.
Distribution of the male and female populations in Italy, overall (a) and only for the age group > 64 years (b) (updated to 2019).
Figure 4.
Distribution of the male and female populations in Italy, overall (a) and only for the age group > 64 years (b) (updated to 2019).

Figure 5.
(a) Total percentages of weight problems in the individual regions, considering the adult population only. (b) Percentage of overweight adults in the various regions. (c) Percentage of obese adults in the various regions.
Figure 5.
(a) Total percentages of weight problems in the individual regions, considering the adult population only. (b) Percentage of overweight adults in the various regions. (c) Percentage of obese adults in the various regions.

Figure 6.
(a) Thalassemia distribution. (b) Anemia distribution. (c) Hemochromatosis distribution.

Figure 7.
COVID-19 data as of September 17, 2021. (a) Number of cases. (b) Number of deaths. Both graphs show that Lombardy and northern Italy continue to be the areas most affected by this disease.
Figure 7.
COVID-19 data as of September 17, 2021. (a) Number of cases. (b) Number of deaths. Both graphs show that Lombardy and northern Italy continue to be the areas most affected by this disease.

Figure 8.
COVID-19 data as of 17 September 2021. (a) Number of cases. (b) Number of deaths. Both graphs show the extremely variability in the diffusion and severity of this disease.
Figure 8.
COVID-19 data as of 17 September 2021. (a) Number of cases. (b) Number of deaths. Both graphs show the extremely variability in the diffusion and severity of this disease.

Figure 9.
World population density (updated to 2000) [34].
Figure 9.
World population density (updated to 2000) [34].

Figure 10.
(a) Distribution of the World population aged > 65 as a percentage. (b) Distribution of the male and female population in the World [33].
Figure 10.
(a) Distribution of the World population aged > 65 as a percentage. (b) Distribution of the male and female population in the World [33].

Figure 11.
(a) Percentages of obese adults in various countries. (b) Percentages of overweight adults by country [37].
Figure 11.
(a) Percentages of obese adults in various countries. (b) Percentages of overweight adults by country [37].

Figure 12.
(a) Distribution of blood group A. (b) Distribution of blood group O [41].
Figure 12.
(a) Distribution of blood group A. (b) Distribution of blood group O [41].

Figure 13.
(a) Anemia distribution [42,43,44]. (b) Thalassemia distribution [45]. (c) Hemochromatosis distribution [23,24,25,26,27,42,46].


Table 1.
Epidemiological data in northern and southern Italy.
| Northern Italy | No. 1 of Cases | No. 1 of Deaths | Infections in the Total Population [in %] | Southern Italy | No. 1 of Cases | No. 1 of Deaths | Infections in the Total Population [in %] |
|---|---|---|---|---|---|---|---|
| Aosta Valley | 1223 | 146 | 0.973 | Abruzzo | 3662 | 472 | 0.279 |
| Emilia-Romagna | 31,094 | 4458 | 0.697 | Apulia | 5119 | 555 | 0.127 |
| Friuli Venezia Giulia | 3651 | 348 | 0.300 | Basilicata | 505 | 28 | 0.090 |
| Liguria | 10,683 | 1571 | 0.689 | Calabria | 1408 | 97 | 0.072 |
| Lombardy | 98,545 | 16,857 | 0.980 | Campania | 5976 | 442 | 0.103 |
| Piedmont | 32,440 | 4143 | 0.745 | Molise | 511 | 23 | 0.167 |
| Trentino-South Tyrol | 7925 | 697 | 0.739 | Sardinia | 1859 | 134 | 0.113 |
| Veneto | 22,190 | 2107 | 0.452 | Sicily | 4091 | 286 | 0.082 |
| Total | 260,407 | 30,327 | 0.697 ± 0.232 | 23,131 | 2037 | 0.129 ± 0.067 | |
| Deaths [in %] | 11.65 | 8.81 | |||||
1 No., number. COVID-19 data available as of 25 August 2020 [4].
Table 2.
Distribution of blood groups in Italy.
| Blood Group | Northern Italy | Southern Italy |
|---|---|---|
| A [in %] | 44 | 19 |
| O [in %] | 40 | 41 |
Table 3.
Epidemiological data in northern and southern Italy.
| Northern Italy | No. 1 of Cases | No. 1 of Deaths | Infections in the Total Population [in %] | Southern Italy | No. 1 of Cases | No. 1 of Deaths | Infections in the Total Population [in %] |
|---|---|---|---|---|---|---|---|
| Aosta Valley | 12,071 | 473 | 9.61 | Abruzzo | 80,556 | 2535 | 6.14 |
| Emilia-Romagna | 419,717 | 13,427 | 9.41 | Apulia | 266,881 | 6764 | 6.63 |
| Friuli Venezia Giulia | 112,817 | 3813 | 9.28 | Basilicata | 29,708 | 607 | 5.28 |
| Liguria | 111,775 | 4395 | 7.21 | Calabria | 81,857 | 1369 | 4.20 |
| Lombardy | 878,526 | 33,979 | 8.73 | Campania | 452,471 | 7853 | 7.80 |
| Piedmont | 376,475 | 11,742 | 8.64 | Molise | 14,437 | 495 | 4.72 |
| Trentino-South Tyrol | 124,259 | 2557 | 11.59 | Sardinia | 74,619 | 1624 | 4.55 |
| Veneto | 464,283 | 11,736 | 9.47 | Sicily | 291,964 | 6673 | 5.84 |
| Total | 2,499,923 | 82,122 | 9.24 ± 1.22 | 1,292,493 | 27,920 | 5.65 ± 1.20 | |
| Deaths/cases [in %] | 3.25 ± 0.68 | 2.38 ± 0.63 | |||||
1 No., number. COVID-19 data available on 17 September 2021 [4].
Table 4.
Spread and mortality in the regions of southern Italy with the highest number of infections.
Table 4.
Spread and mortality in the regions of southern Italy with the highest number of infections.
| % Cases/Population | % Deads/Population | % Deads/Cases | |
|---|---|---|---|
| Apulia | 6.63 | 0.17 | 2.53 |
| Campania | 7.80 | 0.14 | 1.74 |
| Sicily | 5.84 | 0.13 | 2.29 |
COVID-19 data available on 17 September 2021 [4].
Table 5.
Factors that may play a role in adapting the immune response of SCD patients to COVID-19.
| Factors | References |
|---|---|
| Host response adaptation with parasite sequestration and cytoadhesion to the endothelium. | [69] |
| High plasma interferon-α concentrations and type I interferon signature by neutrophils. | [70] |
| Formation of a fibrin trap for pathogenic invaders that promotes the immune elector cell recruitment. | [71] |
| Role of erythrocytes in the immune response. | [72] |
| The biomechanical characteristics of the cell membrane prevent the virus-host cell adhesion. | [73] |
Publisher’s Note: MDPI stays neutral with regard to jurisdictional claims in published maps and institutional affiliations. |
© 2022 by the authors. Licensee MDPI, Basel, Switzerland. This article is an open access article distributed under the terms and conditions of the Creative Commons Attribution (CC BY) license (https://creativecommons.org/licenses/by/4.0/).
Share and Cite
MDPI and ACS Style
Veronese, S.; Sbarbati, A. Asymptomatic Patients and Immune Subjects. Encyclopedia 2022, 2, 109-126. https://doi.org/10.3390/encyclopedia2010008
AMA Style
Veronese S, Sbarbati A. Asymptomatic Patients and Immune Subjects. Encyclopedia. 2022; 2(1):109-126. https://doi.org/10.3390/encyclopedia2010008
Chicago/Turabian StyleVeronese, Sheila, and Andrea Sbarbati. 2022. "Asymptomatic Patients and Immune Subjects" Encyclopedia 2, no. 1: 109-126. https://doi.org/10.3390/encyclopedia2010008