Article

Assessing the Impacts of COVID-19 and Social Isolation on Mental Health in the United States of America

1
Department of Ecology and Evolutionary Biology, University of Kansas, Lawrence, KS 66044, USA
2
Department of Biology, University of Kansas, Lawrence, KS 66044, USA
3
Department of Molecular Biosciences, University of Kansas, Lawrence, KS 66044, USA
4
Department of Psychology, University of Kansas, Lawrence, KS 66044, USA
5
Health Sciences Research Office, University of the Witwatersrand, Johannesburg 2193, South Africa
*
Author to whom correspondence should be addressed.
COVID 2023, 3(6), 807-830; https://doi.org/10.3390/covid3060060
Submission received: 18 April 2023 / Revised: 13 May 2023 / Accepted: 19 May 2023 / Published: 24 May 2023
(This article belongs to the Special Issue How COVID-19 and Long COVID Changed Individuals and Communities)

Abstract

:
The COVID-19 pandemic has had a devastating impact on the world at large with over 750 million cases and almost 7 million deaths reported thus far. Of those, over 100 million cases and 1 million deaths have occurred in the United States of America (USA). The mental health of the general population has been impacted by several aspects of the pandemic including lockdowns, media sensationalism, social isolation, and spread of the disease. In this paper, we examine the associations that social isolation and COVID-19 infection and related death had with the prevalence of anxiety and depression in the general population of the USA in a state-by-state multiple time-series analysis. Vector Error Correction Models are estimated and we subsequently evaluated the coefficients of the estimated models and calculated their impulse response functions for further interpretation. We found that COVID-19 incidence was positively associated with anxiety across the studied period for a majority of states. Variables related to social isolation had a varied effect depending on the state being considered.

1. Introduction

Since its emergence, the World Health Organization (WHO) has reported over 750 million cases of COVID-19 globally and almost 7 million deaths [1]. COVID-19 is a novel coronavirus disease caused by the severe acute respiratory syndrome coronavirus 2 (SARS-CoV-2) that set off an unprecedented global health crisis creating a myriad of lockdown restrictions in response to the surge of COVID-19 cases in different parts of the world. First discovered in Wuhan, China in December 2019, the virus has spread from person to person due to its respiratory transmissibility. Individuals infected with the virus can pass it on to susceptible individuals by being within 2 m of contact, sneezing, and/or coughing through aerosol droplets containing the virus. People could also become infected if they touch their eyes or nose after coming into contact with contaminated surfaces [2]. Areas with poor ventilation in indoor settings and/or crowded rooms can allow for spread to susceptible individuals due to aerosols of the virus suspended for longer in these specific conditions [3]. Reported symptoms of COVID-19 range from mild to severe and include: fever, sore throat, diarrhea, shortness of breath, headache, and body aches, and there are reports of asymptomatic individuals who experience no symptoms, but can still pass on the virus. Older populations (>65+) or those with other underlying medical conditions are associated with a higher likelihood of severe symptoms from COVID-19 [4].

1.1. COVID-19 in the United States of America

In response to the early outbreaks and surges of COVID-19 cases, several country leaders and government officials set up lockdown mandates to suppress transmission between people [5,6]. These restrictions were put in place to stop the ever-growing incidence of COVID-19 cases and death from rising drastically. However, the lockdown mandates led to other unprecedented effects on the mental health of the public [6]. As lockdown mandates became prominent worldwide, there was a rise in mental health problems from pre-pandemic data [7] and an increase in general worry related to the pandemic [8]. These issues culminated in the rise of self-reported stress levels and depressive symptoms [9].
What is interesting to take into account is how many countries were implementing swift lockdown measures to mitigate the spread of COVID-19 [10]. In contrast, the United States of America (USA) opted for individual states to choose their lockdown policies. This move led to variation across the country. Mask policies varied from required to optional, businesses remained open or closed for different durations, and policymakers touted different overall messages. This made it difficult for individuals to determine what sources were correct and what information applied to the specific lockdown restriction they were in depending on their state. The timing of when a state enacted a mask mandate had a significant association with the spread of COVID-19 [10]. Recent research has suggested that state-level policy differences may be associated with different outcomes concerning the COVID-19 pandemic [11].
This disorganization from the federal government of the USA that allowed for individual states to handle their own lockdown logistics was also prominent when it came to its vaccine roll-outs. When the Food and Drug Administration began vaccine rollout in December 2020, there was a vacuum of leadership from the federal government in administrating vaccines to the population [12]. The previous administration provided little to no government insight on how states should run their vaccine roll-out, leaving most states to handle vaccine roll-out at their own discretion [12]. Moreover, vaccination sites were limited on how many shots they were able to administer, but there was a surplus of vaccines distributed to several states. Miscommunication between the federal government and the states caused many of these vaccines to not be distributed to these important sites for the public [13]. The uneven vaccine roll-out to the public, spread of misinformation from the state and federal governments, as well as vaccine hesitancy has resulted in difficulty for the public to become vaccinated [14].

1.2. Anxiety and Depression in the United States of America

In the USA, prevalence of symptoms of anxiety disorder rose from 8.1% in the second quarter of 2019 to 25.5% in June 2020 [15]. Depressive symptoms also saw a reported increase from 6.5% (second quarter) to 24.3% (June 2020) [15]. We subsequently use anxiety and depression as indicators of the mental health of the general population. Social isolation also affected the lifestyle and behavior of the public from sleep disorders, unhealthy eating habits, and restriction of in-person social activity, possibly contributing to the increase in mental health problems [6]. Social isolation runs the potential of being a risk factor for other problems such as dementia, premature death, and physiological distress [16]. The USA and many other countries at this stage of the pandemic experienced similar trends in their populations from health care providers to the general public reporting elevated mental health issues likely stemming from the pandemic and lockdown restrictions [15,17,18,19,20,21]. Additionally, uneven vaccine roll-outs, COVID-19 incidence, and deaths throughout the timeline of COVID-19 in the USA have impacted the mental health of the public. State policies, geographic location, and political affiliation may be among some of the potential factors that can be used as mental health indicators.
At the same time, surveys were issued across the population to ascertain the severity of the mental health problems of the population. This research aims to analyze the presented data from the COVID-19 Trends and Impact Surveys to assess the possible associations between COVID-19 incidence and death and two social variables that were commonly impacted across the USA via lockdown policies with mental health indicators in each state in two time periods. Due to a change in the formatting of several questions, we had to split the analysis to accurately assess the survey results. The first time period ranges from 8 September 2020 to 2 March 2021 and the second time period ranges from 2 March 2021 to 10 January 2022. In this study, we use the aforementioned survey data collected in each state to assess the impact of both the spread of COVID-19 and the impact of reduced social contact as a result of the pandemic via variables related to social isolation on the mental health of the general population. A preprint of this study is available on medRxiv [22].
In Section 2, we provide further detail on the survey data analyzed and describe the formulation of models used for analysis. In Section 3, the coefficients of the fitted models and their impulse response functions are assessed. In the discussion section (Section 4), we present some implications of our results and frame them in the context of existing literature as well as presenting some limitations and strengths of the current study. Finally, in Section 5, we summarize our results and provide insight into future directions for this research.

2. Materials and Methods

2.1. Data

The data used in this study was collected and aggregated by the Delphi Research Group at Carnegie Mellon University in partnership with Facebook [23]. These surveys are issued by the Delphi Research Group at Carnegie Mellon which collects survey results about people’s responses to the current situation of the pandemic. These responses are distributed through the collaboration of Facebook and selected at random. The surveys themselves cover questions such as a person’s demographics, their mental health during the pandemic, how COVID-19 affected them, vaccine roll-out, and other important questions and are thus observational in nature. These surveys allow investigators to compare responses across different regions of the United States and make informed public health decisions [23]. We used results from the COVID-19 Trends and Impact survey as well as case and death data provided by John Hopkins University, both of which can be accessed using the covidcast R package created by the Delphi Research Group. The survey asked respondents several questions regarding various topics, but we focus on the results of questions surrounding mental health and social distancing and travel for analysis. The survey results are weighted to be representative of the population of each state and are reported as an estimated percentage.
As stated above, we perform our analysis on two subsets of the survey results due to the format of questions being changed on 2 March 2021. Our first analysis covers the period of 8 September 2020 to 2 March 2021 and the second analysis covers the period of 2 March 2021 to 10 January 2022. As a measure of anxiety in the general population of each state, we used the ‘Estimated percentage of respondents who reported feeling nervous, anxious, or on edge for most or all of the past 5 days’. As a measure of depression, we used the ‘Estimated percentage of respondents who reported feeling depressed for most or all of the past 5 days’.
We used two indicators as a proxy for social isolation. The first indicator was the ‘Estimated percentage of respondents who spent time with someone who is not currently staying with you in the past 24 h’. The second indicator was the ‘Estimated percentage of respondents who worked or went to school outside their home in the past 24 h’. This means that if an increase is observed in one of these variables, that is considered a decrease in the prevalence of social isolation in the general population. This also means that one might expect that these variables commonly have an inverse relationship with anxiety/depression (i.e., an increase in the percentage of respondents who worked or went to school should be associated with a decrease in anxiety/depression under normal circumstances).
In the context of the pandemic, there is a greater potential for the opposite effect to occur since individuals may be more worried about becoming sick with the more interactions they have. We used two measures of COVID-19 severity, the first being the number of new confirmed COVID-19 cases per 100,000 population per day and the second being the number of new confirmed deaths due to COVID-19 per 100,000 population per day. Due to the reporting schedule skipping weekends, we used the 7 day moving averages of these indicators to smooth the observed signals.
As previously mentioned, the nature of questions changed slightly in the second period, for indicators used to measure anxiety and depression, the questions shifted from asking about the past 5 days to the past 7 days. For indicators used as a proxy for social isolation, the questions changed to ‘Estimated percentage of respondents who spent time indoors with someone who is not currently staying with you in the past 24 h’ and ‘Estimated percentage of individuals who worked or went to school indoors and outside their home in the past 24 h’. COVID-19 related indicators were unchanged in both time periods. The implications that these changes have will be discussed in Section 4. Models fit in the second time period also included the ‘Estimated percentage of respondents who have already received a vaccine for COVID-19’, and the results for that indicator are discussed in the Supplementary Figures. Next, we describe the methods used to analyze the survey data.

2.2. Model Formulation

The time series data described is non-stationary and co-integrated and thus was analyzed using Vector Error Correction Models (VECMs). To verify that our data were non-stationary and co-integrated, we ran an autocorrelation function and Johansen’s test for each state and found each time series to be non-stationary and co-integrated up to at least order 1 in every state. The results of each of these are provided in the results folder of the GitHub link (https://github.com/alxjfulk/social_isolation_and_COVID19 (accessed on 2 July 2022)).
VECMs are modified Vector Auto-Regressive Models (VARs) that are able to account for possible long-run relationships that arise in non-stationary, co-integrated time series data [24]. VARs have long been used to analyze economic data in an attempt to gain insight into what factors contribute to a particular economic variable [25] and we believe that the COVID-19 pandemic presents a unique opportunity to leverage those methods to gain insight into which factors (social isolation or COVID-19) seem to have more of an effect on the mental health of the general population of the United States. In order to make the results as interpretable as possible, we used the same general formula for each state with two lags of each variable included in each equation. From the urca package in R [26], a general VAR model is given as:
Y t = μ + Φ D t + Θ 1 Y t 1 + + Θ p Y t p + ϵ t ,
for t = 1 , , T . Where μ is a constant, D t is the trend matrix, Θ i is the coefficient matrix, ϵ t is the error vector, and Y t i is the vector of variables. Then, our VECM is specified as:
Δ Y t = μ + Φ D t + Γ 1 Δ Y t 1 + + Γ p 1 Δ Y t p + 1 + Π Y t p + ϵ t
with:
Γ i = j = 1 i Θ j I , i = 1 , , p 1
Π = k = 1 p Θ j I
where the Γ i matrices contain cumulative long-run impacts of variables. Notably, since point estimates of each variable can be biased as mentioned in the limitations section of the survey data, we evaluate the sign (positive, negative, or not significant) of each variable in the equations for anxiety and depression in each state as the surveys are likely to effectively capture when a variable increases or decreases. This allows us to make inferences on the effect of each variable on anxiety and depression without actually having to evaluate the estimates themselves, thus limiting the effect of that bias. In addition, we converted each VECM into a VAR using the vec2var function in the vars package for the purpose of estimating impulse response functions (IRFs) for each variable of interest [27]. Our VECM equations are given in Appendix A.

3. Results

3.1. Vector Error Correction Model Results

For the sake of brevity, we only present the results of the VECMs fitted to state data in the time period from 2 March 2021 to 10 January 2022. The results of the VECMs fitted using data from the time period of 8 September 2020 to 2 March 2021 are provided in the Appendix B. Furthermore, the results of the VECMs fitted using data on the percentage of individuals vaccinated in the second time period are given in Appendix C. Note that we abbreviate the variables related to social isolation (i.e., ‘estimated percentage of respondents who spent time indoors with someone who is not currently staying with you in the past 24 h’ and ‘estimated percentage of individuals who worked or went to school indoors and outside their home in the past 24 h’) as time spent w/others and work outside home, respectively.

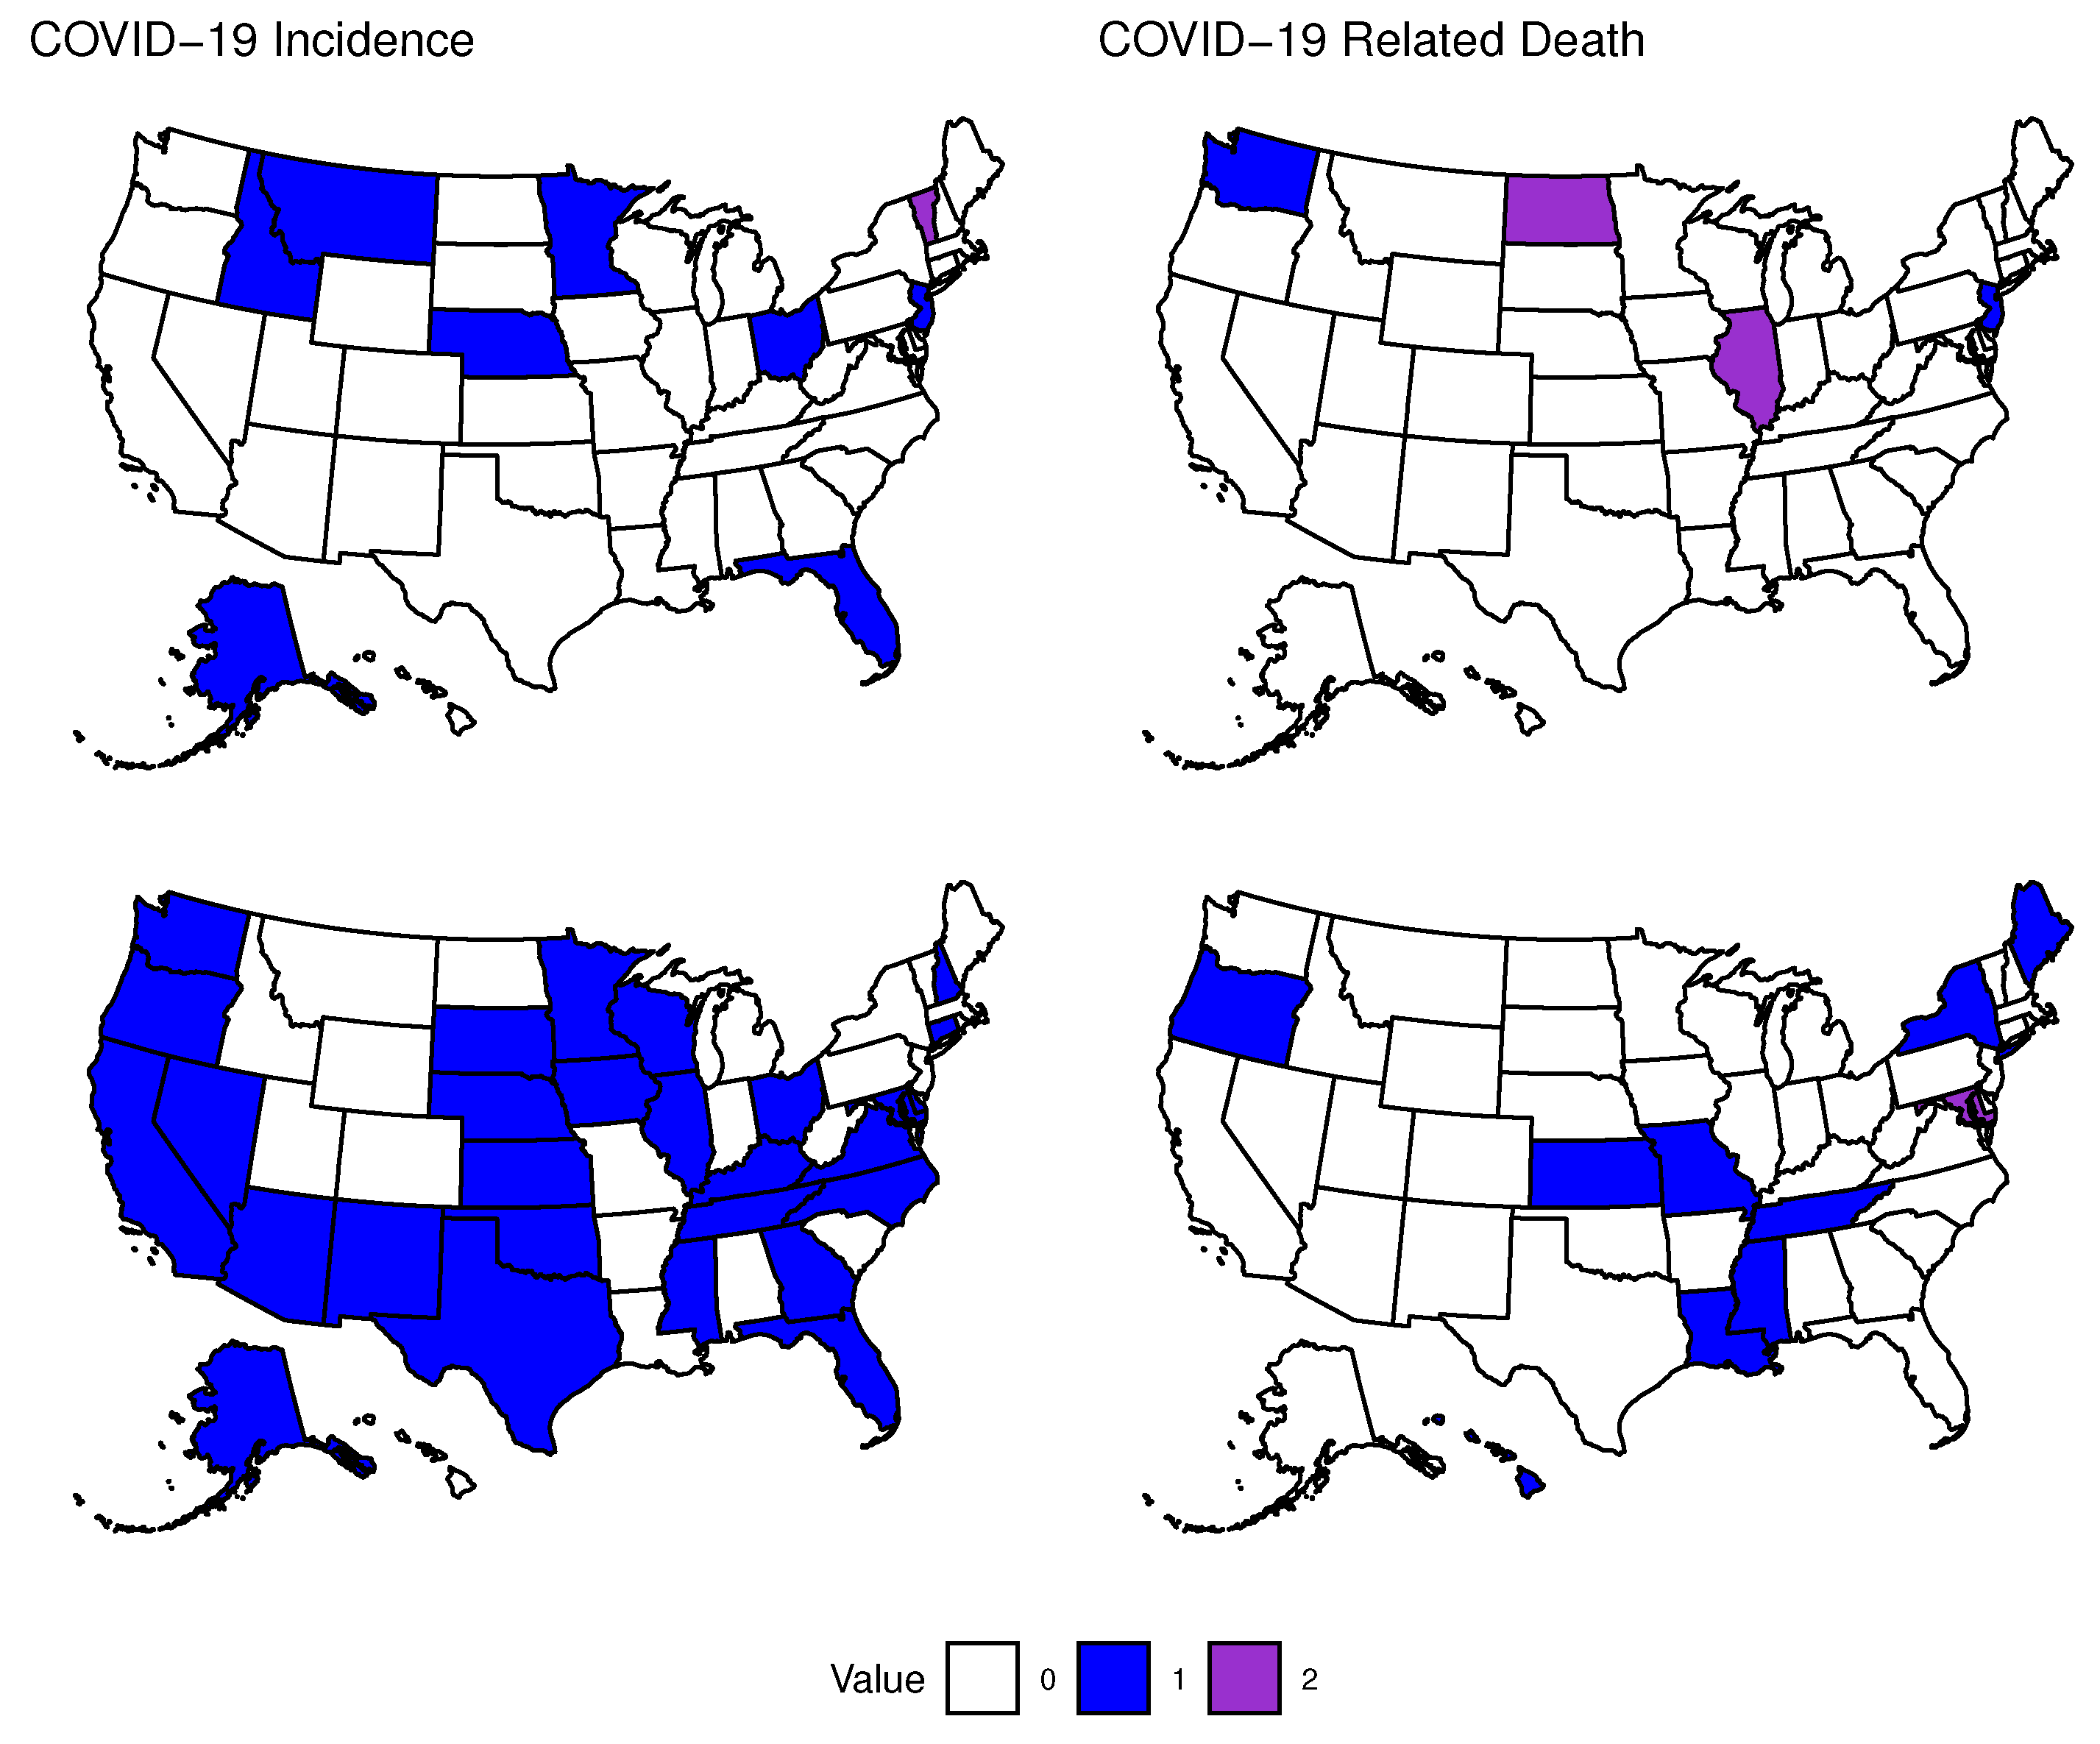
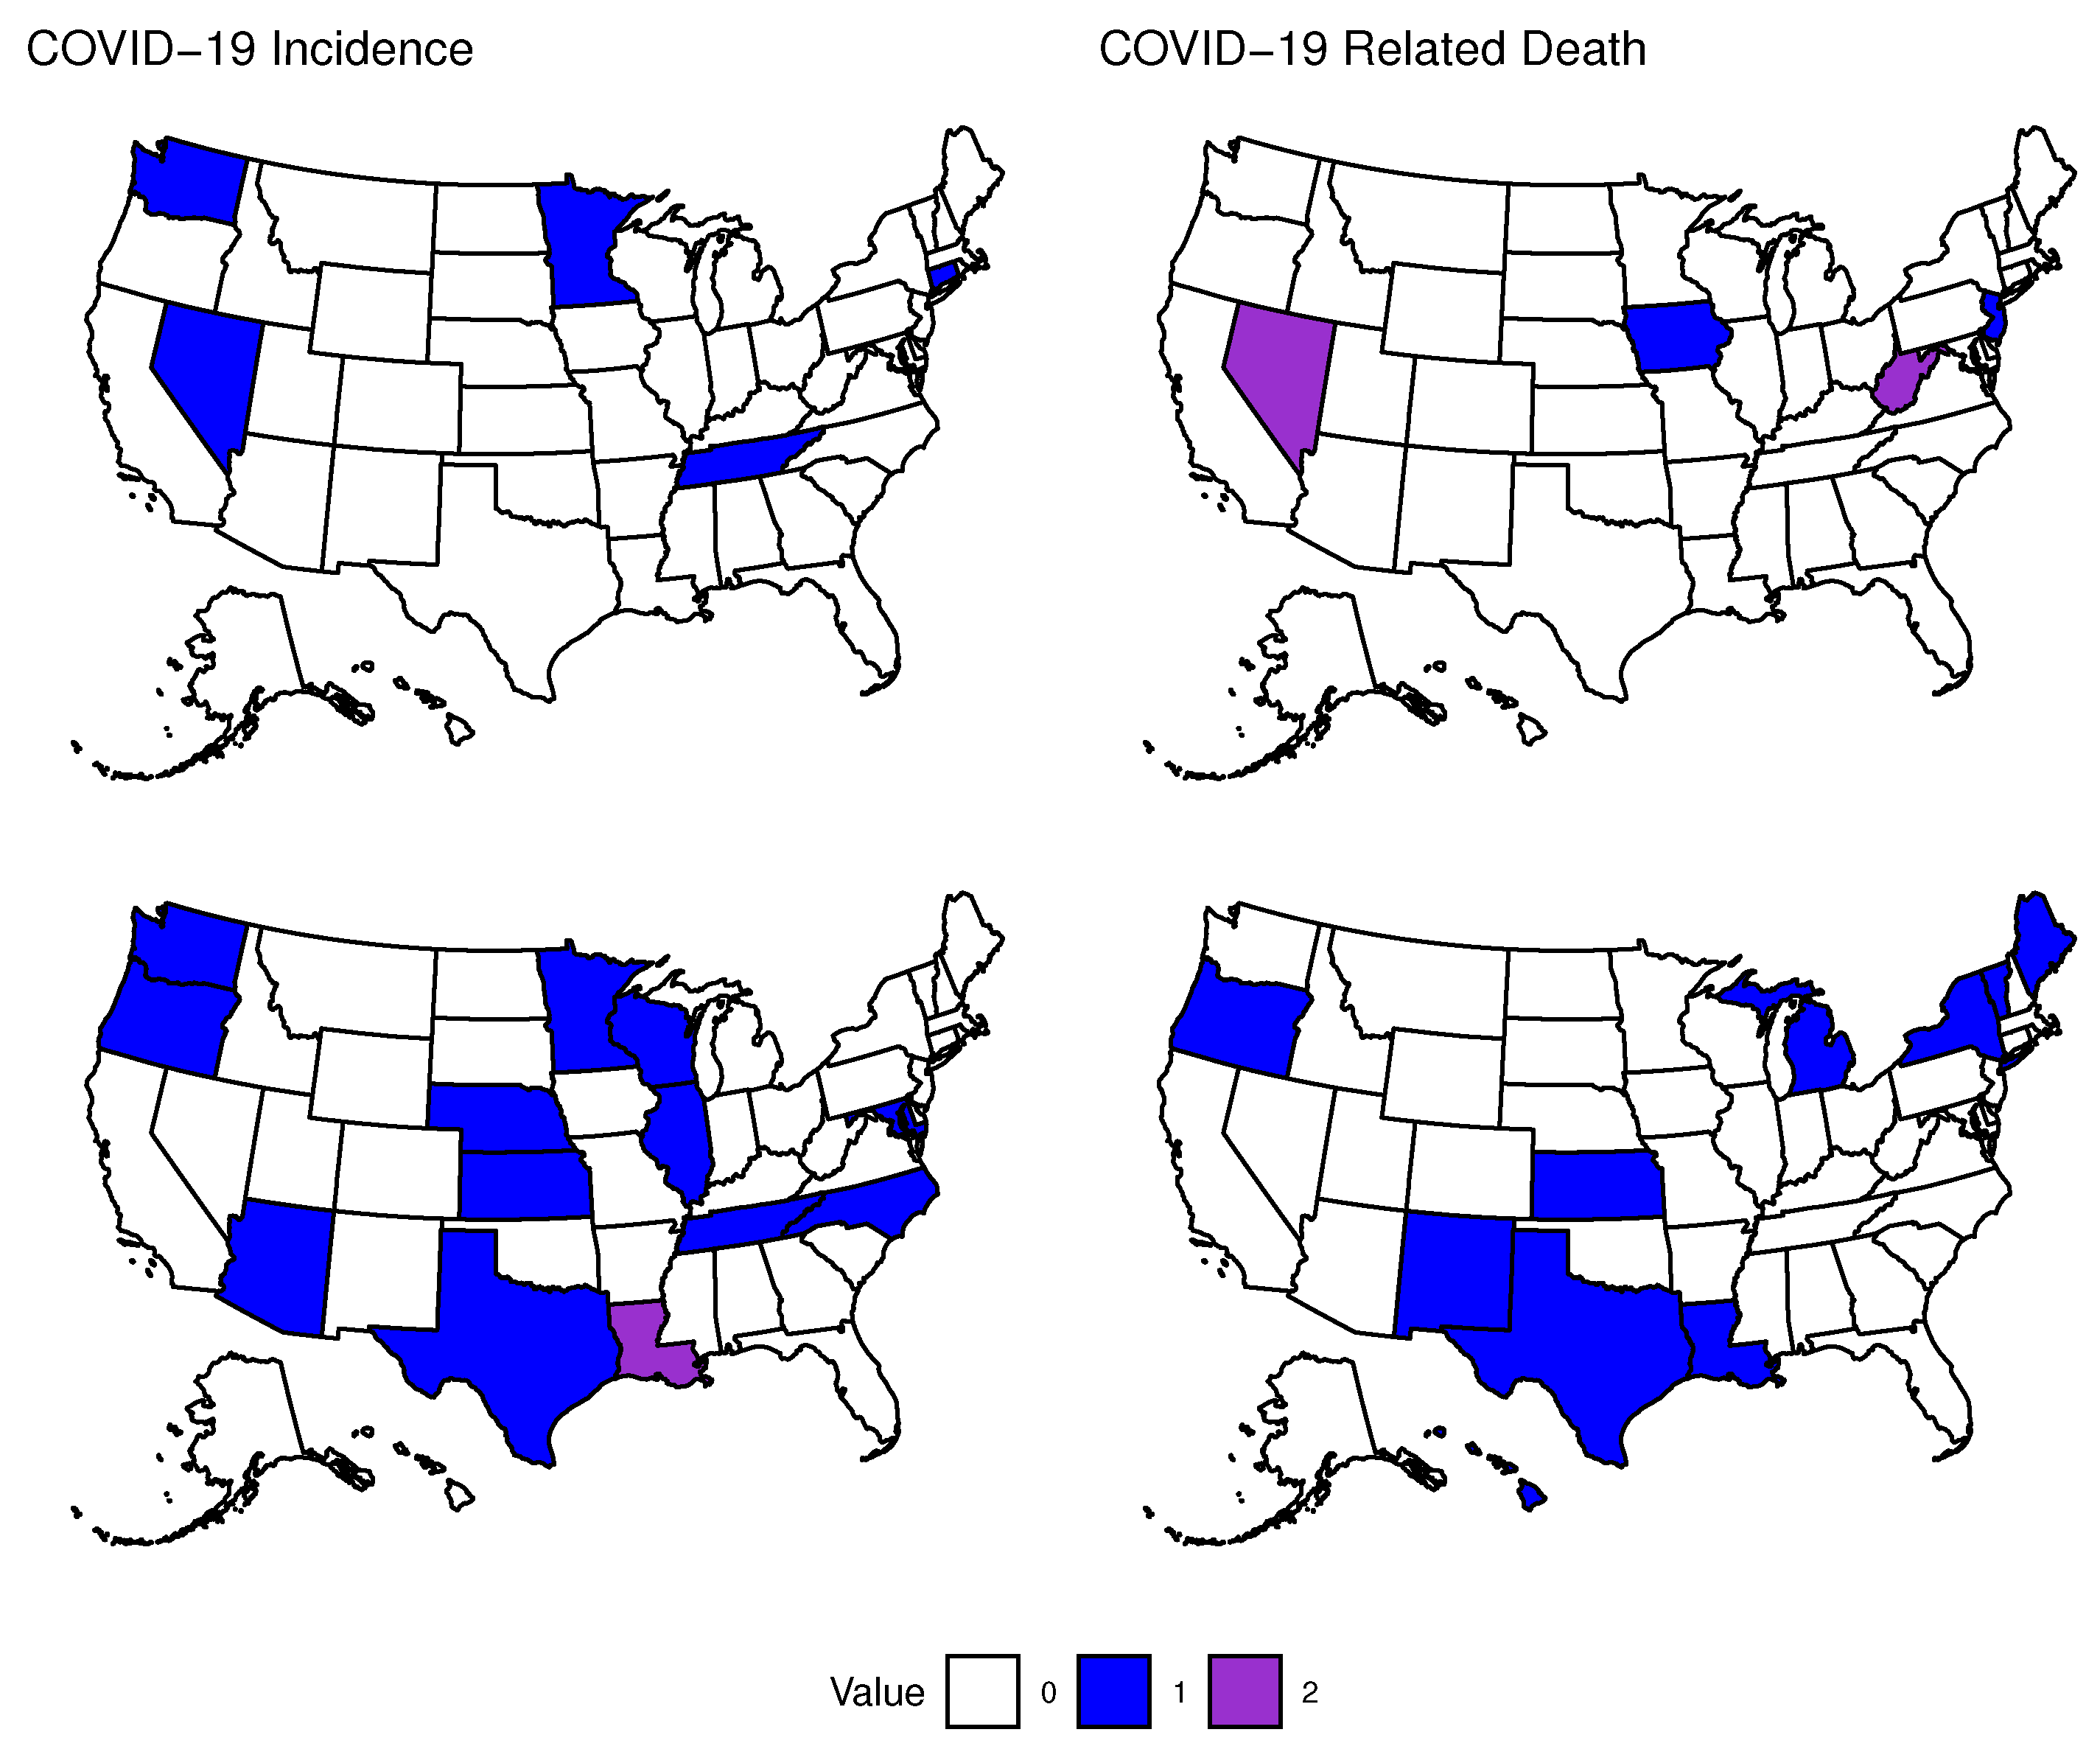
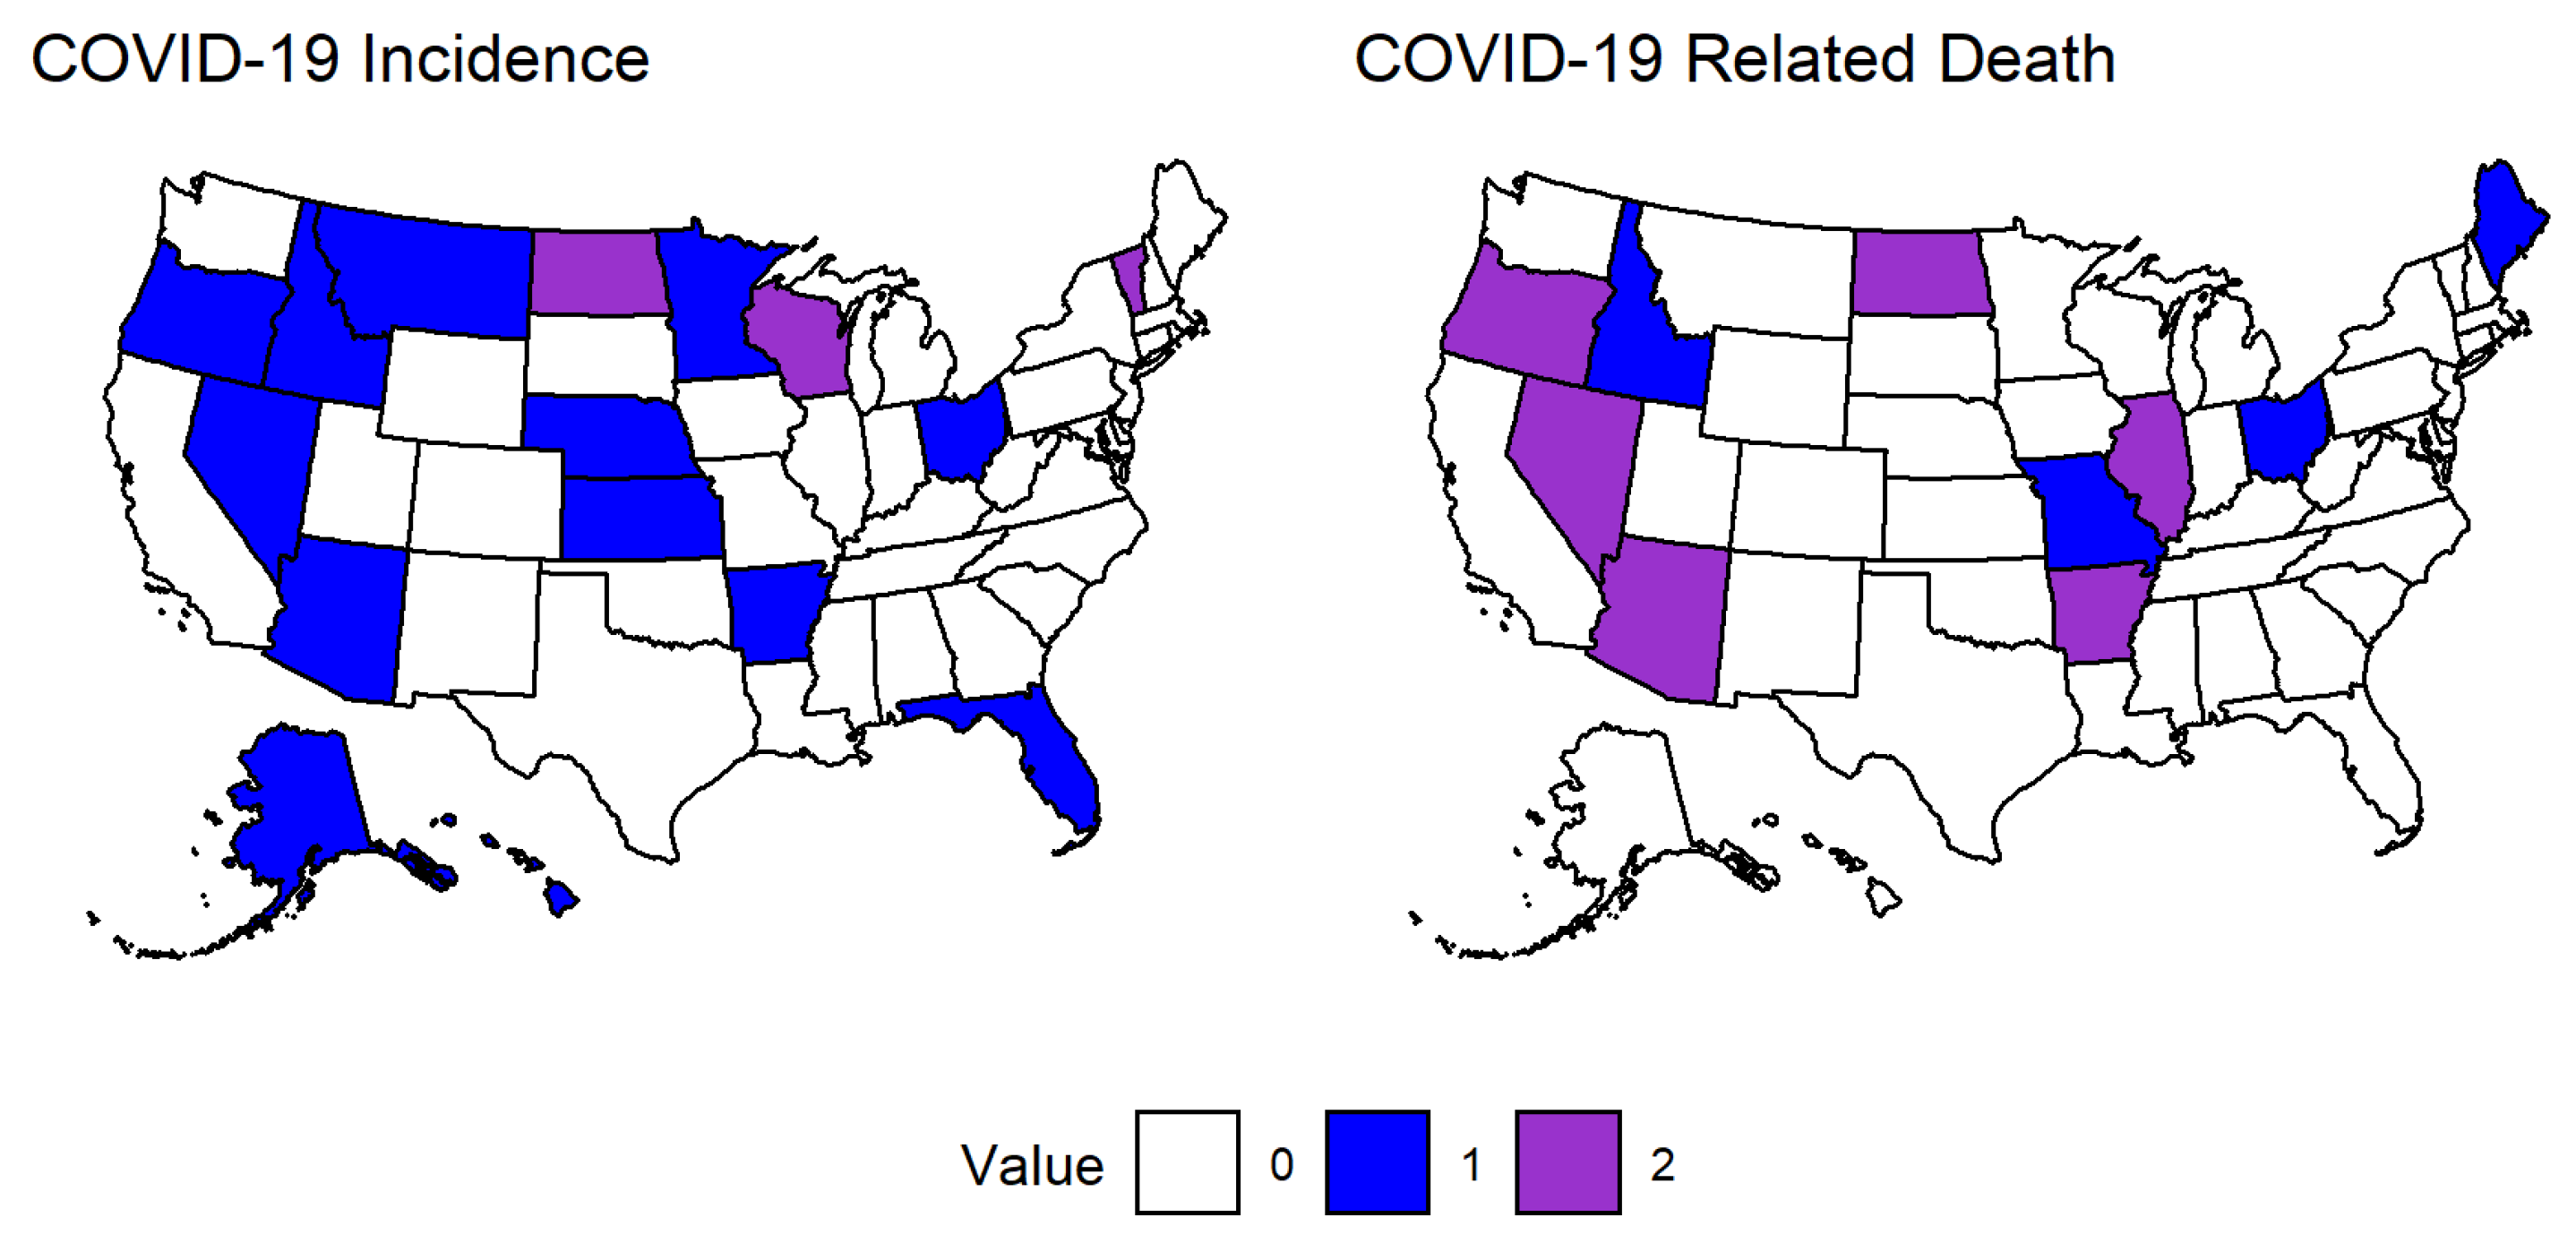
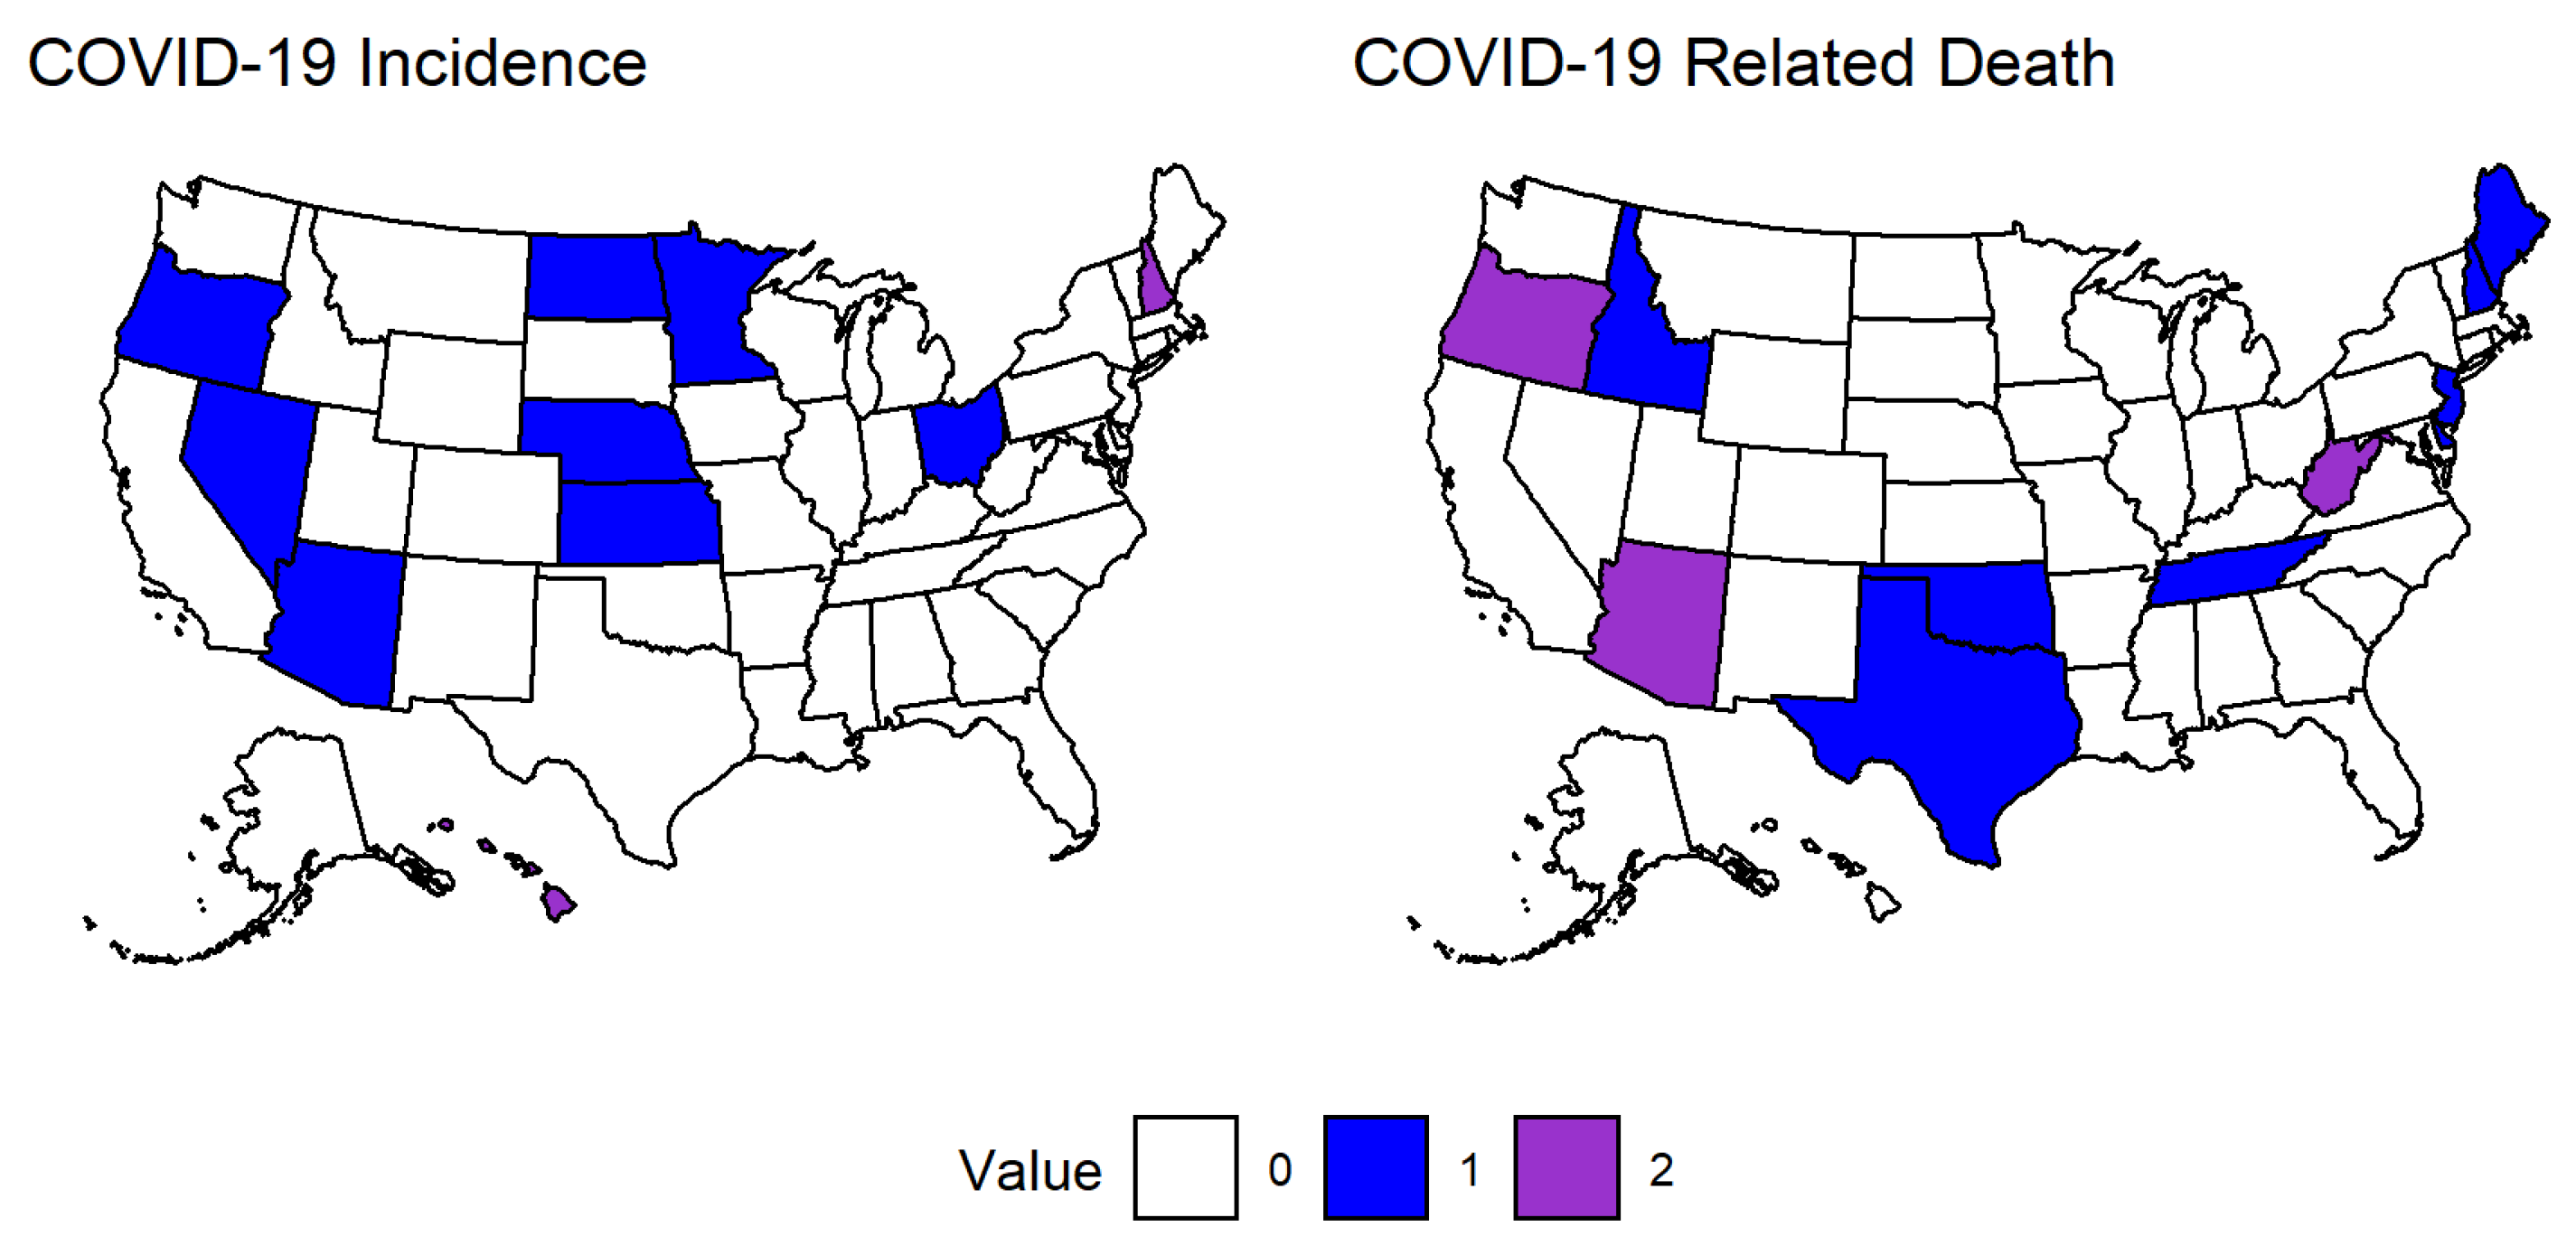
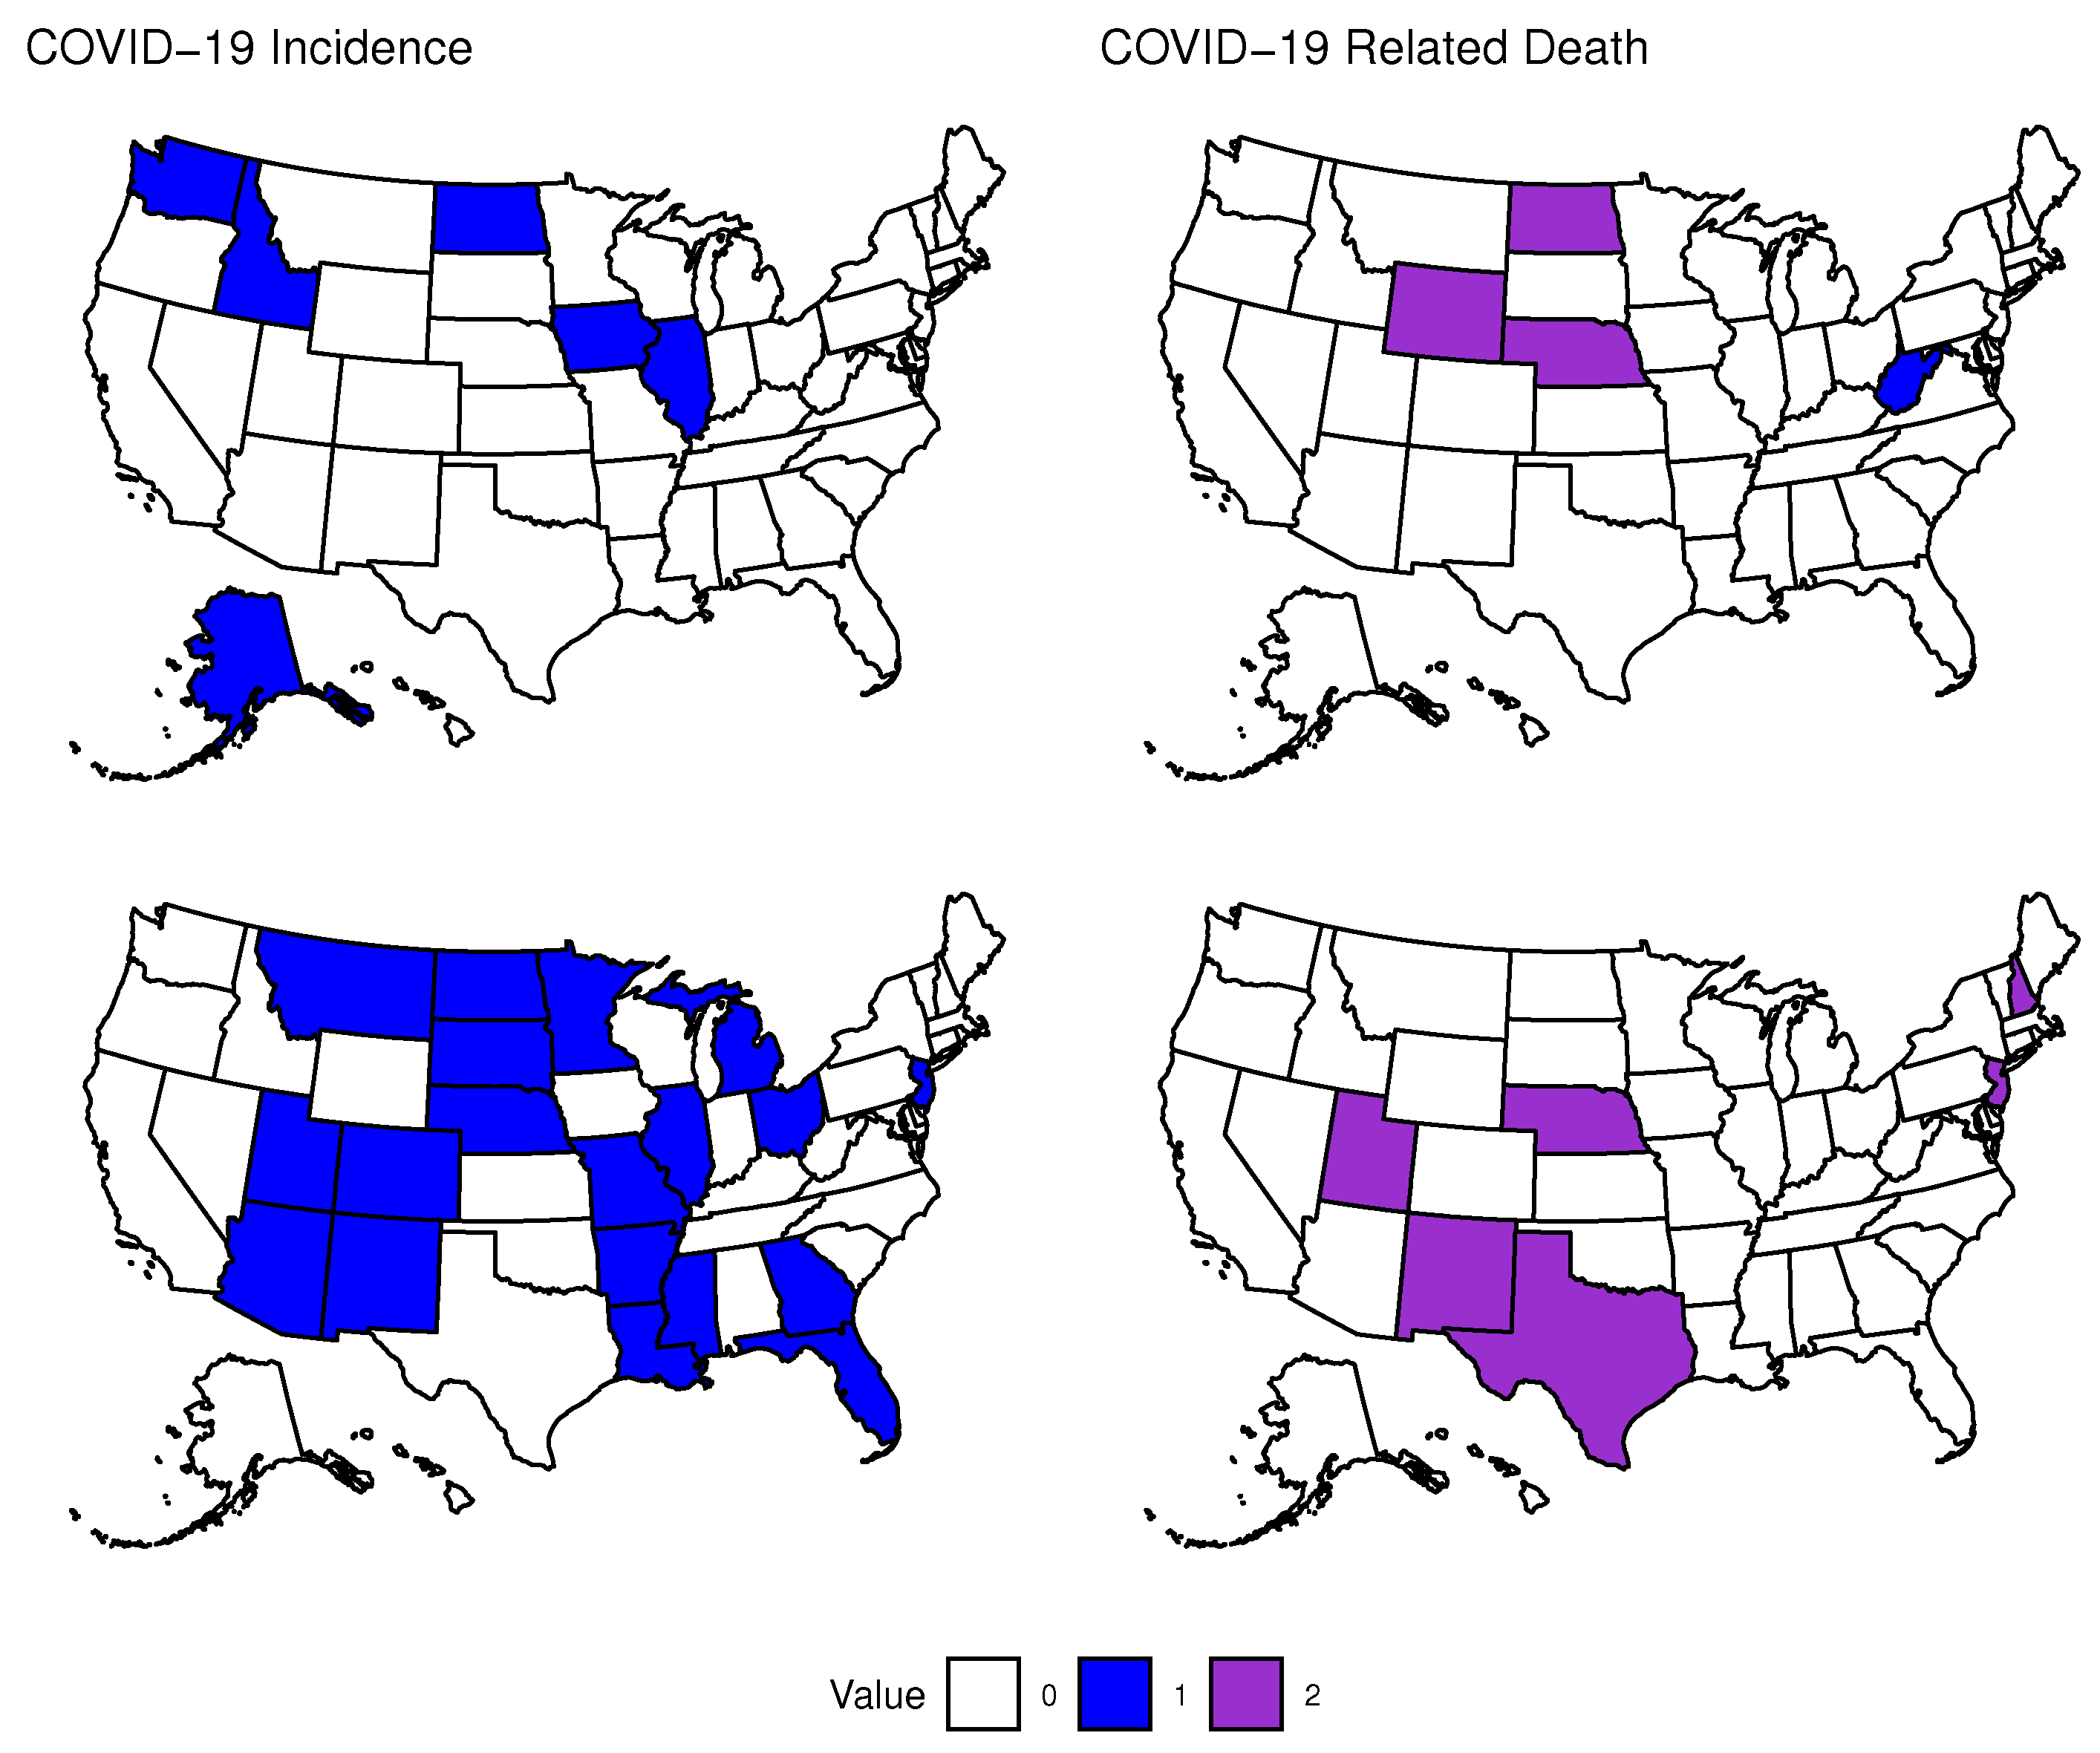
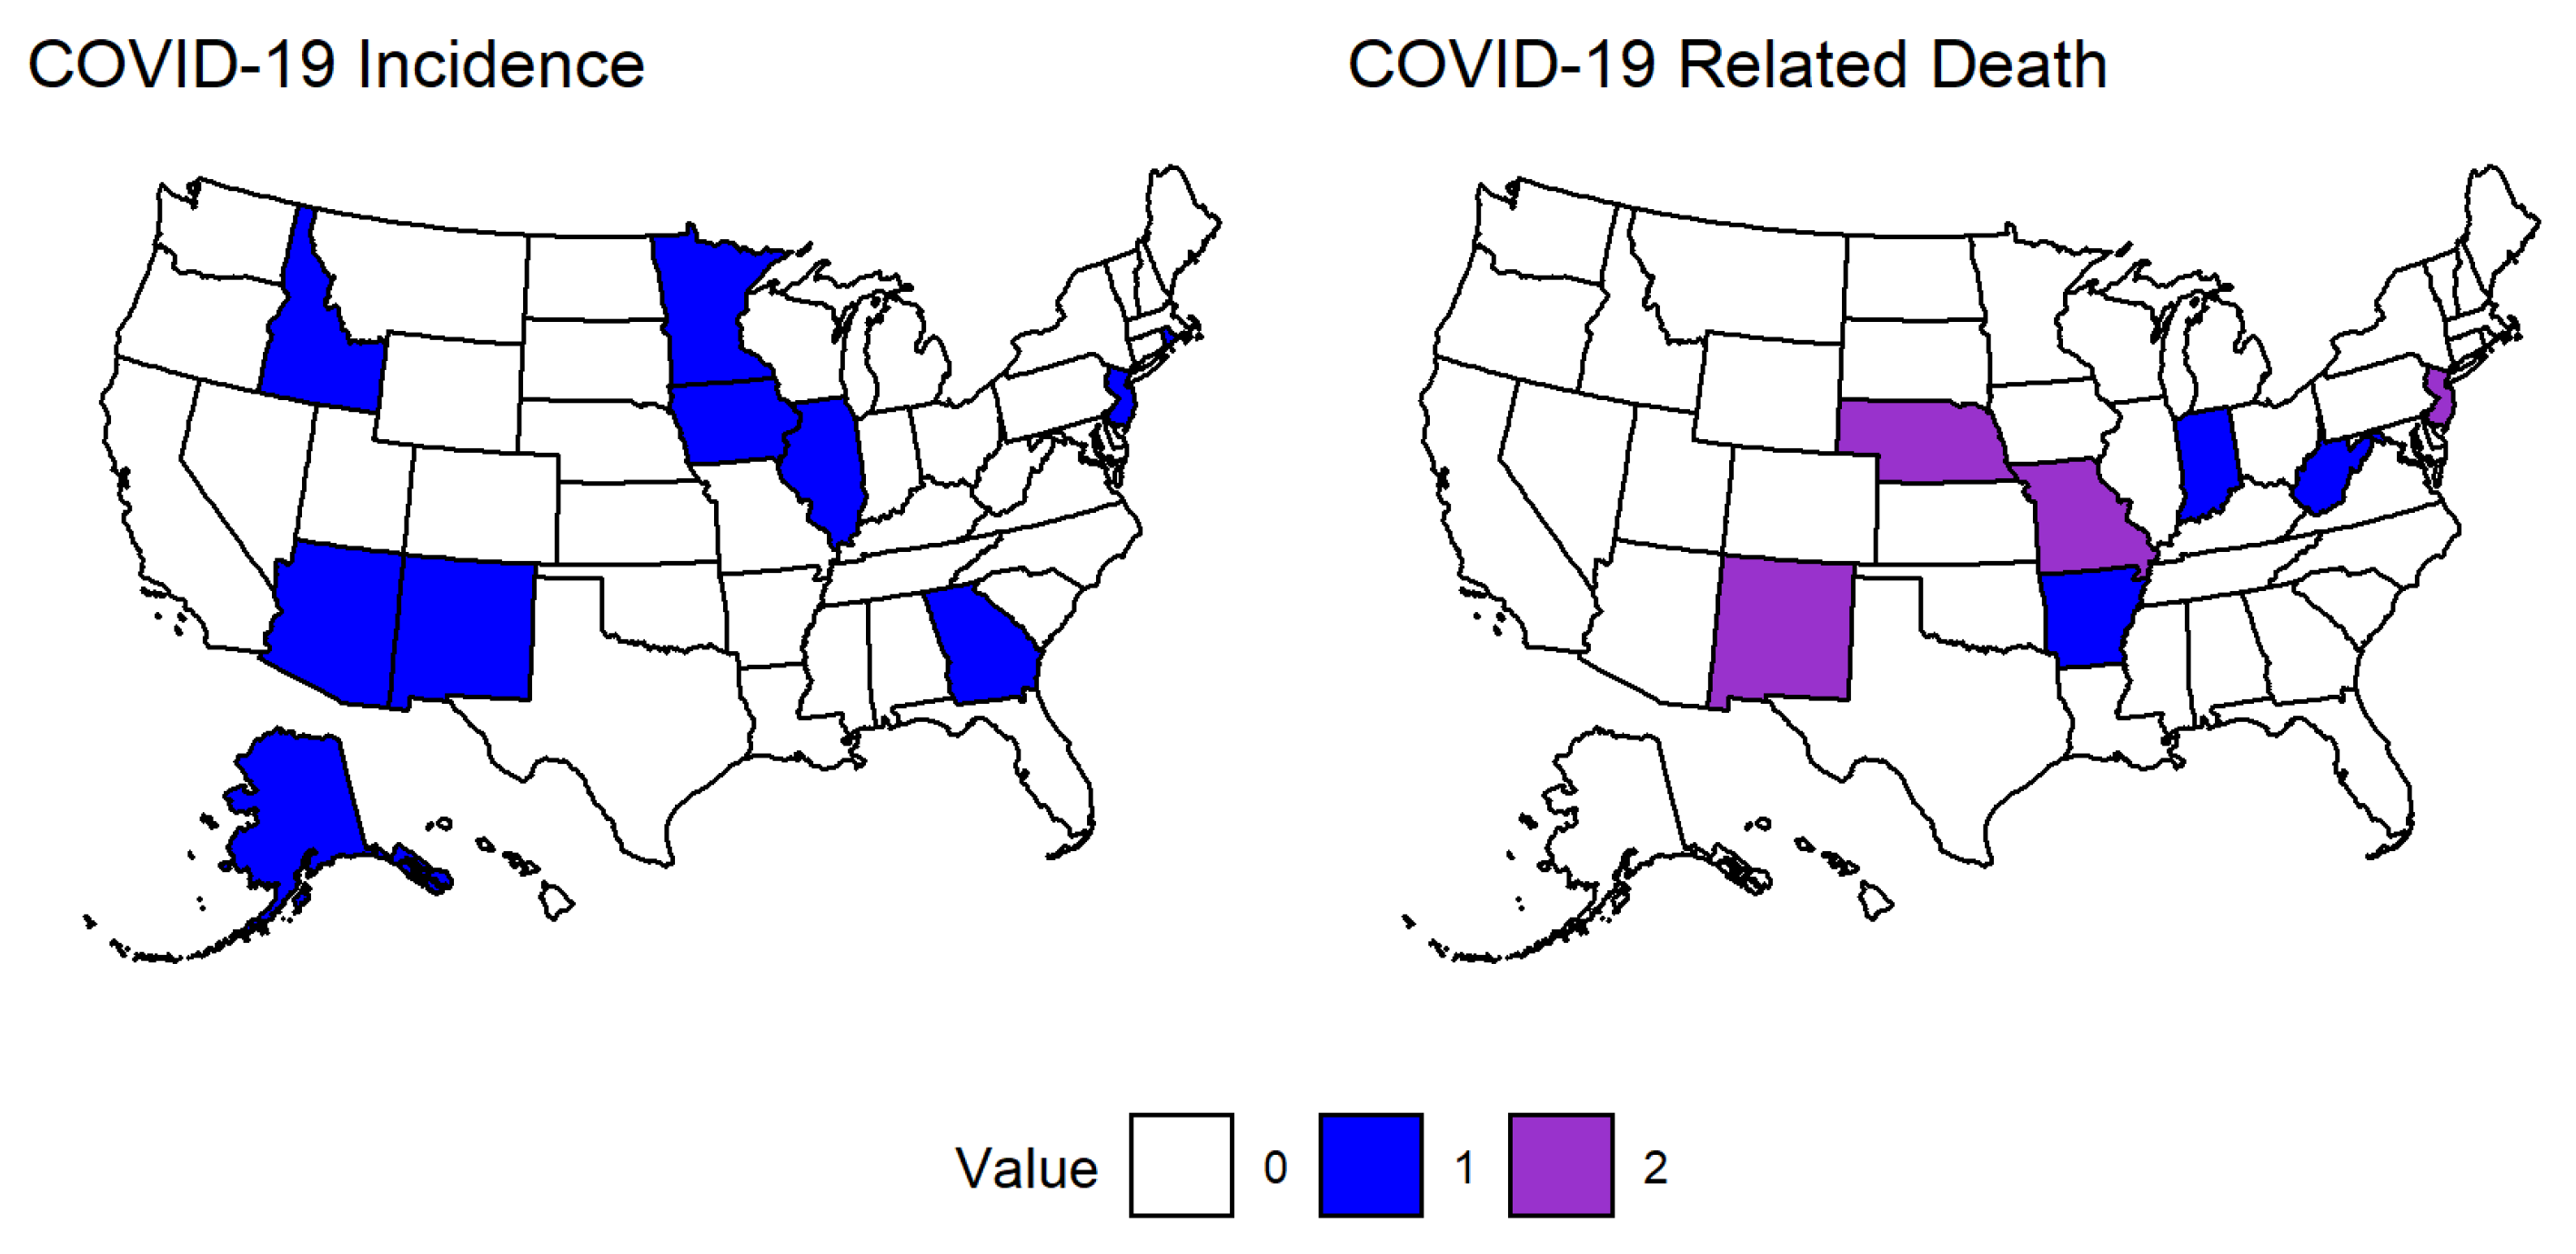
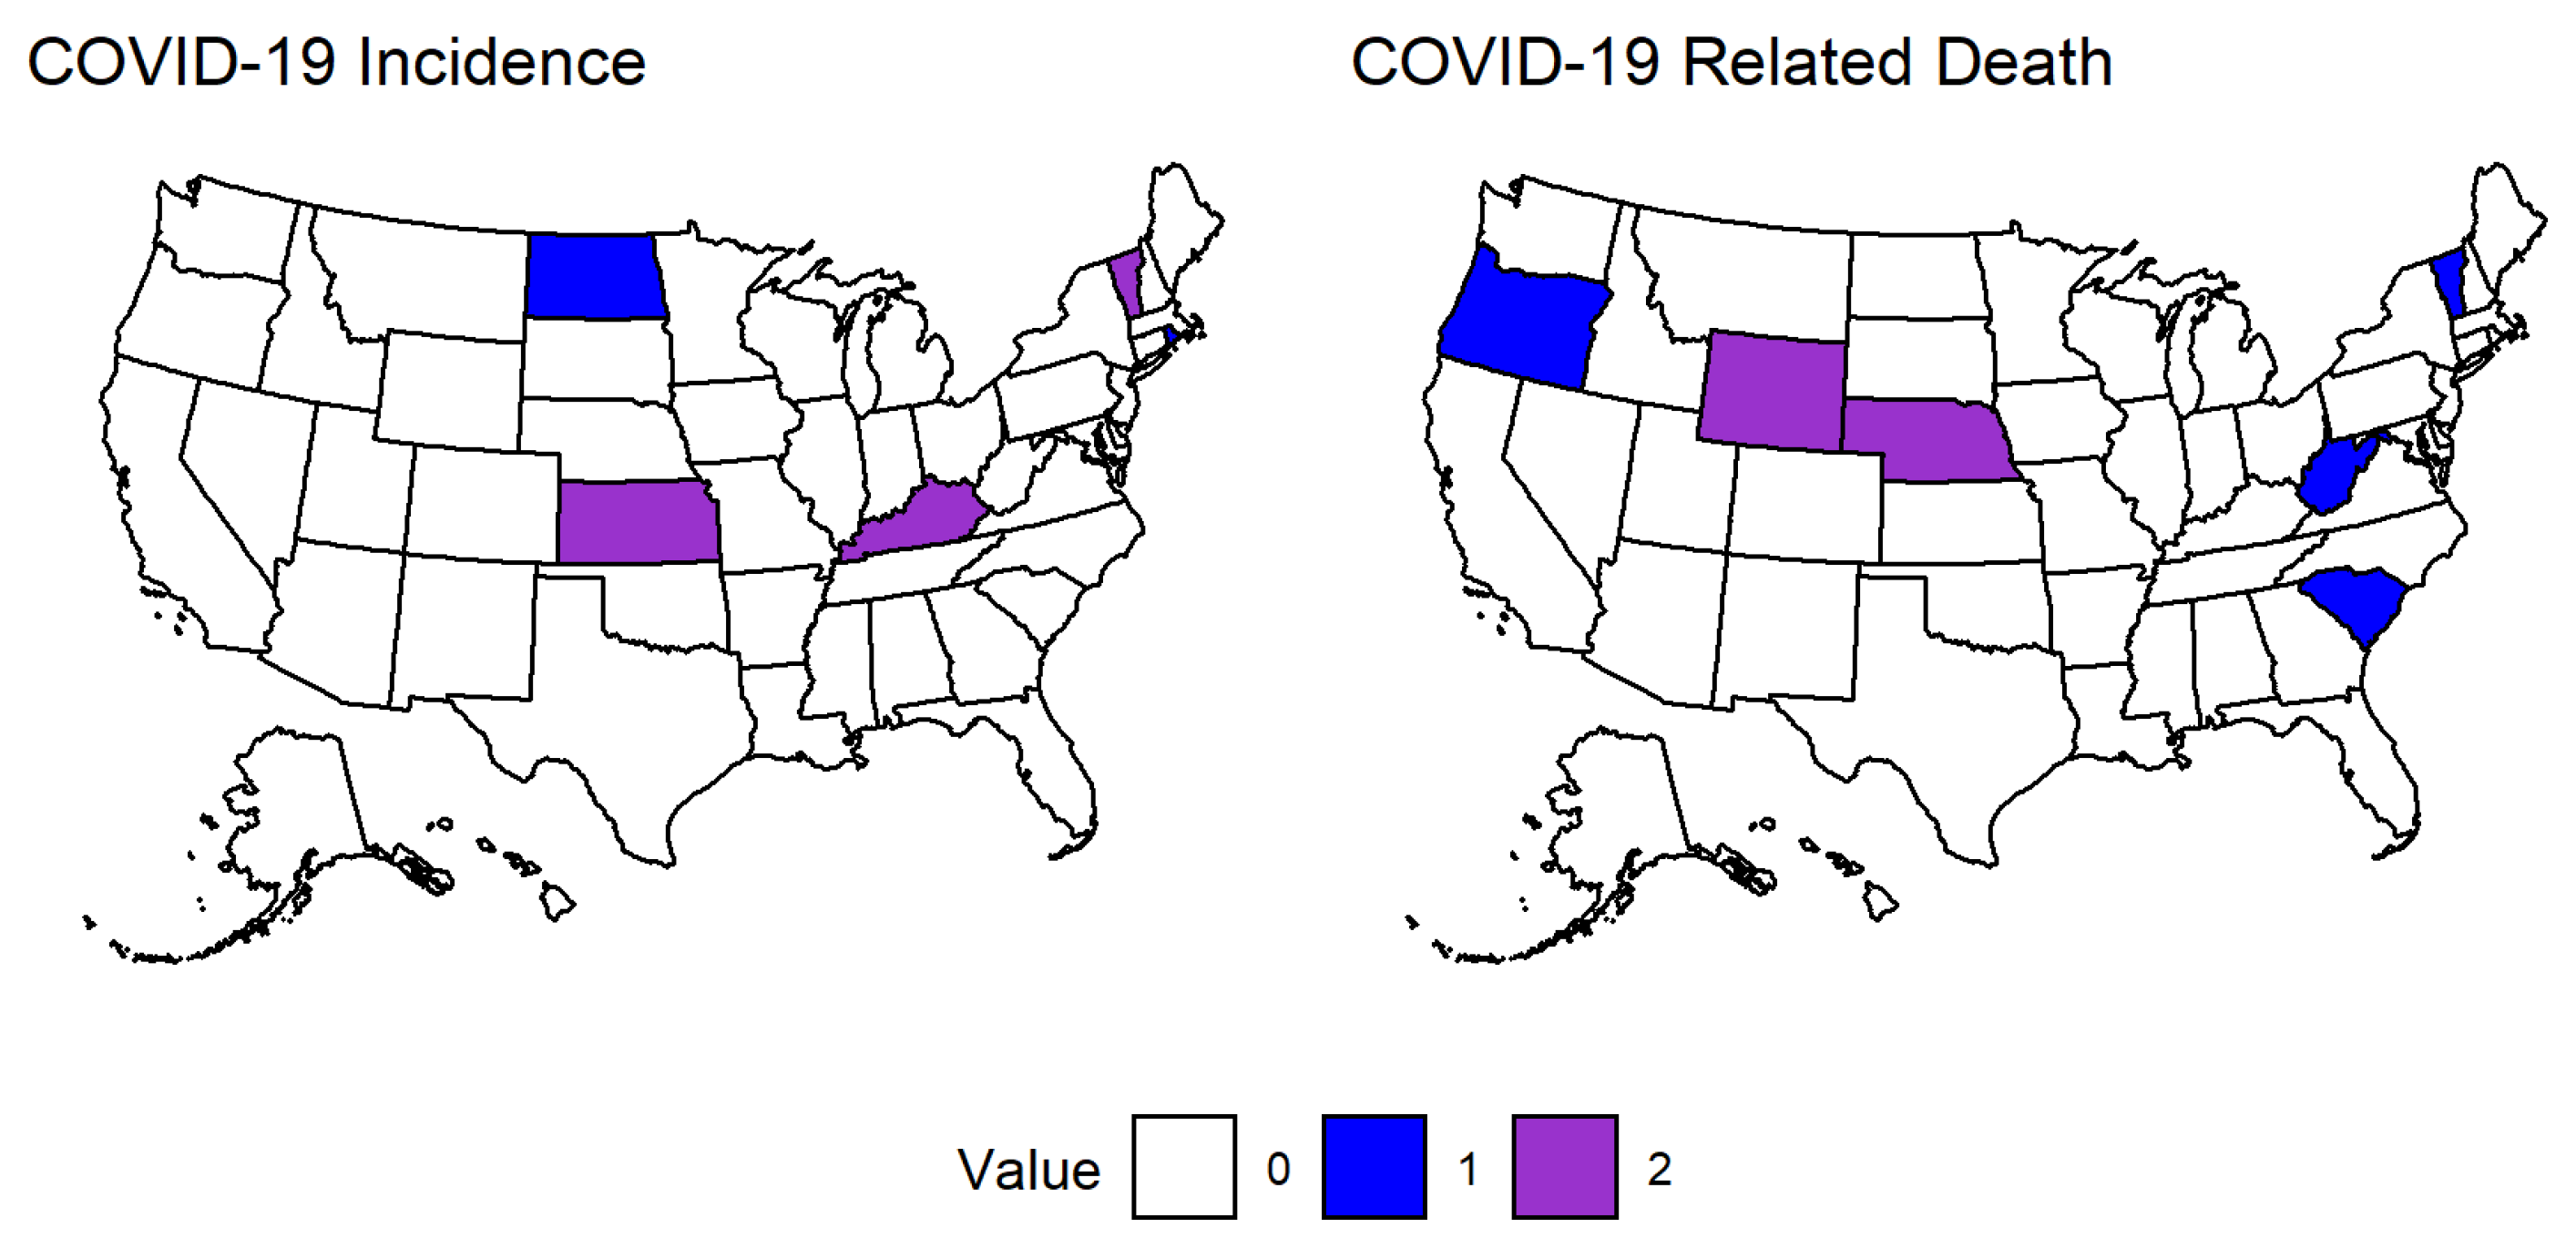
3.1.1. Effects of COVID-19 in the Second Time Period

Figure 1 shows which states had positive, negative, or non-significant VECM coefficients for COVID-19 incidence and death in their equations for anxiety in the second time period. A total of 30 states returned significant positive coefficients and one state returned a significant negative coefficient for COVID-19 incidence, indicating that as incidence increases, so does anxiety in the general population. These results do not imply that a rise in COVID-19 cases is directly causing an increase in anxiety, though it may be to some degree based on previous studies [9]. Rather, the many factors surrounding an increase in COVID-19 incidence, such as possible school and work closings, increased limits on gatherings, and media coverage of the topic, are likely contributing to this increase in anxiety.
We see much less of an impact of COVID-19 related death on anxiety, however, there are still several significant coefficients. We see mostly positive results with 11 states returning positive coefficients and 3 states returning significant negative coefficients. There are many more positive results in the former case when comparing the impact of COVID-19 incidence versus death. This may mean that during this period of the pandemic, people were overall more concerned with becoming infected with the virus rather than dying from it, especially before they have been infected.
Thirteen states had significant positive coefficients for COVID-19 incidence and one state returned a negative coefficient in their equations for depression as shown in Figure 2. COVID-19 related death had 12 states with positive coefficients and two states with negative coefficients. Here we also see mostly positive results, however there seems to be less of an impact of these variables on depression compared to anxiety, though it is possible that we were not able to account for enough lags to see the longer-term effects of these variables. Another possibility is that individuals had been weathering the pandemic for over a year at this point and feeling of hopelessness and depression caused by the rapid changes that came with the onset of the spread of COVID-19 may have faded, possibly due to pandemic fatigue.

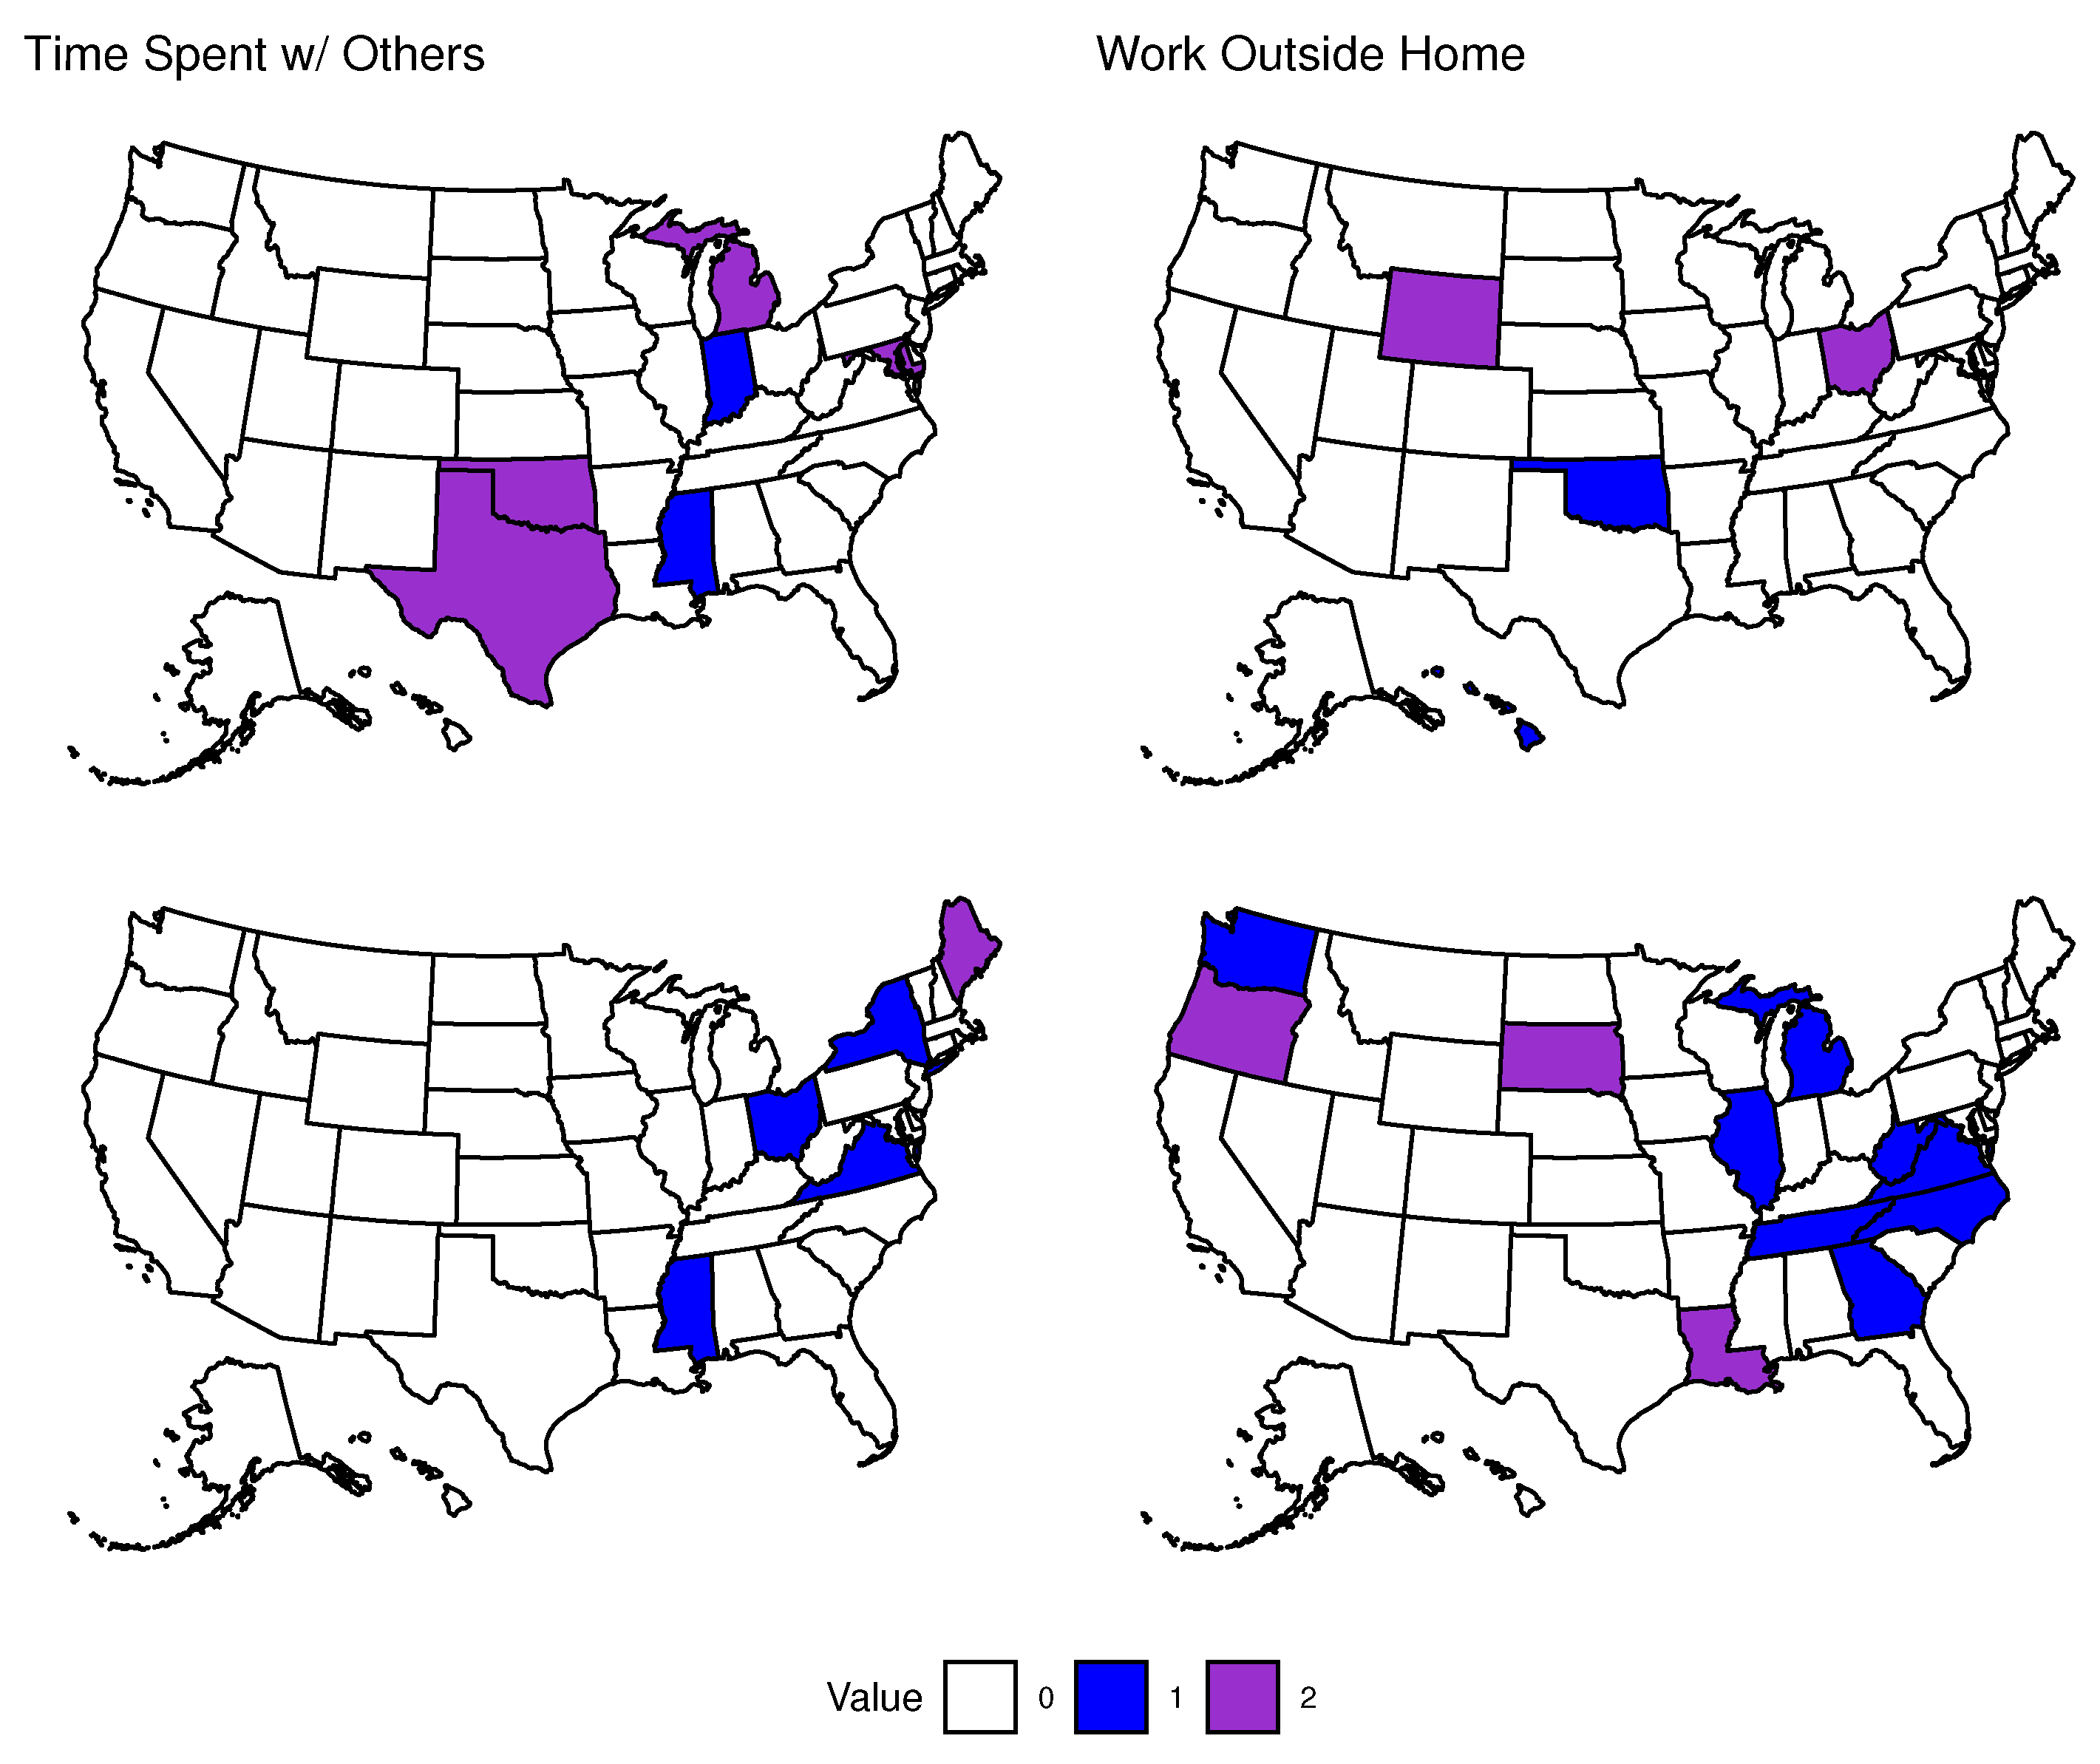
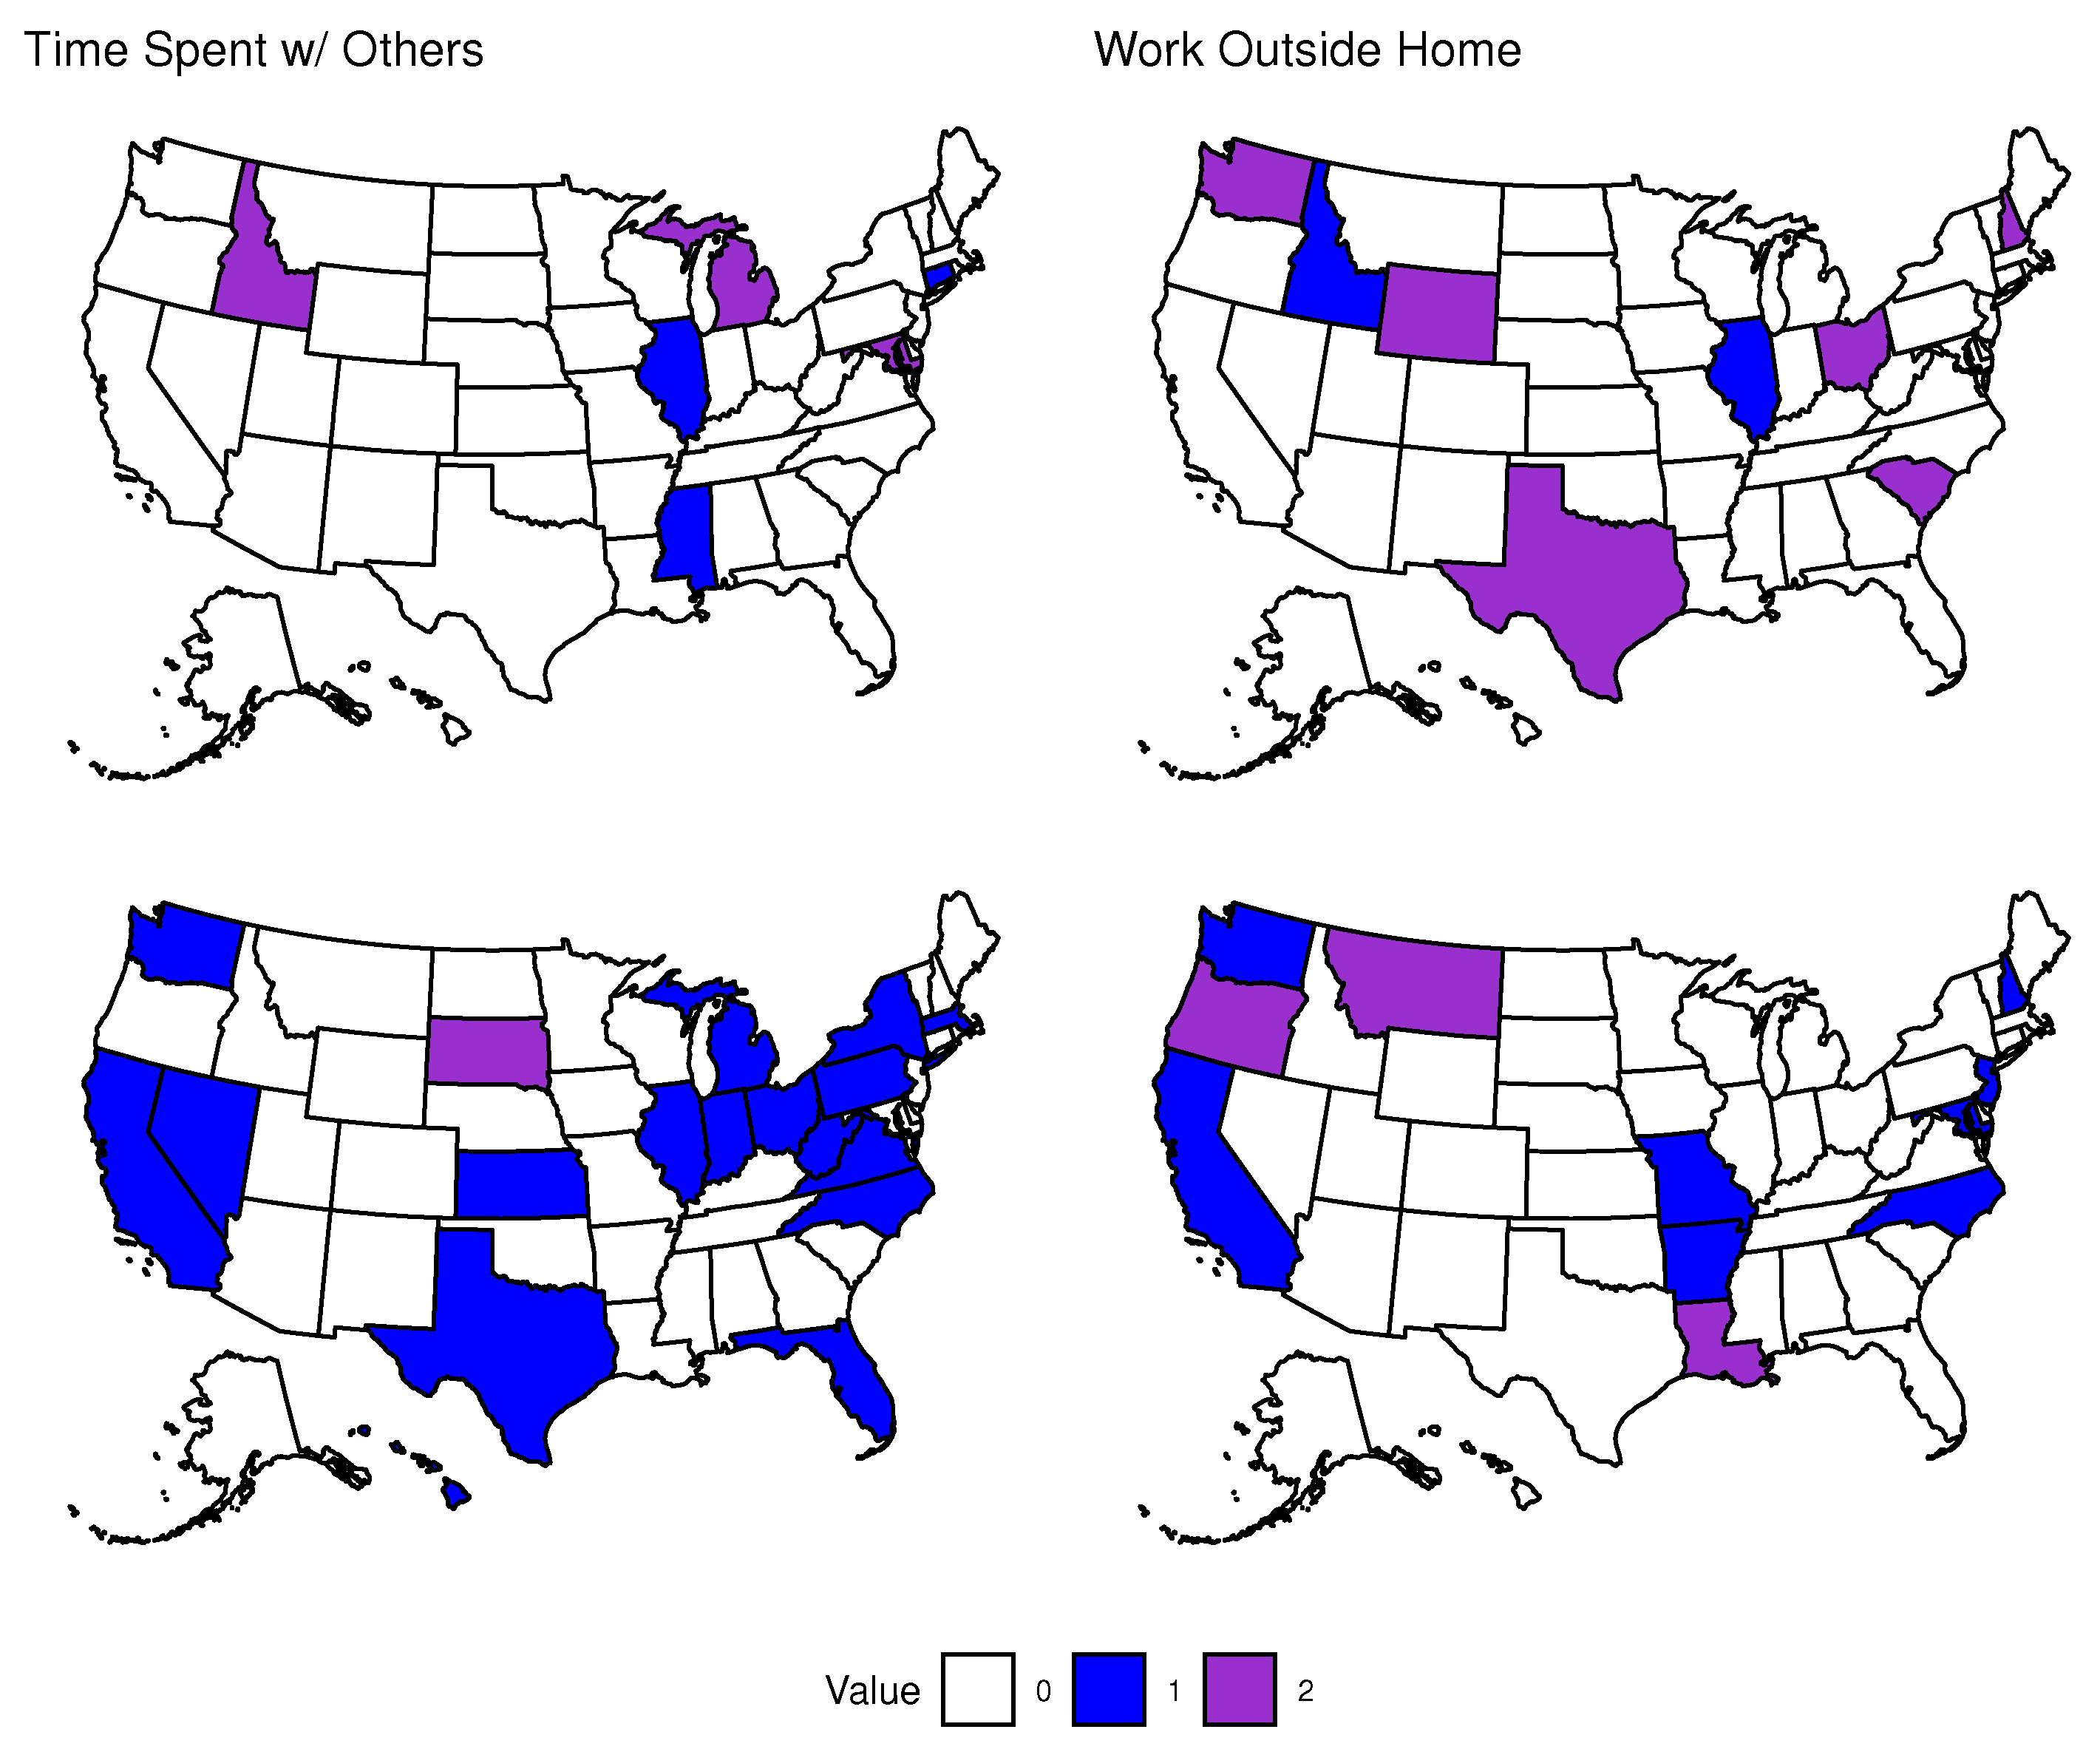
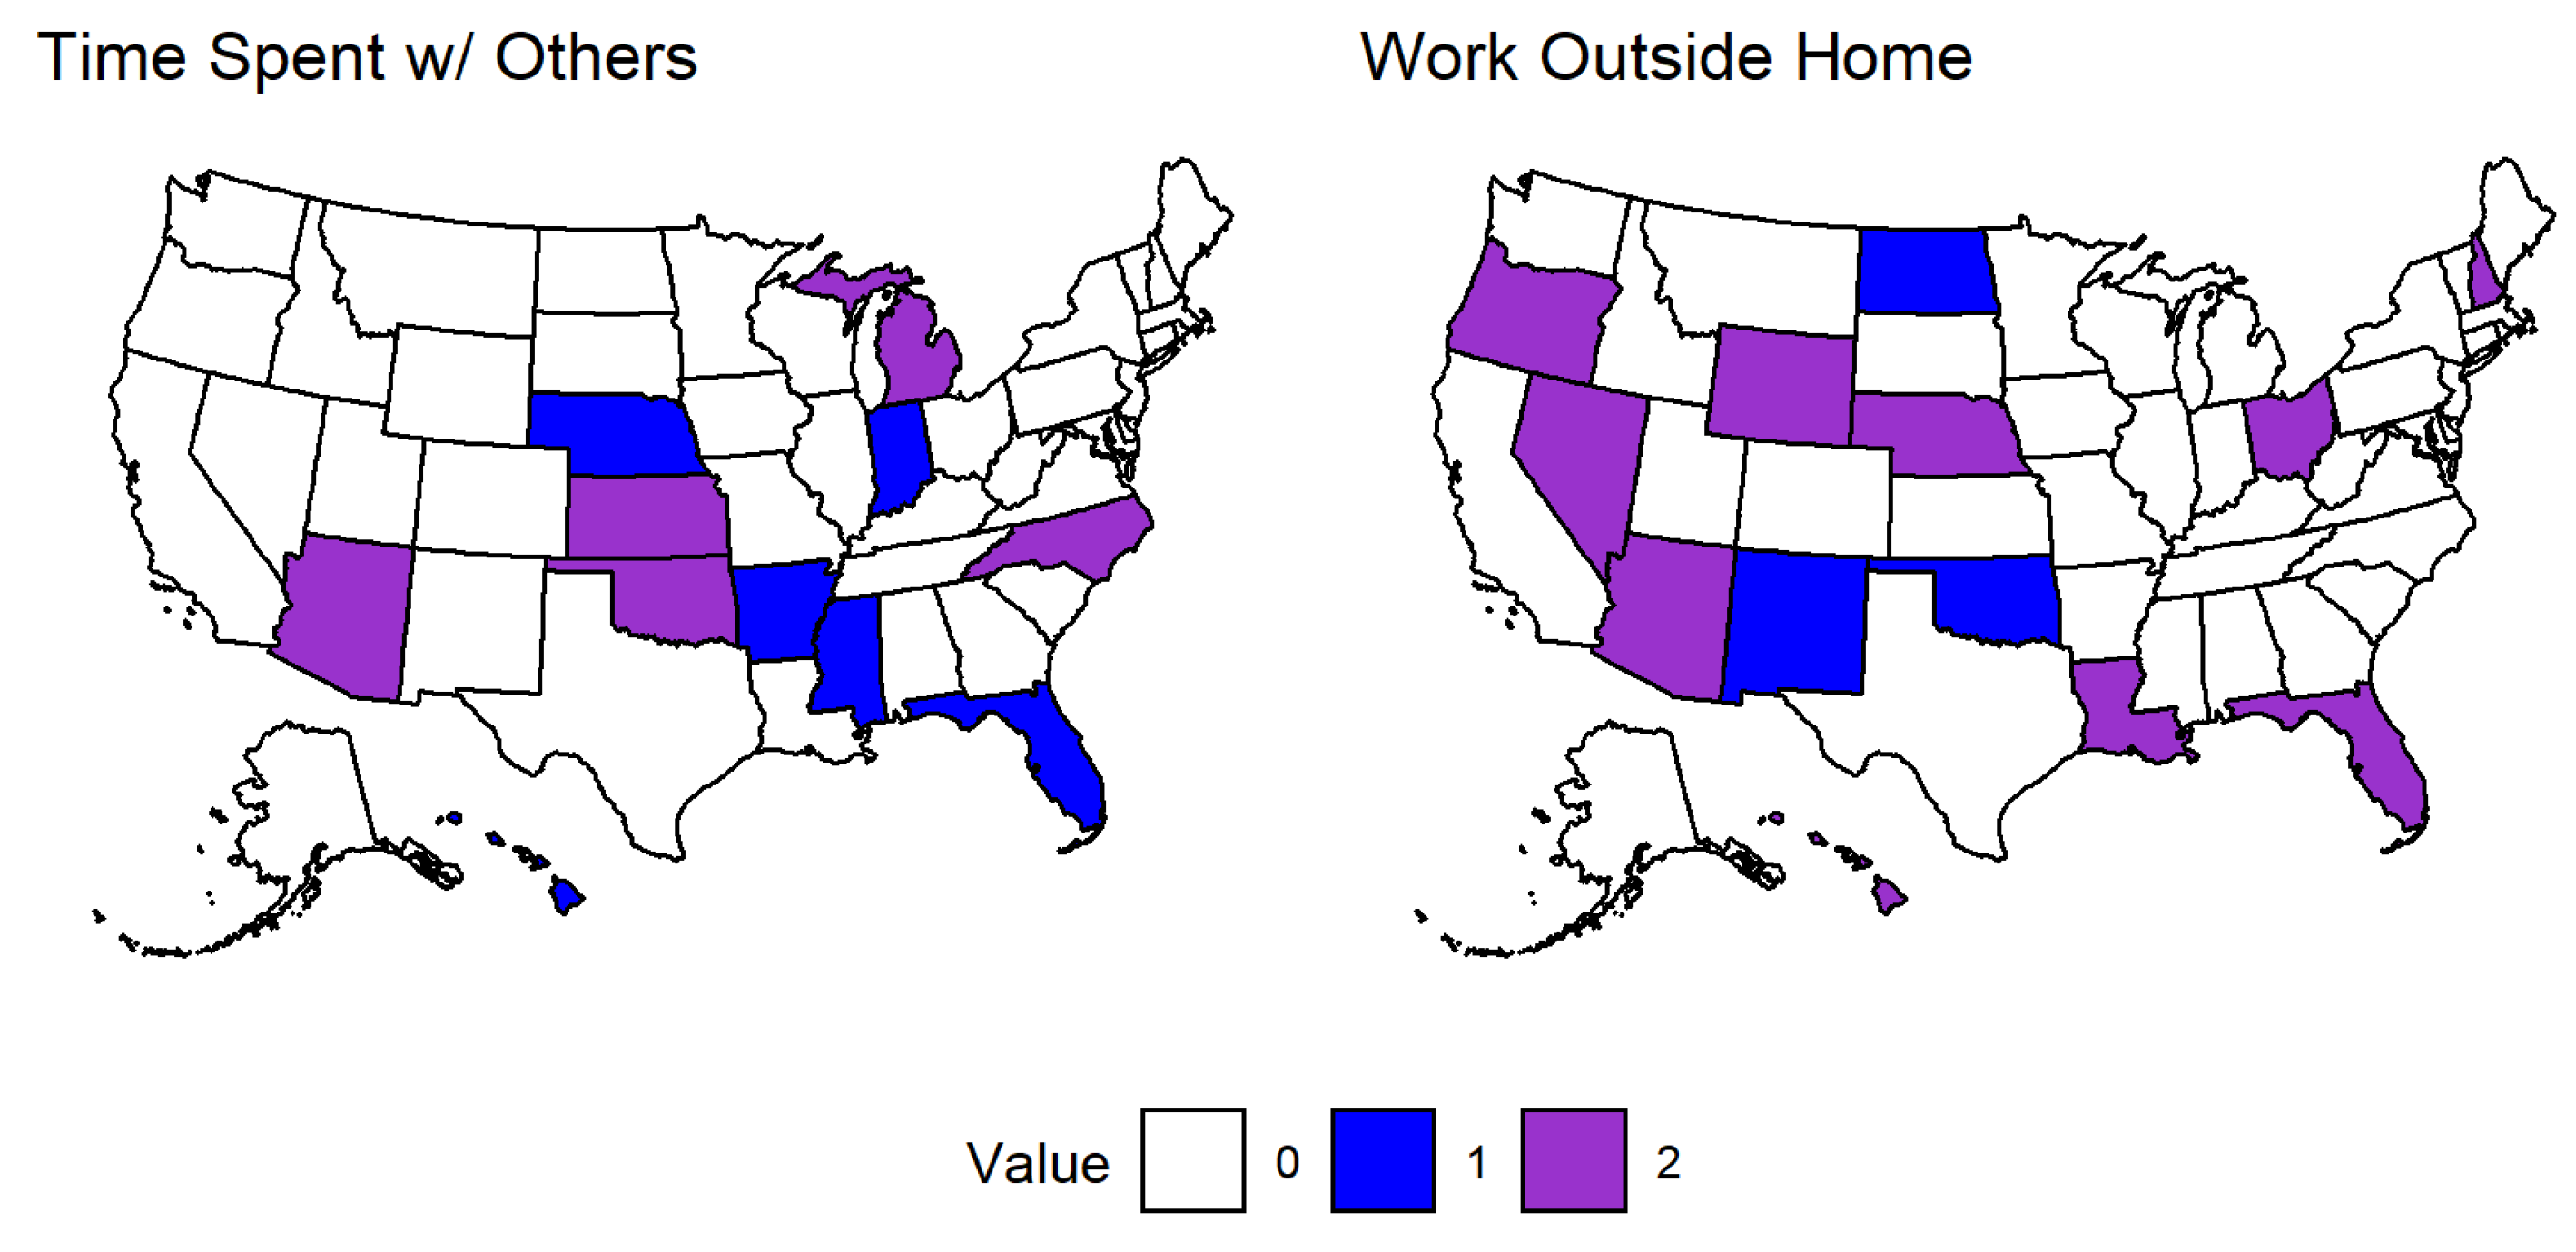
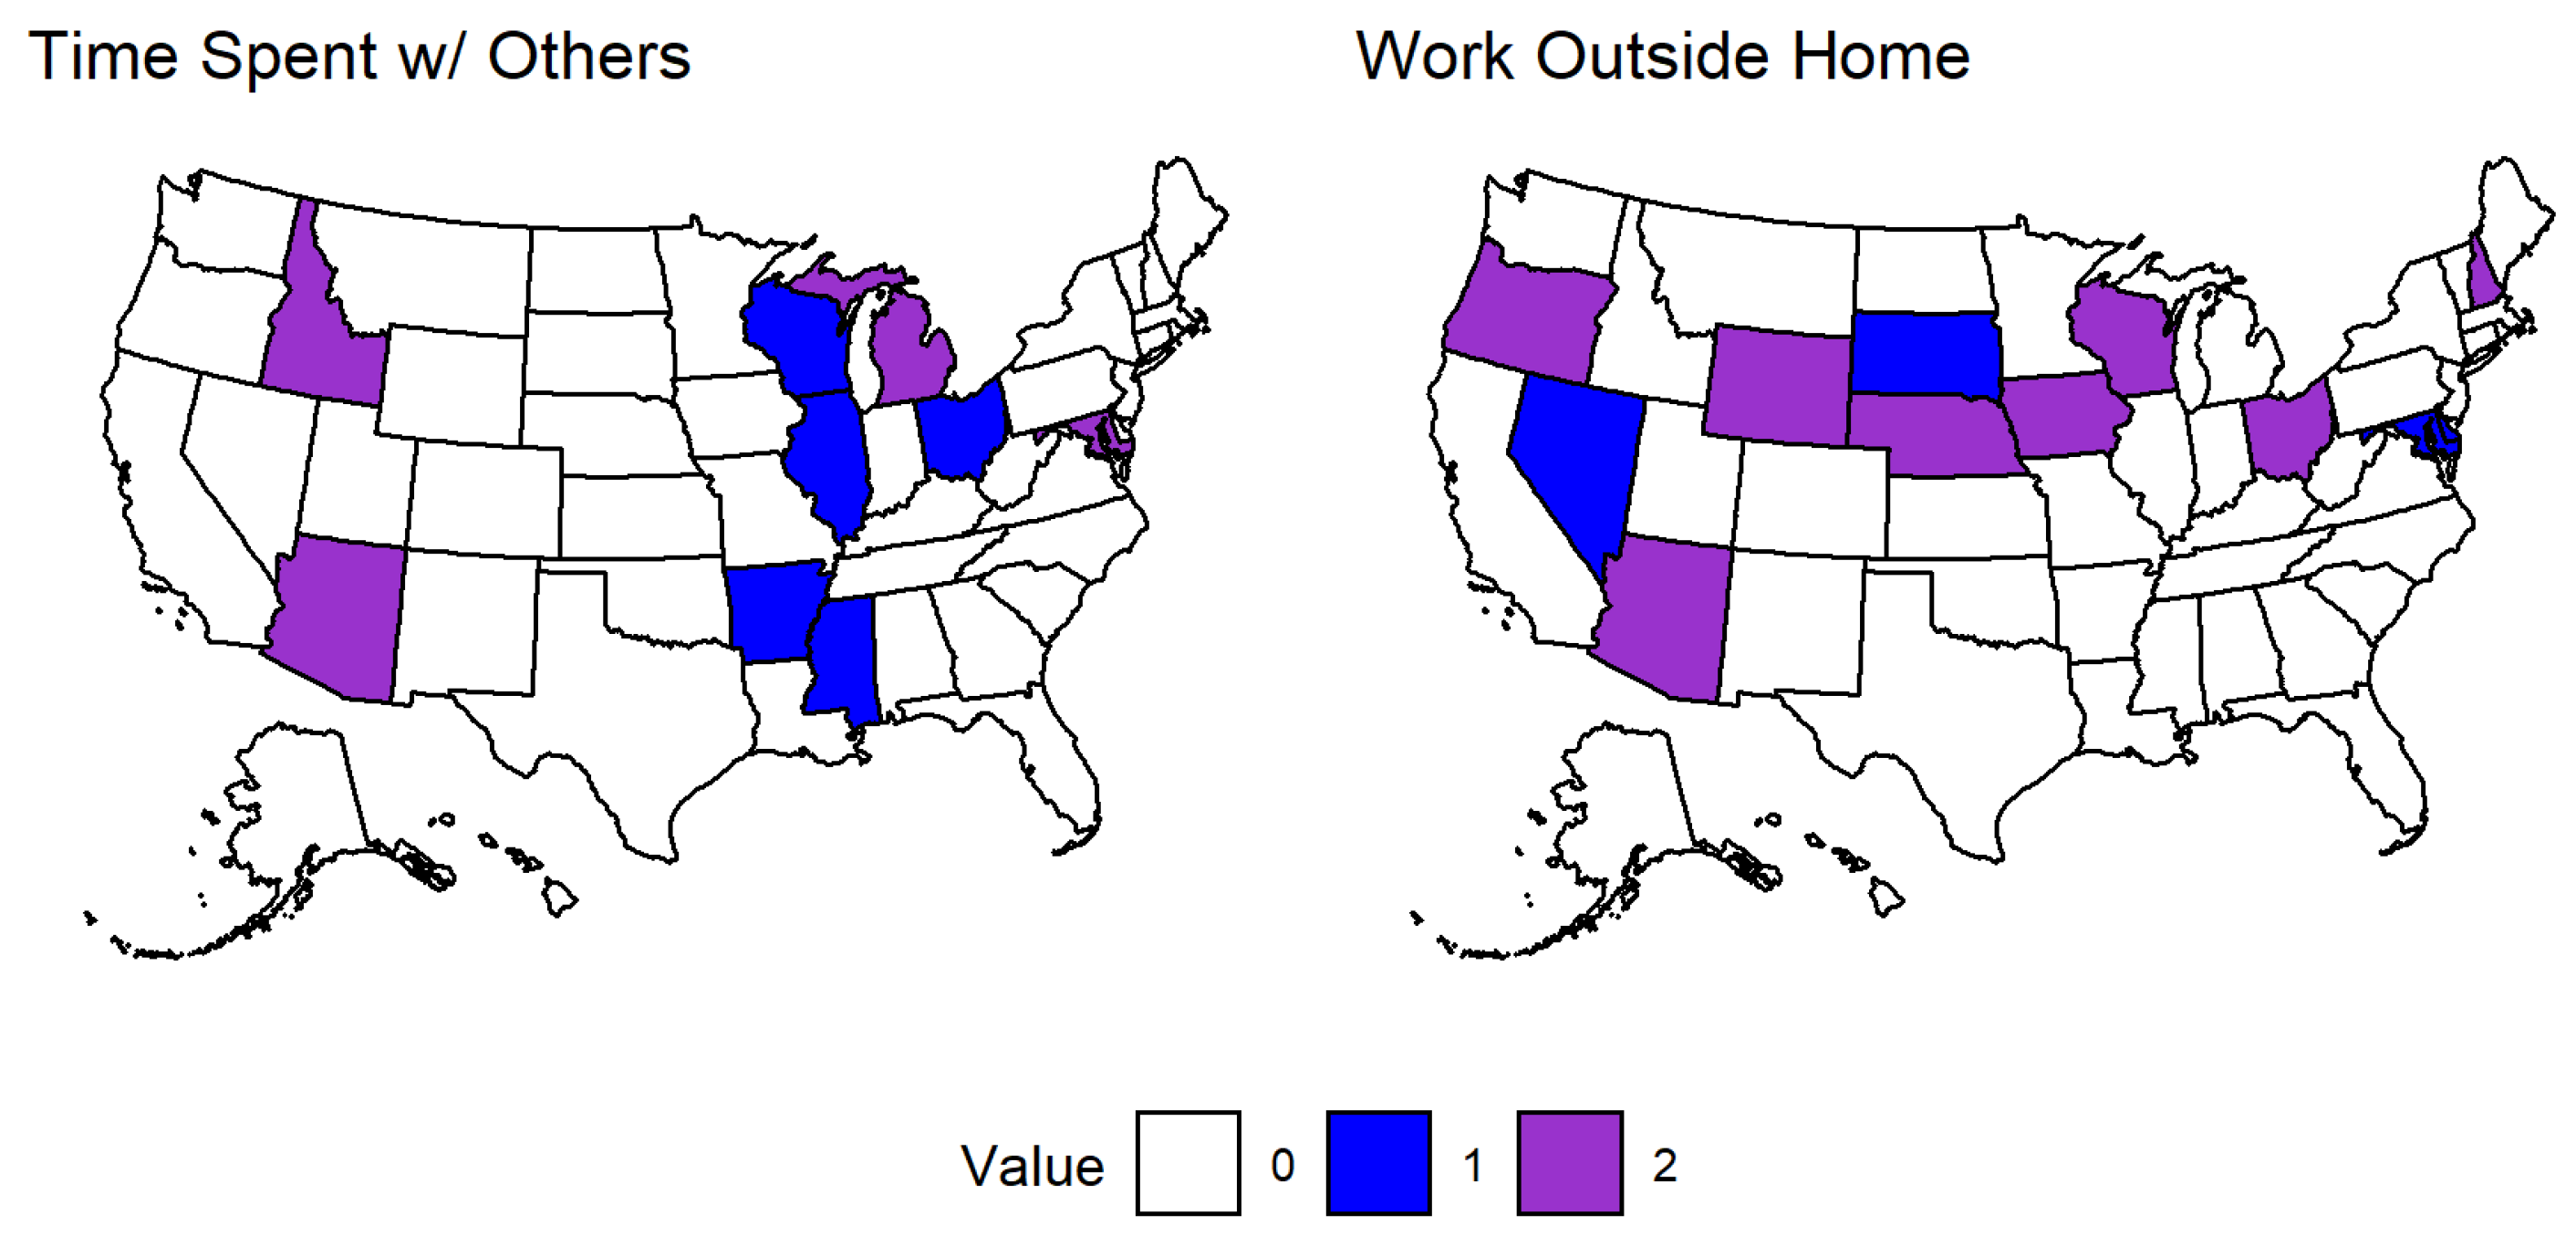
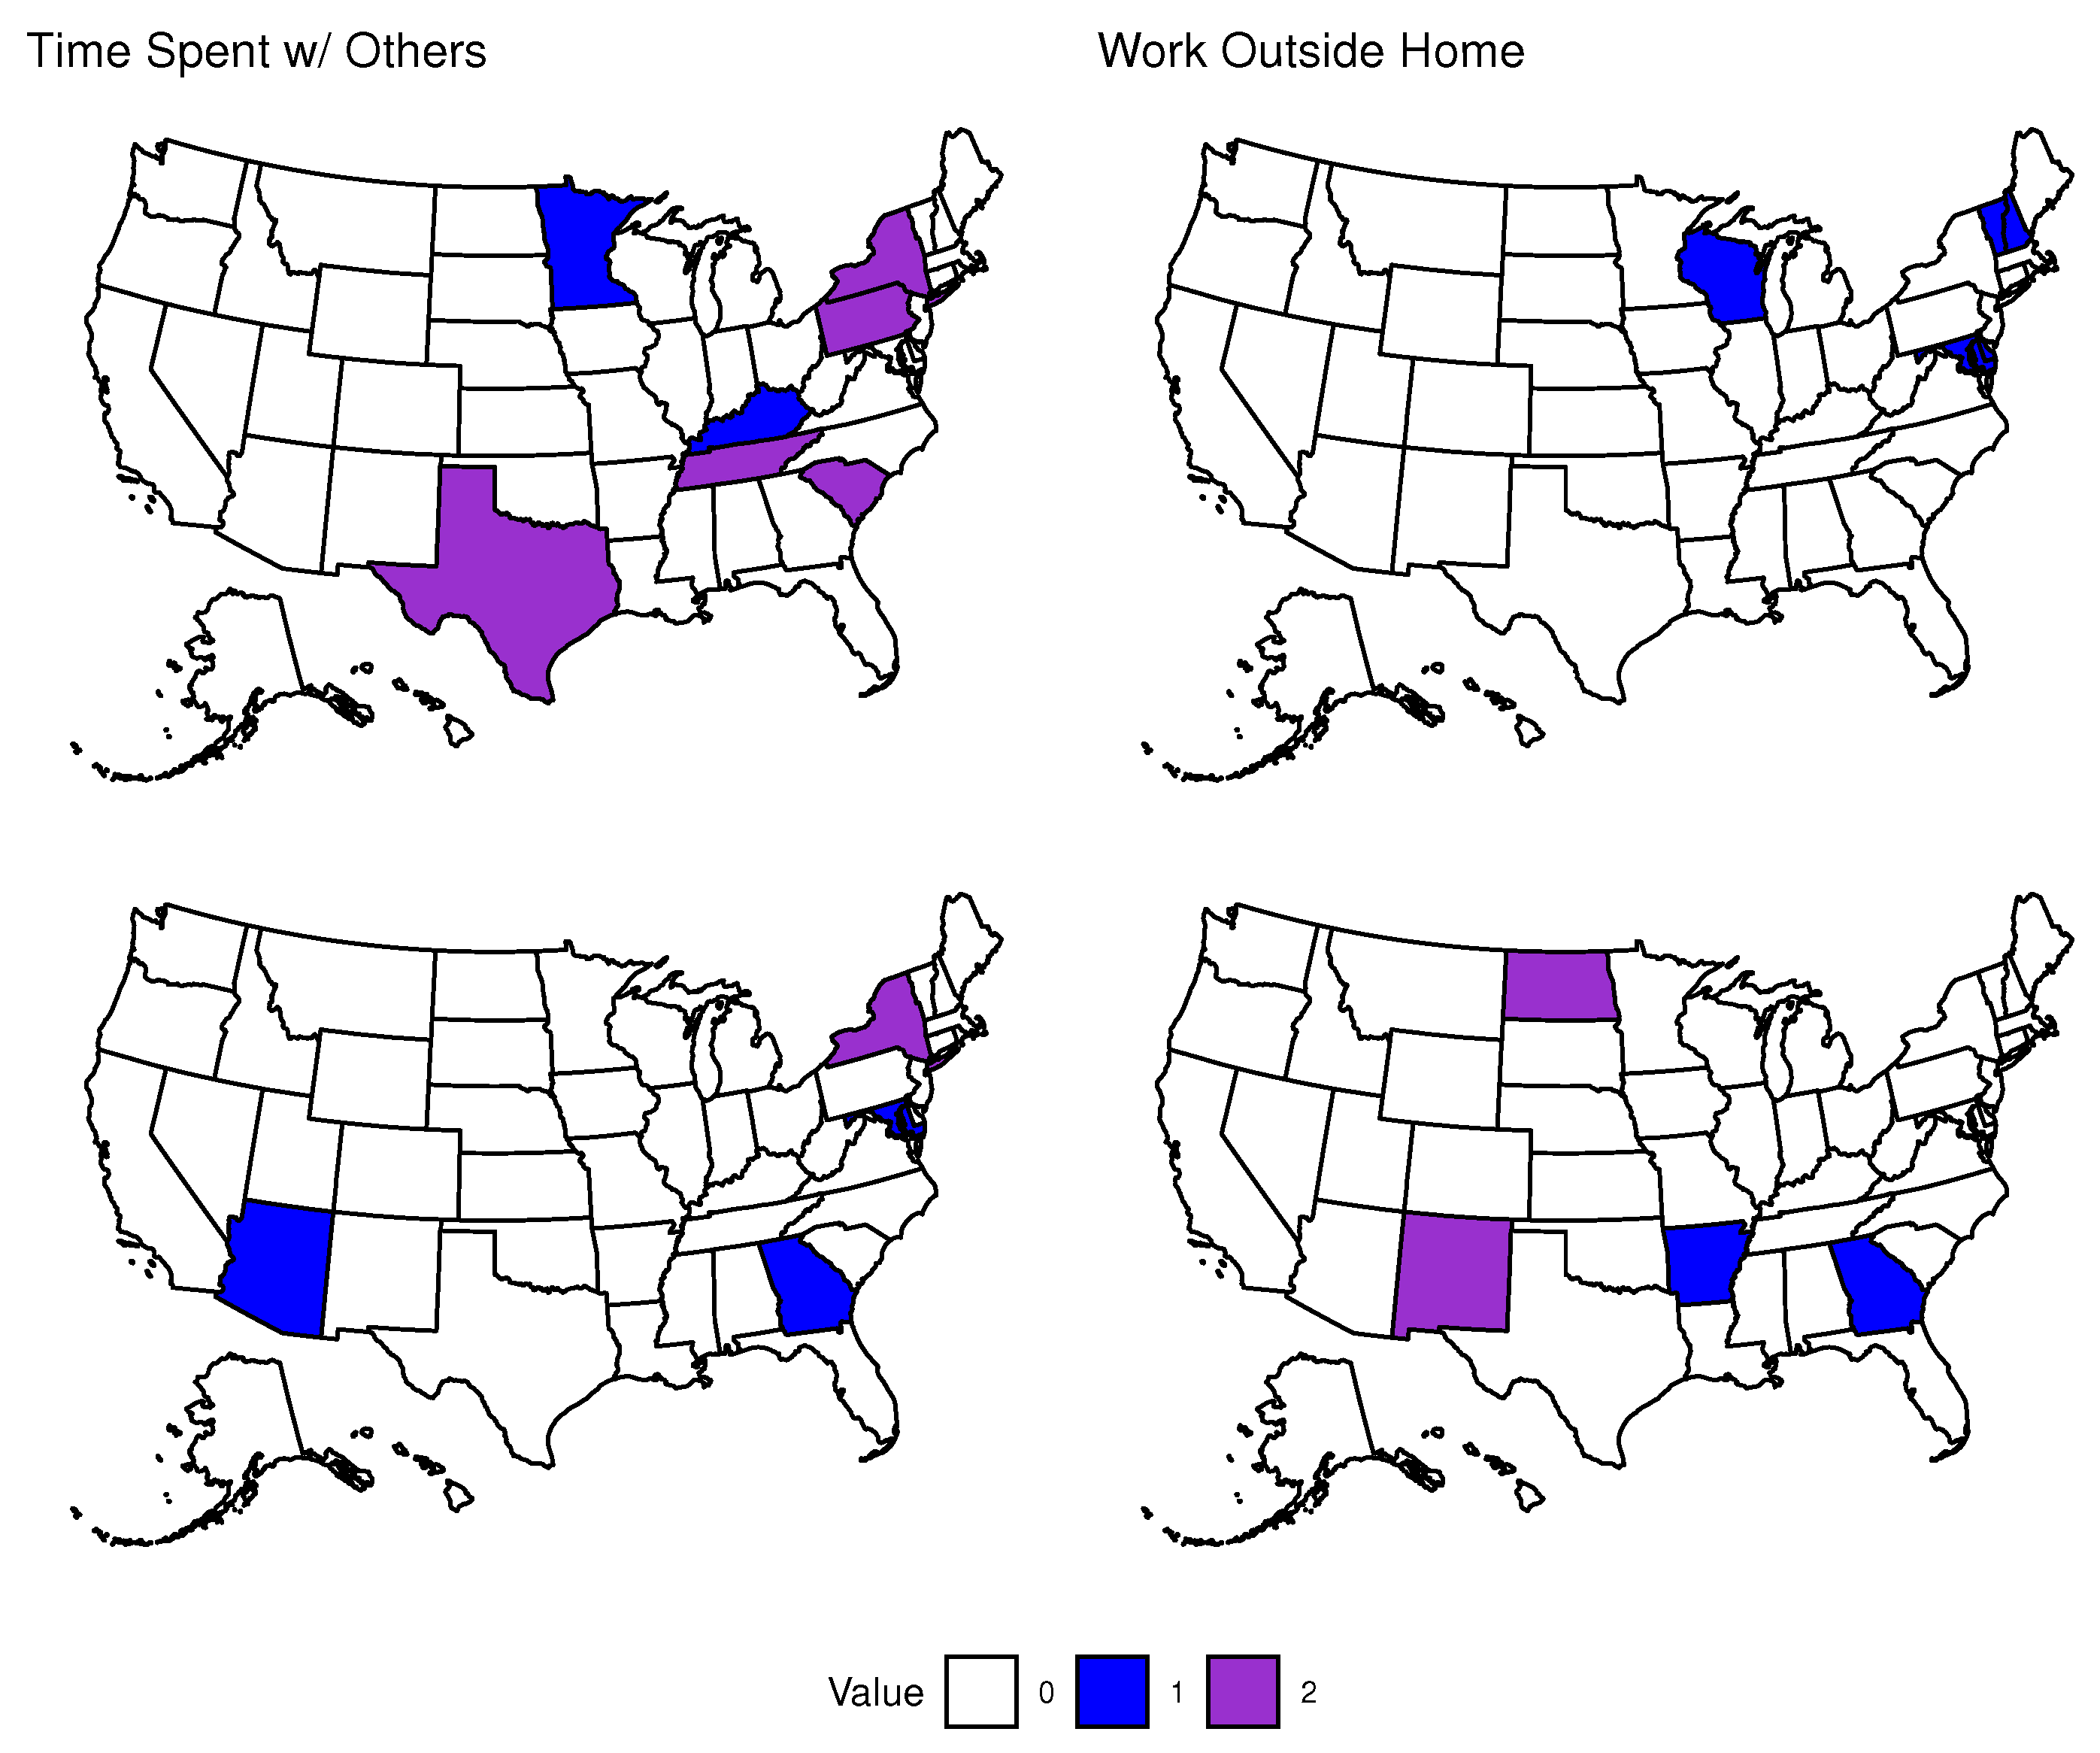
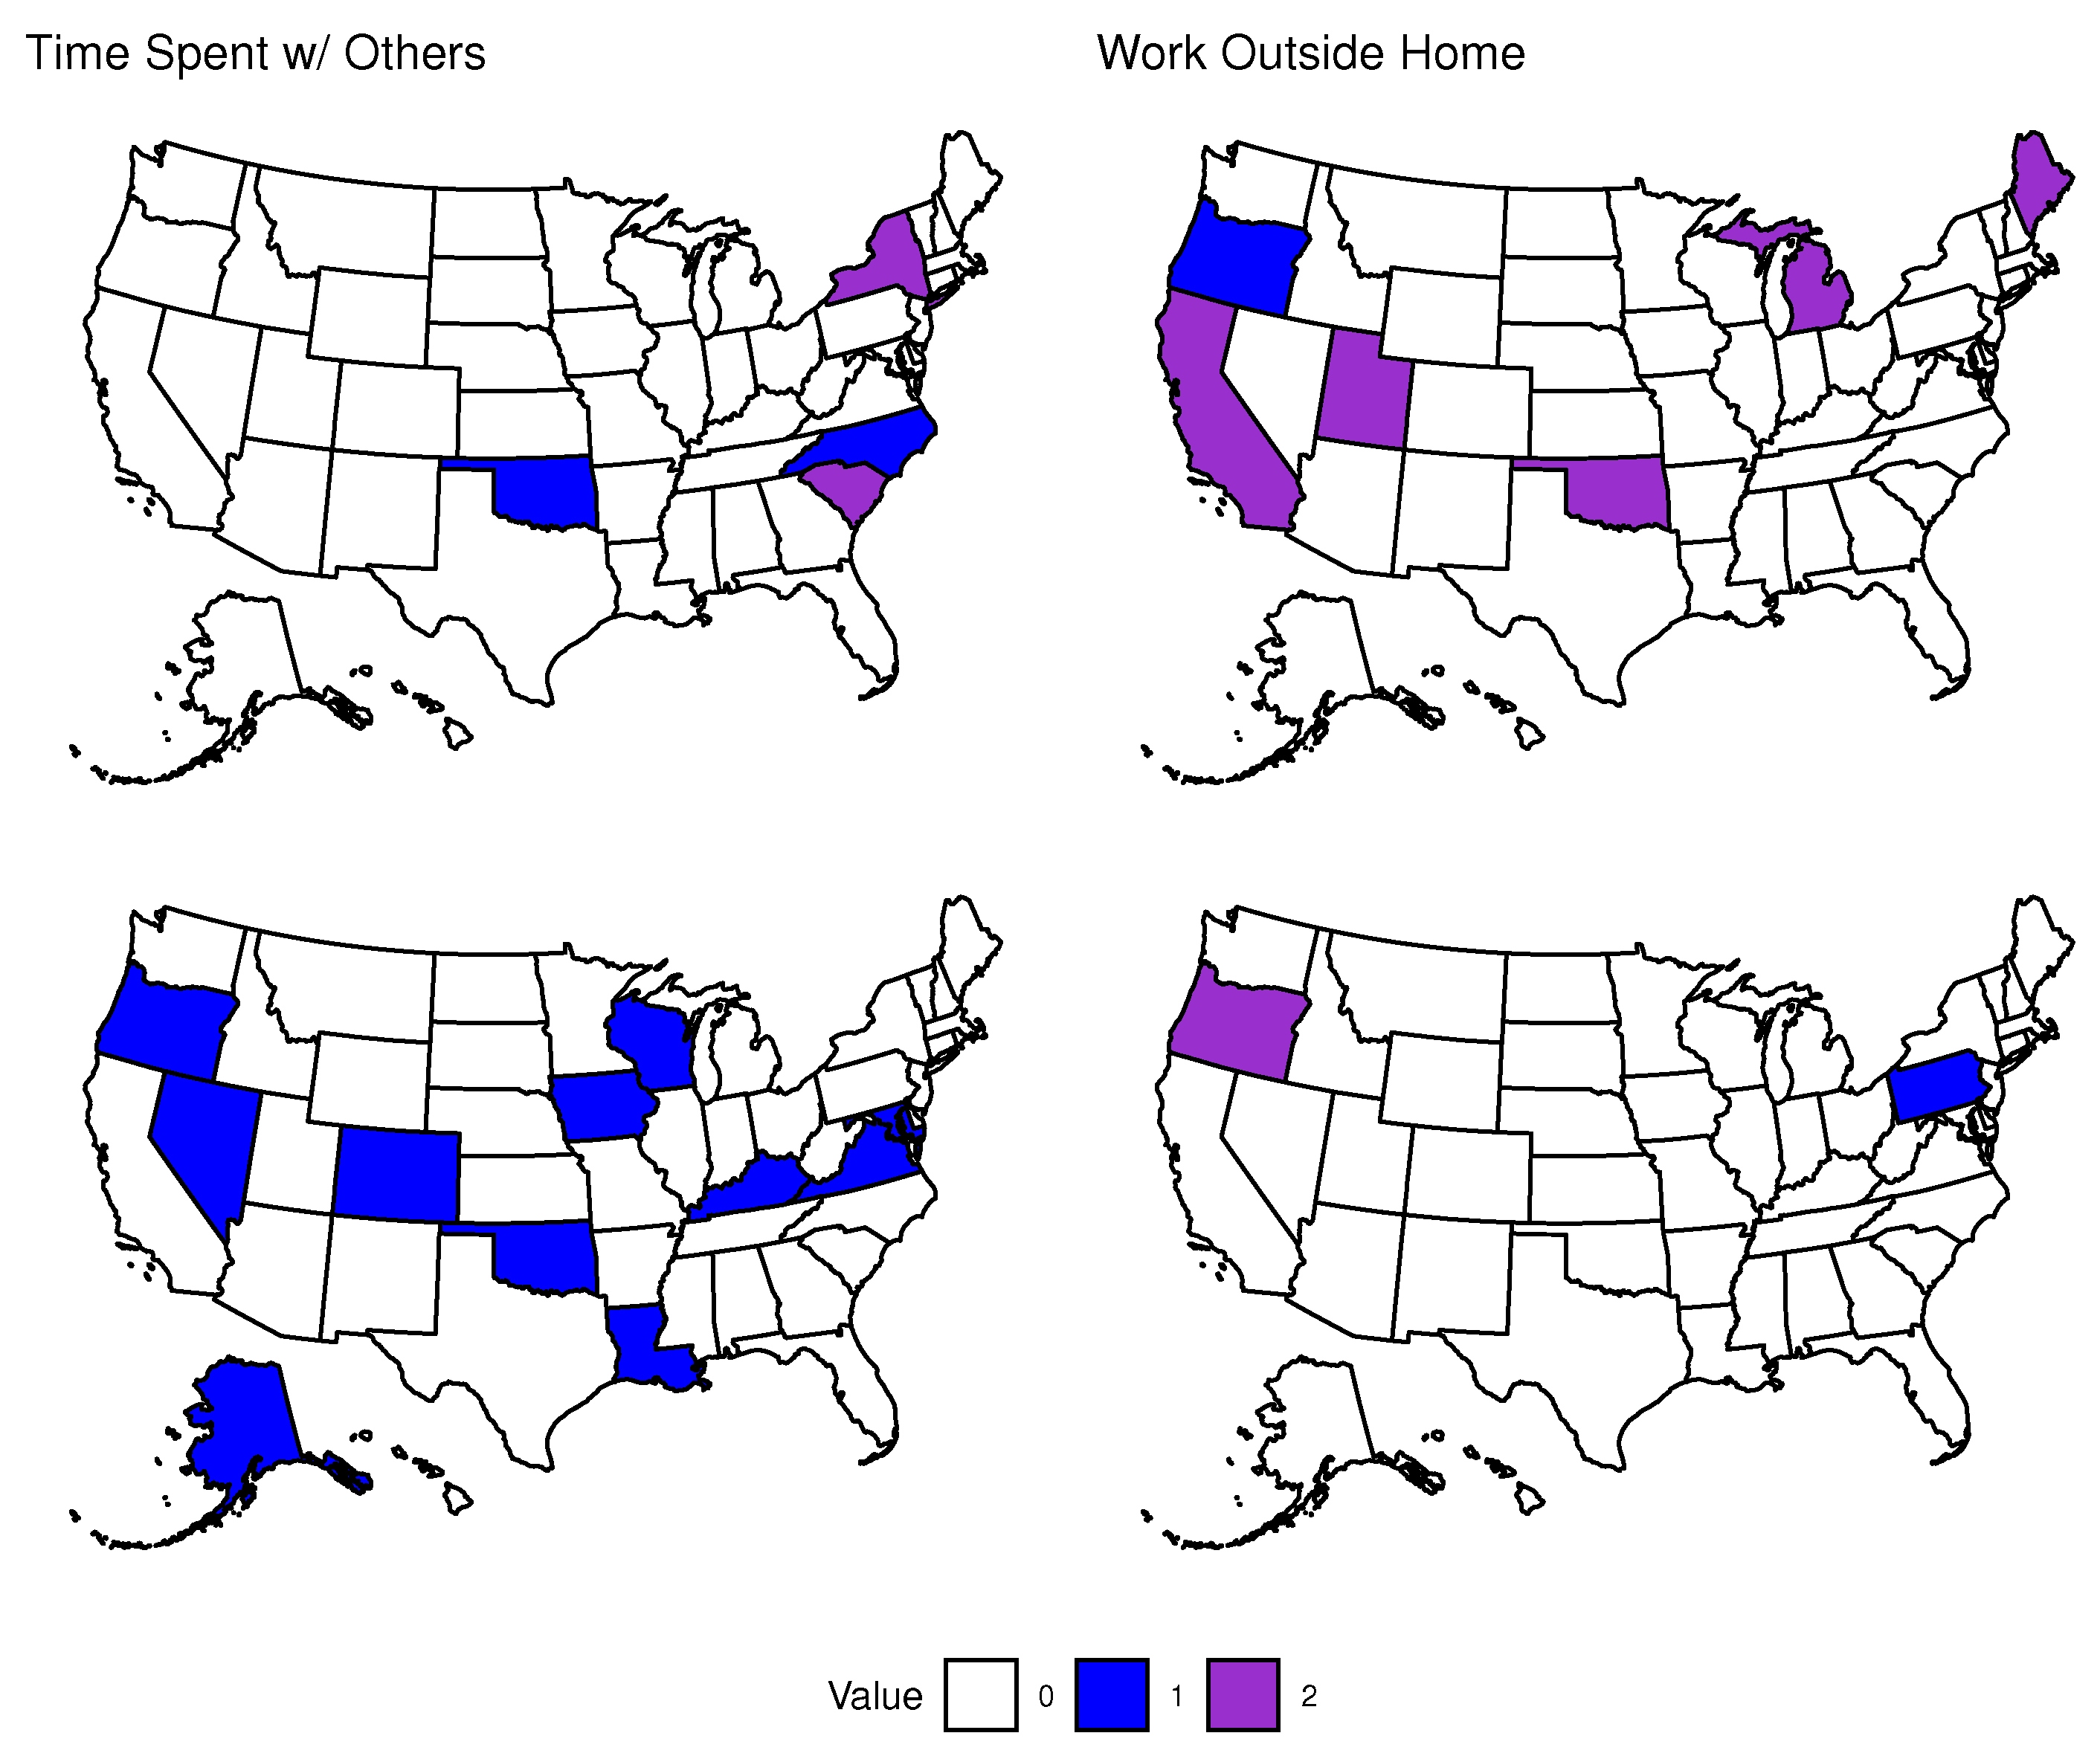
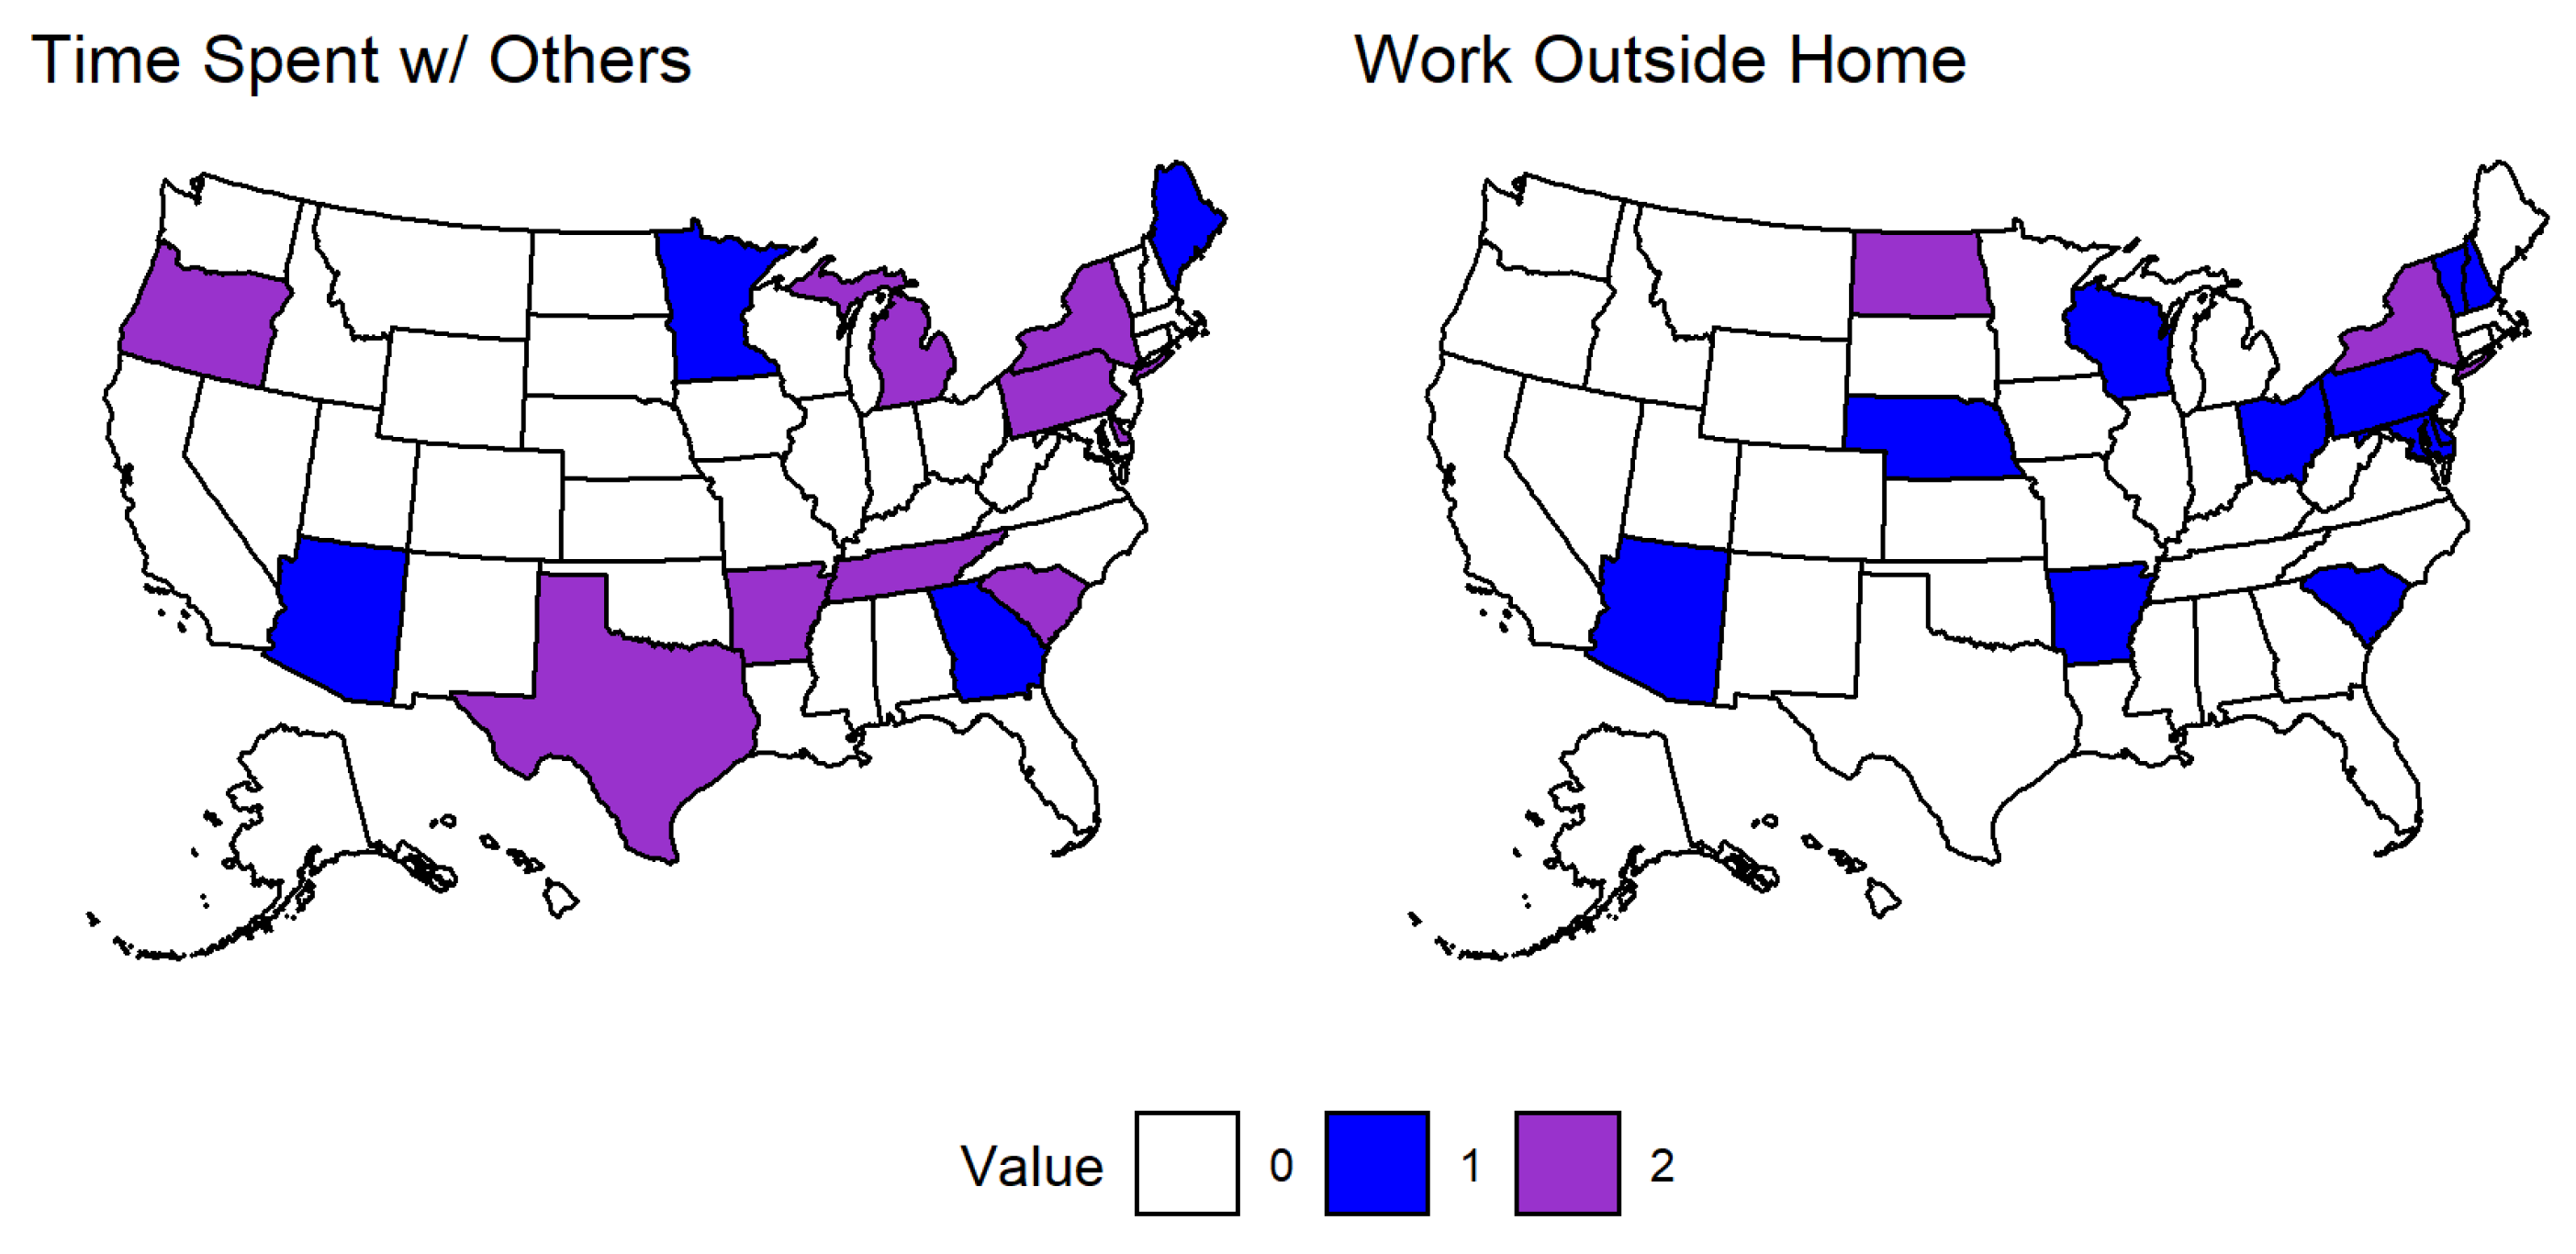
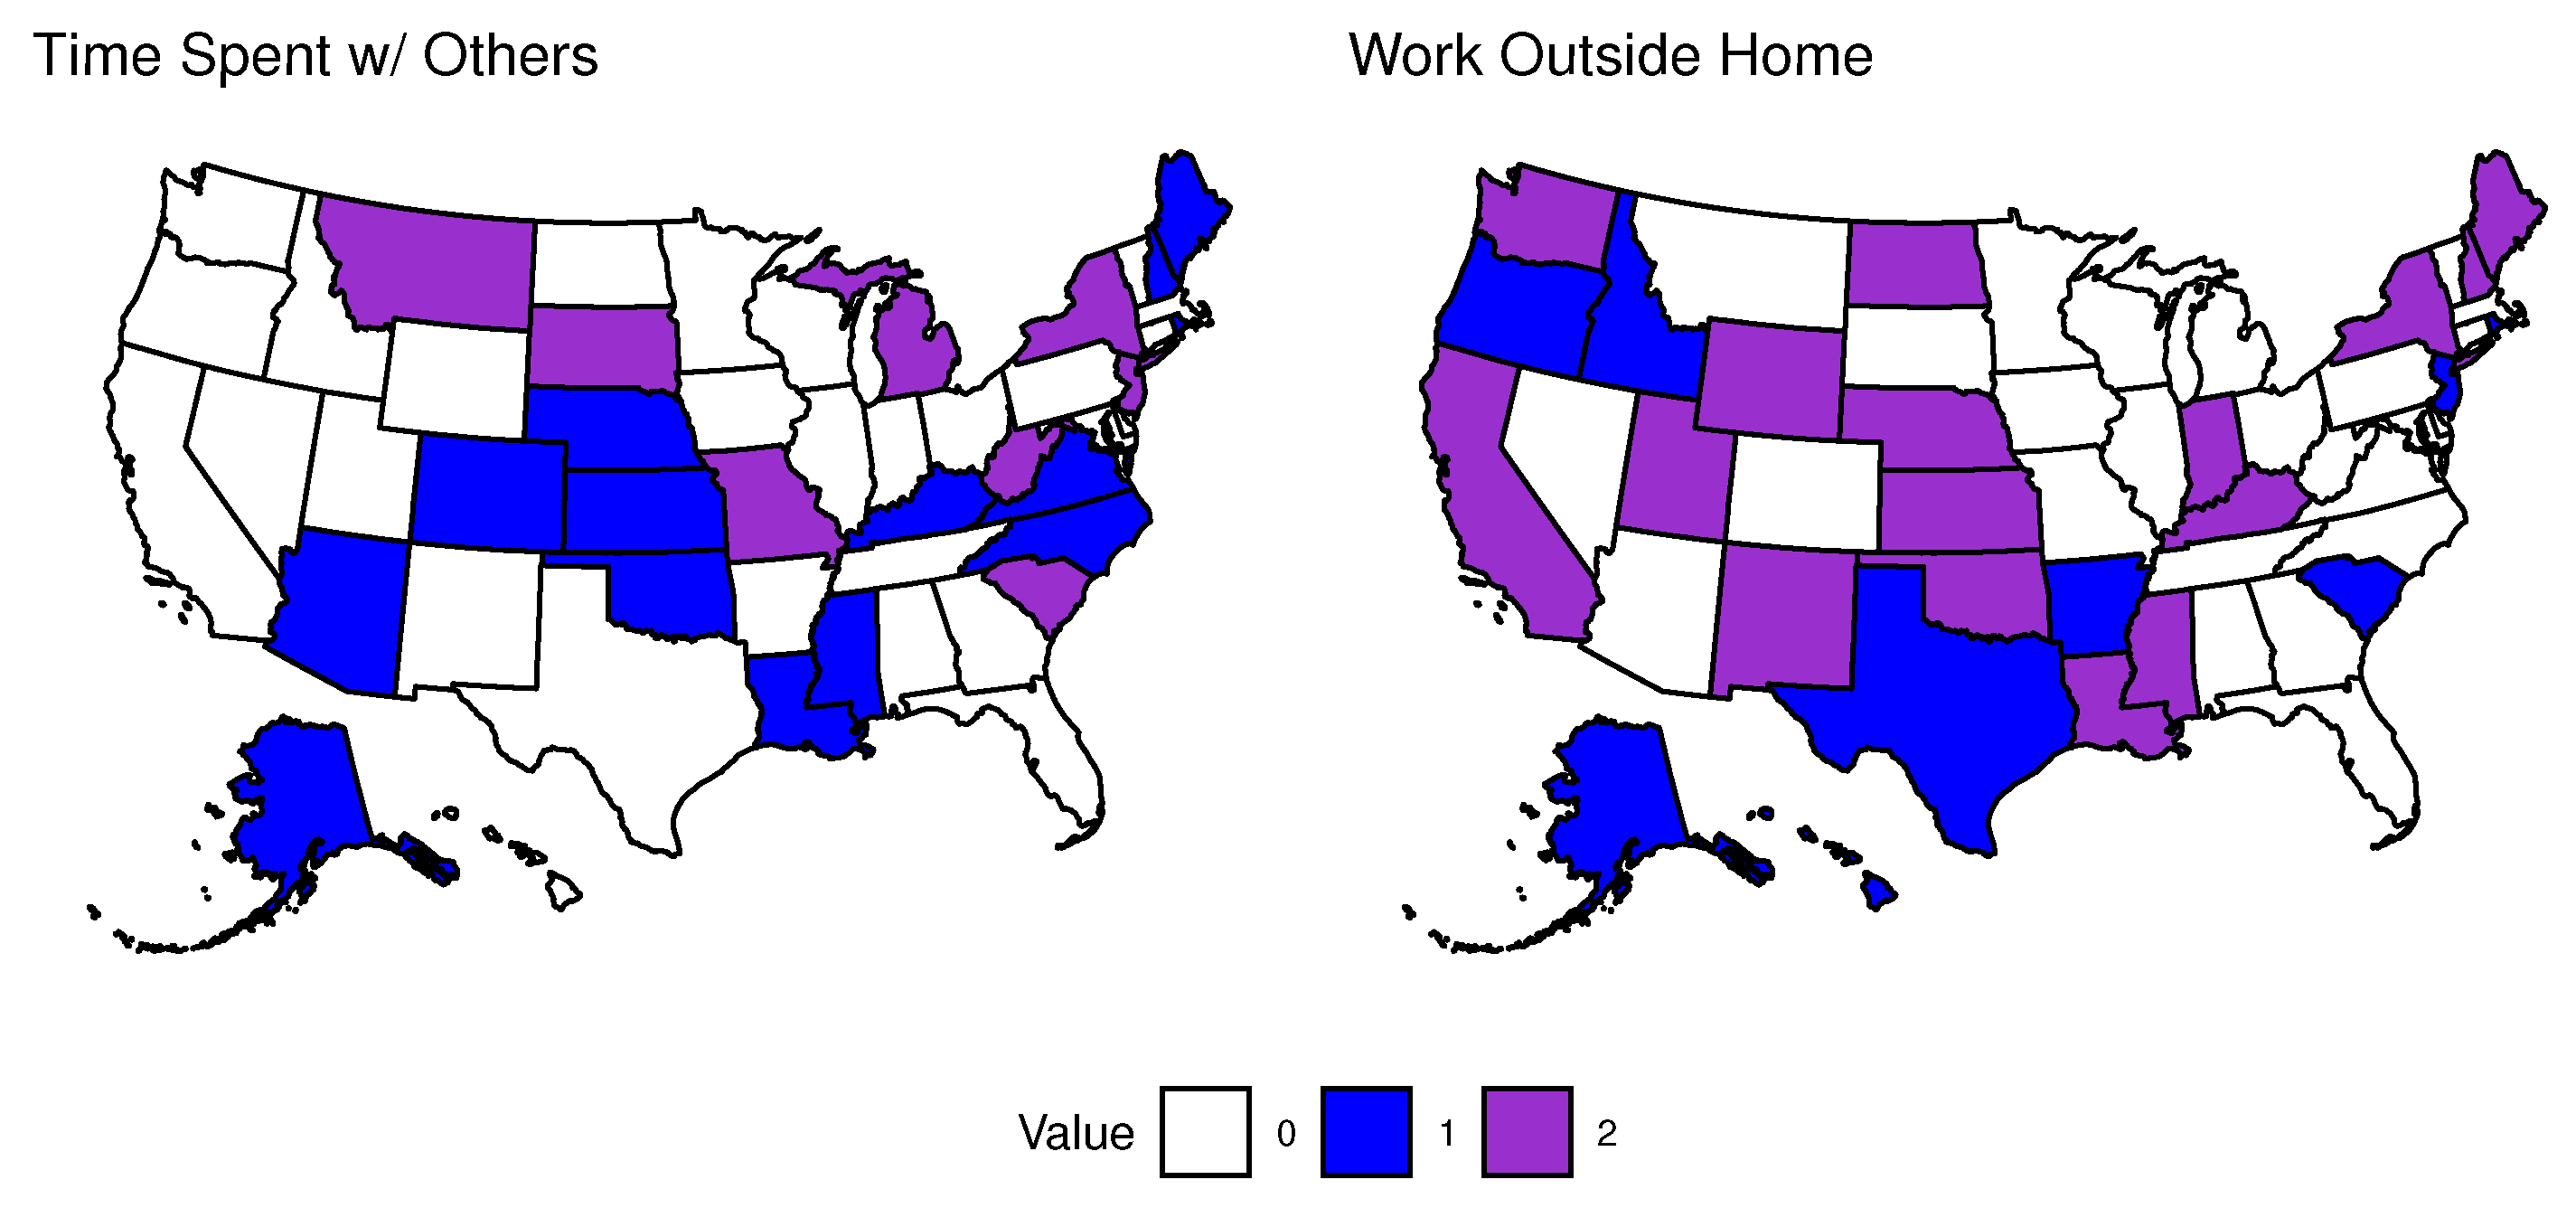
3.1.2. Effects of Social Isolation in the Second Time Period

Figure 3 shows that time spent with others indoors had a total of five states with significant positive coefficients for this variable and five states with significant negative coefficients. No states in the western United States returned significant results for this variable. Working outside of the home indoors gave significant positive coefficients for ten states and negative coefficients for five states. The results were more varied for this variable in terms of geographic distribution compared to time spent with others indoors. These variables had less of an association with anxiety compared to COVID-19 incidence and only a minority of states returned significant coefficients, possibly indicating that by this point, most individuals had adapted to life during the pandemic and were not as concerned about in-person social or work-related gatherings.
Finally, we describe the number of states with significant coefficients for social variables in the second time period in equations for depression (see Figure 4). Nineteen states returned positive results and four states returned negative results for the variable time spent with others indoors. Note that one state (Michigan) had a negative coefficient for the first lag and a positive coefficient for the second lag of this variable, making it difficult to determine the actual association it had with depression in that state. The variable estimating the percentage of individuals working outside their home indoors had nine states with positive results and nine states with negative coefficients. In this case, two states (New Hampshire and Washington) went from negative in the first lag to positive in the second lag.
Interestingly, there are more significant results for variables related to social isolation and their association with depression compared to anxiety. Based on our results, it seems more likely that negative social interactions have a much greater association with depression than anxiety. Further, general social interactions (those captured by time spent with others) also seems to have a greater impact than work-related social interactions during the time period of our analysis. When comparing variables related to social isolation to variables related to COVID-19, we see that variables related to COVID-19 have a much more predictable and mostly positive association with the prevalence of mental health issues. On the other hand, since the interactions caused by an increase in social variables can be good or bad, these variables were less significant and less reliable in terms of their association, particularly with the prevalence of anxiety. For both anxiety and depression, we have either more or an equal number of states with significant coefficients in the second lag of variables compared to the first.

3.2. Impulse Response Function Results

Due to the nature of impulse response functions (IRFs), we are able to more easily interpret the effect that an increase in each variable has on anxiety and depression in the general population. Again, seeing a significant result for one variable after increasing another does not imply that the latter variable is causing the increase in the former. Likely due to the fact that we have fewer data points in the first time period, there are more differences between significant results in the first time period’s IRFs compared to the coefficient results discussed previously. Due to that and for the sake of brevity, we present only the results for the second time period and provide the results of the first time period as well as the IRF results from the percentage of individuals vaccinated in the second time period in the Appendix B.3 and Appendix C.

Effects of COVID-19 in the Second Time Period

For the association of an impulse of COVID-19 incidence with the prevalence of anxiety, we have a similar behavior as when we were looking at coefficients. There are 13 states that increased in anxiety and 3 states that decreased following an increase in incidence as shown in Figure 5. An important thing to notice here is that there are fewer states with significant results compared to the coefficients of the first and second lag of this variable. This may indicate that one should consider more aspects (e.g., media coverage in this case) than just the IRF when analyzing the effects of different variables in a VAR or VECM.
Moving on to COVID-19 related death, there were 4 states that returned significant positive responses and 6 states that returned significant negative responses. In this case, there is a clear difference in the geographic distribution of significant impulses compared to the coefficient results, further highlighting the need for in-depth analysis of each aspect of our models. Since there are 5 states that have significant impulses that did not have significant coefficients for either the first or second lag of COVID-19 related death, it is likely that there are more intricate relationships between variables than simply that an increase in one is associated with an increase in another. More likely is that an increase in COVID-19 related death leads to or coincides with changes in other variables that then have a more significant impact on anxiety in a particular state.
The results of the IRFs of COVID-19 related variables on depression are presented in Figure 6. They paint a similar picture to the coefficient results, though there are some exceptions as was the case with the IRFs for anxiety. An increase in COVID-19 incidence was associated with a positive impulse in depression for 8 states and a negative impulse for 2 states. So, we again see that an increase in COVID-19 incidence is associated with an increase in anxiety. An impulse in COVID-19 related death led to a positive impulse in depression for 8 states and a negative impulse for 3 states. There are also several states that have significant coefficients for COVID-19 incidence or COVID-19 related death that did not have significant impulses, thus we again emphasize the need to examine every aspect of a VAR or VECM to obtain a fuller picture of the complicated relationships between variables, especially when analyzing human behavior and emotional responses.
While the results of the IRFs for the association of time spent with others indoors with anxiety show a similar number of significant states compared to the coefficient results (11 vs. 10), there is a notable difference in which states are significant in each case (see Figure 3 and Figure 7). There are 6 states that had a positive impulse following an impulse in time spent with others indoors and 5 states with a negative impulse. The effect of working outside the home indoors had a clearer split in that only 3 states had a positive impulse and 10 states had a negative impulse.
The variable time spent with others indoors likely captures some interactions with individuals that the respondent is not familiar with which may explain why we commonly see positive impulses in anxiety following an impulse in this variable. Again this variable does not provide any insight into whether the time spent with someone a respondent is not currently staying with is positive or negative, so there may be negative social interactions that are not directly linked to a respondent being worried about contracting COVID-19. On the other hand, there are many more states that had significant negative impulses for working outside the home indoors. While this variable also does not capture whether a respondent has a positive or negative work environment, the benefits of consistency and stability of in-person employment may outweigh the negative effects of a poor work environment.
The IRF results for the variables related to social isolation and their association with depression are given in Figure 8. Similar to the effects that social variables had on anxiety, we see a roughly even split in terms of significant impulses for time spent with others indoors with 5 states have positive impulses and 4 states having negative impulses. For working outside the home indoors, there were 4 states with positive impulses and 8 states with negative impulses. Again we see several more negative impulses for working outside of one’s home indoors and this makes sense as it indicates an increase in the number of people working and thus becoming less stressed and depressed.

4. Discussion

The results of the associations of COVID-19 with mental health in the general population have two major highlights. First, we see that COVID-19 incidence played a consistent and significant role in determining the prevalence of anxiety in both time periods (see Figure 1 and Figure 5, and Appendix B for results in the first time period). Second, variables related to COVID-19 and social isolation had a significant and varied association with anxiety and depression in a minority of states during the second time period (see Figure 2, Figure 3, Figure 4, Figure 6, Figure 7 and Figure 8, and Appendix B).
The second time period coincided with the beginning of the vaccine roll-out in the United States when COVID-19 incidence was relatively high, though notably it was after a large spike in active cases that occurred during the previous winter (December 2020 to February 2021) [1]. At this point, Americans had weathered a year of the pandemic and uncertainty about the future was likely high in part due to the poor initial roll-out of vaccines and the large amount of misinformation related to them [28]. As 2021 continued, the rise of the Delta and Omicron variants of SARS-CoV-2 sparked additional concerns in the United States as well as in the rest of the world. By July 2021, cases had been on the decline for several weeks, but then the CDC reported that over half of all new COVID-19 infections were of the Delta variant [29]. With this came additional studies revealing that the Delta variant was likely more severe than previous strains, another wave of panic from the media, and increasing cases [30]. Finally, the year (and the time frame of our analysis) ended with the Omicron variant emerging and cases rising as the United States entered another winter season. The combination of these factors likely contributed to the consistent positive associations observed with an increase in incidence for anxiety for a majority of states.
Looking at both anxiety and depression, we observed positive associations for these variables with coefficients of COVID-19 incidence, though this relationship held in only a minority of states. We also observed consistent positive associations for coefficients of COVID-19 related death with anxiety and depression, though there were fewer significant associations observed for this variable compared to coefficients of COVID-19 incidence. Several past studies have unearthed possible links between COVID-19 infection and development of anxious or depressive symptoms [31,32,33,34,35,36,37,38,39,40]; our study does not address that specific topic, but the positive associations observed between COVID-19 incidence and death with anxiety and depression do support those past studies. These associations may be exacerbated by factors that coincide with increased prevalence of disease such as continuous media coverage and the possibility of increased medical bills and loss of wages due to long-term issues that can arise with COVID-19 infection [41,42].
Coefficients of COVID-19 related death were more commonly positively associated with depression than anxiety (see Figure 1 and Figure 2), emphasizing the need for additional support (both emotional and possibly financial) for individuals close to someone that has died from the disease. These results are in line with previous studies that have provided some insight into possible links between COVID-19 infection and death and development of depressive symptoms and they are important to consider in the context of future pandemics. The observed association between these variables may have been enhanced by external factors like the influence of media [31,41,43]. The results of the IRFs for COVID-19 related variables largely supported the VECM coefficient results for anxiety and depression, though there are some states that had significant coefficients that did not have a significant response to impulses in these variables and vice versa (e.g., Connecticut and Arkansas for anxiety, respectively). Interestingly, COVID-19 related death was often negatively associated with anxiety as seen in Figure 5. We speculate that individuals that have died from COVID-19 would then no longer be contributing to the survey results, possibly leading the the observed decrease in anxiety.
Variables related to social isolation had a varied association with anxiety and depression in a minority of states and were overall less impactful than COVID-19 related variables (see Figure 3, Figure 4, Figure 7 and Figure 8). Time spent with others had the same number of positive and negative coefficient associations for anxiety, though only ten states returned significant coefficient results. This variable had a much more consistent positive association with depression. Working outside one’s home indoors had more positive associations than negative for both anxiety and depression. States that returned significant positive coefficients for this variable and time spent with others may indicate individuals feeling emotion burnout and exhaustion from weathering a year or more of the pandemic as well as fear of being infected. The negative impacts of social isolation are clear [40,41] and effort should be put forth to minimize their impacts in those states that returned significant positive associations as well as others as a preventative measure.
The trend of variable associations with time spent with others held through the IRF result. We observed more negative associations in anxiety and depression with impulses in working outside one’s home indoors. This result however is intuitive as individuals who are unemployed are likely to struggle with finances and other stressors on top of the pandemic that may be relieved from consistent pay and work schedules following an impulse in this variable.
Notably, the IRF results for the variables related to social isolation in the first time period indicated that they were more often associated with increases and decreases in anxiety and depression (i.e., there were more associations overall) compared to the second time period even though the number of states that had significant coefficient results was either similar or greater in the second time period. A surge in COVID-19 cases and deaths occurred during much of the first time period, so this can partially explain our results. The increasing cases and media coverage along with uncertainty surrounding a possible vaccine and the winter holiday season all likely contributed to the varied responses to impulses in time spent with others and working outside one’s home that we observed.

Limitations

Across almost all variables (COVID-19 and Social isolation related variables), there were an equal number or more significant associations observed in the second lags and this pattern indicates a limitation of our work. Time spent with others in the first time period was the only instance where this pattern did not hold. Thus a possible limitation was our model design; we opted to include only two lags of each variable, but it may be that the variables in our model have longer term impacts on anxiety and depression that we did not account for with only two lags.
There are other limitations and strengths of the study presented that should be noted. First, some limitations include that the questions used as proxies for social isolation (i.e., ‘estimated percentage of respondents who spent time indoors with someone who is not currently staying with you in the past 24 h’ and ‘estimated percentage of individuals who worked or went to school indoors and outside their home in the past 24 h’) likely do not accurately reflect the percentage of respondents who felt socially isolated. This is because of the fact that one can have social interaction and still feel socially isolated and also because individuals may be interacting online rather than in-person. Other limitations have to do with the survey data itself, namely the survey data used to fit models for each state was weighted to be representative of each state’s age and gender demographics, but states may differ in other demographics that are not accounted for. Additionally, there is limited data for some regions in states as regions that had less than 100 responses for a particular question were removed from the overall results of a state. Finally, the change in the wording of the questions from the first time period to the second likely changed how respondents interpreted the questions and may have impacted the results.
There are also some strengths of the current study that should be highlighted. First, we have used a robust analytical framework for the analysis of this survey data that allows insight into mechanisms that impacted the prevalence of anxiety and depression in the United States across the studied period. Second, our measures for COVID-19 incidence and death are standard and robust, leaving little room for error in interpretation of results regarding those indicators.

5. Conclusions

The effects of the COVID-19 pandemic are far reaching and not fully understood, especially in terms of the effects that it has had on the mental health of the general population. This study used an approach commonly employed in economics, namely multiple time-series analysis using vector error-correction models, in an attempt to gain insight into the most significant associations surrounding the pandemic during two time periods ranging from 8 September 2020 to 2 March 2021 and 2 March 2021 to 10 January 2022, respectively. We found that indicators related to COVID-19 incidence were commonly positively associated with anxiety in the general population across both studied periods. Sudden increases (impulses) in COVID-19 incidence were positively associated with anxiety and depression in a minority of states. COVID-19 related indicators were also often positively associated with depression, though only in a minority of states.
Time spent with others had a consistent positive association with depression for a minority of states. This indicator along with working outside one’s home had varied impacts in a minority of states for anxiety. Lastly, a sudden increase (impulse) in working outside one’s home was negatively associated with anxiety and depression in a minority of states, indicating that the creation of in-person jobs during a pandemic may alleviate some stessors. This should be conducted with care as to not exacerbate fears of infection. It is our hope that this paper provides some insight and guidance into how each state and business should tailor policies to their respective populations to minimize the effects of the variables included in this study on the mental health of those populations.
We also decided to analyze this survey data using a different method (network analysis) and with different (albeit related) research goals. The results of that study and a comparison with this one are available via a preprint posted to medRxiv [44].

Author Contributions

A.F.: Conceptualization, formal analysis, writing—original draft preparation, reviewing and editing; R.S.-E.: Conceptualization, writing—review, H.K.: Conceptualization, writing—review, and editing; I.M.: Formal analysis, writing—review, F.A.: Conceptualization, project administration, supervision, writing—reviewing and editing, funding acquisition. All authors have read and agreed to the published version of the manuscript.

Funding

This research is supported by National Science Foundation under the grant number DMS 2028297.

Institutional Review Board Statement

Not applicable.

Informed Consent Statement

Not applicable.

Data Availability Statement

Data used are available at the link https://doi.org/10.1073/pnas.2111452118. All code, data, and results are available at the GitHub link: https://github.com/alxjfulk/social_isolation_and_COVID19 (accessed on 2 July 2022).

Conflicts of Interest

The authors declare that there are no conflict of interest.

Appendix A. VECM Equation Example

a n x i e t y t = C 0 1 a n x i e t y t 1 + C 1 1 a n x i e t y t 2 + C 2 1 d e p r e s s i o n t 1 + C 3 1 d e p r e s s i o n t 2 + C 4 1 s p e n t T i m e t 1 + C 5 1 s p e n t T i m e t 2 + C 6 1 w o r k O u t s i d e H o m e t 1 + C 7 1 w o r k O u t s i d e H o m e t 2 + C 8 1 i n c i d e n c e P r o p t 1 + C 9 1 i n c i d e n c e P r o p t 2 + C 10 1 d e a t h P r o p t 1 + C 11 1 d e a t h P r o p t 2 + D 1 , d e p r e s s i o n t = C 0 2 a n x i e t y t 1 + C 1 2 a n x i e t y t 2 + C 2 2 d e p r e s s i o n t 1 + C 3 2 d e p r e s s i o n t 2 + C 4 2 s p e n t T i m e t 1 + C 5 2 s p e n t T i m e t 2 + C 6 2 w o r k O u t s i d e H o m e t 1 + C 7 2 w o r k O u t s i d e H o m e t 2 + C 8 2 i n c i d e n c e P r o p t 1 + C 9 2 i n c i d e n c e P r o p t 2 + C 10 2 d e a t h P r o p t 1 + C 11 2 d e a t h P r o p t 2 + D 2 , s p e n t T i m e t = C 0 3 a n x i e t y t 1 + C 1 3 a n x i e t y t 2 + C 2 3 d e p r e s s i o n t 1 + C 3 3 d e p r e s s i o n t 2 + C 4 3 s p e n t T i m e t 1 + C 5 3 s p e n t T i m e t 2 + C 6 3 w o r k O u t s i d e H o m e t 1 + C 7 3 w o r k O u t s i d e H o m e t 2 + C 8 3 i n c i d e n c e P r o p t 1 + C 9 3 i n c i d e n c e P r o p t 2 + C 10 3 d e a t h P r o p t 1 + C 11 3 d e a t h P r o p t 2 + D 3 ,
The equations for the other variables of each VECM follow a similar format. Table A1 provides a brief description of each variable listed in the equations above.
Table A1. Description of the variables for model described above.
VariableMeaning
a n x i e t y Estimated percentage of respondents who reported feeling nervous,
anxious, or on edge for most or all of the past 5 days.
d e p r e s s i o n Estimated percentage of respondents who reported feeling depressed
for most or all of the past 5 days.
s p e n t T i m e Estimated percentage of respondents who spent time with someone
who is not currently staying with you in the past 24 h.
w o r k O u t s i d e H o m e Estimated percentage of respondents who worked or went to school outside
their home in the past 24 h.
i n c i d e n c e P r o p Number of new confirmed COVID-19 cases per 100,000 population per day.
d e a t h P r o p number of new confirmed COVID-19 deaths per 100,000 population per day.
C j i j-th coefficient of the i-th equation.
D i constant associated with the i-th equation.

Appendix B. Results of the First Time Period

Appendix B.1. Effects of COVID-19 in the First Time Period

Twenty-three states had positive coefficients for COVID-19 incidence, indicating that an increase in incidence was associated with an increase in anxiety during the first time period. In contrast, almost all states that returned significant coefficients for COVID-19 related death had negative values and this variable had a smaller impact overall; One state returned a positive coefficient and 8 states returned negative coefficients for this variable. Lastly, in both variables, we see more significant results in the second lag, which alludes to possible longer-term impacts of COVID-19 on anxiety.
Figure A1. Association of COVID-19 with Anxiety. States that had significantly positive or negative coefficients in their equation for anxiety for the first or second lag of variables related to COVID-19 in the first time period. The color depicts whether a state had a positive (blue), negative (purple), or no significant coefficient for the corresponding variable. COVID-19 Incidence lag 1: (positive) Alaska, Idaho, Illinios, Iowa, North Dakota, Washington, (negative) NA. Lag 2: (positive) Arizona, Arkansas, Colorado, Florida, Georgia, Illinois, Louisiana, Michigan, Minnesota, Mississippi, Missouri, Montana, Nebraska, New Jersey, New Mexico, North Dakota, Ohio, South Dakota, Utah, (negative) NA. COVID-19 Death lag 1: (positive) West Virginia, (negative) Nebraska, North Dakota, Wyoming. Lag 2: (positive) NA, (negative) Nebraska, New Hampshire, New Jersey, New Mexico, Texas, Utah.
Covid 03 00060 g0a1
Only a handful of states returned significant coefficients when analyzing the impact that COVID-19 may have had on depression in the first time period. When looking at COVID-19 incidence, we see that 4 states returned a positive coefficient for this variable and 1 state returned a negative coefficient for this variable. COVID-19 related death only had one state return a significant positive result. Due to the lack of significant coefficients for these variables, it is difficult to make inferences, but there are several reasons why this may have occurred. First, it may be that we do not have enough data points to capture possible relationships among depression and our COVID-19 related variables. Second, the structure of our model may be ill-suited to capturing possible relationships between these variables. We chose to only include two lags of each variable, but it may be that we need to include more lags to assess the impacts that occur over a longer period of time. This is somewhat supported in our results since the second lag of each variable usually contains more significant coefficients. Finally, it may be that there was little impact of COVID-19 on depression in this time period. We again see that the second lags of each contain the most significant results, further supporting the idea that the impacts of these variables on anxiety and depression take time to reveal themselves at the level of the general population.
Figure A2. Association of COVID-19 with Depression. States that had significantly positive or negative coefficients in their equation for depression for the first or second lag of variables related to COVID-19 in the first time period. The color depicts whether a state had a positive (blue), negative (purple), or no significant coefficient for the corresponding variable. COVID-19 Incidence lag 2: (positive) Pennsylvania, Mississippi, New Mexico, Nevada, (negative) Oregon. COVID-19 death lag 2: (positive) Maryland, (negative) NA.
Covid 03 00060 g0a2

Appendix B.2. Effects of Social Isolation in the First Time Period

There were five states that returned significant positive coefficients for the variable based on the estimated percentage of individuals that spent time with someone who they are not currently staying with in the past 24 h and five states that returned significant negative coefficients for this variable. Our second social variable estimated the percentage of individuals that worked or went to school outside their home in the past 24 h and gave significant positive results for seven states and significant negative results for two states. The initial results for the effect that our two social variables may have on anxiety indicate a varied, albeit limited response across the country.
Figure A3. Association of Social Isolation with Anxiety. States that had significantly positive or negative coefficients in their equation for anxiety for the first or second lag of variables related to Social Isolation in the first time period. The color depicts whether a state had a positive (blue), negative (purple), or no significant coefficient for the corresponding variable. TimeSpent lag 1: (positive) Kentucky, Minnesota, (negative) Pennsylvania, New York, South Carolina, Tennessee, Texas. Lag 2: (positive) Arizona, Georgia, Maryland, (negative) New York. Work lag 1: (positive) Delaware, Maryland, New Hampshire, Vermont, Wisconsin. Lag 2: (positive) Arkansas, Georgia, (negative) New Mexico, North Dakota.
Covid 03 00060 g0a3
Our chosen social variables seem to have more of an impact and a more consistent impact in equations for depression compared to anxiety in the first time period. 12 states returned significant positive coefficients for the variable related to time spent with others and two states returning significant negative coefficients for this variable. Our second social variable related to individuals working outside their home yielded significant positive results for two states and significant negative results for six states. Note that one state had a significant positive coefficient in the first lag of this variable and a significant negative coefficient for the second lag. Overall, an increase in our first social variable was associated with an increase in anxiety in several states. In addition more states returned significant results in the second lag of this variable indicating that the impact of interacting with individuals may take days to present itself. Our second social variable had less of an impact and generally led to individuals becoming less depressed as more people started working outside their homes. In addition, this variable seems to have a more immediate impact on depression as we see several more significant results in the first lag.
Figure A4. Association of Social Isolation with Depression. States that had significantly positive or negative coefficients in their equation for depression for the first or second lag of variables related to Social Isolation in the first time period. The color depicts whether a state had a positive (blue), negative (purple), or no significant coefficient for the corresponding variable. TimeSpent lag 1: (positive) North Carolina, Oklahoma, (negative) New York, South Carolina. Lag 2: (positive) Alaska, Colorado, Iowa, Kentucky, Louisiana, Maryland, Nevada, Oklahoma, Oregon, Virginia, Wisconsin. Work lag 1: (positive) Oregon, (negative) California, Maine, Michigan, Oklahoma, Utah. Lag 2: (positive) Pennsylvania, (negative) Oregon.
Covid 03 00060 g0a4

Appendix B.3. Impulse Response Function Results

Appendix B.3.1. Effects of COVID-19 in the First Time Period

Moving on to impulse response functions (IRFs), there were ten states that had significant positive responses in anxiety to an impulse in COVID-19 incidence. For COVID-19 related death, three states had significant positive responses and four states had significant negative responses. This may indicate that individuals are more anxious about becoming infected than dying to COVID-19.
Two states had significant positive responses and 3 states had significant negative responses in depression to an impulse in COVID-19 incidence. Four states had significant positive responses and two states had significant negative responses in depression to an impulse in COVID-19 related death. This may indicate that either there is not a strong enough effect of these two variables on depression in the general population, or we have not effectively captured the signal with the current model.
Figure A5. Association of COVID-19 with Anxiety. States that had significantly positive or negative responses for variables related to COVID-19 in the first time period. The color depicts whether a state had a positive (blue), negative (purple), or no significant coefficient for the corresponding variable. COVID-19 Incidence: (positive) Alaska, Arizona, Georgia, Idaho, Illinois, Iowa, Minnesota, New Jersey, New Mexico, Rhode Island, (negative) NA. COVID-19 death: (positive) Arkansas, Indiana, West Virginia, (negative) Missouri, Nebraska, New Jersey, New Mexico.
Covid 03 00060 g0a5
Figure A6. Association of COVID-19 with Depression. States that had significantly positive or negative responses for variables related to COVID-19 in the first time period. The color depicts whether a state had a positive (blue), negative (purple), or no significant coefficient for the corresponding variable. COVID-19 Incidence: (positive) North Dakota, Rhode Island, (negative) Kansas, Kentucky, Vermont. COVID-19 death: (positive) Oregon, South Carolina, Vermont, West Virginia, (negative) Nebraska, Wyoming.
Covid 03 00060 g0a6

Appendix B.3.2. Effects of Social Isolation in the First Time Period

There were 4 states with significant positive responses and 9 states with significant negative responses in anxiety to an impulse in the time spent variable. An impulse in working outside your home led to 9 states with positive responses and 2 states with negative responses in anxiety. Overall, we saw that more time spent with others may have led to a decrease in anxiety while working outside your home may have led to an increase during this time period.
Figure A7. Association of Social Isolation with Anxiety. States that had significantly positive or negative responses for variables related to Social Isolation in the first time period. The color depicts whether a state had a positive (blue), negative (purple), or no significant coefficient for the corresponding variable. TimeSpent: (positive) Arizona, Georgia, Maine, Minnesota, (negative) Arkansas, Delaware, Michigan, New York, Oregon, Pennsylvania, South Carolina, Tennessee, Texas. Work: (positive) Arizona, Arkansas, Delaware, Maryland, Nebraska, New Hampshire, Ohio, Pennsylvania, South Carolina, Vermont, Wisconsin, (negative) New York, North Dakota.
Covid 03 00060 g0a7
Figure A8. Association of Social Isolation with Depression. States that had significantly positive or negative responses for variables related to Social Isolation in the first time period. The color depicts whether a state had a positive (blue), negative (purple), or no significant coefficient for the corresponding variable. TimeSpent: (positive) Alaska, Arizona, Colorado, Kansas, Kentucky, Louisiana, Maine, Mississippi, Nebraska, New Hampshire, North Carolina, Oklahoma, Rhode Island, Virginia, (negative) Michigan, Missouri, Montana, New Jersey, New York, South Carolina, South Dakota, West Virginia. Work: (positive) Alaska, Arkansas, Hawaii, Idaho, New Jersey, Oregon, Rhode Island, South Carolina, Texas, (negative) California, Indiana, Kansas, Kentucky, Louisiana, Maine, Mississippi, Nebraska, New Hampshire, New Mexico, New York, North Dakota, Oklahoma, Utah, Washington, Wyoming.
Covid 03 00060 g0a8
There are more significant results with these social variables compared to the variables related to COVID-19 for depression. Fourteen states yielded significant positive responses and 8 states yielded significant negative responses for depression with an impulse in the time spent variable. Nine states yielded significant positive responses and 16 states yielded significant negative responses for depression with an impulse in working outside the home. We see an opposite trend to what was observed with anxiety as there tends to be an increase in depression with an increase in the time spent variable. There is not as clear of a relationship between depression and working outside the home, however it tends to be associated with a decrease in depression.

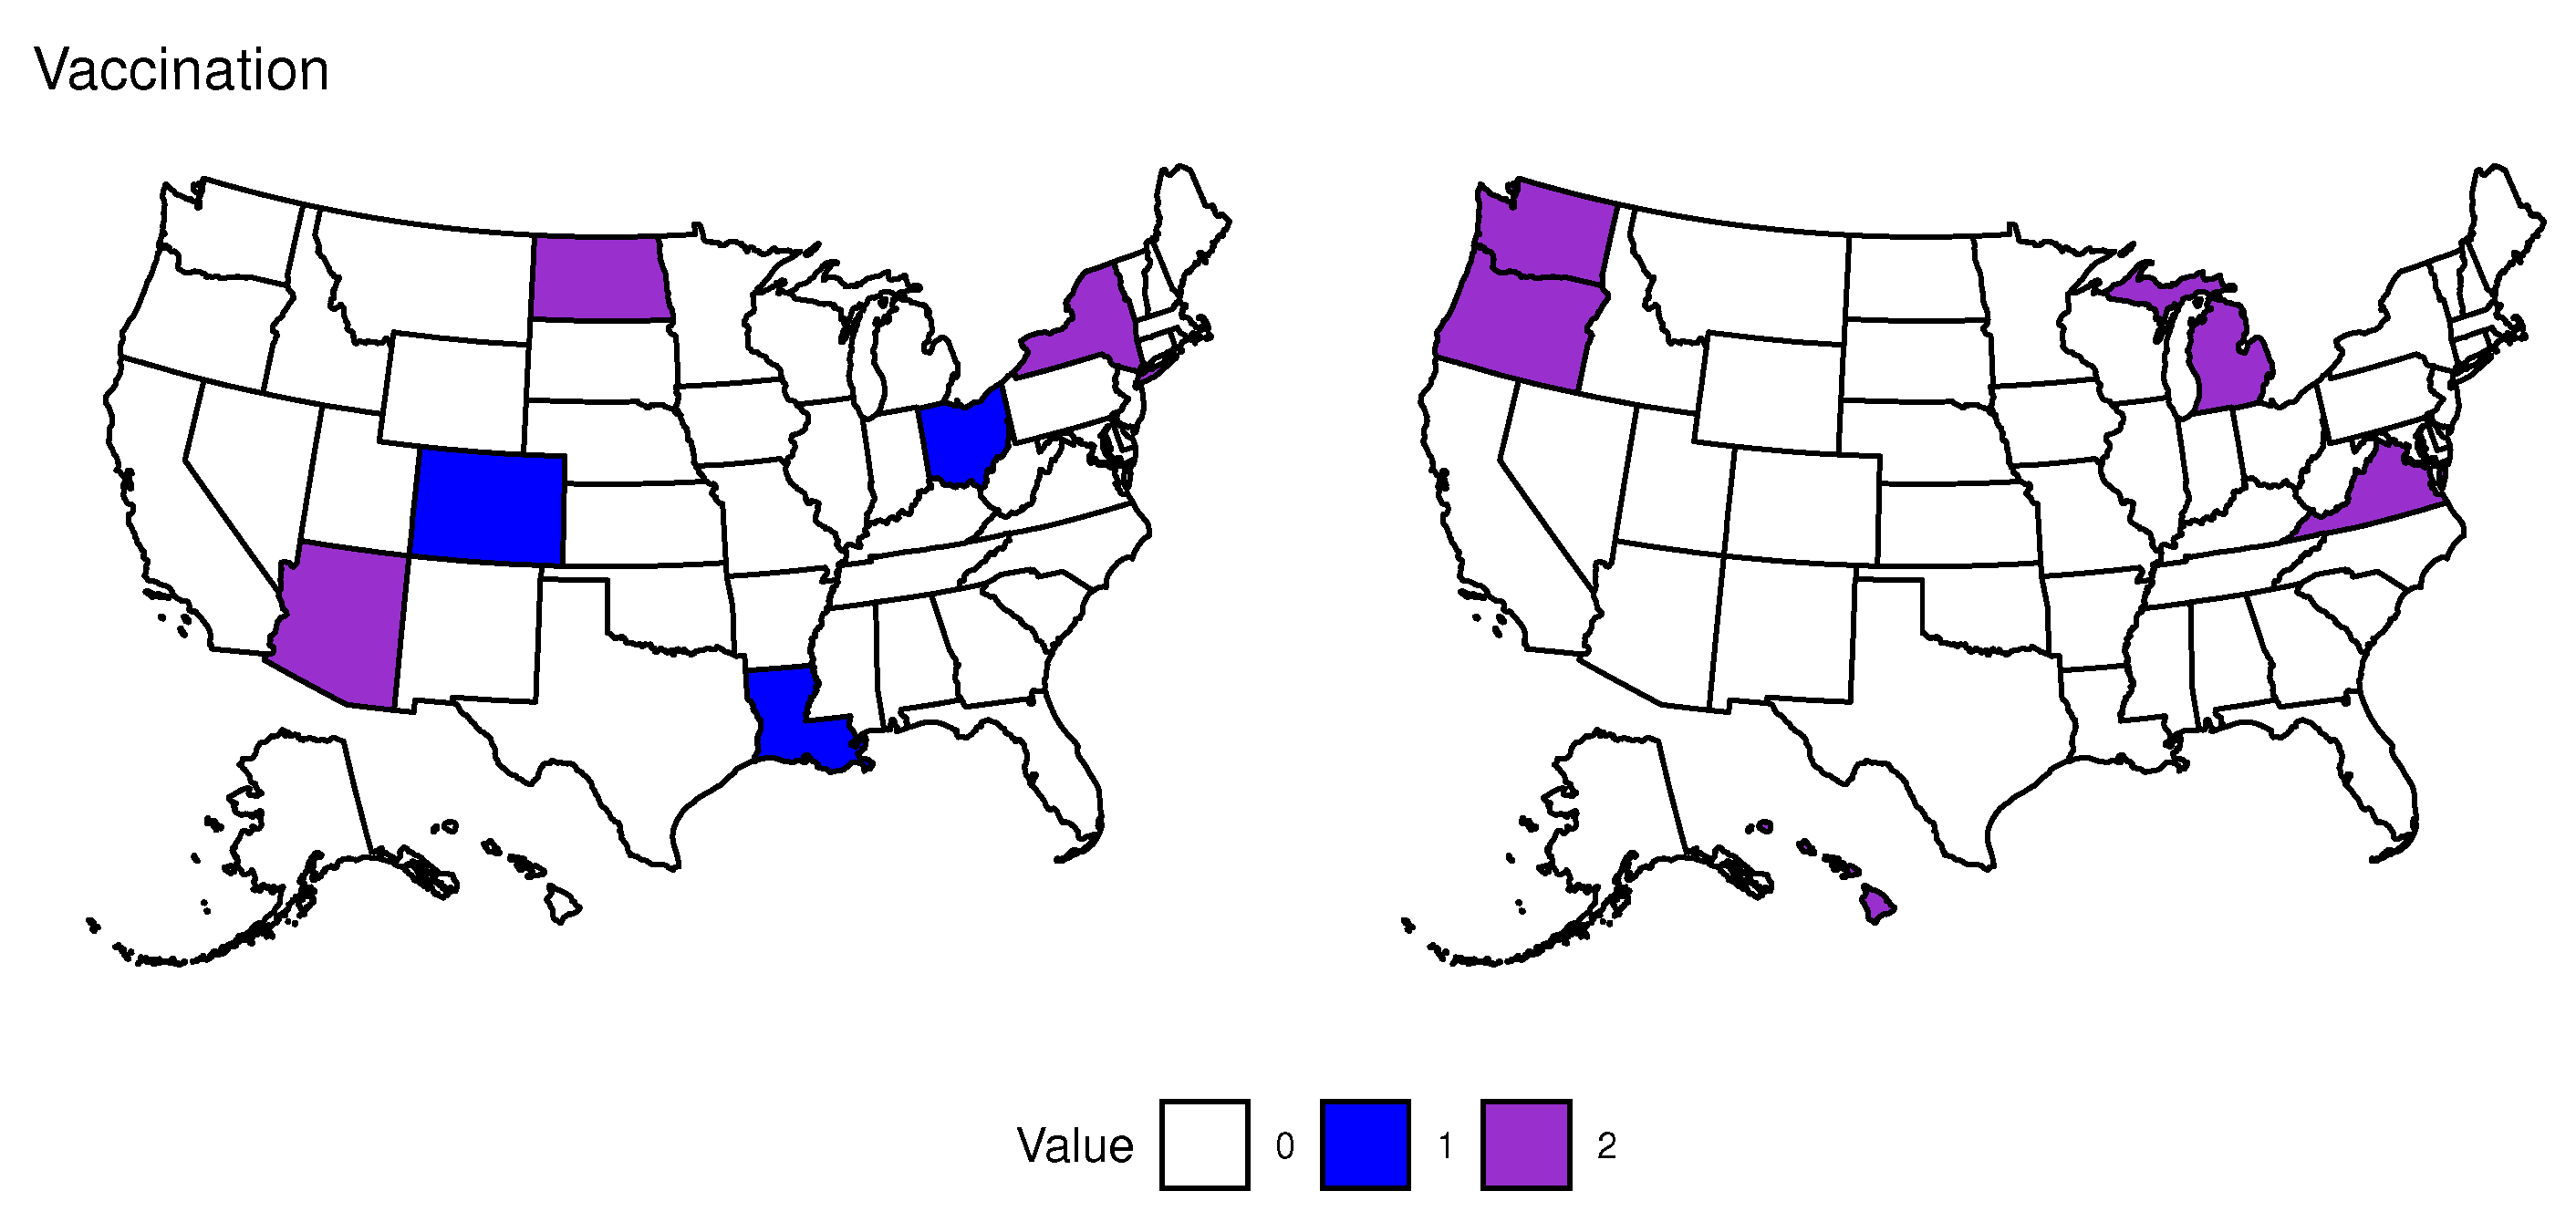
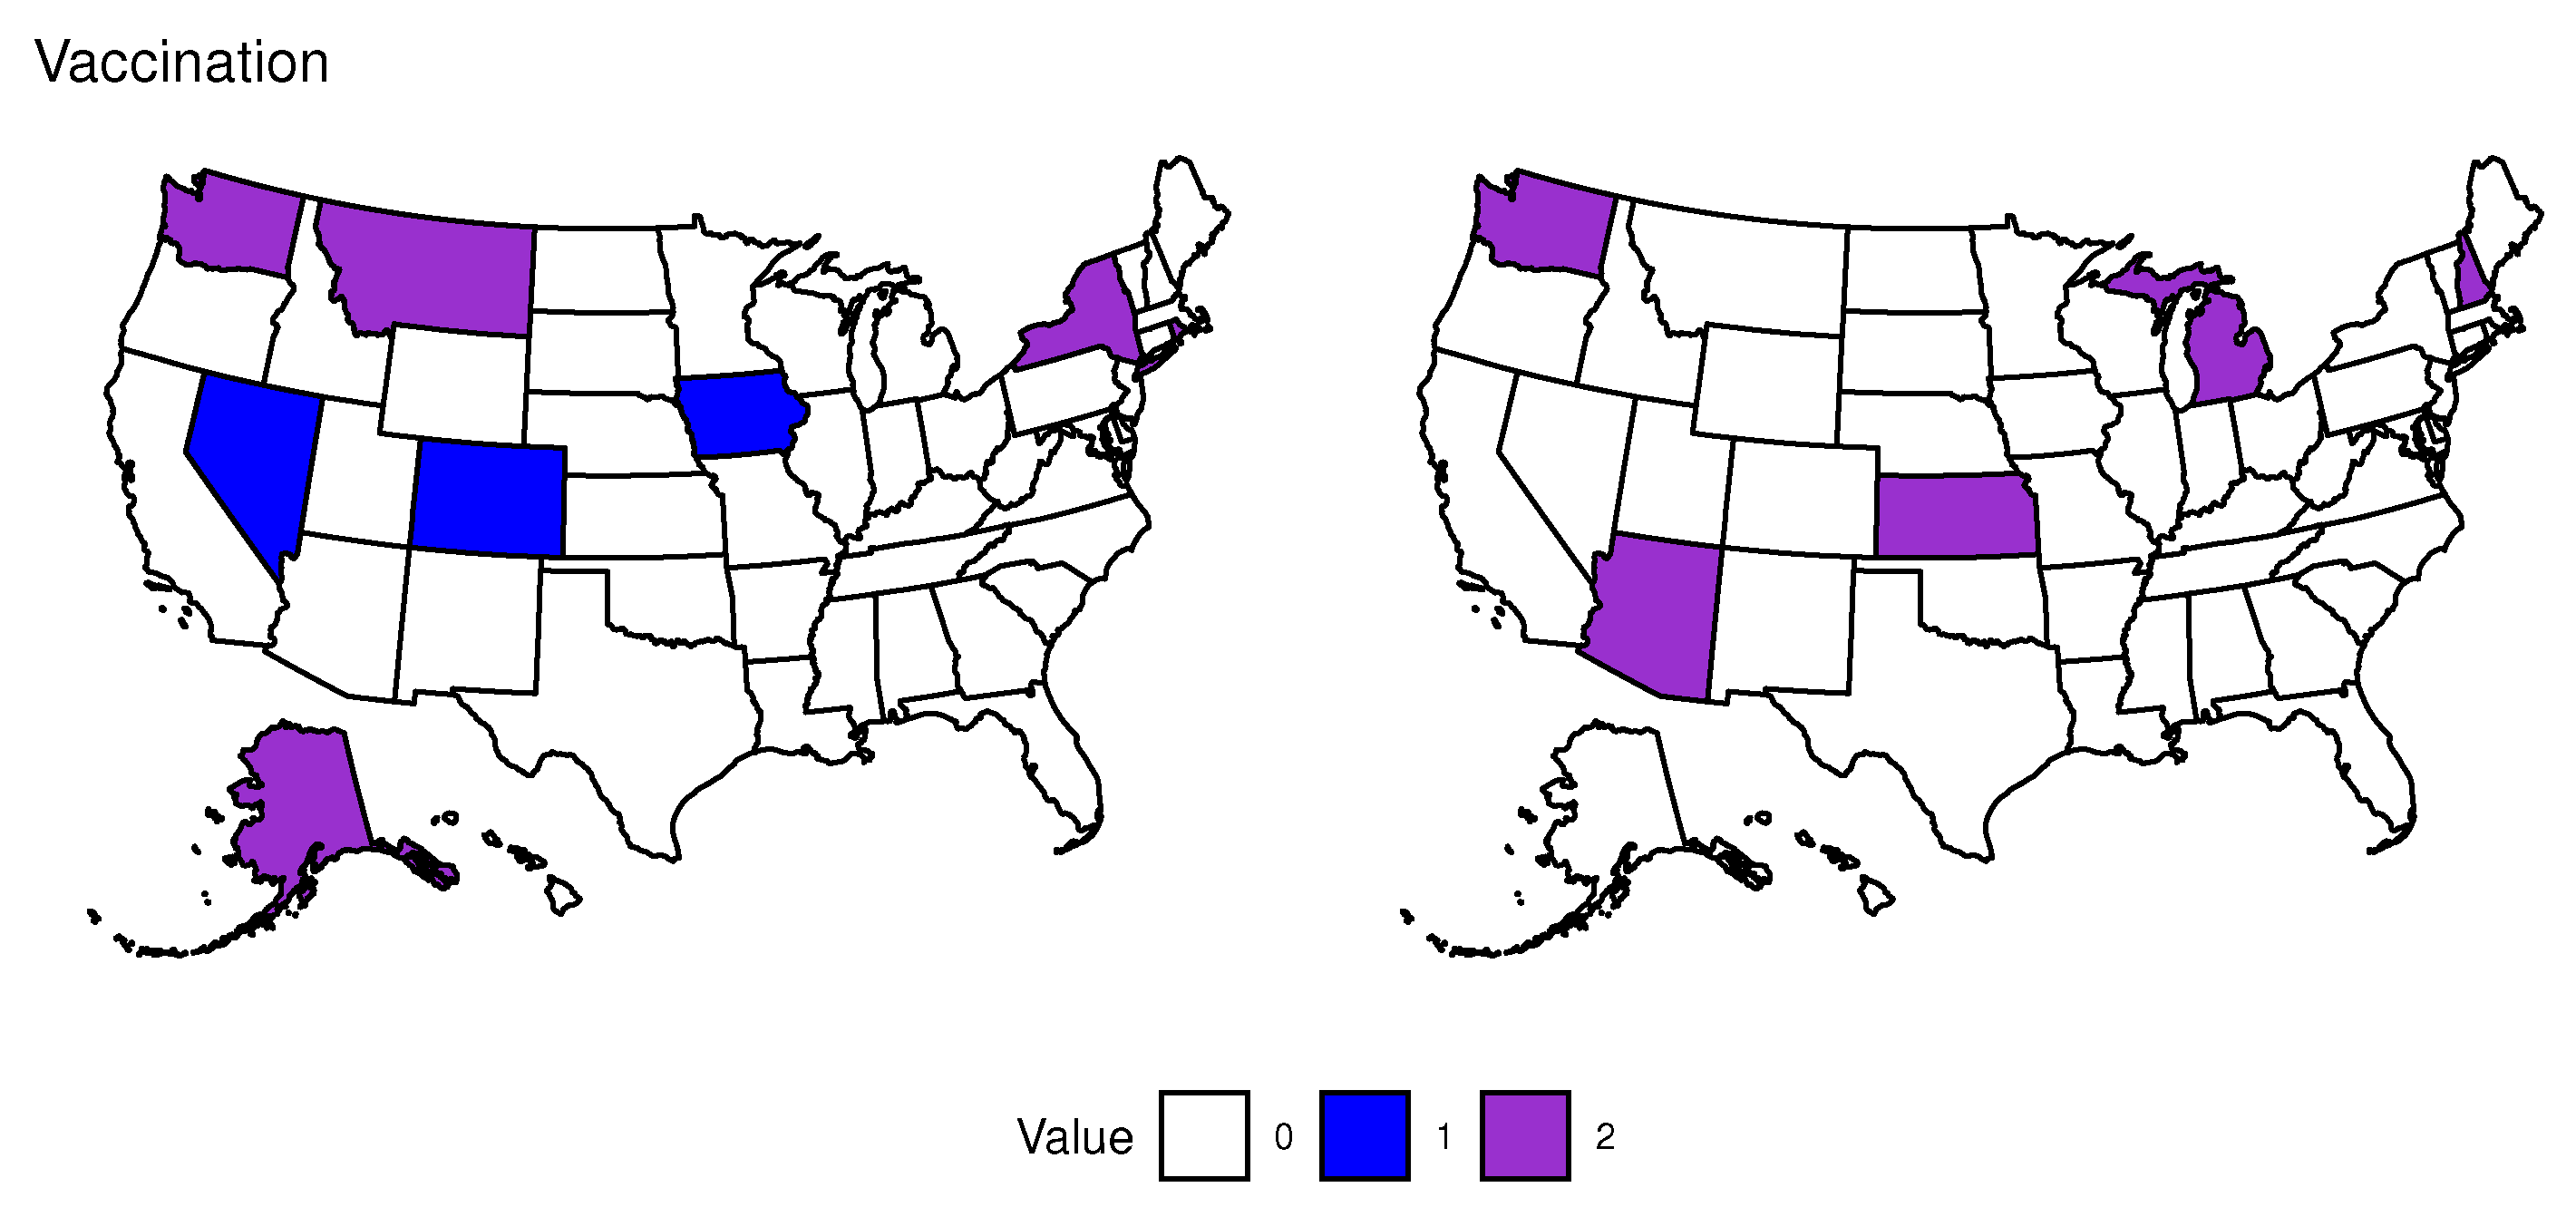
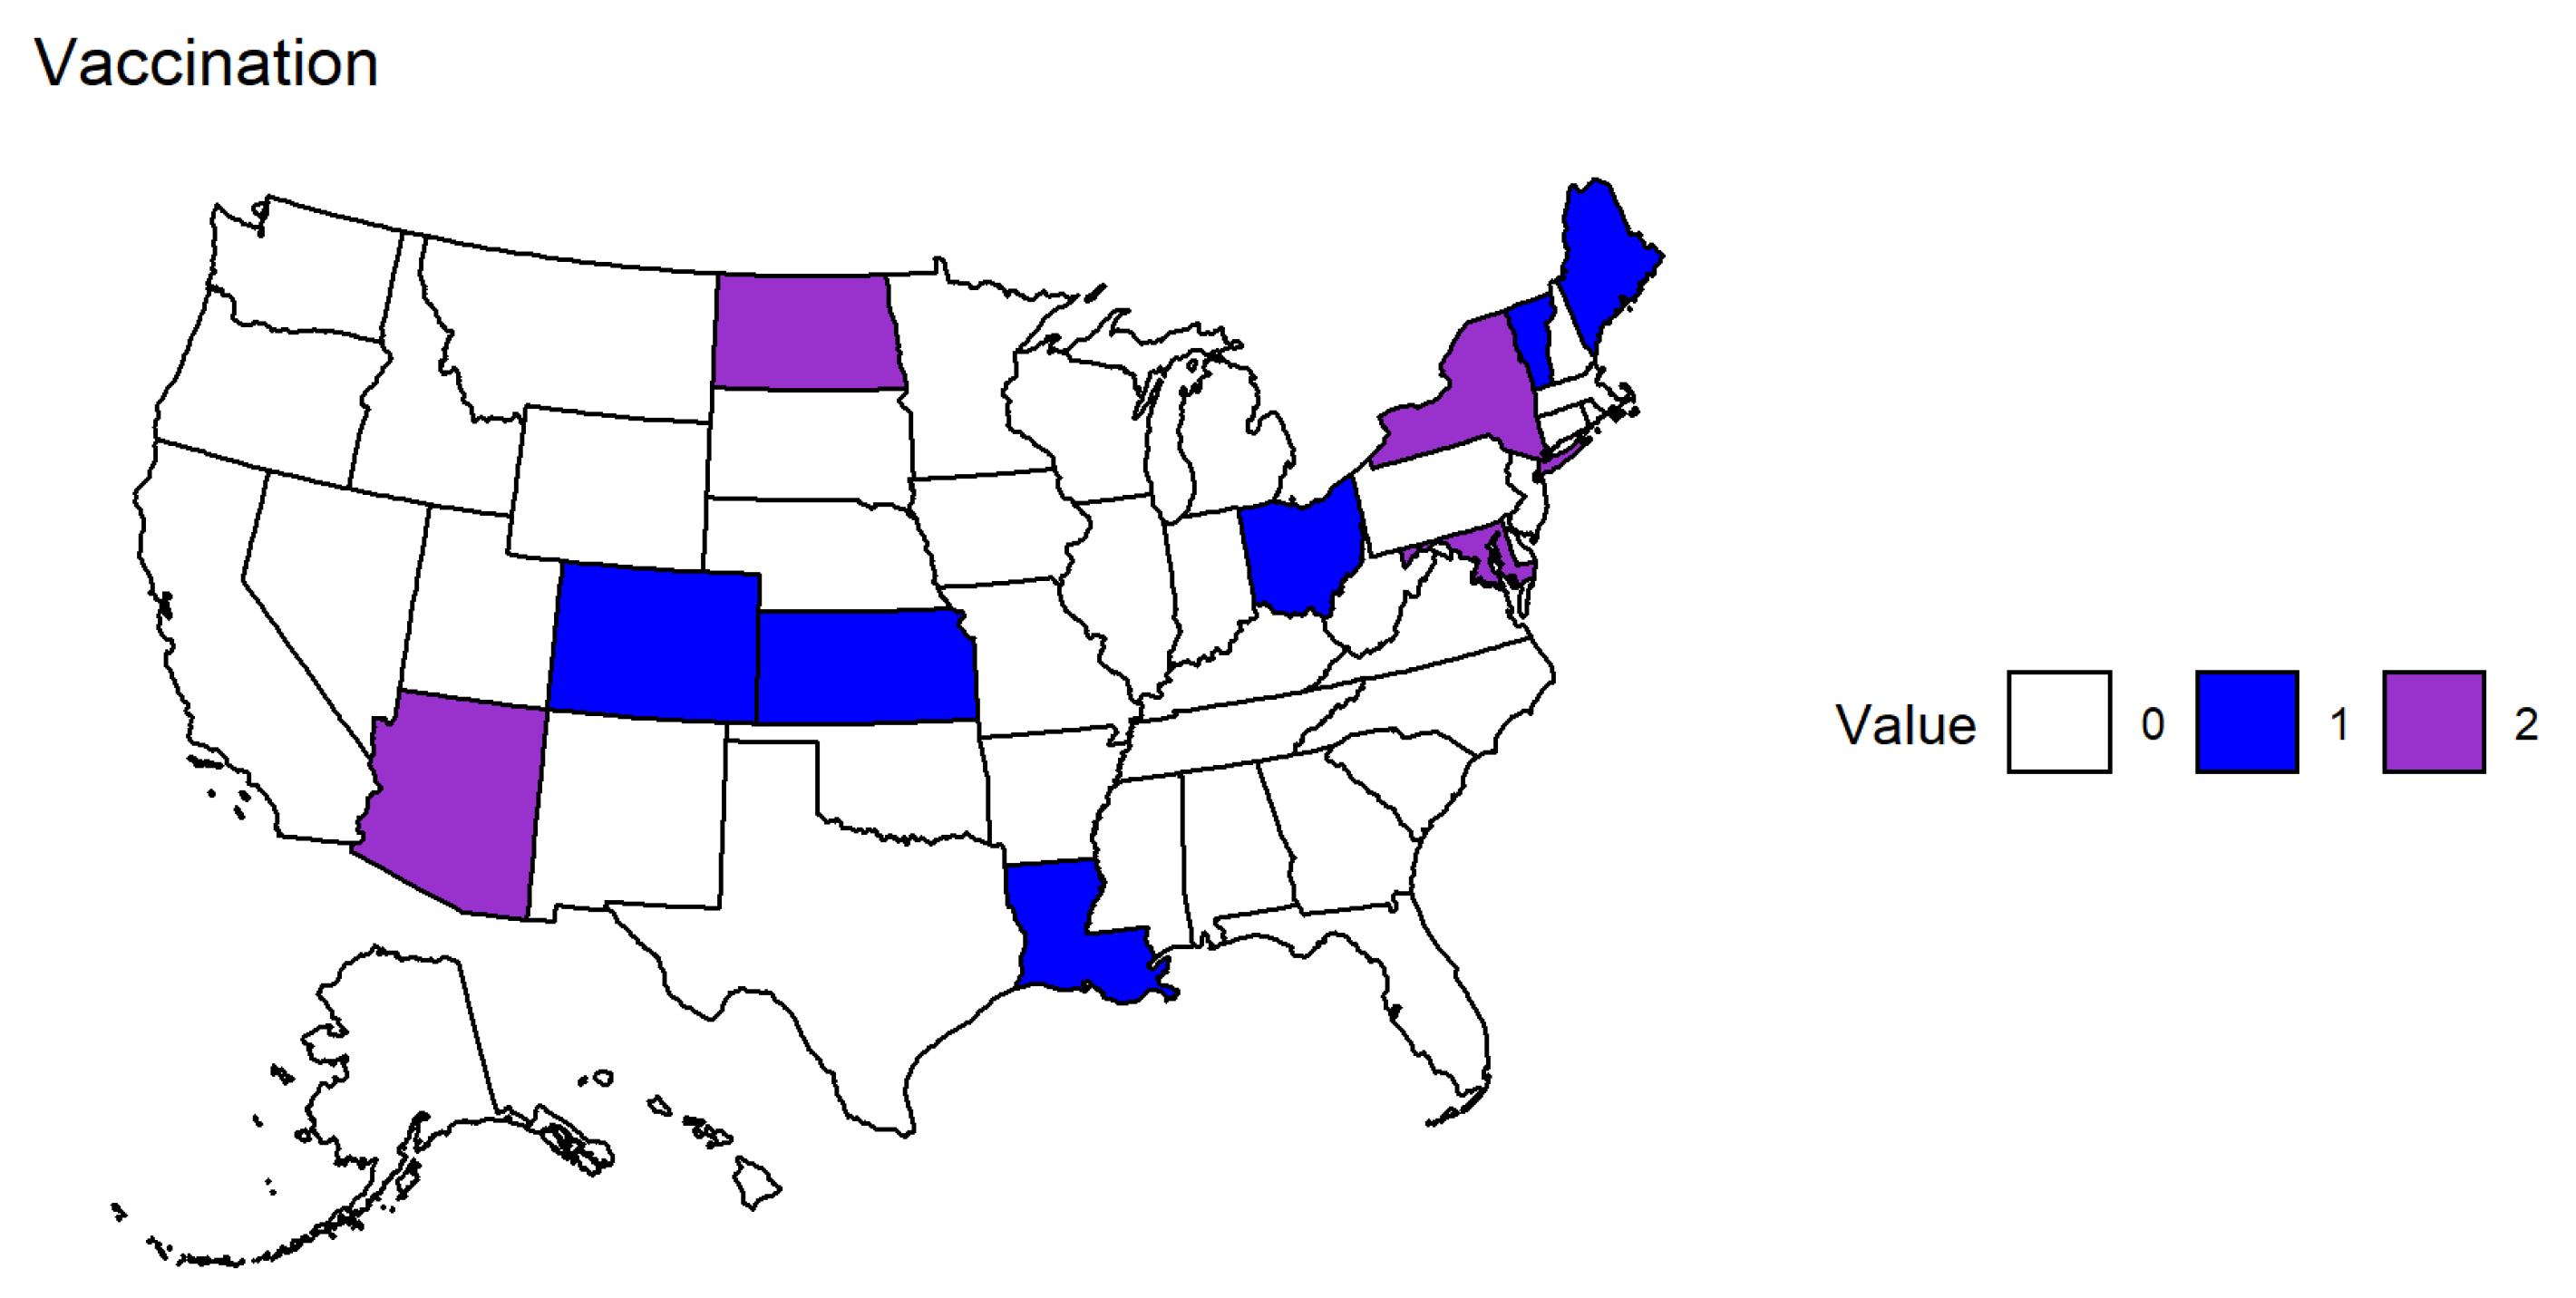
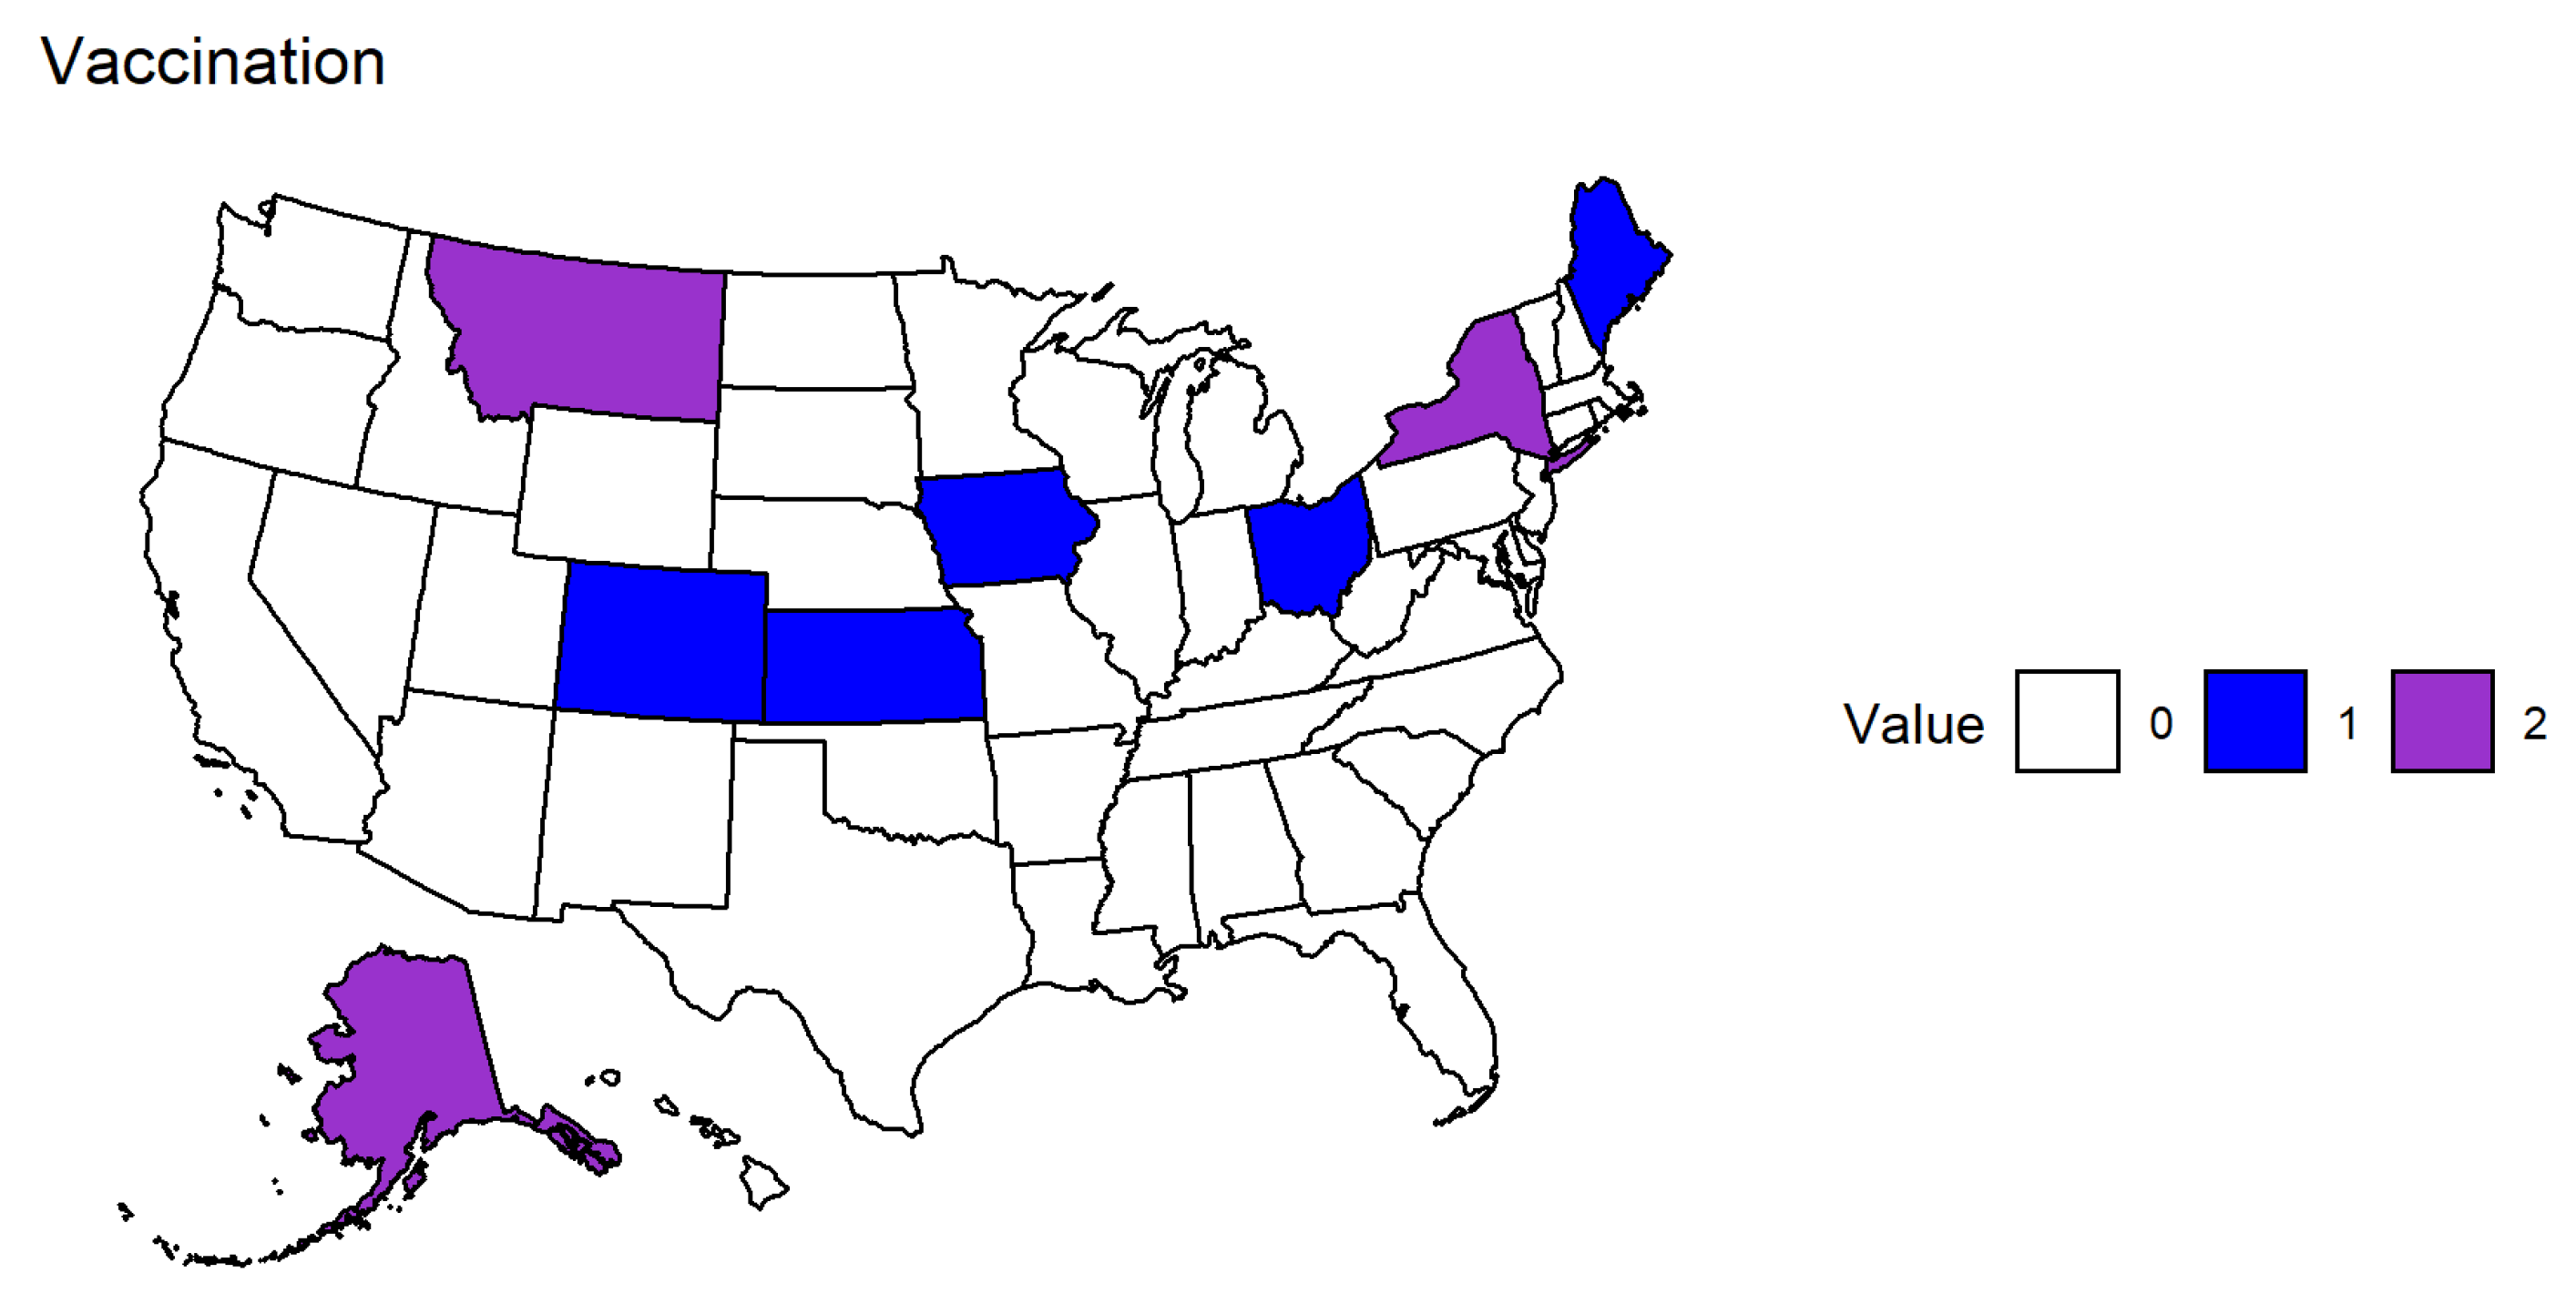
Appendix C. Effects of Vaccination in the Second Time Period

A total of three states returned significant positive coefficients for the first lag of vaccination indicating that increased levels of vaccination may have been associated with increased anxiety in those states during this period. A total of three states returned significant negative coefficients for the first lag of vaccination indicating that as vaccination increased, anxiety tended to decrease. No states returned significant positive coefficients for the second lag of vaccination. A total of five states returned significant negative coefficients for the second lag of vaccination in their respective equations for anxiety.
Figure A9. Association of Vaccination with Anxiety. States that had significantly positive or negative coefficients in their equation for anxiety for the first or second lag of the variable for vaccination in the second time period. The color depicts whether a state had a positive (blue), negative (purple), or no significant coefficient for the corresponding variable. Vaccination Lag 1: (positive) Colorado, Louisiana, Ohio (negative) Arizona, New York, North Dakota. Vaccination Lag 2: (positive) NA, (negative) Hawaii, Michigan, Oregon, Virginia, Washington.
Covid 03 00060 g0a9
Figure A10. Association of Vaccination with Depression. States that had significantly positive or negative coefficients in their equation for depression for the first or second lag of the variable for vaccination in the second time period. The color depicts whether a state had a positive (blue), negative (purple), or no significant coefficient for the corresponding variable. Vaccination Lag 1: (positive) Colorado, Iowa, Nevada (negative) Alaska, Montana, New York, Rhode Island, Washington. Vaccination Lag 2: (positive) NA, (negative) Arizona, Kansas, Michigan, New Hampshire, Washington.
Covid 03 00060 g0a10
Results show that three states returned significant positive coefficients for vaccination in their respective equations for depression, while five states returned significant negative coefficients for this variable. No states returned significant positive coefficients for vaccination, similar to the case with anxiety. On the other hand, five states returned significant negative coefficients for vaccination in their equations for depression.
An impulse in vaccination had a varied effect across the country with six states having significant positive responses and four states with significant negative responses in anxiety.
Nine states had positive responses and 8 states had negative responses for depression to an impulse in vaccination.
Figure A11. Association of Vaccination with Anxiety. States that had significantly positive or negative responses for variables related to vaccination in the second time period. The color depicts whether a state had a positive (blue), negative (purple), or no significant coefficient for the corresponding variable. Vaccination: (positive) Colorado, Kansas, Louisiana, Maine, Ohio, Vermont, (negative) Arizona, Maryland, New York, North Dakota.
Covid 03 00060 g0a11
Figure A12. Association of Vaccination with Depression. States that had significantly positive or negative responses for variables related to vaccination in the second time period. The color depicts whether a state had a positive (blue), negative (purple), or no significant coefficient for the corresponding variable. Vaccination: (positive) Alabama, Colorado, Kansas, Louisiana, Maine, Massachusetts, Ohio, Vermont, Wyoming, (negative) Alaska, Arizona, Arkansas, Idaho, Indiana, Maryland, New York, North Dakota.
Covid 03 00060 g0a12

References

  1. World Health Organization (WHO). COVID-19 Dashboard; World Health Organization: Geneva, Switzerland, 2020; Available online: https://covid19.who.int/ (accessed on 6 March 2022).
  2. Centers for Disease Control and Prevention (CDC). COVID-19 Overview and Infection Prevention and Control Priorities in Non-U.S. Healthcare Settings. Available online: https://www.cdc.gov/coronavirus/2019-ncov/hcp/non-us-settings/overview/index.html# (accessed on 6 March 2022).
  3. World Health Organization (WHO). Coronavirus Disease (COVID-19): How Is It Transmitted? World Health Organization: Geneva, Switzerland, 2020; Available online: https://www.who.int/news-room/questions-and-answers/item/coronavirus-disease-covid-19-how-is-it-transmitted (accessed on 22 March 2022).
  4. Sauver, J.L.S.; Lopes, G.S.; Rocca, W.A.; Prasad, K.; Majerus, M.R.; Limper, A.H.; Jacobson, D.J.; Fan, C.; Jacobson, R.M.; Rutten, L.J.; et al. Factors Associated With Severe COVID-19 Infection Among Persons of Different Ages Living in a Defined Midwestern US Population. Mayo Clin. Proc. 2021, 96, 2528–2539. [Google Scholar] [CrossRef] [PubMed]
  5. Nouvellet, P.; Bhatia, S.; Cori, A.; Ainslie, K.E.; Baguelin, M.; Bhatt, S.; Boonyasiri, A.; Brazeau, N.F.; Cattarino, L.; Cooper, L.V.; et al. Reduction in mobility and COVID-19 Transmission. Nat. Commun. 2021, 12, 1090. [Google Scholar] [CrossRef] [PubMed]
  6. Fasano, M.V.; Padula, M.; Azrak, M.; Avico, A.J.; Sala, M.; Andreoli, M.F. Consequences of Lockdown During COVID-19 Pandemic in Lifestyle and Emotional State of Children in Argentina. Front. Pediatr. 2021, 9, 660033. [Google Scholar] [CrossRef] [PubMed]
  7. Richter, D.; Riedel-Heller, S.; Zürcher, S. Mental health problems in the general population during and after the first lockdown phase due to the SARS-CoV-2 pandemic: Rapid review of multi-wave studies. Epidemiol. Psychiatr. Sci. 2021, 30, e27. [Google Scholar] [CrossRef]
  8. Nie, X.; Feng, K.; Wang, S.; Li, Y. Factors Influencing Public Panic During the COVID-19 Pandemic. Front. Psychol. 2021, 12, e576301. [Google Scholar] [CrossRef]
  9. Novotný, J.S.; Gonzalez-Rivas, J.P.; Kunzová, Š.; Skladaná, M.; Pospíšilová, A.; Polcrová, A.; Medina-Inojosa, J.R.; Lopez-Jimenez, F.; Geda, Y.E.; Stokin, G.B. Risk Factors Underlying COVID-19 Lockdown-Induced Mental Distress. Front. Psychiatry 2020, 11, e603014. [Google Scholar] [CrossRef]
  10. Trivedi, M.M.; Das, A. Did the Timing of State Mandated Lockdown Affect the Spread of COVID-19 Infection? A County-level Ecological Study in the United States. J. Prev. Med. Public Health 2021, 54, 238–244. [Google Scholar] [CrossRef]
  11. Adeel, A.B.; Catalano, M.; Catalano, O.; Gibson, G.; Muftuoglu, E.; Riggs, T.; Sezgin, M.H.; Shvetsova, O.; Tahir, N.; VanDusky-Allen, J.; et al. COVID-19 Policy Response and the Rise of the Sub-National Governments. Can. Public Policy 2020, 46, 565–584. [Google Scholar] [CrossRef]
  12. Hennigan, W.J.; Park, A.; Ducharme, J. The U.S. Fumble Its Early Vaccine Rollout. Will the Biden Administration Put America Back on Track? Time 2021. Available online: https://time.com/5932028/vaccine-rollout-joe-biden/ (accessed on 10 April 2022).
  13. Wilson, C. The U.S. COVID-19 Vaccine Rollout Is Getting Faster. But Is It Fast Enough? Time 2021. Available online: https://time.com/5938128/covid-19-vaccine-rollout-biden/ (accessed on 10 April 2022).
  14. Staff, M.C. Herd Immunity and COVID-19: What You Need to Know. Mayo Clin. 2021. Available online: https://www.mayoclinic.org/diseases-conditions/coronavirus/in-depth/herd-immunity-and-coronavirus/art-20486808 (accessed on 10 April 2022).
  15. Czeisler, M.É.; Lane, R.I.; Petrosky, E.; Wiley, J.F.; Christensen, A.; Njai, R.; Weaver, M.D.; Robbins, R.; Facer-Childs, E.R.; Barger, L.K.; et al. Mental Health, Substance Use, and Suicidal Ideation During the COVID-19 Pandemic—United States, 24–30 June 2020. MMWR Mor. Mortal. Wkly. Rep. 2020, 69, 1049–1057. [Google Scholar] [CrossRef]
  16. Novotney, A. The risks of social isolation. Monit. Psychol. 2019, 50, 32. [Google Scholar]
  17. Pearman, A.; Hughes, M.L.; Smith, E.L.; Neupert, S.D. Mental Health Challenges of United States Healthcare Professionals During COVID-19. Front. Psychol. 2020, 11, e2065. [Google Scholar] [CrossRef] [PubMed]
  18. Su, Z.; McDonnell, D.; Wen, J.; Kozak, M.; Abbas, J.; Šegalo, S.; Li, X.; Ahmad, J.; Cheshmehzangi, A.; Cai, Y.; et al. Mental health consequences of COVID-19 media coverage: The need for effective crisis communication practices. Glob. Health 2021, 17, 4. [Google Scholar] [CrossRef] [PubMed]
  19. Armiya’u, A.Y.U.; Yıldırım, M.; Muhammad, A.; Tanhan, A.; Young, J.S. Mental Health Facilitators and Barriers during COVID-19 in Nigeria. J. Asian Afr. Stud. 2022, 00219096221111354. [Google Scholar] [CrossRef]
  20. Hamka, M.W.S.; Ramadhan, Y.A.; Yusuf, M.; Wang, J.H. Spiritual Well-Being, Depression, Anxiety, and Stress in Indonesian Muslim Communities During COVID-19. Pyschology Res. Behav. Manag. 2022, 15, 3013–3025. [Google Scholar] [CrossRef]
  21. Rafique, N.; Al Tufaif, F.; Alhammali, W.; Alalwan, R.; Aljaroudi, A.; AlFaraj, F.; Latif, R.; Ibrahim Al-Asoom, L.; Alsunni, A.A.; Al Ghamdi, K.S.; et al. The Psychological Impact of COVID-19 on Residents of Saudi Arabia. Psychol. Res. Behav. Manag. 2022, 15, 1221–1234. [Google Scholar] [CrossRef] [PubMed]
  22. Fulk, A.; Saenz-Escarcega, R.; Kobayashi, H.; Maposa, I.; Agusto, F. Assessing the Impacts of COVID-19 and Social Isolation on Mental Health in the United States of America. medRxiv 2022. [Google Scholar] [CrossRef]
  23. Reinhart, A.; Brooks, L.; Jahja, M.; Rumack, A.; Tang, J.; Agrawal, S.; Al Saeed, W.; Arnold, T.; Basu, A.; Bien, J.; et al. An open repository of real-time COVID-19 indicators. Proc. Natl. Acad. Sci. USA 2021, 118, e2111452118. [Google Scholar] [CrossRef]
  24. Lütkepohl, H. A New Introduction to Multiple Time Series Analysis; Springer: Berlin/Heidelberg, Germany, 2005. [Google Scholar] [CrossRef]
  25. Stock, J.; Watson, M. Vector Autoregressions. J. Econ. Perspect. 2001, 15, 101–115. [Google Scholar] [CrossRef]
  26. Pfaff, B. Analysis of Integrated and Cointegrated Time Series with R, 2nd ed.; Springer: New York, NY, USA, 2008. [Google Scholar] [CrossRef]
  27. Pfaff, B. VAR, SVAR and SVEC Models: Implementation within R Package vars. J. Stat. Softw. 2008, 27, 1–32. [Google Scholar] [CrossRef]
  28. Skafle, I.; Nordahl-Hansen, A.; Quintana, D.S.; Wynn, R.; Gabarron, E. Misinformation about COVID-19 Vaccines on Social Media: Rapid Review. J. Med. Internet Res. 2022, 24, e37367. [Google Scholar] [CrossRef]
  29. Holcombe, M.; Yan, H.; Waldrop, T. Delta Variant Now Makes Up more than Half of Coronavirus Cases in US, CDC says. CNN 2021. Available online: https://www.cnn.com/2021/07/06/health/us-coronavirus-tuesday/index.html (accessed on 4 May 2023).
  30. Hagen, A. How Dangerous Is the Delta Variant (B.1.617.2)? Am. Soc. Microbiol. 2021. Available online: https://asm.org/Articles/2021/July/How-Dangerous-is-the-Delta-Variant-B-1-617-2 (accessed on 5 May 2023).
  31. Xiong, J.; Lipsitz, O.; Nasri, F.; Lui, L.M.; Gill, H.; Phan, L.; Chen-Li, D.; Iacobucci, M.; Ho, R.; Majeed, A.; et al. Impact of COVID-19 pandemic on mental health in the general population: A systematic review. J. Affect. Disord. 2020, 277, 55–64. [Google Scholar] [CrossRef] [PubMed]
  32. Ramiz, L.; Contrand, B.; Rojas Castro, M.Y.; Dupuy, M.; Lu, L.; Sztal-Kutas, C.; Lagarde, E. A longitudinal study of mental health before and during COVID-19 lockdown in the French population. Glob. Health 2021, 17, 29. [Google Scholar] [CrossRef] [PubMed]
  33. Magnúsdóttir, I.; Lovik, A.; Unnarsdóttir, A.B.; McCartney, D.; Ask, H.; Kõiv, K.; Christoffersen, L.A.N.; Johnson, S.U.; Hauksdóttir, A.; Fawns-Ritchie, C.; et al. Acute COVID-19 severity and mental health morbidity trajectories in patient populations of six nations: An observational study. Lancet Public Health 2022, 7, E406–E416. [Google Scholar] [CrossRef] [PubMed]
  34. Mautong, H.; Gallardo-Rumbea, J.A.; Alvarado-Villa, G.E.; Fernández-Cadena, J.C.; Andrade-Molina, D.; Orellana-Román, C.E.; Cherrez-Ojeda, I. Assessment of depression, anxiety and stress levels in the Ecuadorian general population during social isolation due to the COVID-19 outbreak: A cross-sectional study. BMC Psychiatry 2021, 21, 212. [Google Scholar] [CrossRef]
  35. Vindegaard, N.; Benros, M.E. COVID-19 pandemic and mental health consequences: Systematic review of the current evidence. Brain Behav. Immun. 2020, 89, 531–542. [Google Scholar] [CrossRef]
  36. Kämpfen, F.; Kohler, I.V.; Ciancio, A.; Bruine de Bruin, W.; Maurer, J.; Kohler, H.P. Predictors of mental health during the COVID-19 pandemic in the US: Role of economic concerns, health worries and social distancing. PLoS ONE 2020, 15, e0241895. [Google Scholar] [CrossRef]
  37. Wu, T.; Jia, X.; Shi, H.; Niu, J.; Yin, X.; Xie, J.; Wang, X. Prevalence of mental health problems during the COVID-19 pandemic: A systematic review and meta-analysis. J. Affect. Disord. 2021, 281, 91–98. [Google Scholar] [CrossRef]
  38. Santini, Z.I.; Jose, P.E.; Cornwell, E.Y.; Koyanagi, A.; Nielsen, L.; Hinrichsen, C.; Meilstrup, C.; Madsen, K.R.; Koushede, V. Social disconnectedness, perceived isolation, and symptoms of depression and anxiety among older Americans (NSHAP): A longitudinal mediation analysis. Lancet Public Health 2020, 5, e62–e70. [Google Scholar] [CrossRef]
  39. Saddik, B.; Hussein, A.; Albanna, A.; Elbarazi, I.; Al-Shujairi, A.; Temsah, M.H.; Saheb Sharif-Askari, F.; Stip, E.; Hamid, Q.; Halwani, R. The psychological impact of the COVID-19 pandemic on adults and children in the United Arab Emirates: A nationwide cross-sectional study. BMC Psychiatry 2021, 21, 224. [Google Scholar] [CrossRef]
  40. Hwang, T.J.; Rabheru, K.; Peisah, C.; Reichman, W.; Ikeda, M. Loneliness and social isolation during the COVID-19 pandemic. Int. Psychogeriatr. 2020, 32, 1217–1220. [Google Scholar] [CrossRef]
  41. Burton, A.; McKinlay, A.; Aughterson, H.; Fancourt, D. Impact of the COVID-19 pandemic on the mental health and well-being of adults with mental health conditions in the UK: A qualitative interview study. J. Ment. Health 2021, 29, 1–8. [Google Scholar] [CrossRef] [PubMed]
  42. Lekkas, D.; Gyorda, J.A.; Price, G.D.; Wortzman, Z.; Jacobson, N.C. Using the COVID-19 Pandemic to Assess the Influence of News Affect on Online Mental Health-Related Search Behavior Across the United States: Integrated Sentiment Analysis and the Circumplex Model of Affect. J. Med. Internet Res. 2022, 24, e32731. [Google Scholar] [CrossRef] [PubMed]
  43. Olagoke, A.A.; Olagoke, O.O.; Hughes, A.M. Exposure to coronavirus news on mainstream media: The role of risk perceptions and depression. Br. J. Health Psychol. 2020, 25, 865–874. [Google Scholar] [CrossRef] [PubMed]
  44. Kobayashi, H.; Saenz-Escarcega, R.; Fulk, A.; Agusto, F.B. Understanding mental health trends during COVID-19 pandemic in the United States using network analysis. medRxiv 2022. [Google Scholar] [CrossRef]
Figure 1. Association of COVID-19 with Anxiety. States that had significantly positive or negative coefficients in their equation for anxiety for the first or second lag of variables related to COVID-19 in the second time period. The color depicts whether a state had a positive (blue), negative (purple), or no significant coefficient for the corresponding variable. COVID-19 Incidence lag 1 (top left): (positive) Alaska, Florida, Idaho, Minnesota, Montana, Nebraska, New Jersey, (negative) Vermont. Lag 2 (bottom left): (positive) Alaska, Arizona, California, Connecticut, Delaware, Florida, Georgia, Iowa, Illinois, Kansas, Kentucky, Maryland, Minnesota, Mississippi, Nebraska, Nevada, New Hampshire, North Carolina, Ohio, Oklahoma, Oregon, South Dakota, Tennessee, Texas, Virginia, Washington, Wisconsin. COVID-19 Related Death lag 1 (top right): (positive) New Jersey, Washington, (negative) Illinois, North Dakota. Lag 2 (bottom right): (positive) Hawaii, Kansas, Louisiana, Maine, Mississippi, Missouri, New York, Oregon, Tennessee, (negative) Maryland.
Covid 03 00060 g001
Figure 2. Association of COVID-19 with Depression. States that had significantly positive or negative coefficients in their equation for depression for the first or second lag of variables related to COVID-19 in the second time period. The color depicts whether a state had a positive (blue), negative (purple), or no significant coefficient for the corresponding variable. COVID-19 Incidence lag 1: (positive) Connecticut, Minnesota, Nevada, Tennessee, Washington. Lag 2: (positive) Arizona, Illinois, Kansas, Maryland, Minnesota, Nebraska, North Carolina, Oregon, Washington, Wisconsin, (negative) Louisiana. COVID-19 Related Death lag 1: (positive) Iowa, New Jersey, (negative) Nevada, West Virginia. Lag 2: (positive) Hawaii, Kansas, Louisiana, Maine, Michigan, New Mexico, New York, Oregon, Texas, Vermont.
Covid 03 00060 g002
Figure 3. Association of Social Isolation with Anxiety. States that had significantly positive or negative coefficients in their equation for anxiety for the first or second lag of variables related to Social Isolation in the second time period. The color depicts whether a state had a positive (blue), negative (purple), or no significant coefficient for the corresponding variable. Time Spent w/Others lag 1: (positive) Indiana, Mississippi, (negative) Maryland, Michigan, Oklahoma, Texas. Lag 2: (positive) Mississippi, New York, Ohio, Virginia, (negative) Maine. Work Outside Home lag 1: (positive) Hawaii, Oklahoma, (negative) Ohio, Wyoming. Lag 2: (positive) Georgia, Illinois, Michigan, North Carolina, Tennessee, Virginia, Washington, West Virginia, (negative) Louisiana, Oregon, South Dakota.
Covid 03 00060 g003
Figure 4. Association of Social Isolation with Depression. States that had significantly positive or negative coefficients in their equation for depression for the first or second lag of variables related to Social Isolation in the second time period. The color depicts whether a state had a positive (blue), negative (purple), or no significant coefficient for the corresponding variable. Time Spent w/Others lag 1: (positive) Connecticut, Illinois, Mississippi, (negative) Idaho, Maryland, Michigan. Lag 2: (positive) California, Florida, Hawaii, Illinois, Indiana, Kansas, Massachusetts, Michigan, Nevada, New York, North Carolina, Ohio, Pennsylvania, Texas, Virginia, Washington, West Virginia, (negative) South Dakota. Work Outside Home lag 1: (positive) Idaho, Illinois, (negative) New Hampshire, Ohio, South Carolina, Texas, Washington, Wyoming. Lag 2: (positive) Arkansas, California, Maryland, Missouri, New Jersey, North Carolina, Washington, (negative) Louisiana, Montana, Oregon.
Covid 03 00060 g004
Figure 5. Association of COVID-19 with Anxiety. States that had significantly positive or negative impulses for anxiety for variables related to COVID-19 in the second time period. The color depicts whether a state had a positive (blue), negative (purple), or no significant coefficient for the corresponding variable. COVID-19 Incidence (left): (positive) Alaska, Arizona, Arkansas, Florida, Hawaii, Idaho, Kansas, Minnesota, Montana, Nebraska, Nevada, Ohio, Oregon, (negative) North Dakota, Vermont, Wisconsin. COVID-19 Related Death (right): (positive) Idaho, Maine, Missouri, Ohio, (negative) Arizona, Arkansas, Illinois, Nevada, North Dakota, Oregon.
Covid 03 00060 g005
Figure 6. Association of COVID-19 with Depression. States that had significantly positive or negative impulses for depression for variables related to COVID-19 in the second time period. The color depicts whether a state had a positive (blue), negative (purple), or no significant coefficient for the corresponding variable. COVID-19 Incidence (left): (positive) Arizona, Kansas, Minnesota, Nebraska, Nevada, North Dakota, Ohio, Oregon, (negative) Hawaii, New Hampshire. COVID-19 Related Death (right): (positive) Delaware, Idaho, Maine, New Hampshire, New Jersey, Oklahoma, Tennessee, Texas, (negative) Arizona, Oregon, West Virginia.
Covid 03 00060 g006
Figure 7. Association of Social Variables with Anxiety. States that had significantly positive or negative impulses for anxiety for social variables in the second time period. The color depicts whether a state had a positive (blue), negative (purple), or no significant coefficient for the corresponding variable. Time spent with others indoors (left): (positive) Arkansas, Florida, Hawaii, Indiana, Mississippi, Nebraska, (negative) Arizona, Kansas, Michigan, North Carolina, Oklahoma. Work outside home indoors (right): (positive) New Mexico, North Dakota, Oklahoma, (negative) Arizona, Florida, Hawaii, Louisiana, Nebraska, Nevada, New Hampshire, Ohio, Oregon, Wyoming.
Covid 03 00060 g007
Figure 8. Association of Social Variables with Depression. States that had significantly positive or negative impulses for anxiety for social variables in the second time period. The color depicts whether a state had a positive (blue), negative (purple), or no significant coefficient for the corresponding variable. Time spent with others indoors (left): (positive) Arkansas, Illinois, Mississippi, Ohio, Wisconsin, (negative) Arizona, Idaho, Maryland, Michigan. Work outside home indoors (right): (positive) Delaware, Maryland, Nevada, South Dakota, (negative) Arizona, Iowa, Nebraska, New Hampshire, Ohio, Oregon, Wisconsin, Wyoming.
Covid 03 00060 g008
Disclaimer/Publisher’s Note: The statements, opinions and data contained in all publications are solely those of the individual author(s) and contributor(s) and not of MDPI and/or the editor(s). MDPI and/or the editor(s) disclaim responsibility for any injury to people or property resulting from any ideas, methods, instructions or products referred to in the content.

