Article

The Effects on Neighborhood Environments during Lockdowns: Being Comfortable in Residences

1
BYG Consultants, Gulberg, Lahore 54660, Pakistan
2
Faculty of Engineering & IT, The British University in Dubai, Dubai P.O. Box 345015, United Arab Emirates
3
Department of Civil & Environmental Engineering, Botswana International University of Science and Technology, Palapye P.O. Box 1088, Botswana
4
Taghi-Smith Consultants, Architecture and Planning, Hillview EH52 5SB, UK
5
Department of Landscape Architecture, University Kelantan, Kelantan 16100, Malaysia
6
Centre of Public Health, Queen’s University, Belfast BT7 1NN, UK
7
Department of Architecture, College of Architecture and Design, Ajman University, Ajman P.O. Box 346, United Arab Emirates
*
Author to whom correspondence should be addressed.
COVID 2022, 2(12), 1635-1649; https://doi.org/10.3390/covid2120118
Submission received: 12 September 2022 / Revised: 28 October 2022 / Accepted: 31 October 2022 / Published: 24 November 2022
(This article belongs to the Special Issue How COVID-19 and Long COVID Changed Individuals and Communities)

Abstract

:
Cities around the world have been hit by the COVID-19 crisis. The worst consequences of the pandemic are closely related to urban areas. Many studies investigated the impact of COVID-19 on people but there are few studies that have investigated the satisfaction level of university students during the COVID-19 lockdown at the neighborhood level. Therefore, the aim of this study is to investigate the satisfaction of university students at the neighborhood level during the COVID-19 lockdown and investigate the experience of online education during that period—if they received any. An online survey was conducted involving university students of different countries, and a total of 427 responses (n = 427) were received and analyzed using the CHAID model. Results show that comfort at residences during the COVID-19 lockdown was affected by the neighborhood environment (viz., greenery, pleasant views, independent housing with gardening facilities), transportation (i.e., saving 1–2 commuting hours on a daily basis and safety from traffic hazards), and the provision of online education (i.e., effectiveness, such as traditional methods of education and the opportunity to connect with field experts). Thus, it can be concluded that providing green neighborhoods, detached or terraced houses (townhouses) with visual connection, and gardening facilities for the residents should be encouraged in the future because these types of neighborhoods are not only comfortable in ordinary situations but also provide comfort during critical periods such as COVID-19 lockdowns. It can also be concluded that a hybrid style of education should be encouraged for universities, as it can save travel time, provide safety from traffic, and provide more opportunities to become connected with international experts through online guest lectures, seminars, and workshops.

1. Introduction

Cities around the world have been affected by the global-scale series of crises caused by the COVID-19 pandemic. The urban areas have been on the receiving end of the worst of the consequences, where mortality rates appear to be higher due to a complex mix of causes, including population growth, higher national and international movement, and varying degrees of public health response.
Modern cities were not planned and built with highly communicable diseases such as coronavirus infections in mind. Many modern cities are too busy and do not have enough open space. Most of the advantages of living in a thriving metropolis—fast public transport, busy bars and restaurants, and the seemingly infinite abundance of entertainment and music, to name a few—are characterized by frequent and close social contact. In turn, these metropolises provide fertile breeding grounds for viral infections.
COVID-19 is now considered a global pandemic, as declared by the WHO on 11 March 2020. Initially it was categorized as an epidemic, which is the rapid spread of a virus/disease across a particular region or regions. Once the epidemic gets out of control and starts to spread to multiple countries/regions, it is listed as a pandemic. A pandemic can affect events on a global scale and cause pressure on healthcare systems with increased demand of certain treatments. It also contributes to the disruption of the social, political, and economic sectors. Over the years, different kinds of diseases and illnesses have caused suffering to humanity. The widespread interaction of humans and animals has accelerated epidemics such as malaria, tuberculosis, leprosy, influenza, smallpox, and several other earlier diseases. As the development of cities took place by converting smaller towns into larger urban environments, expanding trade routes, increased contact with animals, mixed ecosystems, and large population growth instigated changes into the behavior of pandemics.
More recently, the outbreaks of diseases have been dramatically perceived to be the harbingers of the end of human civilization. Some of the worst pandemics dating from early periods include the Plague of Justinian which occurred during 541–542, the Black Death from 1346–1350, the Sixth Cholera Pandemic from 1899–1923, Spanish Flu from 1918–1920, Asian Flu from 1957–1958, Hong Kong Flu from 1968–1969, Swine Flu from 2009–2010, and the recent and prevalent COVID-19, which started in 2020 [1,2,3]. Coronavirus being the current pandemic adds to the long list of rapidly spreading infectious diseases. Earlier in the 20th century, tuberculosis affected South Africa in 2006 and Ebola affected West Africa in 2014. These pandemics brought new challenges for cities and highlighted the need to reshape the city into a healthy environment. History informs us concerning the inter-relationships between the features of a city and critical diseases. The pandemics have always left a mark on the cities in which they emerged, as well as the societies and the individuals of the period. For example, it has been reported that COVID-19 had psychological and psychosocial affects [4] and drastically changed people’s lifestyles and forced them to adopt new behaviors [5]. This also highlights the idea of moving forward and planning, as things will never revert to what they were in the past [6].

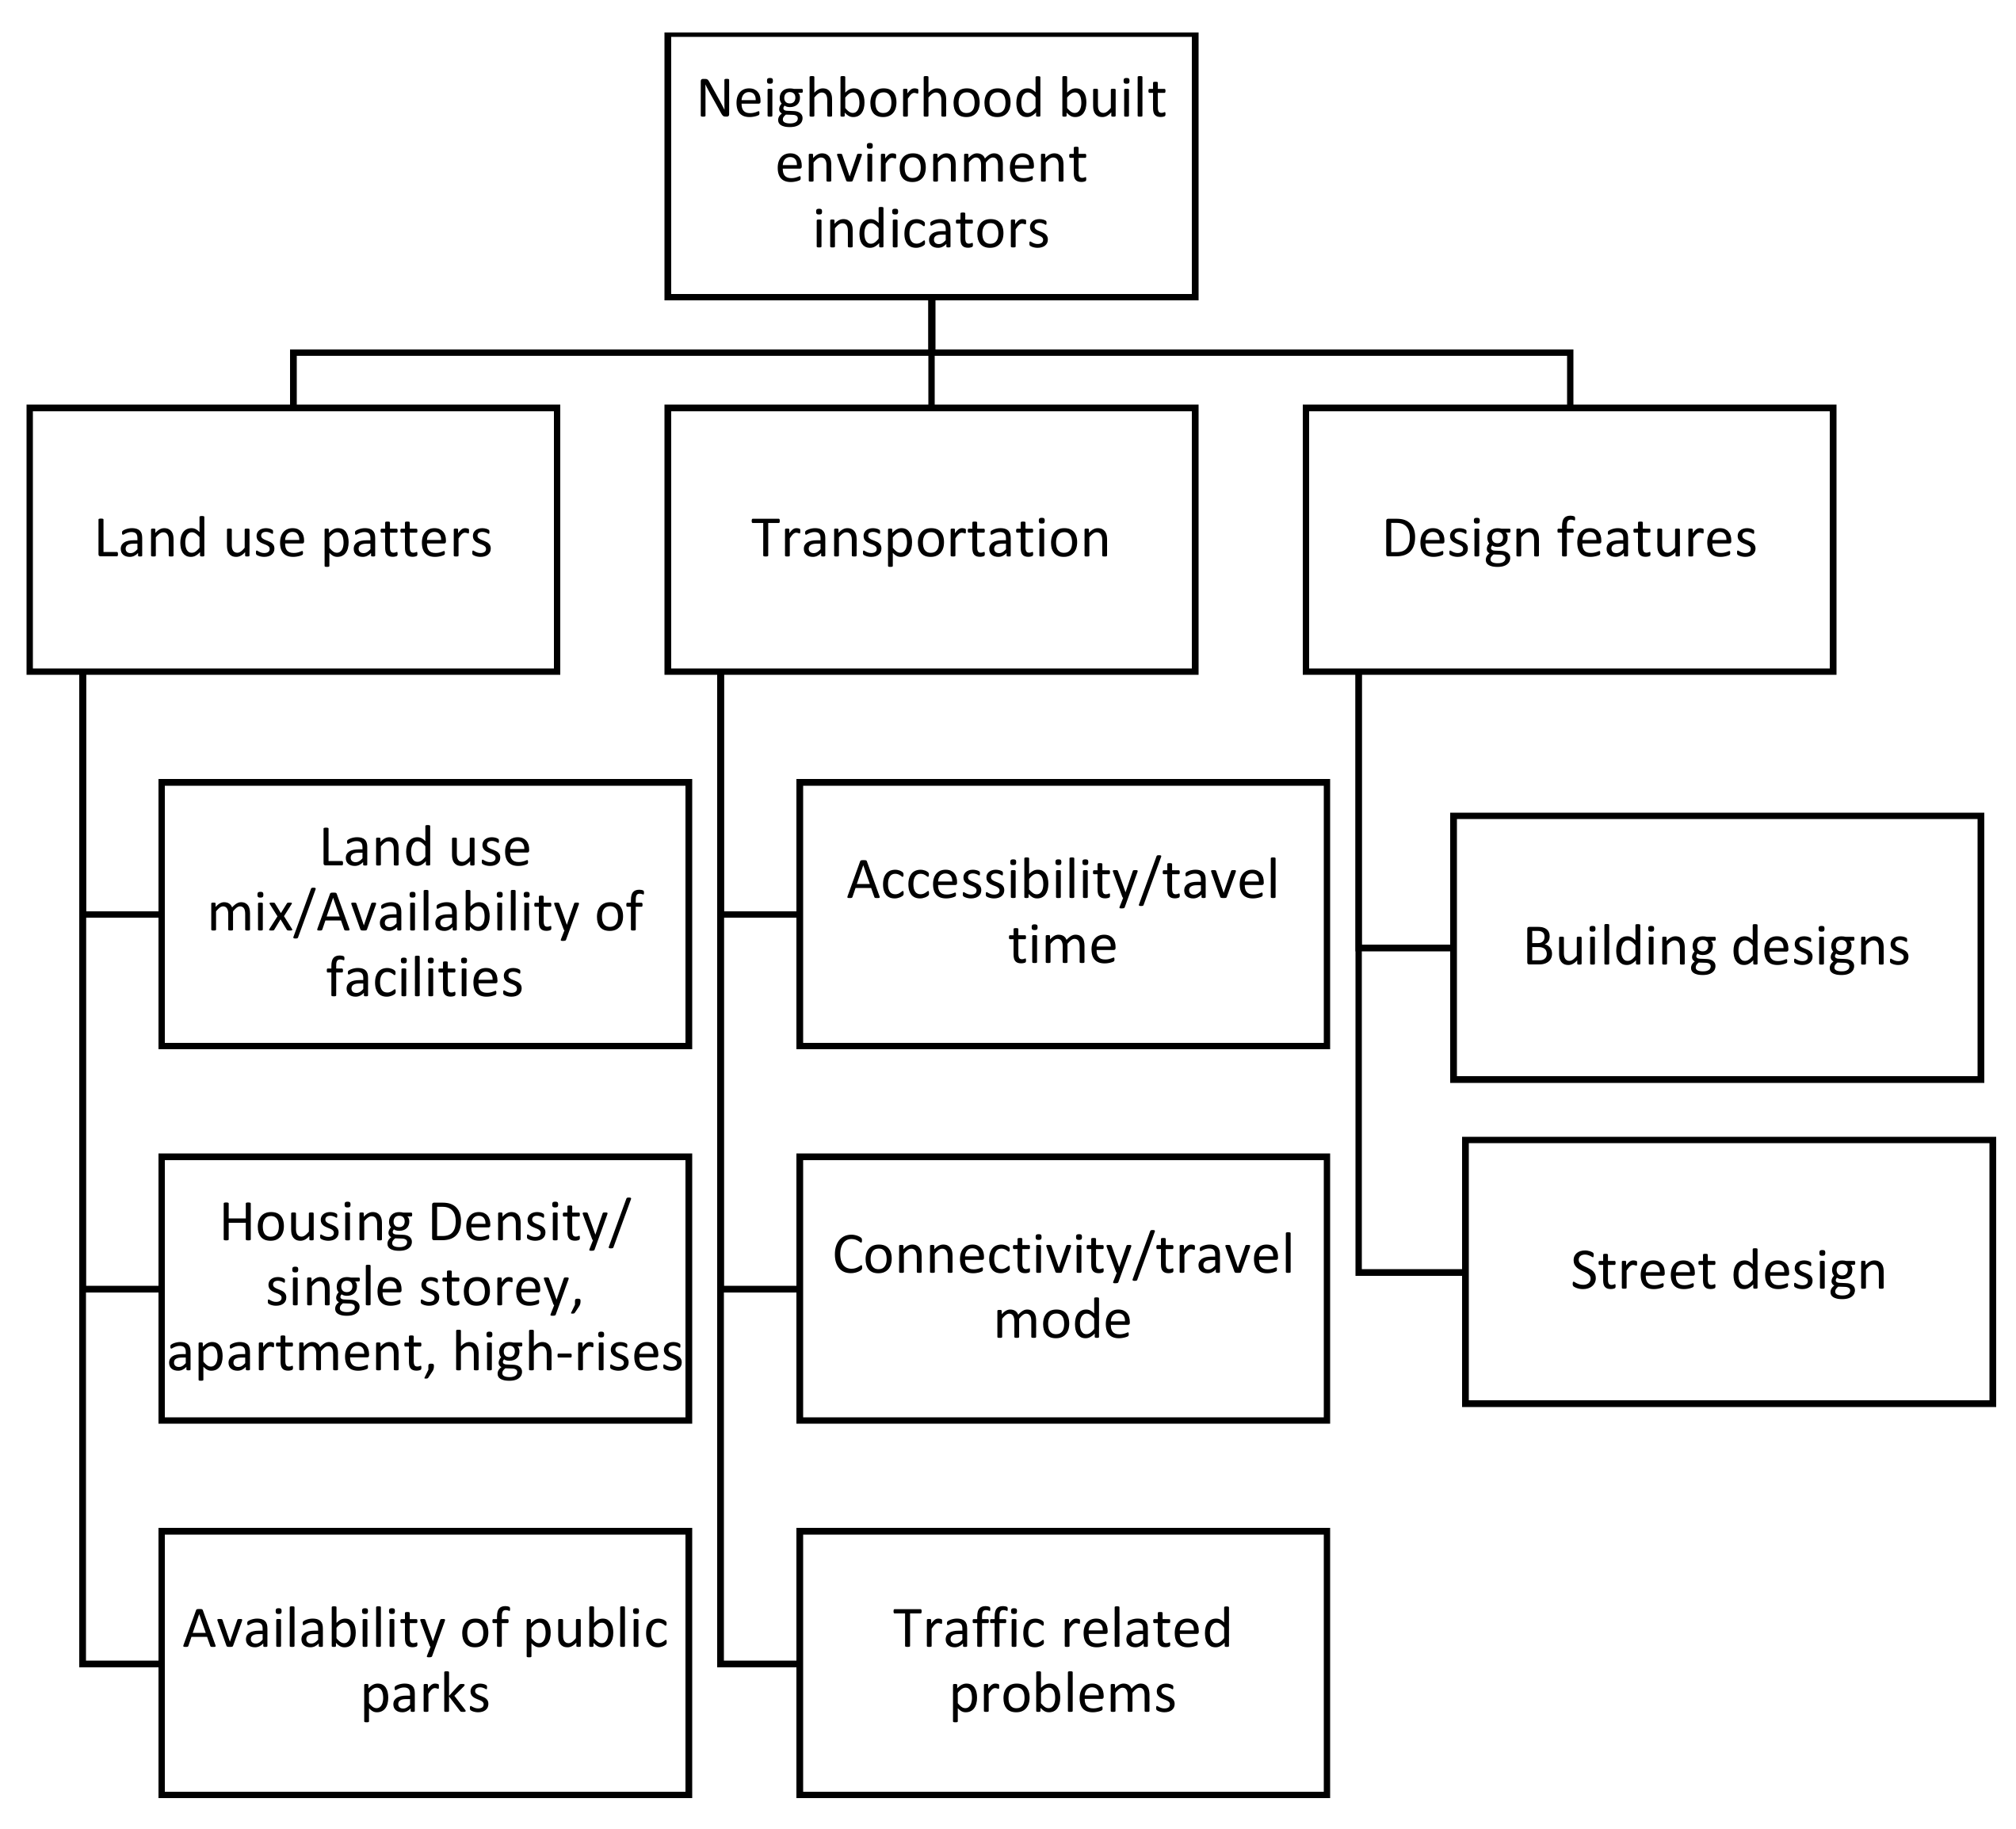
1.1. The Relationship of Neighborhood Environment Indicators with Neighborhood Satisfaction during the COVID-19 Lockdown

There are different indicators which are important to be considered in neighborhoods in order to provide comfort to residents not only in ordinary times but also during difficult times such as the COVID-19 lockdown. Neighborhood satisfaction is also associated with mental health [7]. Neighborhood satisfaction is measured through the built environment and social environment of the areas. The built environment is again divided into sub-categories: the land use of the area and housing density and connectivity. Transportation facility is mainly measured through the accessibility of the neighborhood from adjoining areas, and the design features of the neighborhood are measured through its street scape and building designs. The details of neighborhood indicators [8] are given in Figure 1 [8].
Built Environment Indicators: Indicators of the built environment at the neighborhood level are classified into three categories, the land-use patterns, transportation, and design features, which can be the measure for the satisfaction level of any neighborhood. The land-use patterns are mainly the land-use mix and housing density. These have been investigated through many studies and it is claimed that a measure of land-use mix is associated with the satisfaction level [9,10,11,12,13]. Housing density is the second important indicator for land-use patterns, and many researchers have claimed in their studies that there exist co-relations between residential density and neighborhood satisfaction. It has been claimed that residential density has an association with the satisfaction level of people who are residing there [9,11,14]. The residential density is associated with residential satisfaction because in high-rise buildings there is the fear of crime that has been found to inhibit mothers from sending their children to play outside [15]. High-rise buildings were found less satisfactory for the residents in another study stating that mental stress is associated with high-rise buildings [16]. On the other hand, in another study, it was stated that the dissatisfaction in compact cities is not just because of high density and high-rise buildings, but there are other factors which affect the satisfaction level of residents, such as environmental quality, noise, lack of community involvement, traffic, and lack of services and facilities [17].The third important indicator of land-use patterns is connectivity, which is considered important for neighborhood satisfaction. Connectivity is calculated through counting the number of intersections in different buffers (i.e., 500 m, 1 km, etc.) and cul-de-sacs. [9] claimed that street connectivity is associated with satisfaction. In another study, it was claimed that neighborhood features alone (i.e., sidewalks, front porches, small setbacks) are not enough for walking or for residents to be physically active but street patterns such as fewer cul-de-sacs can play a role in walking and satisfaction [18]. In another study, it was claimed that the neighborhood designs that follow the guidelines for livable neighborhoods are more connected and walkable and residents are more physically active and feel more satisfied than those in neighborhoods which do not follow these guidelines [19,20].
Transportation: In transportation, accessibility is the most important indicator which is measured through the presence, proximity, and variety of destinations as well as the availability and condition of infrastructure [8]. Connectivity and traffic-related characteristics are important to encourage active travel at the neighborhood level. Accessibility is important for active travel to some destinations (i.e., public transport, school, and work). Destination access is associated with transport-related physical activity. Increasing the diversity of destinations appears to be strongly associated with walking and satisfaction [21]. Ref. [12] found out that quality of sidewalks for transportation and shopping is positively associated with satisfaction. According to [22], unavailability of sidewalk cafes is negatively associated with physical activity and neighborhood satisfaction. Because of the availability of sidewalks/bike lanes, low-income individuals living in high-scoring counties are more physically active regarding transportation than those living in low-scoring counties [11]. Community infrastructure is associated with physical activity and satisfaction [11]. At the same time, new research about transportation during pandemics describes an effort to support potential shifts in practice by documenting and cataloging over a thousand COVID-19-related mobility responses into a publicly available database. They provide detailed guidance on using the database, along with preliminary summaries of key variables in the database. They also put forth a research agenda intended to build understanding about the processes that led to these actions, their implications for future efforts to design and implement pedestrian and bicycle infrastructure, and ways in which the transport professions might evolve in response to lessons learned during and after the pandemic [22].
Design Features: The design features of a neighborhood which promote satisfaction are the aesthetics at the building level and at the street level. Aesthetics is positively associated with satisfaction [10]. Poor neighborhoods having fewer, dirty landmark buildings, non-availability of sidewalks, and high crime rates have residents that are less physically active than affluent areas which have better aesthetics and that are safer. Some social indicators such as perception of crime are also important for neighborhood satisfaction [23]. The perception of crime is the same even in gated communities [24]. Sense of community is also related to neighborhood satisfaction. If there is sense of security and sense of community, the residents feel comfortable at the neighborhood level [25]. The green space inside a neighborhood plays a vital role in the neighborhood satisfaction. For example, in one study it was stated that greater access to green space is associated with higher levels of life satisfaction in New Zealand [26]. At the same time, another study in the Netherlands also agreed that the residents of the neighborhood with a higher availability of accessible and usable green spaces were more satisfied with their neighborhood. This difference was statistically mediated by the higher level of perceived green space quality. Neighborhood satisfaction was significantly positively related to well-being [27]. Another study from the USA stated that there is an association between neighborhood environment and neighborhood satisfaction. The study stated that participants of the study reported greater satisfaction when they perceived their neighborhood as having greater pedestrian/traffic safety, crime safety, attractive aesthetics, access to destinations, diversity of destinations, park access, and lower residential density as compared to the neighborhoods which lacked these facilities [28,29]. In another study out of Chicago, it was stated that neighborhood satisfaction and the use of outdoor green spaces play a significant role in life satisfaction and well-being of urban residents. The study contained 434 respondents from 4 Chicago communities and the results highlighted that the quality of public spaces, the number of facilities provided by them, and the neighborhood comfort are strongly influenced by the physical attributes [30]. Socio-demographics are also important, as different gender and/or age groups have different experiences of satisfaction inside their neighborhoods [31].

1.2. Online Education

The second important measure for this study was to calculate the satisfaction level of respondents if they had taken advantage of online education during COVID-19 lockdown. In a study, a total of 372 responses from students who had completed at least one online course at a university in the Midwestern United States were used to examine the structural model. Findings indicate that instructor–student dialogue, student–student dialogue, instructor, and course design significantly affect students’ satisfaction and learning outcomes. The findings suggest that course design, instructor, and dialogue are the strongest predictors of user satisfaction and learning outcomes [32]. In another study of 397 responses from students who had completed at least one online course at a university in the Midwest, the structural model was examined. The results indicated that not all the antecedent variables significantly affect students’ satisfaction. Of the six antecedent variables hypothesized to affect the perceived learning outcomes, only instructor feedback and learning style were significant [33]. In another study, the effects of student background variables on predictors were explored. The results showed that learner–instructor interaction, learner–content interaction, and internet self-efficacy were good predictors of student satisfaction, while interactions among students and self-regulated learning did not contribute to student satisfaction. Learner–content interaction explained the largest unique variance in student satisfaction. Additionally, gender, class level, and time spent online per week seemed to have influence on learner–learner interaction, internet self-efficacy, and self-regulation [34]. At the same time, the faculty satisfaction has also been measured for online education, and in the online faculty satisfaction survey (OFSS) this was developed and administered to all instructors who had taught an online course in the fall of 2007 or spring of 2008 at a small research university in the USA. One hundred and two individuals completed the web-based questionnaire. Results confirm that three criteria affect satisfaction of faculty in the online environment: student-related, instructor-related, and institution-related factors [35]. One study analyzed COVID-19 risk perception among university students in Ghana [36].
While the above-mentioned studies have investigated the student as well as faculty satisfaction with online teaching, the research has been limited to investigating the factors associated with the actual teaching and learning process. None of the studies have addressed the effects of neighborhood environment on online education. In addition, there has been no study on the positive or negative effects of the removal of travel time due to online education. The aim of the present study, therefore, is to investigate the satisfaction level of university students at the neighborhood level and residential level during COVID-19 lockdown. This study also aims to measure the travel time they formerly took to commute to their universities before COVID-19 lockdown and the effects of the daily commute or lack thereof on the satisfaction levels. Finally, the study aims to measure the experience and satisfaction of distance learning during the COVID-19 lockdown.

2. Methodology

2.1. Study Instruments and Tools

This study used an online survey. The study instrument consisted of a questionnaire with 24 number of questions. The first 5 questions collected demographic data. The remaining questions focused on the neighborhood characteristics, satisfaction levels, online education, and commutes. The questionnaire was translated into three languages—English, Persian, and Arabic—and data were collected by using online Google Forms sent out using different social media groups as well as personal contacts of the research team with faculty members in different parts of the world.

2.2. Study Areas and Study Samples

The target group for this study was university students at both the undergraduate and postgraduate levels. The results were drawn from five regions of the world after receiving enough responses from each of those regions. The regions which were included in this study are Australia, Europe (Germany, England), the Middle East (United Arab Emirates, Bahrain, Iran), Southeast Asia (Malaysia, Indonesia, China), and South Asia (India, Pakistan, Bangladesh). The major subjects which the respondents in this study were studying included Architecture, Engineering, Environmental Sciences, Social Sciences, and Information Technology.

2.3. Study Variables

The study variables were three types; firstly, neighborhood satisfaction, which contained neighborhood type, facilities, and satisfaction. In that section the students were asked about the types of housing in their neighborhood, the availability of facilities in and around their neighborhood, and their perception of their neighborhood, particularly in terms of satisfaction. To measure the types of neighborhoods where they were living, they were given the options of neighborhoods consisting of detached single-family houses, townhouses or row houses 1–2 stories, and apartments or condos 1–3 stories, 4–5 stories, 6–12 stories, or more than 12 stories. Then, they were asked about the availability of facilities in their neighborhood such as easiness of designated walking pathways, pleasant cycling lanes, sports facilities, options of public transport, shops and grocery, entertainment centers, online food order timing, availability of quality restaurants, safety from traffic and crime, and availability of walkways. They were asked if they thought their neighborhood was overall a good place for social interaction and if they felt comfortable while living in their neighborhood during COVID-19 lockdown.
The second important indicator was their satisfaction with their own residence measured through housing type, size, occupancy, and satisfaction perception. The respondents were asked if they lived in an independent house/villa, a town- or a row house, or an apartment. Then, they were asked how many rooms were in their houses, where the options ranged from one to four or more bedrooms. They were then asked about the number of people who lived in their houses, and the options ranged from 1 to 6 or more persons. They also answered questions on the characteristics of their houses, such as whether their houses had aesthetically attractive (i.e., greenery, coastal, pools, lakes, street vistas, etc.) views. Then, they were also asked if they had the option of opening their windows and/or balconies to enjoy the views. They were also asked if they had gardening options at their houses. Finally, they were asked whether they felt comfortable at their houses during the COVID-19 lockdown.
The third important indicator was transportation, measured through the travel time, travel mode, and choice before the COVID-19 lockdown. They were asked about the daily time commuting (2-way) to their university. The option given was less than 30 min up to 2 h. They were asked for the mode of transportation they used, such as public, university, personal, cycling, or walking.
The fourth measure of this study concerned the effectiveness of distance learning, innovation, and preferences. Participants were asked whether they received any online education during the COVID-19 lockdown. They were asked how effective they found the online classes. Different questions were asked of them such as: Were the classes reliably the same as regular class teaching? Was enough software used for teaching? Was that time saving? Was that learning effective for questions, answers, and assessments? They were also asked if they had a chance to receive guest lectures, or if their work was examined by field experts. They were asked if that was a good experience for them. In addition, they were asked if the distance learning method has potential to provide greater options for guest lectures/workshops, to easily connect with experts in the field, to enable work/assignments to be examined online by field experts, and to provide platforms for online conferences. Finally, they were asked if in the future they should obtain an option to choose any method of education, what would they prefer from online, blended, or regular university education, and why. If they chose the blended option, then they were asked how many days they would prefer to come to the campus. Some socio-demographics were also added to this study such as gender, country of origin, and major study areas.
Consent was obtained from the participants in order to collect their personal data to be used for research purposes after anonymizing.

2.4. Statistical Analysis

Two types of methods were used in this study: descriptive statistics and different parametric and non-parametric modelling techniques. The parametric and non-parametric modelling techniques were applied and the most adequate one was selected based on the accuracy rates (proportion of the correct predictions) to identify the factors that can affect being comfortable at a residence during lockdown. Since parametric methods (e.g., logistic regression) are highly affected by their underlying assumptions such as the normal distribution, non-parametric models that are assumption-free are more suitable choices for this study. Multicollinearity is another issue for parametric methods because of potential correlations among independent variables, and non-parametric models are better at handling multicollinearity. Among the common non-parametric techniques such as C5.0, C and R Tree, CHAID, QUEST, Bayesian networks, neural networks, etc., CHAID has the highest total and breakdown accuracy. Therefore, CHAID was selected as the suitable modelling technique. CHAID (Chi-squared Automatic Interaction Detection) uses chi-square to find optimal splits in decision trees for classification. It tests the correlation between each independent variable and the dependent variable by applying a chi-square test and selects the independent variables with the smallest p values. For an independent variable that has more than two categories, the categories with fewer effects on the dependent variable are collapsed together. Cross-validation was used to estimate the accuracy mainly because of the relatively small dataset. Instead of using training and test dataset splitting, random subsets of the data were used to develop a set of models to examine the overall accuracy.

3. Results

The results are reported in two parts: first, the descriptive analysis of indicators which was used in this study, and secondly, the relationship of all indicators investigated with the COVID-19 lockdown satisfaction. That relationship, which shows what the actual factors were that kept people satisfied during this difficult time, was investigated through the CHAID model. Descriptive statistics describe the indicators for which participants were given different options to select. There were four major divisions in descriptive analysis. The first part explains the socio-demographics percentages of participants. The second part describes the housing size, facilities, and number of people who live in one house. The third part of descriptive analysis explains the travel time and mode of transportation that the participants used to take to commute to their universities before the COVID-19 lockdown. The final descriptive analysis consists of the students’ future preference for education.

3.1. Descriptive Analysis
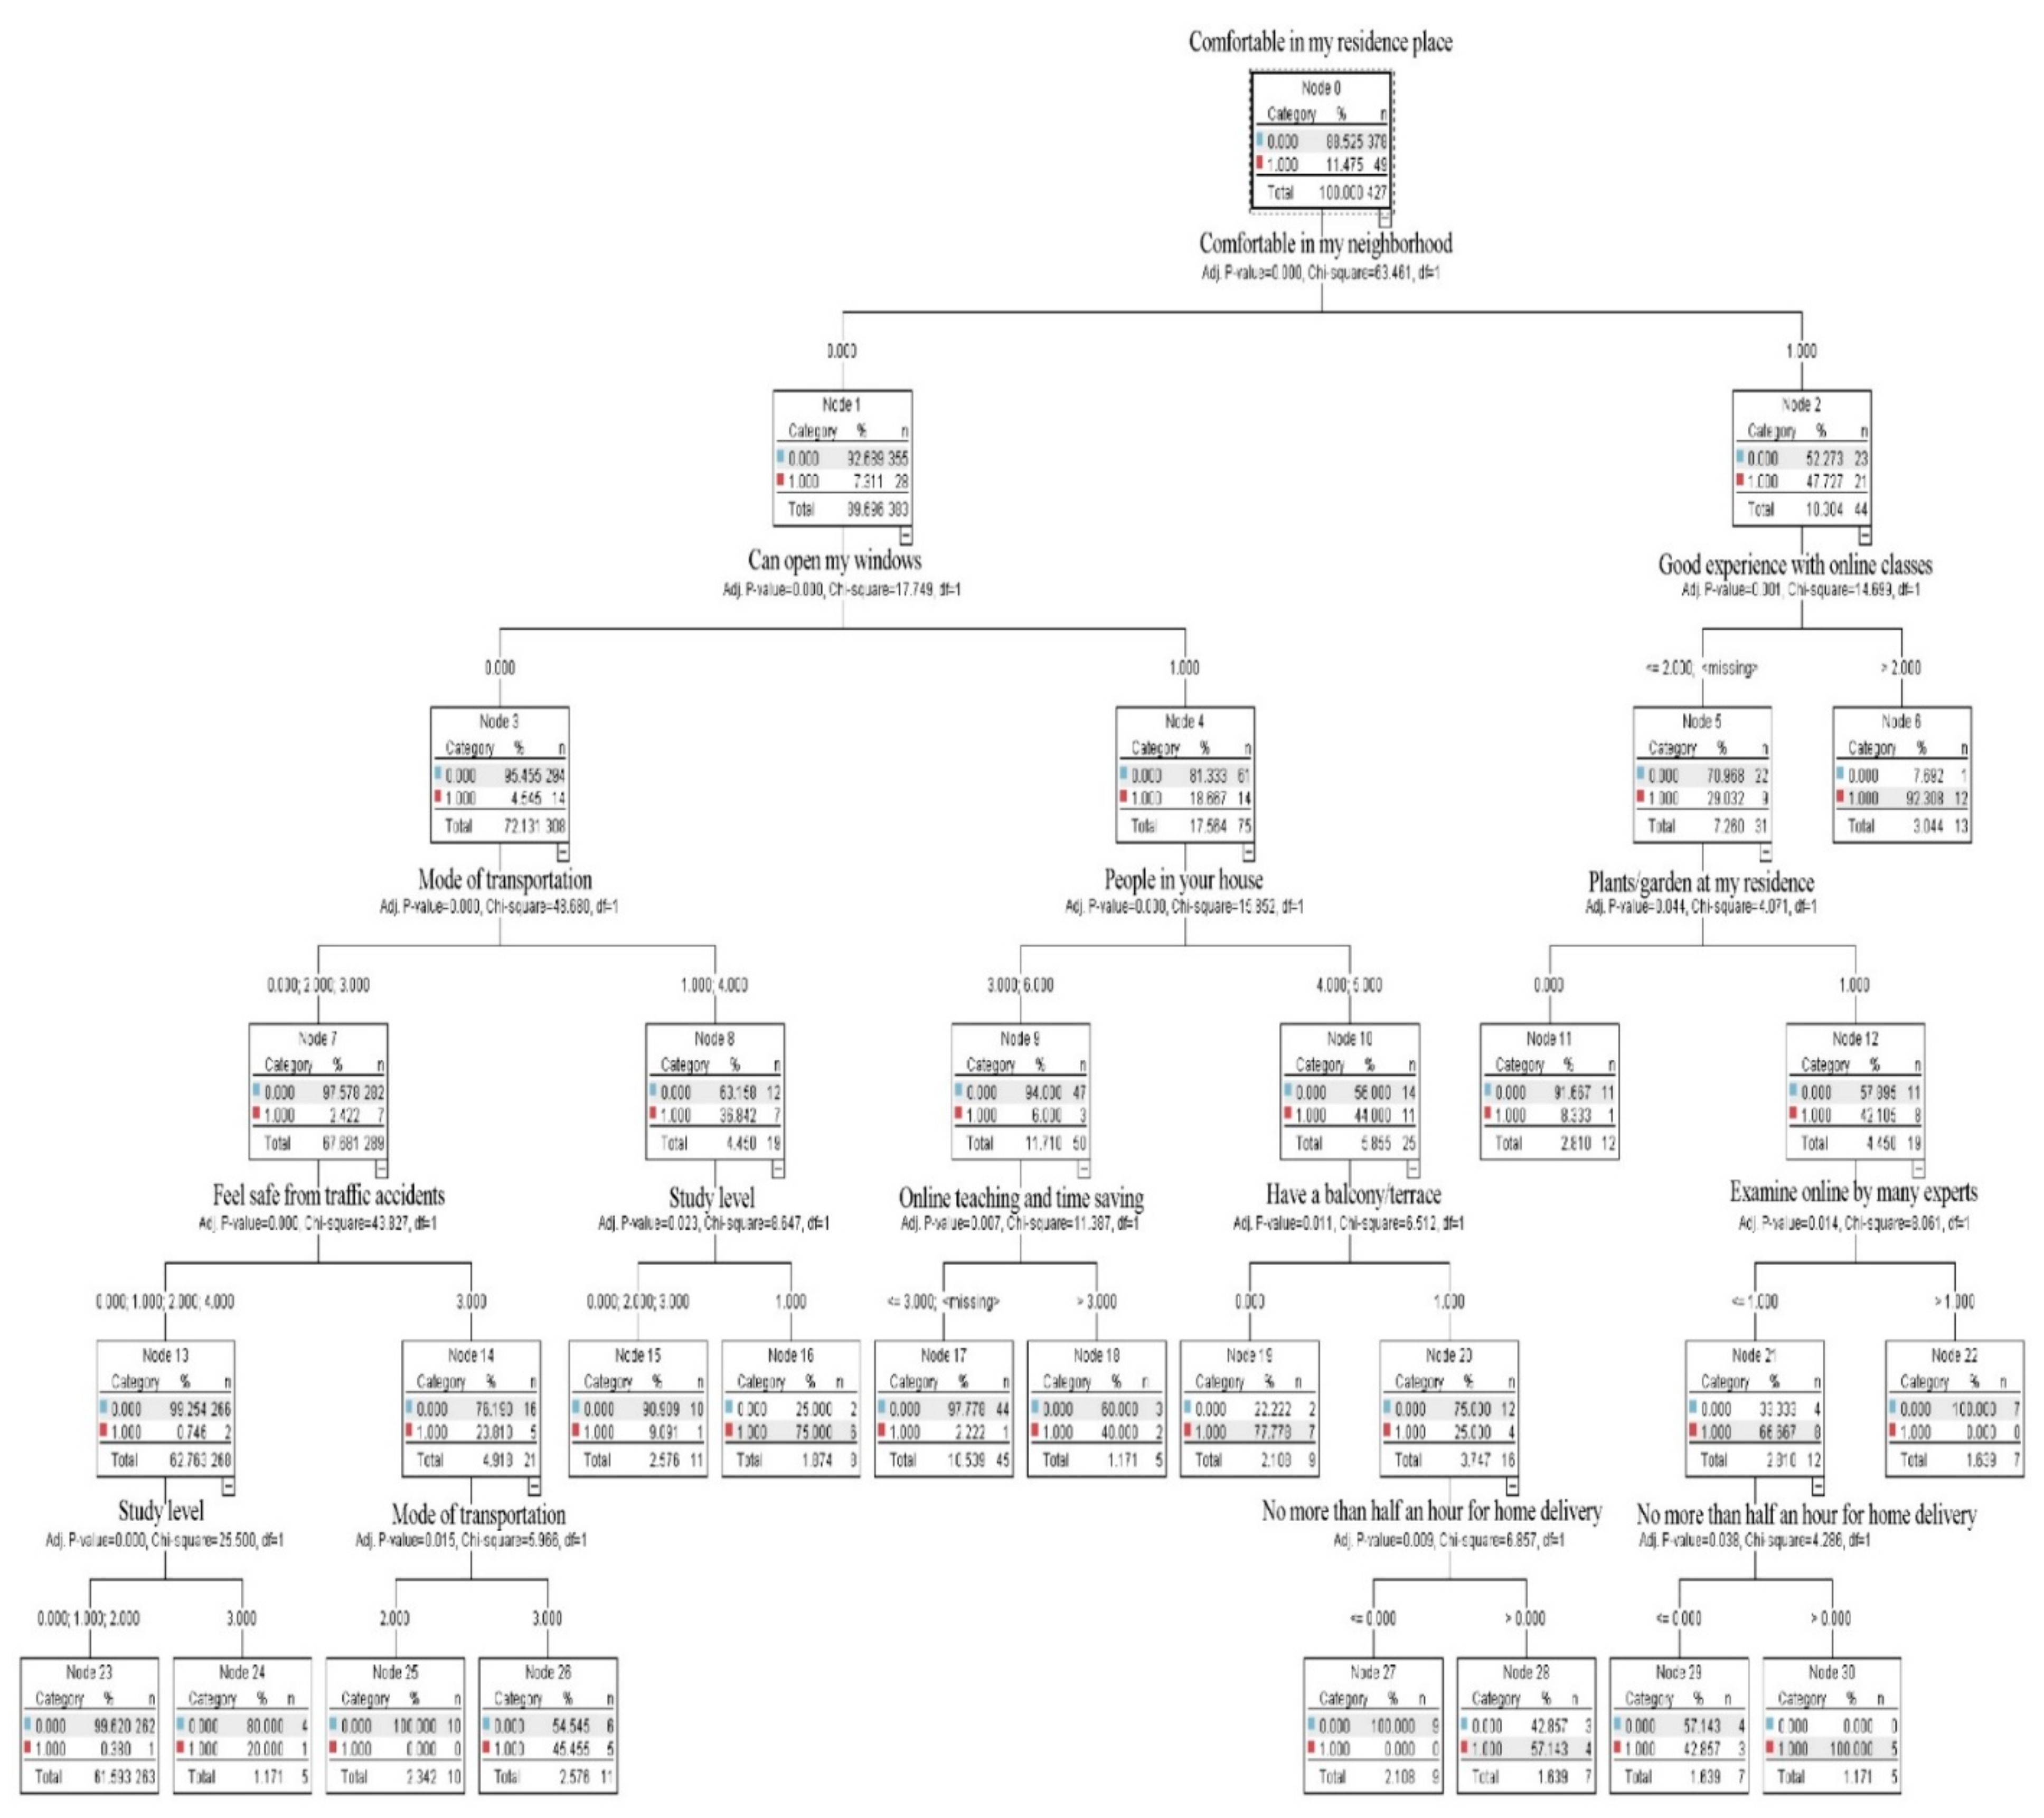
The descriptive results show that there were 52% male, 47% female, and 1% who preferred not to say their gender in this study out of the total 427 participants. Of all of the participants, 28% were from South Asia, 24% from Southeast Asia, 23% from Australia, 10% from Middle Eastern countries, 9.4% from Europe, and America and Africa remained with 5% and 2% of the participants, respectively. The study level was categorized into undergraduate, postgraduate, PhD, and others. The results show that the study participants were 44% postgraduate students, 38% undergraduate, 17% PhD, and 2% students from other study levels. The subject areas were again divided into Engineering, Architecture, Environmental Sciences, Social Sciences, IT, and others, such as Medical, etc. The highest number of students were from Environmental Sciences at 32%; 26% of participants were Architecture students. The third major group of participants were IT students, at 21%; 8.2% and 7% were from Engineering and Social Sciences respectively; and 6.3% students studied other subjects. The descriptive statistics for socio-demographics are given in Table 1. The results show that there was no distinctive difference between the two genders, while most students were from three main regions, which were Australia, South Asia, and Southeast Asia. That is probably since more personal contacts were available/used in these areas. Most students were at the postgraduate level while the undergraduate students were the second highest percentage; 32% of the participants were from Environmental Sciences and the second highest percentage was the students of Architecture departments, which was 26% of the total number.
The residential types, number of occupants per house, and the sizes of houses were also considered important to investigate, as it was hypothesized that during the COVID-19 lockdown it became significant which type of housing the person lived in. This study therefore investigated which housing type provided comfort to its residents and why. The descriptive results show that 33% of the participants were living in independent villas, 24.4% of the participants were in townhouses/terraced houses, 16% of the participants were from apartments that contained 1–3 floors, 15.5% of the participants were from apartments that had 3–5 floors, 5% of the participants were from apartments that had 6–12 stories, and 4.4% of the participants were living in high-rise buildings of 13+ stories, while 2.6% of them mentioned other types of houses. The details of housing type, occupancy, and sizes are given in Table 2. The descriptive statistics of residential details show that most participants were either in detached housing or in townhouses, the number of occupants per house was four, and most of them had three bedrooms in their houses. People who lived in villas or townhouses mostly had gardens and open decks to enjoy the views; on the other hand, it is also true that in houses that had more than four persons in a three-bedroom house it was difficult to be satisfied with online education.
The third important set of attributes included the use of transportation mode and travel time before the COVID-19 lockdown. Different options were given to the participants to choose from. Of all of the participants, 51.3% said that they used public transport, 28% were using their personal vehicles, 14.8% used to walk to reach their universities, and 4% of the participants were using bicycles, while 1.2% used other modes of transportation to commute to their university before the COVID-19 lockdown. The second important factor for traveling investigation was the travel time. Of all of the participants, 37% said that it took them 30 min to reach their universities, 24% of the participants said that it took them less than 30 min, 21% of the participants said it took them 1–2 h, 9% of the participants said it took them more than 2 h, and 2% of the participants mentioned ‘other’ as their answer. The travelling results show that 50% of the participants used public transport for commuting to their universities and it took 61% of the participants 30 min or less to reach their universities on a daily basis. The descriptive statistics of mode of transportation and travel time are given in Table 3.
The fourth significant question of this study was to investigate the future preferences of education after experiencing online education during the COVID-19 lockdown. The results of this question were used to show if the participants had good experience, as then they would prefer to continue with online education; otherwise, they would prefer going back to the campus. There were three options given to the participants to choose from. The results show that 58% of the participants preferred a blended mode of education as a future option, while 23.4% of them liked to continue online and only 17.6% wanted to have a traditional method for their future education. The details of future mode of education preference are given in Table 4.

3.2. CHAID Model

The overall accuracy for the proposed CHAID model is 94.61%, which is higher than the accuracy for other possible parametric and non-parametric techniques. The breakdown accuracy is also high for the proposed CHAID model. Figure 2 shows the proposed CHAID model and Table 5 shows the most important features in this model. As expected, most of the people were not comfortable at their place of residence during lockdown, while around 11% were comfortable at their residence place during lockdown (refer to node 0 in Figure 2). Figure 2 shows that being comfortable in one’s neighborhood during lockdown is a very important factor for being comfortable in one’s residence place during lockdown. The results show that more than 92% (refer to node 1 in Figure 2) of the people who are not comfortable in their neighborhood during lockdown are also not comfortable at their residence place during lockdown. This percentage is around 52% (refer to node 2 in Figure 2) for people who are comfortable in their neighborhood during lockdown. Having a good experience with online classes is the other important factor, especially for the people who were comfortable in their neighborhood during lockdown, and most of the people who had a good experience with online classes and were comfortable in their neighborhood during lockdown (more than 92%) were also comfortable in their residence place during lockdown (refer to node 6 in Figure 2).
For the people who are not comfortable in their neighborhood during lockdown, having a window is an important factor (refer to nodes 7 and 8 in Figure 2). For these people, the percentage who are comfortable at their residence during lockdown and have a window (more than 18%) is considerably higher than the percentage of people who are comfortable at their residence during lockdown and have no window (more than 4%). The number of people who are living in the house is another important factor affecting comfort at the residence during lockdown for these people (refer to nodes 9 and 10 in Figure 2). Four and five are the numbers that are related to a higher percentage (around 44%) for being comfortable at the residence during lockdown in comparison with numbers three and six (6%).
The model prediction is being comfortable at the residence place during lockdown if the level of agreement for an overall good experience with online classes is more than 2 and the person is comfortable in their neighborhood during lockdown (refer to node 6 in Figure 2). For the people with a 2 or lower level of agreement for overall good experience with online classes, the model prediction is not being comfortable at the residence place during lockdown if they do not have plants or gardens in their residence places—even if they are comfortable in their neighborhood during lockdown (refer node 11 in Figure 2). For the people who have plants or gardens in their residence places, the model prediction is being comfortable at the residence place during lockdown only if online-ordered and home-delivered food does not take more than half an hour. The level of agreement with a distance learning method that has potential for work or assignments online to be examined by many experts in the field will be 1 or lower, and a 2 or lower level of agreement for overall good experience with online classes and being comfortable in the neighborhood during lockdown (refer to node 30 in Figure 2).
For the people who are not comfortable in their neighborhood during lockdown (refer to node 1 in Figure 2), there are also some possibilities to be comfortable at their residence places during lockdown. The model prediction is being comfortable at the residence place during lockdown for these people if the study level is undergraduate, the main transport is public transport or cycling, and they cannot open windows to enjoy the weather (refer to node 16 in Figure 2). The same prediction is also estimated for people who can open windows to enjoy the weather if they do not have a balcony or terrace to enjoy but there are four or five people in their houses (refer to node 19 in Figure 2). The same prediction is estimated for people who have a balcony or terrace if online-ordered food and home delivery does not take more than half an hour (refer to node 28 in Figure 2).
The overall CHAID model result shows that there were two main factors keeping university students satisfied during COVID-19 lockdown, which were the neighborhood satisfaction and online education satisfaction. The students who had pleasant views, windows and balconies, and who used to take 1–2 h to travel on daily basis were comfortable at home because they were feeling safe from traffic hazards. At the same time the number of occupants at home was important; any students who had more than five family members in a three-bedroom apartment were not satisfied at home. There were also some differences in different regions of the world.
The second most important factor for satisfaction was the online education systems. Students who had experiences of good-quality education such as the effectiveness and exposure to different experts in the fields felt satisfied during the COVID-19 lockdown and they considered online education just as effective as the traditional type of education.

4. Discussion and Conclusions

The review of available literature shows that there is a need to design cities that not only provide comfort to the residents during normal times and are sustainable, but also a need to be ready to cater for situations arising out of challenging times such as a global pandemic. The different aspects that are considered vital for future cities’ readiness for pandemics and sustainability are the built environment indicators, which were divided into three main parts: the land-use patterns, transportation, and the design features of the buildings.
Several studies as reported in the literature have reported that neighborhood environment indicators such as the mix of different land uses and the variety of housing types can affect the satisfaction of people. The findings of this study are in line with the study of Frank et al. [9], which reports that the neighborhoods with less variety of land uses were found more comfortable for people. A variety of housing types is an important indicator for land-use patterns, and many researchers have concluded that there exist co-relations between residential types and neighborhood satisfaction. Frank et al. [9] and Aytur et al. [11] concluded that residential types have association with the satisfaction level of people. This study agrees with both the studies in that townhouses and villas in suburban areas were considered more comfortable among the university students of different regions during the COVID-19 lockdown. This study also agrees with Weir et al. [15] that students were more comfortable in low-rise townhouses as compared to high-rise apartments in city centers. The study of Giles-Corti et al. [19] concluded that neighborhoods which followed the guidelines of livable cities are considered more comfortable for the residents. This study also agrees with Giles-Corti et al. [19], who claimed that the neighborhoods with more visual access to green spaces were considered more comfortable. The same conclusion has been drawn for the neighborhoods with more visual access to green spaces as being more comfortable during COVID-19 lockdown.
This study also investigated the mode of transportation use prior to the lockdown and any positive or negative effects of the removal of the commuting need during the lockdown. Traffic-related characteristics are important and affect neighborhood satisfaction. This study agrees with [12] who said that if a neighborhood were far away and connected through highways or if it takes a lot of time to reach from place to place in those neighborhoods, the neighborhood attains reduced resident satisfaction. In the present study as well, students were comfortable not to travel to their universities on a daily basis and stay at home and avoid traffic hazards.
The building designs were also an important factor for the comfort of people at their homes during the COVID-19 lockdown. The results of this study are in line with Strath et al. [10], who concluded that the aesthetic features, proper ventilation, and good views were positively associated with neighborhood satisfaction. The respondents who were living in houses where there were three–four family members in a three-bedroom house, with nice views, proper ventilation, and visual connection to its surroundings, were more comfortable at home during the COVID-19 lockdown.
The results of the investigation into the online education experience during COVID-19 lockdown show that it is equally effective and beneficial for the students to receive their education online instead of going to their universities. This study concluded that students who were receiving online education and were in contact with other professionals in their field through online lectures and had the opportunity to be evaluated by other professionals remained satisfied during this COVID-19 lockdown. Therefore, their preference for future education systems is either hybrid or fully online.
Finally, this study concluded that the quality of a neighborhood environment is an important factor for considering the satisfaction level of people who are living there. The neighborhood which was green enough and had buildings which provided proper ventilation, visual connection to its vicinity, and gardening facilities remained comfortable during the COVID-19 lockdown. Therefore, for future neighborhood environment design, it can be argued that green neighborhoods, properly ventilated whether independent or townhouses, with visual connection to the vicinity and providing gardening facilities, deserve consideration. This type of neighborhood will not only be comfortable in the case of pandemics such as COVID-19 but also can be a sustainable neighborhood. The second important conclusion from this study is that for avoiding traffic hazards and making cities comfortable, the education systems for university students can be hybrid. Higher satisfaction in the neighborhood leads to higher satisfaction in online education. Through online education the students not only save time but can remain safe from daily traffic hazards. The third important conclusion from this study is that an online education system is equally efficient and reliable, if it is managed properly. This type of education also helps students by providing the opportunity to connect with the other experts in their field through guest lectures, online presentations, conferences, and so forth.
This was a cross-sectional study conducted in the first year of the pandemic. It does not encompass any seasonal effects or the effects of sustained lockdowns over longer periods. Future studies may focus on those aspects. The findings of this research will contribute to the body of knowledge in the fields of neighborhood planning as well as educational planning. It is hoped that ongoing research in these areas, including the present study, will make humanity progressively better prepared for future pandemics such as COVID-19.

Author Contributions

Conceptualization: Y.G., methodology: Y.G. and Z.S.; Software: W.S.N. and and M.M.; Validation: J.A.S. and Y.G.; formal analysis: Y.G. and M.M.; investigation: Y.G., J.A.S., W.S.N. and Z.S.; resources: Y.G., Z.S., G.A.J., J.A.S., W.S.N., M.M. and D.H.; data curation: J.A.S.; Writing—original draft preparation: Y.G.; writing—reviews and editing: Y.G., J.A.S. and D.H.; Project Administration: Y.G.; funding acquisition: Y.G., Z.S., G.A.J., J.A.S., W.S.N., M.M. and D.H. All authors have read and agreed to the published version of the manuscript.

Funding

This research received no external funding.

Institutional Review Board Statement

Not applicable.

Informed Consent Statement

Not applicable.

Data Availability Statement

The research data can be obtained by contacting the corresponding author.

Conflicts of Interest

The authors declare no conflict of interest.

References

  1. Hickok, K. What Is Pandemic. Available online: https://www.livescience.com/pandemic.html (accessed on 3 March 2022).
  2. Ellin, N. Postmodern Urbanism; Princeton Architectural Press: New York, NY, USA, 1999. [Google Scholar]
  3. Ambrus, A.; Field, E.; Gonzalez, R. Loss in the Time of Cholera: Long-Run Impact of a Disease Epidemic on the Urban Landscape. Am. Econ. Rev. 2020, 110, 475–525. [Google Scholar] [CrossRef] [Green Version]
  4. Filindassi, V.; Pedrini, C.; Sabadini, C.; Duradoni, M.; Guazzini, A. Impact of COVID-19 First Wave on Psychological and Psychosocial Dimensions: A Systematic Review. COVID 2022, 2, 273–340. [Google Scholar] [CrossRef]
  5. Duradoni, M.; Fiorenza, M.; Guazzini, A. When Italians Follow the Rules against COVID Infection: A Psychological Profile for Compliance. COVID 2021, 1, 246–262. [Google Scholar] [CrossRef]
  6. Gum, S.A. Philadelphia under Siege: The Yellow Fever of 1793; The Pennsylvania State University: Philadelphia, PA, USA, 2010. [Google Scholar]
  7. Leslie, E.; Cerin, E. Are perceptions of the local environment related to neighbourhood satisfaction and mental health in adults? Prev. Med. 2008, 47, 273–278. [Google Scholar] [CrossRef]
  8. Gul, Y.; Sultan, Z.; Johar, F. Effects of Neighborhood’s built environment on physical activities in gated communities: A review. Int. J. Built Environ. Sustain. 2016, 3, 60–69. [Google Scholar] [CrossRef] [Green Version]
  9. Frank, L.D.; Schmid, T.L.; Sallis, J.F.; Chapman, J.; Saelens, B.E. Linking Objectively Measured Physical Activity with Objectively Measured Urban Form: Findings from SMARTRAQ. Am. J. Prev. Med. 2005, 28, 117–125. [Google Scholar] [CrossRef]
  10. Strath, S.; Isaacs, R.; Greenwald, M.J. Operationalizing Environmental Indicators for Physical Activity in Older Adults. J. Aging Phys. Act. 2007, 15, 412–424. [Google Scholar] [CrossRef] [PubMed] [Green Version]
  11. Aytur, S.A.; Rodriguez, D.A.; Evenson, K.R.; Catellier, D.J.; Rosamond, W.D. Promoting Active Community Environ-ments Through Land Use and Transportation Planning. Am. J. Health Promot. 2007, 21, 397–407. [Google Scholar] [CrossRef] [PubMed]
  12. De Bourdeaudhuij, I.; Sallis, J.F.; Saelens, B.E. Environmental Correlates of Physical Activity in a Sample of Belgian Adults. Am. J. Health Promot. 2003, 18, 83–92. [Google Scholar] [CrossRef]
  13. Gul, Y.; Sultan, Z.; Jokhio, G.A. Contribution to the Environmental sustainability by improving the walking behaviour through neighbourhoods’ design with special reference to developing countries. In E3S Web of Conferences, Proceedings of the 2019 7th International Conference on Environment Pollution and Prevention (ICEPP 2019), Melbourne, Australia, 18–20 December 2019; EDP Sciences: Les Ulis, France, 2020; Volume 158, p. 7. [Google Scholar] [CrossRef]
  14. Gul, Y.; Sultan, Z.; Moeinaddini, M.M.; Jokhio, G.A. Measuring the differences of neighbourhood environment and physical activity in gated and non-gated neighbourhoods in Karachi, Pakistan. J. Urban Des. 2018, 24, 494–513. [Google Scholar] [CrossRef]
  15. Weir, L.A.; Etelson, D.; Brand, D.A. Parents’ perceptions of neighborhood safety and children’s physical activity. Prev. Med. 2006, 43, 212–217. [Google Scholar] [CrossRef] [PubMed]
  16. Xue, P.; Mak, C.M.; Ai, Z.T. A structured approach to overall environmental satisfaction in high-rise residential buildings. Energy Build. 2016, 116, 181–189. [Google Scholar] [CrossRef]
  17. Howley, P.; Scott, M.; Redmond, D. Sustainability versus liveability: An investigation of neighbourhood satisfaction. J. Environ. Plan. Manag. 2009, 52, 847–864. [Google Scholar] [CrossRef]
  18. Wells, N.M.; Yang, Y. Neighborhood Design and Walking: A Quasi-Experimental Longitudinal Study. Am. J. Prev. Med. 2008, 34, 313–319. [Google Scholar] [CrossRef] [PubMed]
  19. Giles-Corti, B.; Knuiman, M.; Timperio, A.; van Niel, K.; Pikora, T.J.; Bull, F.C.L.; Shilton, T.; Bulsara, M. Evaluation of the implementation of a state government community design policy aimed at increasing local walking: Design issues and baseline results from RESIDE, Perth Western Australia. Prev. Med. 2008, 46, 46–54. [Google Scholar] [CrossRef] [PubMed] [Green Version]
  20. Gul, Y.; Jokhio, G.A.; Bibi, T. Walk towards sustainability: Improved neighbourhood street connectivity helps. In E3S Web of Conferences, Proceedings of the 1st JESSD Symposium: International Symposium of Earth, Energy, Environmental Science and Sustainable Development 2020, Jakarta, Indonesia, 28–30 September 2020; EDP Sciences: Les Ulis, France, 2020; Volume 211, p. 01004. [Google Scholar]
  21. McCormack, G.; Giles-Corti, B.; Bulsara, M. The relationship between destination proximity, destination mix and physical activity behaviors. Prev. Med. 2008, 46, 33–40. [Google Scholar] [CrossRef] [PubMed] [Green Version]
  22. Neckerman, K.; Lovasi, G.; Davies, S.; Purciel, M.; Quinn, J.; Feder, E. Disparities in urban neighborhood conditions: Evidence from GIS measures and field observation in New York City. J. Public Health Policy 2009, 30, 264–285. [Google Scholar] [CrossRef] [PubMed]
  23. Combs, T.S.; Pardo, C.F. Shifting streets COVID-19 mobility data: Findings from a global dataset and a research agenda for transport planning and policy. Transp. Res. Interdiscip. Perspect. 2021, 9, 100322. [Google Scholar] [CrossRef]
  24. Miles, R. Neighborhood Disorder, Perceived Safety, and Readiness to Encourage Use of Local Playgrounds. Am. J. Prev. Med. 2008, 34, 275–281. [Google Scholar] [CrossRef] [PubMed]
  25. Wilson-Doenges, G. An Exploration of Sense of Community and Fear of Crime in Gated Communities. Environ. Behav. 2000, 32, 597–611. [Google Scholar] [CrossRef]
  26. Sakip, S.R.M.; Johari, N.; Salleh, M.N.M. Sense of Community in Gated and Non-Gated Residential Neighborhoods. Procedia-Soc. Behav. Sci. 2012, 50, 818–826. [Google Scholar] [CrossRef] [Green Version]
  27. Fleming, C.M.; Manning, M.; Ambrey, C.L. Crime, greenspace and life satisfaction: An evaluation of the New Zealand experience. Landsc. Urban Plan. 2016, 149, 1–10. [Google Scholar] [CrossRef]
  28. Zhang, Y.; van den Berg, A.E.; van Dijk, T.; Weitkamp, G. Quality over Quantity: Contribution of Urban Green Space to Neighborhood Satisfaction. Int. J. Environ. Res. Public Health 2017, 14, 535. [Google Scholar] [CrossRef] [PubMed]
  29. Lee, S.M.; Conway, T.L.; Frank, L.D.; Saelens, B.E.; Cain, K.A.; Sallis, J.F. The Relation of Perceived and Objective En-vironment Attributes to Neighborhood Satisfaction. Environ. Behav. 2016, 49, 136–160. [Google Scholar] [CrossRef]
  30. Gul, Y.; Sultan, Z.; Jokhio, G.A. The association between the perception of crime and walking in gated and non-gated neighbourhoods of Asian developing countries. Heliyon 2018, 8, e00715. [Google Scholar] [CrossRef] [PubMed] [Green Version]
  31. Hadavi, S.; Kaplan, R.; Hunter, M.R. How does perception of nearby nature affect multiple aspects of neighbourhood satisfaction and use patterns? Lanscape Res. 2017, 43, 360–379. [Google Scholar] [CrossRef]
  32. Gul, Y.; Sultan, Z.; Moeinaddini, M.; Jokhio, G.A. The effects of socio-demographic factors on physical activity in gated and non-gated neighbourhoods in Karachi, Pakistan. Sport Soc. 2019, 22, 1225–1239. [Google Scholar] [CrossRef]
  33. Eom, S.B.; Ashill, N. The Determinants of Students’ Perceived Learning Outcomes and Satisfaction in University Online Education: An Update. Descision Sci. J. Innov. Educ. 2016, 14, 185–215. [Google Scholar] [CrossRef]
  34. Eom, S.E.; Wen, H.J.; Ashill, N. The Determinants of Students’ Perceived Learning Outcomes and Satisfaction in University Online Education: An Empirical Investigation. Decis. Sci. J. Innov. Educ. 2006, 4, 215–235. [Google Scholar] [CrossRef]
  35. Kuo, Y.-C.; Walker, A.E.; Belland, B.R.; Schroder, K.E.E. A Predictive Study of Student Satisfaction in Online Education Programs. Int. Rev. Res. Open Distrib. Learn. 2013, 14, 16–39. [Google Scholar] [CrossRef] [Green Version]
  36. Bolliger, D.U.; Wasilik, O. Factors influencing faculty satisfaction with online teaching and learning in higher education. Distance Educ. 2009, 30, 103–116. [Google Scholar] [CrossRef]
Figure 1. Neighborhood environment indicators [8].
Covid 02 00118 g001
Figure 2. The proposed CHAID model.
Covid 02 00118 g002
Table 1. Descriptive analysis of socio-demographics.
Socio-Demographics FrequencyPercentValid PercentCumulative Percent
GenderMale22352.252.252.2
Female20046.846.899.1
Other40.90.9100.0
CountryAfrica81.91.91.9
America194.44.46.3
Australia9823.023.029.3
Middle East429.89.839.1
Europe409.49.448.5
Southeast Asia10223.923.972.4
South Asia11827.627.6100.0
Study LevelUndergraduate16137.737.737.7
Postgraduate18743.843.881.5
PhD7116.616.698.1
Other81.91.9100.0
Major SubjectArchitecture11025.825.825.8
Engineering358.28.234.0
Environmental Sciences13531.631.665.6
Social Sciences307.07.072.6
Information Technology9021.121.193.7
Others276.36.3100.0
Table 2. Descriptive Analysis of Residences.
Residential Options FrequencyPercentValid PercentCumulative Percent
Residential TypeApt 1–3 floors6715.715.715.7
Apt 3–56615.515.531.1
Apt 6–12214.94.936.1
Apt 13+194.44.440.5
Detached/Villa13932.632.673.1
Townhouse10424.424.497.4
Other112.62.6100.0
No. of Occupants1194.44.44.4
2102.32.36.8
320.50.57.3
421049.249.256.4
56415.015.071.4
65412.612.684.1
6+6815.915.9100.0
Size of ResidenceOne bedroom5713.313.313.3
Two bedrooms13431.431.444.7
Three bedrooms13732.132.176.8
4+ Bed9923.223.2100.0
Table 3. Descriptive statistics of mode of transportation and travel time.
Transportation FrequencyPercentValid PercentCumulative Percent
Mode of transportationWalking6314.814.814.8
Cycling174.04.018.8
Personal vehicle12228.628.647.4
Public transport21951.351.498.8
Other51.21.2100.0
Travel TimeLess than 30 min.10324.125.825.8
30 min15837.039.665.4
1–2 h8920.822.387.7
2+ hours378.79.397.0
Other122.83.0100.0
Table 4. Future preference for mode of education.
Mode of Education in Future FrequencyPercentValid PercentCumulative Percent
Future preference for educationTraditional7517.617.817.8
Blended24657.658.476.2
Online10023.423.8100.0
Total427100.0100.0
Table 5. Nodes and importance.
Q. NQuestion Answer?Importance
Q-9During the recent COVID-19 lockdown, I mostly felt comfortable in my neighborhood0.2231
Q-14.2I can open my windows to enjoy the weather0.1893
Q-8.2I feel safe from traffic accidents while walking in my neighborhood because of plenty designated pedestrian walkways0.1507
Q-7.7Online-ordered food, home delivered, normally does not take more than half an hour in my neighborhood0.1361
Q-13How many people are there in your house? (occupancy)0.0949
The number of people in my residency is
Q-20.5Online teaching was effective as a method of time-saving0.0704
Q-18What mode of transportation do you usually use?0.0605
The transport mode I usually use is
Q-14.5I have plants/garden at my residence0.0460
Q-14.4I have a balcony/terrace to enjoy at my residence0.0257
Q-20.10Overall, receiving online classes during the lockdown period was a good experience0.0019
Q21.3Distance learning method has potential for my work/assignment to be examined online by many experts in my field0.0014
Q3Study level8.39 × 10−10
Publisher’s Note: MDPI stays neutral with regard to jurisdictional claims in published maps and institutional affiliations.

