Article

Formulation of Pharmaceutical Tablets Containing β-Cyclodextrin-4-Methyl-Umbelliferone (Hymecromone) Inclusion Complexes and Study of the Dissolution Kinetics

by
Eleni Kavetsou
1,*,
Ioanna Pitterou
1,
Nikos G. Dimitrioglou
2,
Stefanos Kikionis
3,
Eftichia Kritsi
4,5,
Panagiotis Zoumpoulakis
4,5,
Eleni Pontiki
6,
Dimitra Hadjipavlou-Litina
6,
Dimitris T. Hatziavramidis
2 and
Anastasia Detsi
1,*
1
Laboratory of Organic Chemistry, School of Chemical Engineering, National Technical University of Athens, Heroon Polytechniou 9, Zografou Campus, GR-15780 Athens, Greece
2
Laboratory of Organic Chemical Technology, School of Chemical Engineering, National Technical University of Athens, Heroon Polytechniou 9, Zografou Campus, GR-15772 Athens, Greece
3
Section of Pharmacognosy and Chemistry of Natural Products, Department of Pharmacy, School of Health Sciences, National and Kapodistrian University of Athens, Panepistimiopolis Zografou, GR-15771 Athens, Greece
4
Laboratory of Chemistry, Analysis & Design of Food Processes, Department of Food Science and Technology, University of West Attica, GR-12243 Egaleo, Greece
5
Institute of Chemical Biology, National Hellenic Research Foundation, Vassileos Constantinou Ave. 48, GR-11635 Athens, Greece
6
Laboratory of Pharmaceutical Chemistry, School of Pharmacy, Faculty of Health Sciences, Aristotle University of Thessaloniki, GR-54124 Thessaloniki, Greece
*
Authors to whom correspondence should be addressed.
Micro 2023, 3(4), 892-911; https://doi.org/10.3390/micro3040061
Submission received: 26 September 2023 / Revised: 6 November 2023 / Accepted: 8 November 2023 / Published: 22 November 2023
(This article belongs to the Section Microscale Biology and Medicines)

Abstract

:
The present study focuses on the synthesis of the natural product 4-methyl-umbelliferone (4-MU, hymecromone), the preparation, characterization, and biological activity evaluation of 4-MU inclusion complexes with β-cyclodextrin (β-CD), as well as their incorporation into pharmaceutical tablets. The inclusion complexes (ICs) were characterized using DLS, SEM, TGA as well as FT-IR, UV-vis, and NMR spectroscopies. The release profile of 4-MU from the β-CD-4-MU ICs was studied in three different pH: 1.2 (aqueous hydrochloric acid), 7.4, and 6.8 (phosphate-buffered solutions), to simulate the stomach, physiological, and intestine pH, respectively. The ICs were incorporated in pharmaceutical tablets which were prepared by direct compression and were characterized for their mechanical properties. The optimal composition of 4-MU as the active pharmaceutical ingredient (API) and excipients was determined using design of experiment (DoE), and the dissolution studies were performed at pH 1.2 at 37 ± 0.5 °C. The sustained release profile of the pharmaceutical tablets showed a delayed burst release effect at 20 min (20% drug release) compared to that of the ICs at the same time interval (70%). The results indicated that the kinetic model describing the release profile of 4-MU from the ICs and tablets is the Higuchi model, while the release mechanism is swelling and diffusion, as was indicated by the Korsmeyer–Peppas kinetic model. The optimization analysis revealed that the optimum composition contains x1 = 150.95 mg of β-CD-4-MU ICs, x2 = 82.65 mg of microcrystalline cellulose, and x3 = 12.40 mg of calcium phosphate.

1. Introduction

Many low-dose drugs are delivered as oral solid dosage forms, as they present advantages such as the easier administration of the drug, the improvement of dosing accuracy, and higher compliance [1,2]. Oral medicinal products in tablet form are powder blends of active pharmaceutical ingredients (APIs) and excipients which facilitate processing and improve the quality of the final tablet.
Pursuing new active pharmaceutical ingredients (APIs) with better efficacy, and higher specificity and patient compliance, natural products have gained interest as new candidate drugs. Coumarins, which belong to the benzopyrone family, are widely distributed in the plant kingdom and present a wide variety of biological activities. The naturally occurring coumarin 4-methyl-umbelliferone (4-MU, hymecromone) is a 7-hydroxy coumarin analogue (Figure 1), obtained from plants of the genus Apiaceae. 4-MU shows cytotoxic activity against different cell lines [3,4], anti-inflammatory activity [3], as well as antibacterial [5] and antifungal activity [6]. However, the low aqueous solubility of 4-MU could constitute a hurdle in its manipulation and administration [7].
Encapsulation is a common technique that is used to protect the encapsulated compounds from adverse environments, and to modify the physicochemical properties of different hydrophobic molecules such as their aqueous solubility and biological profile. Thus, the encapsulation process increases the bioavailability and stability of the ingredients, simultaneously offering sustained and controlled drug release [8].
Cyclodextrins (CDs) are cyclic and water-soluble oligosaccharides which have been extensively studied as supramolecular hosts for molecules of pharmaceutical interest, and are included in the US Food and Drug Administration (FDA) “generally recognized as safe (GRAS)” list. Among natural cyclodextrins, α-, β-, and γ-cyclodextrin, are the most popular, which differ from each other in the number of glucose units contained in their molecule (six, seven, and eight glucose units, respectively). Due to their hollow truncated cone structure, consisting of a hydrophilic external surface and a hydrophobic internal cavity, CDs present the ability to form water soluble inclusion complexes with a wide range of solid, liquid, and gaseous hydrophobic compounds [9,10,11,12].
Moreover, cyclodextrins have been used as pharmaceutical excipients, mainly as complexing agents to increase the aqueous solubility of poorly soluble compounds and to improve their chemical and physical stability, therefore increasing their dissolution and bioavailability [13]. In addition, cyclodextrins have been used as conventional penetration enhancers as well as binder excipients [14], while they are suitable for parenteral administration [15]. a-cyclodextrin has been successfully used for the development of a supramolecular structure with the natural coumarin umbelliferone (7-hydroxy-coumarin) through the co-precipitation method. In the same research, docking studies revealed that umbelliferone was not completely inserted into the α-CD cavity in all poses because of its small cavity size [9]. In the research studies of M. Novac et al. [16] and F. Maestrelli et al. [17], β-CD and various β-CD’s derivatives (2-hydroxypropyl-β-cyclodextrin, (HP-β-CD), randomly methylated-β-CD (RAMEB), and sulfobutylether-β-CD (SBE-β-CD)), in the form of inclusion complexes with APIs such as nimodipine (calcium channel blocker [16]) and flufenamic acid (non-steroidal anti-inflammatory agent [17]), have been incorporated in pharmaceutical tablets via direct compression. The complexation of flufenamic acid with RAMEB remarkably improved its dissolution rate, being a useful tool for the effective oral administration of the drug. Inclusion complexes of various active pharmaceutical ingredients and β-cyclodextrin or HP-β-CD have already been incorporated into tablet forms in commercial pharmaceutical products such as GEODON® (Pfizer, New York, NY, USA), Nicorette Microtab® (McNeil Products Ltd., Maidenhead, UK), and Omebeta® (Betapharma, Augsburg, Germany [18]).
In the present work, as a continuation to our previous studies concerning the biological activity evaluation of different natural products and their encapsulation in various biodegradable matrices [8,10,11,12], a comprehensive study of the potential of the use of the natural coumarin 4-MU as an active ingredient in pharmaceutical tablets is presented for the first time. In particular, our research study focuses on the synthesis of the natural product 4-MU, the preparation, characterization, and biological activity evaluation of β-CD-4-MU inclusion complexes, as well as their incorporation into pharmaceutical tablets, in which the β-cyclodextrin of the inclusion complexes also serves as an excipient. The optimal composition of 4-MU as the active pharmaceutical ingredient (API) and excipients was determined using design of experiment (DoE), and the dissolution studies were performed in vitro.

2. Materials and Methods

2.1. Materials

The chemicals used for the synthesis and analysis of 4-MU were purchased from Sigma-Aldrich and used without further purification. The melting point was determined on a Gallenkamp MFB-595 melting point apparatus and was uncorrected. β-Cyclodextrin (β-CD) of >99% purity and hydrochloric acid 37% ACS grade were purchased from Fluka (Gillingham, England), while ethanol of analytical reagent grade, and K2HPO4 and KH2PO4 of ACS grade were purchased from Merck Millipore (Billerica, MA, USA). Soybean lipoxygenase, sodium linoleate, and 2,2-azobis-(2-amidinopropane) dihydrochloride (AAPH) were obtained from Sigma Chemical, Co. (St. Louis, MO, USA). For the in vitro tests, UV–VIS spectra were obtained on a Perkin-Elmer 554 double-beam spectrophotometer (Perkin-Elmer Corporation Ltd., Lane Beaconsfield, Bucks, UK). The materials and the excipients were used without further purification. For the preparation of solutions and dispersions, ultra-pure water was used.

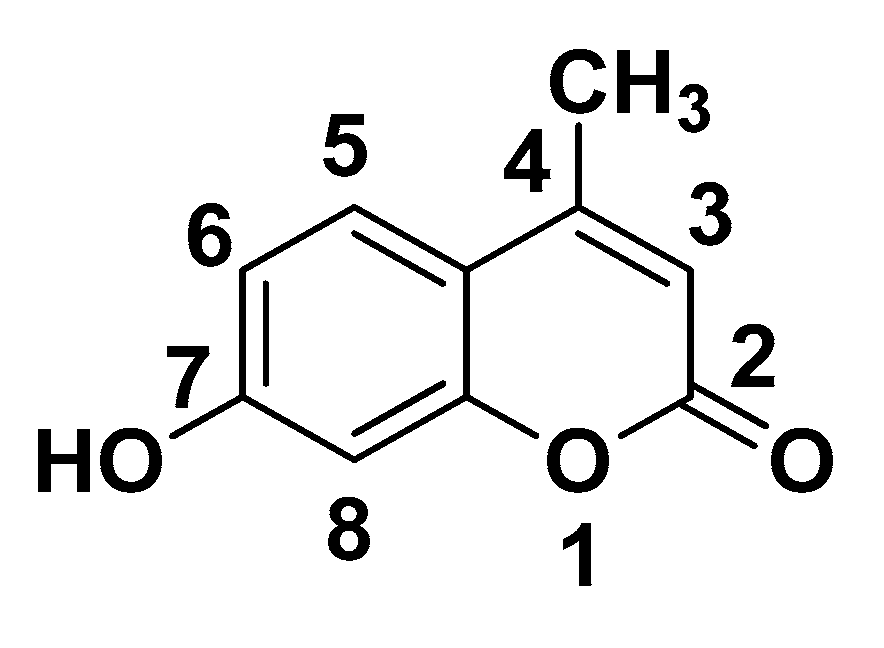
Synthesis of 4-Methyl-Umbelliferone (4-MU)

4-methyl-umbelliferone was synthesized via Pechmann condensation between resorcinol and ethylacetoacetate in the presence of concentrated H2SO4. The desired compound was prepared following the method of Kiskhan and Yagci [19] and according to our previous published work [3]. Yield: 65%; m.p.:186–187 °C; 1H NMR (300 MHz, DMSO-d6): δ (ppm) 10.47 (s, 1H, 7-OH), 7.56 (d, J = 8.7 Hz, 1H, H-5), 6.77 (dd, J6,8 = 1.8 Hz, J6,5 = 8.4 Hz, 1H, H-6), 6.68 (d, J8,6 = 1.8 Hz, 1H, H-8), 6.10 (s, 1H, H-3), 2.36 (s, 3H, 4-CH3).

2.2. Preparation of β-CD—4-Methyl-Umbelliferone Inclusion Complexes (β-CD-4-MU ICs)

The inclusion complexes of β-CD-4-MU were prepared using the co-precipitation method [10]. Briefly, in a conical flask, a suitable amount (500 mg or 4 g) of β-CD and a quantity of ethanol-ultrapure water solution (1:2 v/v) were added so that a concentration of 100 mg β-CD per 1 mL of total solution volume was achieved. The system was magnetically stirred at 55 ± 0.5 °C until the complete dissolution of β-cyclodextrin. Subsequently, the appropriate amount of 4-MU (1:1 or 2:1 molar proportion) was dissolved and added dropwise to the solution where emulsion formation was observed. After 24 h of stirring, the emulsion was cooled at 4 °C for 24 h. Thereafter, the precipitated inclusion complexes were collected by vacuum filtration and were then dried in vacuo in the presence of phosphorus pentoxide (P2O5). The final dried complexes were collected as white powder and stored in the refrigerator for further characterization. The process yield (%PY) was calculated using Equation (1).
( % PY ) = 100 × m a s s   o f   t h e   p r e p a r e d   i n c l u s i o n   c o m p l e x   ( m g ) i n i t i a l   m a s s   o f   β C D + i n i t i a l   m a s s   o f   4 M U   t o   b e   e n c a p s u l a t e d   ( m g )

2.3. Characterization of the β-CD—4-Methyl-Umbelliferone ICs

2.3.1. Inclusion Efficiency of the β-CD—4-Methyl-Umbelliferone ICs

The amount of the encapsulated 4-methyl-umbelliferone in β-CD was determined via ultraviolet-visible spectroscopy (UV-VIS), using the UV-VIS/NIR Jasco V-770 double-beam instrument (Japan Spectroscopic Company, Tokyo, Japan).
For the analysis, 10 mg of the dried inclusion complexes and 10 mL of ethanol were added to a glass vial and left under magnetic stirring for about 48 h. Thereafter, the mixture was filtered through a 0.2 μm/25 mm PVDF syringe filter, and with the appropriate dilution, the absorbance at λmax (323 nm) of 4-MU was determined. Thereafter, the amount of the encapsulated 4-MU in the complexes was determined using the calibration curve.
The %Inclusion Efficiency (%IE) of the encapsulation process was calculated as the ratio of the encapsulated 4-methyl-umbelliferone to the initial amount of 4-MU used, using Equation (2).
( % IE ) = 100 × m a s s   o f   t h e   e n c a p s u l a t e d   4 M U   ( m g ) i n i t i a l   m a s s   o f   4 M U   t o   b e   e n c a p s u l a t e d   ( m g )

2.3.2. Dynamic Light Scattering (DLS)

The size, polydispersity index (PdI), and zeta-potential (ζ-potential) were determined via the dynamic light scattering (DLS) method, using the Zeta sizer Nano ZS instrument (Malvern Instruments, Malvern, UK). The samples for the DLS measurements were prepared by dispersing 1 mg of ICs in 20 mL of ultrapure water. For the measurements of size, PdI and ζ-potential folded capillary cells DTS1070 were used, while for each sample, the measurements were carried out at 25 ± 1 °C and in triplicate. The results were reported as mean ± standard deviation (SD).

2.3.3. Nuclear Magnetic Resonance Spectroscopy (NMR Spectroscopy)

The 1H 1D and 2D NMR spectra of β-CD and β-CD-4-MU ICs were recorded on a Varian 600 MHz spectrometer. All samples were prepared using deuterium oxide (D2O). The NMR spectra were recorded either on a Varian 300 MHz or on a Varian 600 MHz spectrometer.
For β-CD–4-MU ICs, 2D ROESY (rotating-frame Overhauser effect spectroscopy) experiment data were acquired in D2O on the Varian 600-MHz spectrometer equipped with a triple resonance probe at 298 K. The 2D ROESY spectra were recorded using a spectral width of 9615.4 Hz, with 19,615 complex points in f2. The pulse width was set equal to 13.5, and the number of increments was 256. The relaxation delay was set equal to 2 s and the number of scans was equal to 94. A mixing time (tm) of 300 ms was applied, and the acquisition time set was equal to 2.04 s. The data processing and spectral analysis were performed using MestReNova software (version 6.2.0, Mestrelab Research S.L., Santiago de Compostela, Spain).

2.3.4. FT-IR Spectroscopy

The inclusion complex β-CD–4-MU, β-CD, and free 4-MU were structurally characterized via FT-IR spectroscopy using KBr pellets. The spectra were recorded on the JASCO FT-IR-4200 instrument (Japan Spectroscopic Company, Tokyo, Japan) in the range of 400–4000 cm−1.

2.3.5. Thermogravimetric Analysis (TGA)

Thermogravimetric (TG) analyses were also conducted in the final dried β-CD–4-MU ICs, β-CD, and 4-MU, and were performed in the TGA/DSC 1 STARe System Thermobalance (Mettler Toledo, Columbus, OH, USA). The samples were heated from 25 °C to 600 °C, at a heating rate of 10 °C/min under nitrogen gas flow (10 mL/min).

2.3.6. Scanning Electron Microscopy (SEM)

A PhenomWorld desktop scanning electron microscope (Thermo Fischer Scientific, Waltham, MA, USA), with a tungsten filament (10 kV) and charge reduction sample holder, was used for the SEM analysis of the final dried β-CD–4-MU inclusion complex. The sample was examined without sputter coating.

2.4. Biological Activity Evaluation of the β-CD—4-Methyl-Umbelliferone ICs

The antioxidant activity of the β-CD-4-MU inclusion complexes was expressed through their free radical scavenging capacity and their ability to inhibit lipid peroxidation (AAPH assay), while their ability to inhibit soybean lipoxygenase was evaluated as an indication of their anti-inflammatory activity. The in vitro assays were performed at a concentration of 100 µM. (Stock solutions of the β-CD-4-MU inclusion complex and of the pure compounds were prepared. The stock solution of the β-CD-4-MU inclusion complex contained 10 mM of the 4-methyl-umbelliferone in DMSO). The stock solution was used, in different dilutions, for the determination of IC50 values, at least in triplicate, and the standard deviation of absorbance was less than 10% of the mean. The compounds were diluted in 0.1% DMSO under sonication in an appropriate buffer in several dilutions. The experiments were performed in triplicate (two sample measurements). Statistical comparisons were made using Student’s t-test. A statistically significant difference was defined as p < 0.05.

2.4.1. Determination of Reducing Activity Using the Stable Radical 1,1-Diphenyl-Picrylhydrazyl (DPPH)

To a solution of DPPH (final concentration 0.05 mM) in absolute ethanol, an equal volume of the sample’s stock solution (10 mM in DMSO) dissolved in ethanol was added. Absolute ethanol was used as a control. The concentrations of the solutions of the tested samples were 100 µM. The absorbance was recorded at 517 nm at room temperature after 20 and 60 min [20].

2.4.2. Inhibition of Linoleic Acid Peroxidation

The in vitro study was evaluated as reported previously by our group [20]. Ten microliters of the 16 mM sodium linoleate solution were added to the UV cuvette containing 0.93 mL of a 0.05 M phosphate buffer, pH 7.4, prethermostated at 37 °C. The oxidation reaction was initiated at 37 °C under air with the addition of 50 µL of a 40 mM AAPH solution, which was used as a free radical initiator. Oxidation was carried out in the presence of tested samples (10 µL) in the assay without antioxidants, and recorded at 234 nm. Lipid oxidation was measured in the presence of the same level of DMSO as a negative control. Trolox was used as the appropriate standard (positive control).

2.4.3. Soybean Lipoxygenase Inhibition Study

The in vitro study was evaluated as reported previously by our group [20]. The tested samples were incubated at room temperature with sodium linoleate (0.1 mM) and 0.2 mL of enzyme solution (1.9 × 10⁻⁴ w/v in saline). The method was based on the conversion of sodium linoleate to 13-hydroperoxylinoleic acid at 234 nm. Nor-dihydroguaeretic acid NDGA (IC50 0.45 mM) was used as a standard (positive control). In order to determine the IC50 values, different concentrations were used. A blank determination was used first to serve as a negative control.

2.5. In Vitro Release Studies of the β-CD—4-Methyl-Umbelliferone ICs

The release profile of 4-MU from the β-CD-4-MU ICs was studied in three different pH: 1.2 (aqueous hydrochloric acid), 7.4, and 6.8 (phosphate-buffered solutions), to simulate the stomach, physiological, and intestine pH, respectively. The study was performed on a PHARMATEST-DT 70 dissolution tester, introducing in each vessel 150 mg β-CD-4-MU ICs and 300 mL of the three different solution media. The temperature was maintained at 37 ± 0.5 °C, and paddle rotation was set at 50 rpm. At preset time intervals (twenty minutes), 7 mL of each vessel was taken automatically and was then analyzed via UV-vis. The obtained release profile data were further analyzed by mathematical studies according to the zero order, first order, Higuchi, and Korsmeyer–Peppas models.
The zero-order model equation is described as
Q t = Q 0 + K 0 t
where Qt is the amount of the compound dissolved in time t, Q0 is the initial amount of the compound in the solution (Q0 = 0), and K0 is the zero-order release constant expressed in units of concentration/time.
The first-order model is described by the following equation (Equation (4)):
l o g C = l o g C 0 + K t 2.303
where C0 is the initial concentration of the compound, k is the first order rate constant, and t is the time.
The Higuchi model equation (Equation (5)) is
Q = M t / M = A D ( 2 C C s ) C s t
where Q is the amount of the compound released in time t per unit area A, C is the compound’s initial concentration, Cs is the compound’s solubility in the matrix medium, and D is the diffusion coefficient of the compound.
The Korsmeyer–Peppas model (Equation (6)) has been successfully used to describe the compound release kinetics from ICs.
M t M = K ˖ t n
In this equation, Mt/M represents the fractional permeated compound, t is the time, K is the transport constant (dimension of time−1), and n is the transport exponent. The release constant K mostly provides information on the formulation, such as the shape and the internal structure of the matrix as well as the compound’s concentration and solubility, whereas n is important since it is related to the compound release mechanism. If the n value is 0.5, the release mechanism follows Fickian diffusion according to Higuchi’s model drug release. If the n value is 1, the model is non-Fickian (Case II), the drug release rate corresponds to zero-order release kinetics, and the mechanism driving the drug release is swelling. When the n values are between 0.5 and 1.0, the model is non-Fickian or anomalous transport, and the mechanism of drug release is governed by diffusion and swelling. The mathematical modeling of drug release aims to predict drug release rates and drug diffusion behavior from drug delivery systems. This information aids in the optimization of the release kinetics and the prediction of the physical mechanisms involved in drug transport, which is facilitated by comparing experimental data with mathematical models [21,22,23].

2.6. Preliminary Tests

Preliminary tests were conducted in order to select the pharmaceutical excipients to be used and their composition (Table 1), based on the hardness and the friability strength according to USP guidelines [24] and thereafter to assess the ranges for the tablet formulation. The tablet hardness was measured using an ERWEKA TBH 125, while the friability of the tablets was calculated as the percentage of weight loss in an ERWEKA TAR friability tester.
The hardness tests of the TT1-TT10 tablets indicated that tablet sTT8 (156 N) and TT10 (149 N), which have the same composition but differ in their percentage of inclusion compound, are within the acceptable ranges. It is interesting to note the distinct difference of 50 N between the hardness of TT8 and TT9, which both contain microcrystalline cellulose (Avicel 102) as a binder; however, TT8 contains β-CD-4-MU-IC whereas TT9 contains β-CD and 4-MU as the physical mixture and not as an inclusion complex. It is evident that the inclusion of 4-MU in β-CD is an important feature that significantly affects the hardness of the tablet. It is quite remarkable that the above tablets contained microcrystalline cellulose (MCC) as a binder (Avicel 102). The tablets prepared with Lactose as a binder (TT1-TT4) showed a significantly lower hardness value, especially those which contained the lowest percentages of microcrystalline cellulose (TT1: 12%, TT2: 23%), indicating a significant correlation between the percentage of microcrystalline cellulose and the mechanical strength of the tablets. The importance of microcrystalline cellulose in the mechanical strength of tablets has been also reported by other research teams [25,26]. Table 2 shows the selected pharmaceutical excipients and their ranges, which were used to perform the mixture DoE.

2.7. Preparation of Pharmaceutical Tablets

An extreme vertices mixture design (EVMD) experiment was conducted for the tablet formulation with 3 main components (x1, x2, and x3): the inclusion complex β-CD-4-MU (x1), containing the API (4-MU) while the β-CD in the complex constitutes one of the excipients, and two other excipients, namely, microcrystalline cellulose (MCC) (x2) and calcium phosphate (CaP) (x3). Microcrystalline cellulose (MCC) was used as a dry binder, while calcium phosphate (CaP) was used as a diluent. Moreover, magnesium stearate (Mg-St) and starch (St), which served as a lubricant and as a disintegrant, respectively, were used in a small percentage (2%). EVMD was selected with one degree of freedom, augmented at the center and axial points, and replicated at the center point. Minitab®18 software (trial version) was used to aid the design and 10 formulations were generated (Table 3).
The response variable for the design was the dissolution rate. The mass fraction of the ingredients sum to unity in a mixture of 250 mg. The drug and excipients were weighted and mixed in a vortex for 10 min. The final blend was directly compressed using a tableting machine (MINIPRESS MII; RIVA S.A.).

2.8. Dissolution Testing

In the present work, tablet dissolution testing, a crucial test during the development and the manufacturing of pharmaceutical tablets, was performed using the PHARMATEST-DT 70 apparatus. The pH of dissolution medium was 1.2 using 0.1 N hydrochloric acid solution, which simulates the stomach environment. The dissolution testing of the tablets (n = 10) was measured at a paddle speed of 50 rpm, in 300 mL of the dissolution medium at 37 ± 0.5 °C. At predetermined time intervals (20 min), 7 mL of each vessel was withdrawn and filtered. The samples withdrawn from the dissolution medium were thereafter analyzed using UV-vis spectroscopy, and the amount of the released 4-MU was calculated. The concentration of each sample was spectrophotometrically determined at 323 nm (V-770 UV-VIS; Jasco). All measurements were conducted in triplicate. The obtained release profile data were further analyzed by mathematical studies according to the zero-order, first-order, second-order, Higuchi, and Korsmeyer–Peppas models.

3. Results and Discussion

3.1. Characterization of the β-CD-4-MU ICs

3.1.1. Inclusion Efficiency, Process Yield, Size, Size Distribution, and Zeta-Potential

In the current study, the inclusion complexes of β-CD-4-MU were prepared using the co-precipitation method. The optimum conditions to obtain the encapsulated 4-MU in β-CD ICs were a molar ratio of 1:1 and 24 h of complexation time. Based on these results, a scale-up process (using 4 gr of β-CD) was achieved presenting satisfactory process yield (82%) and 77% inclusion efficiency (Table 4). As can also be observed in Table 4, the mean particle size of the formed β-CD-4-MU ICs was 271.0 ± 20.5 nm, while their PdI value was 0.367 ± 0.065, indicating quite uniform size dispersion. The zeta-potential presented a high negative value of −29.1 ± 0.9 mV, indicating quite stable dispersion with low tendency to aggregate.

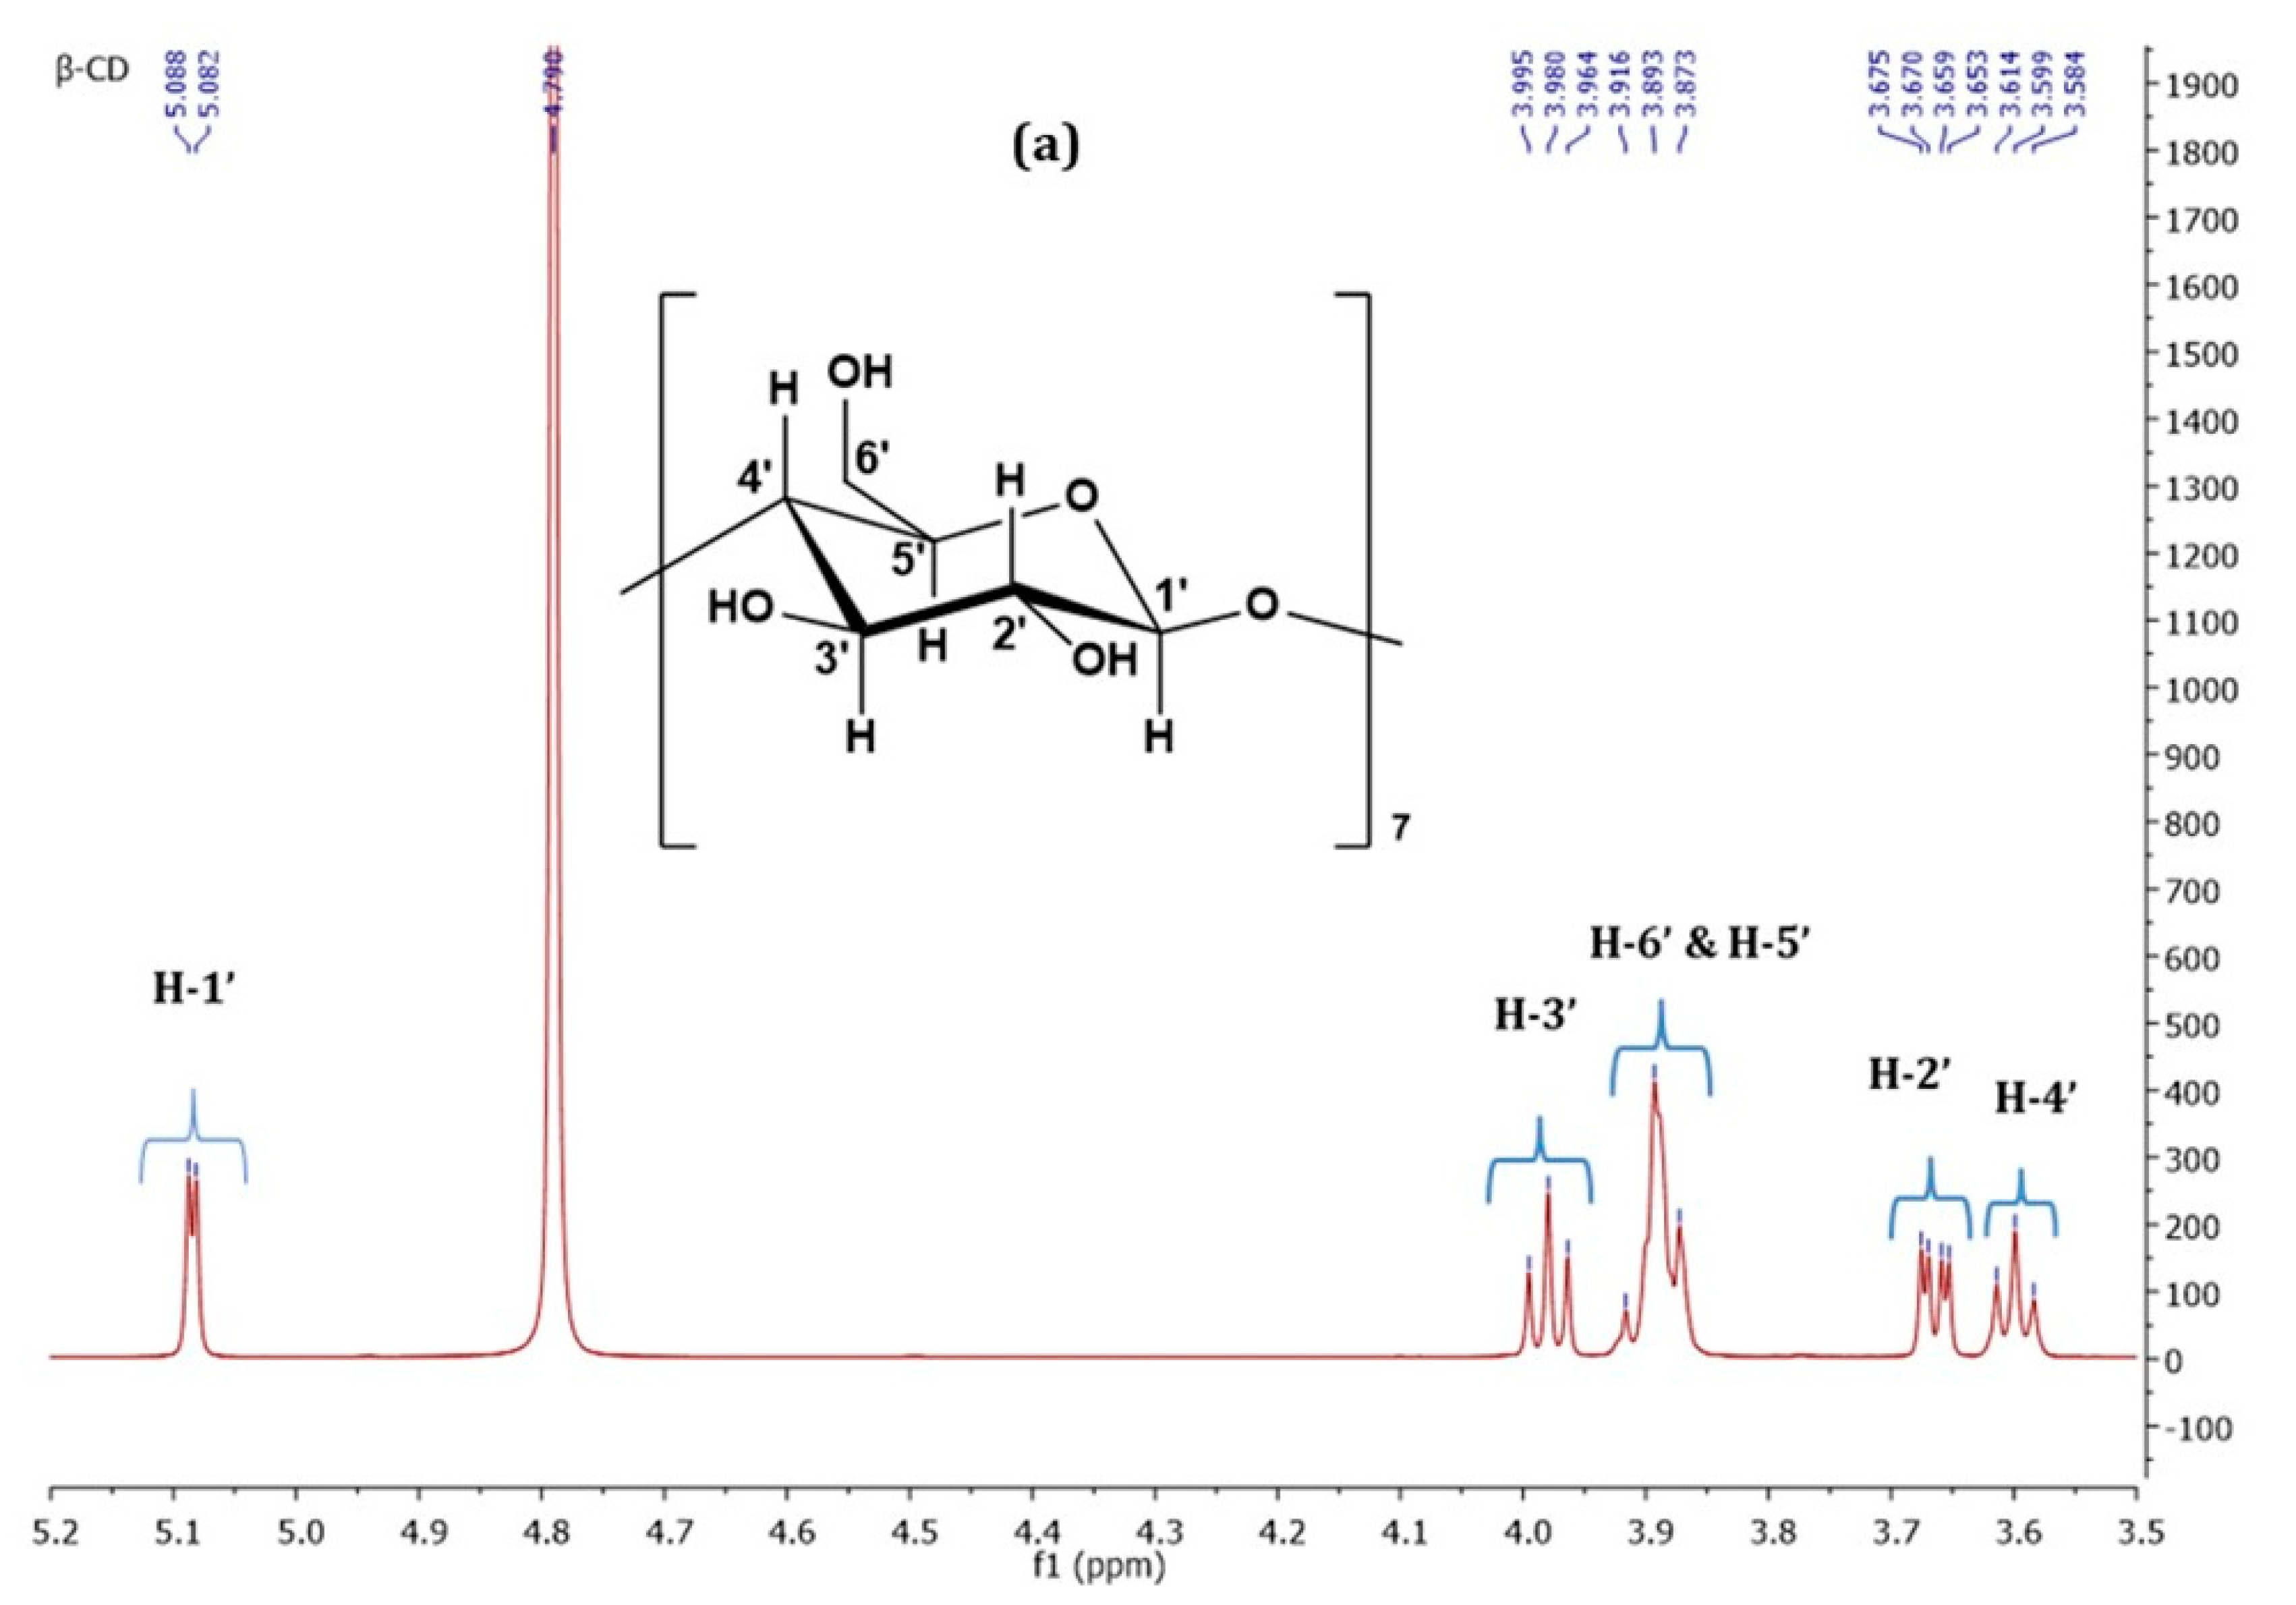
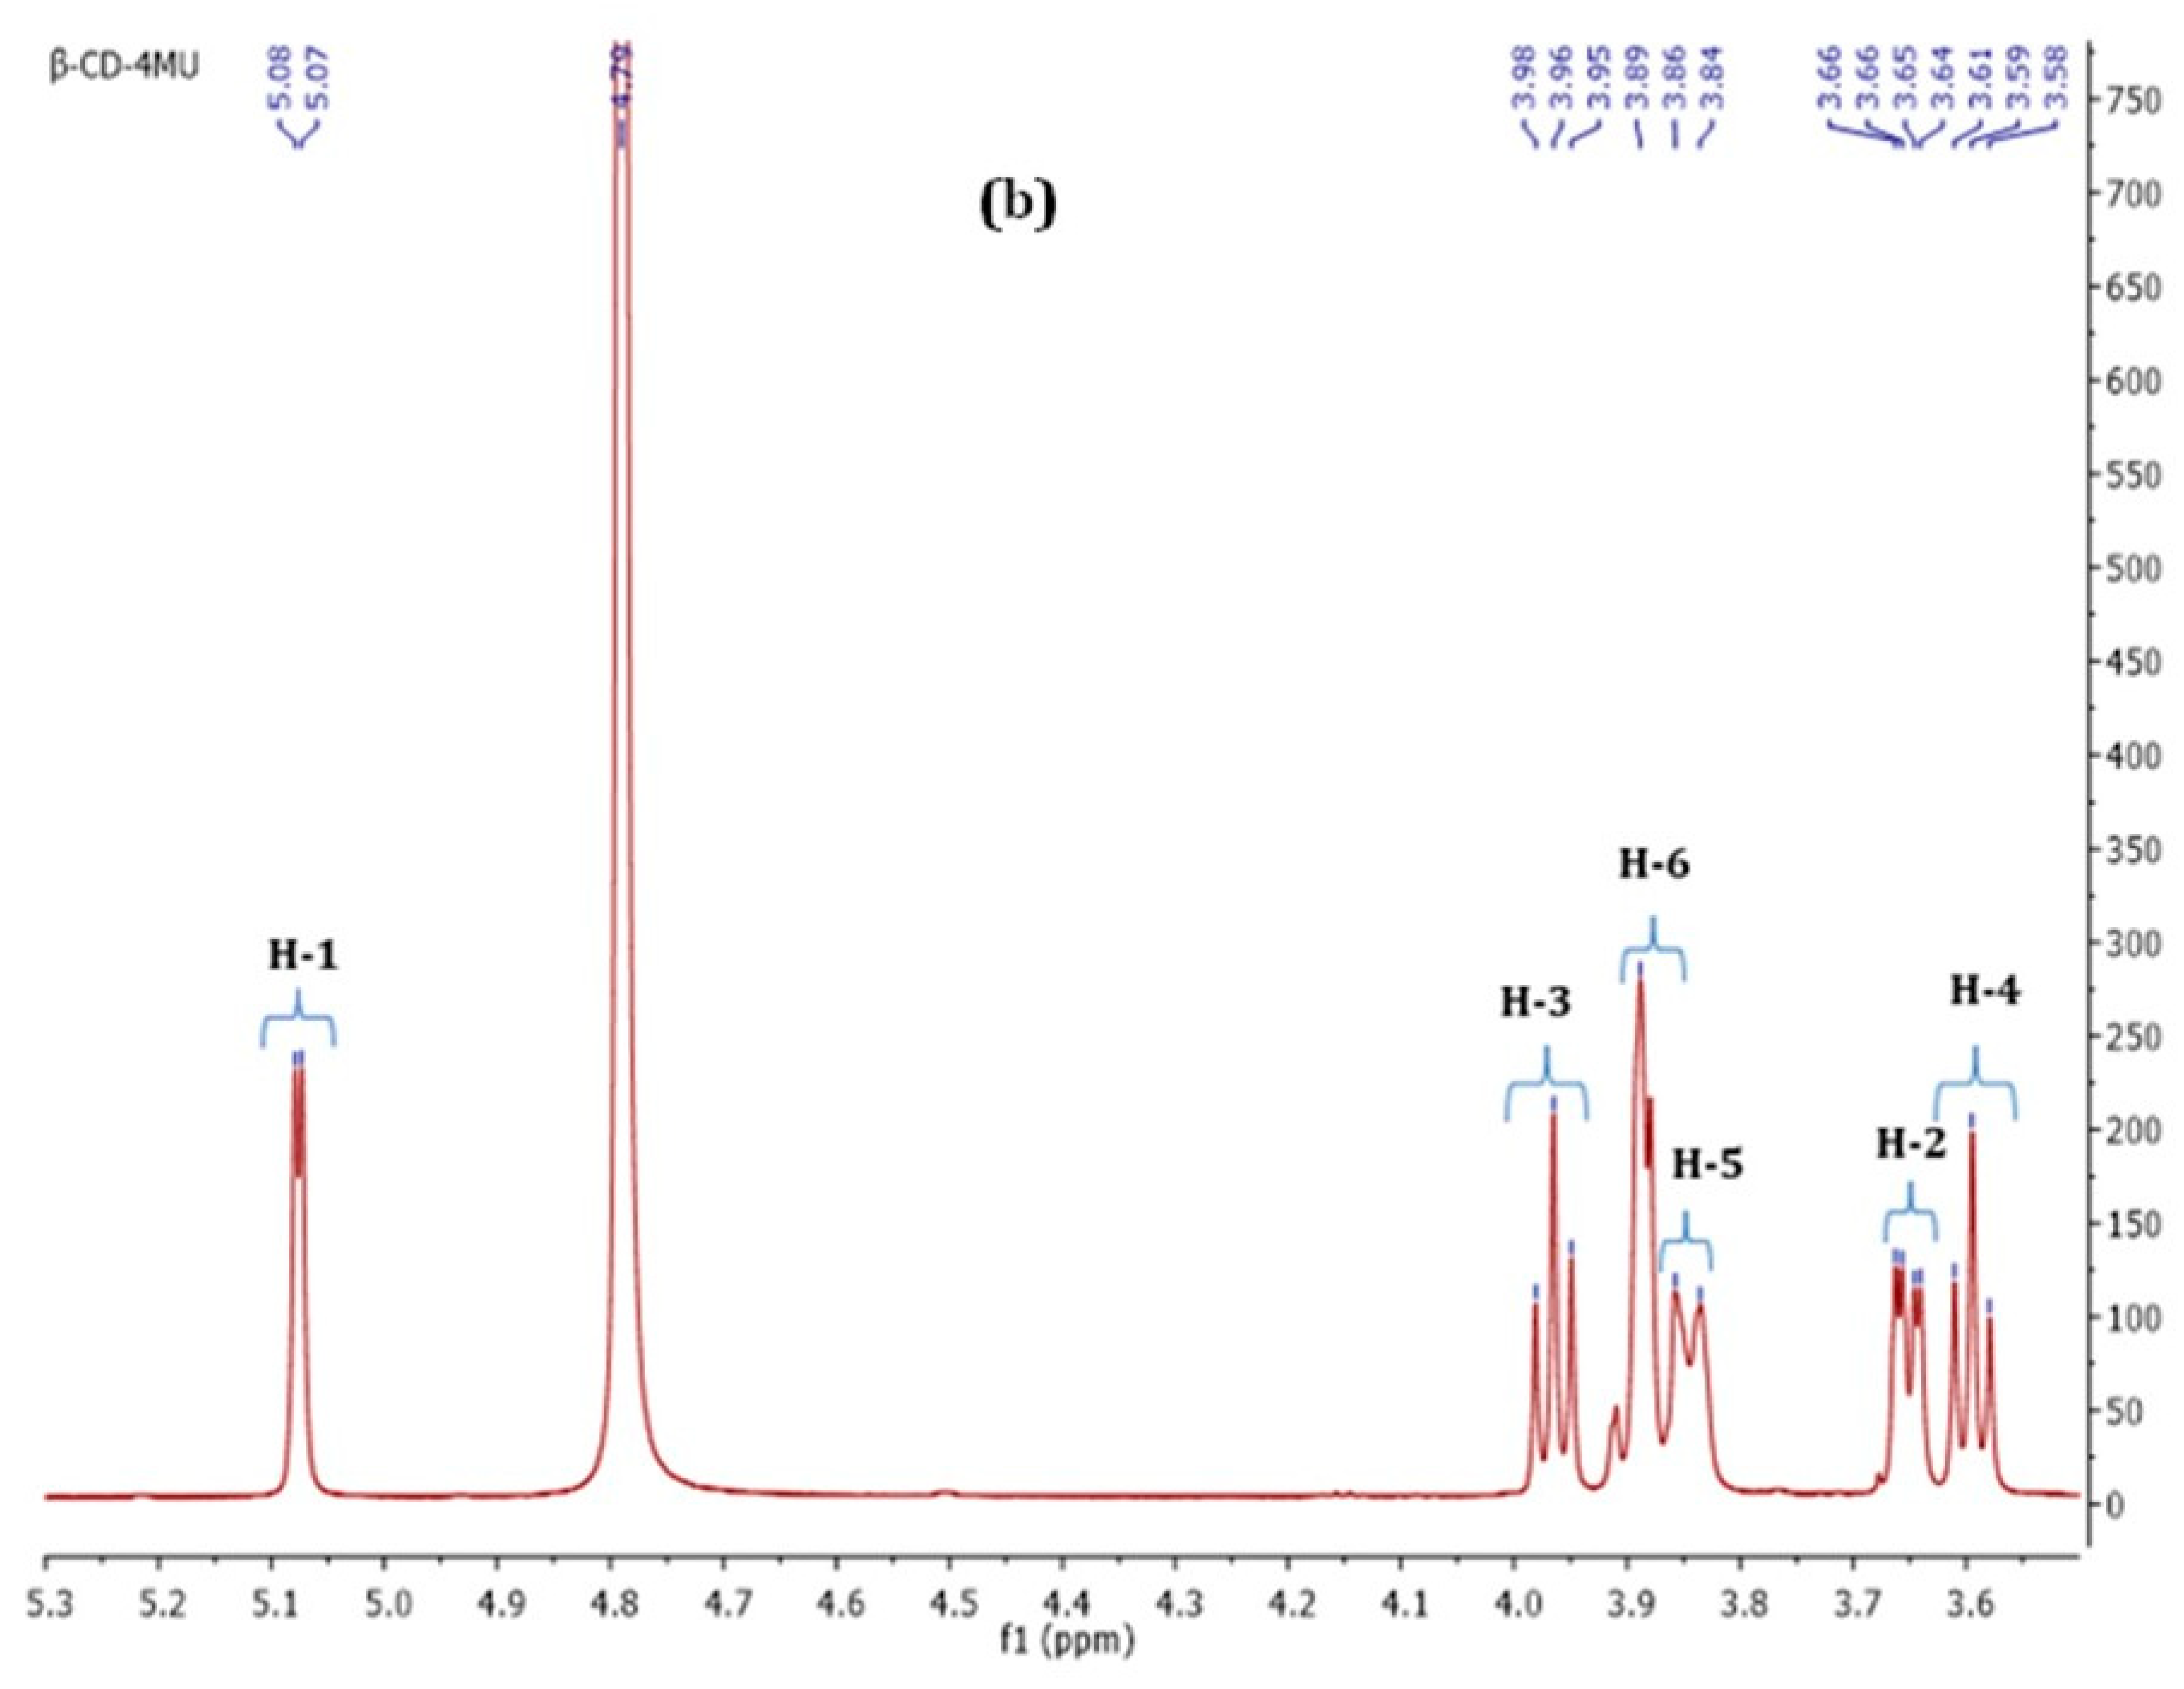
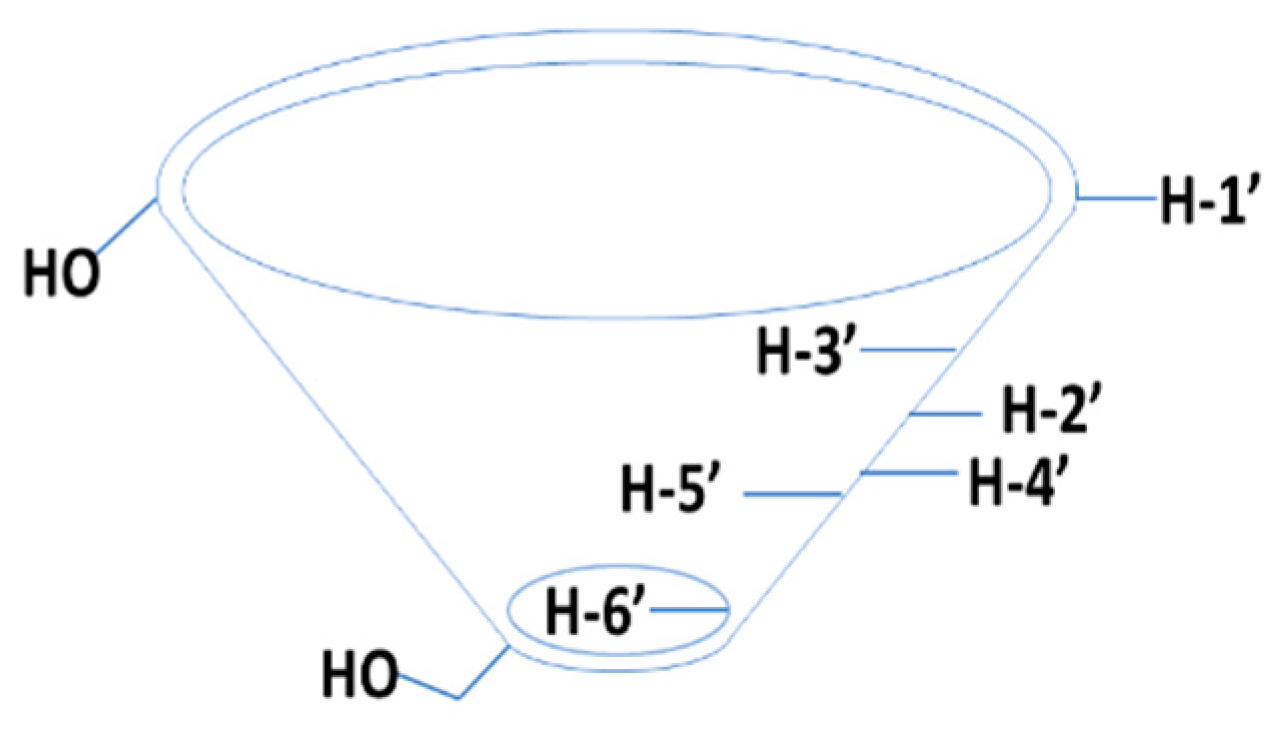
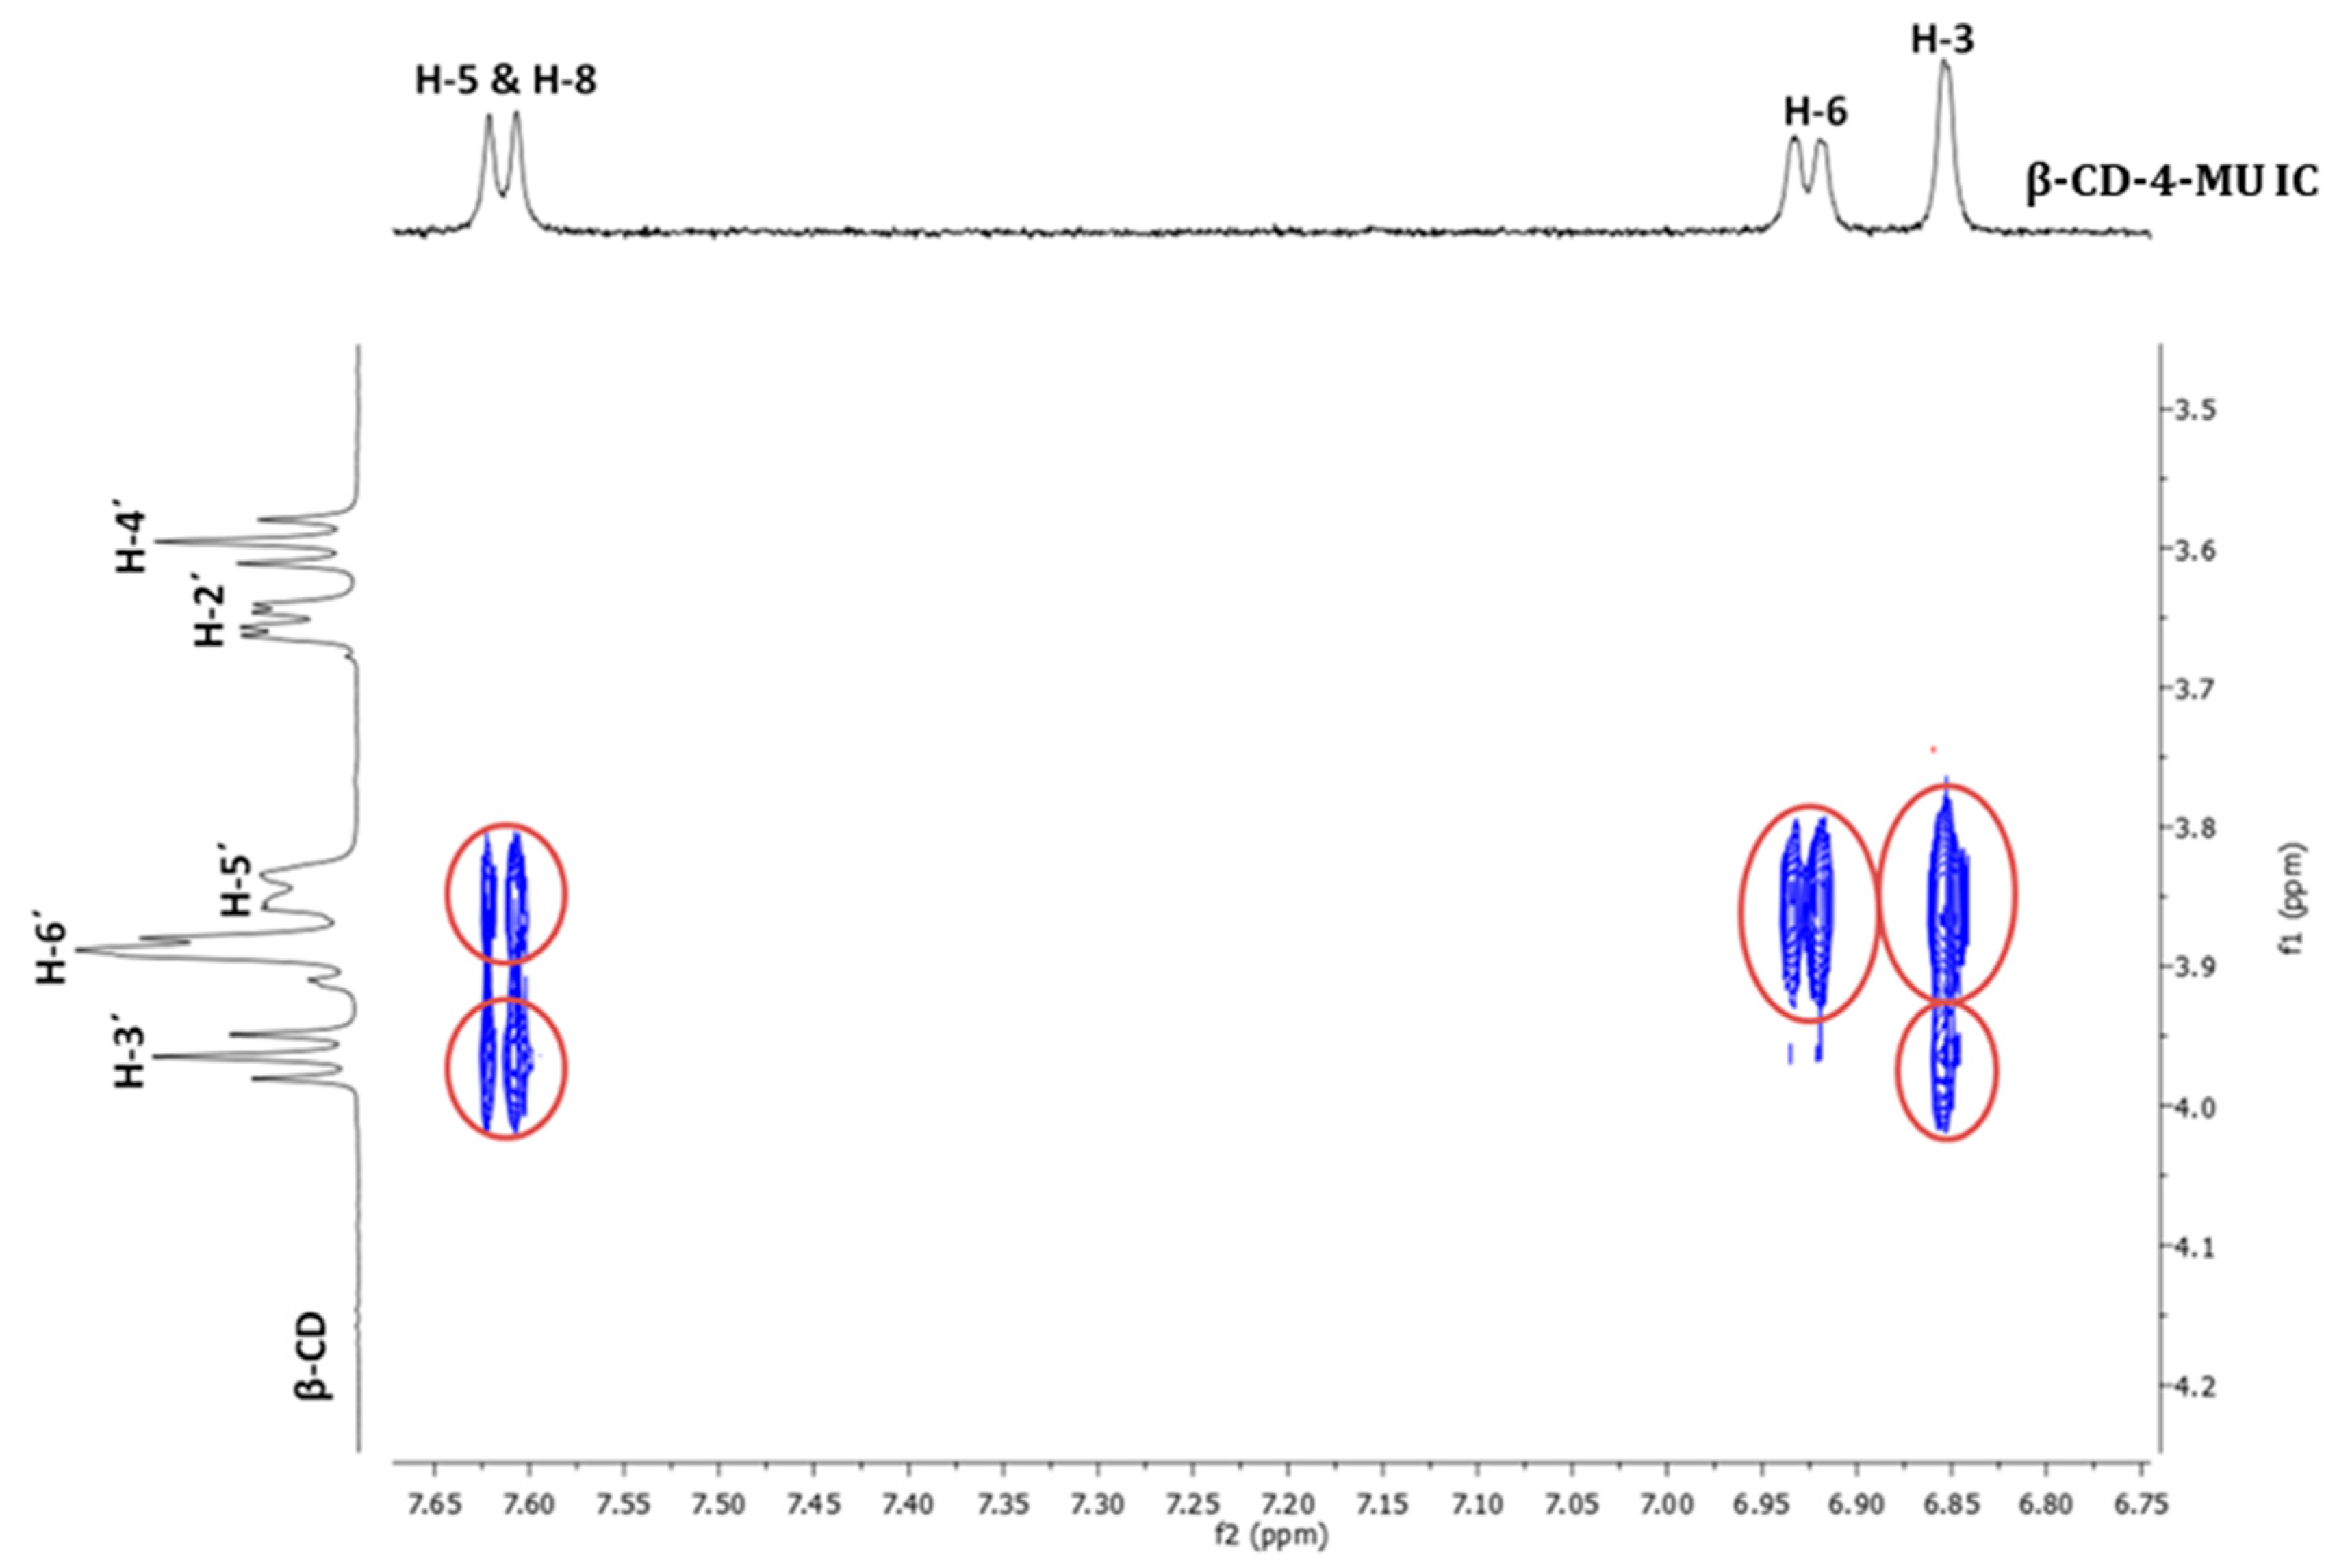
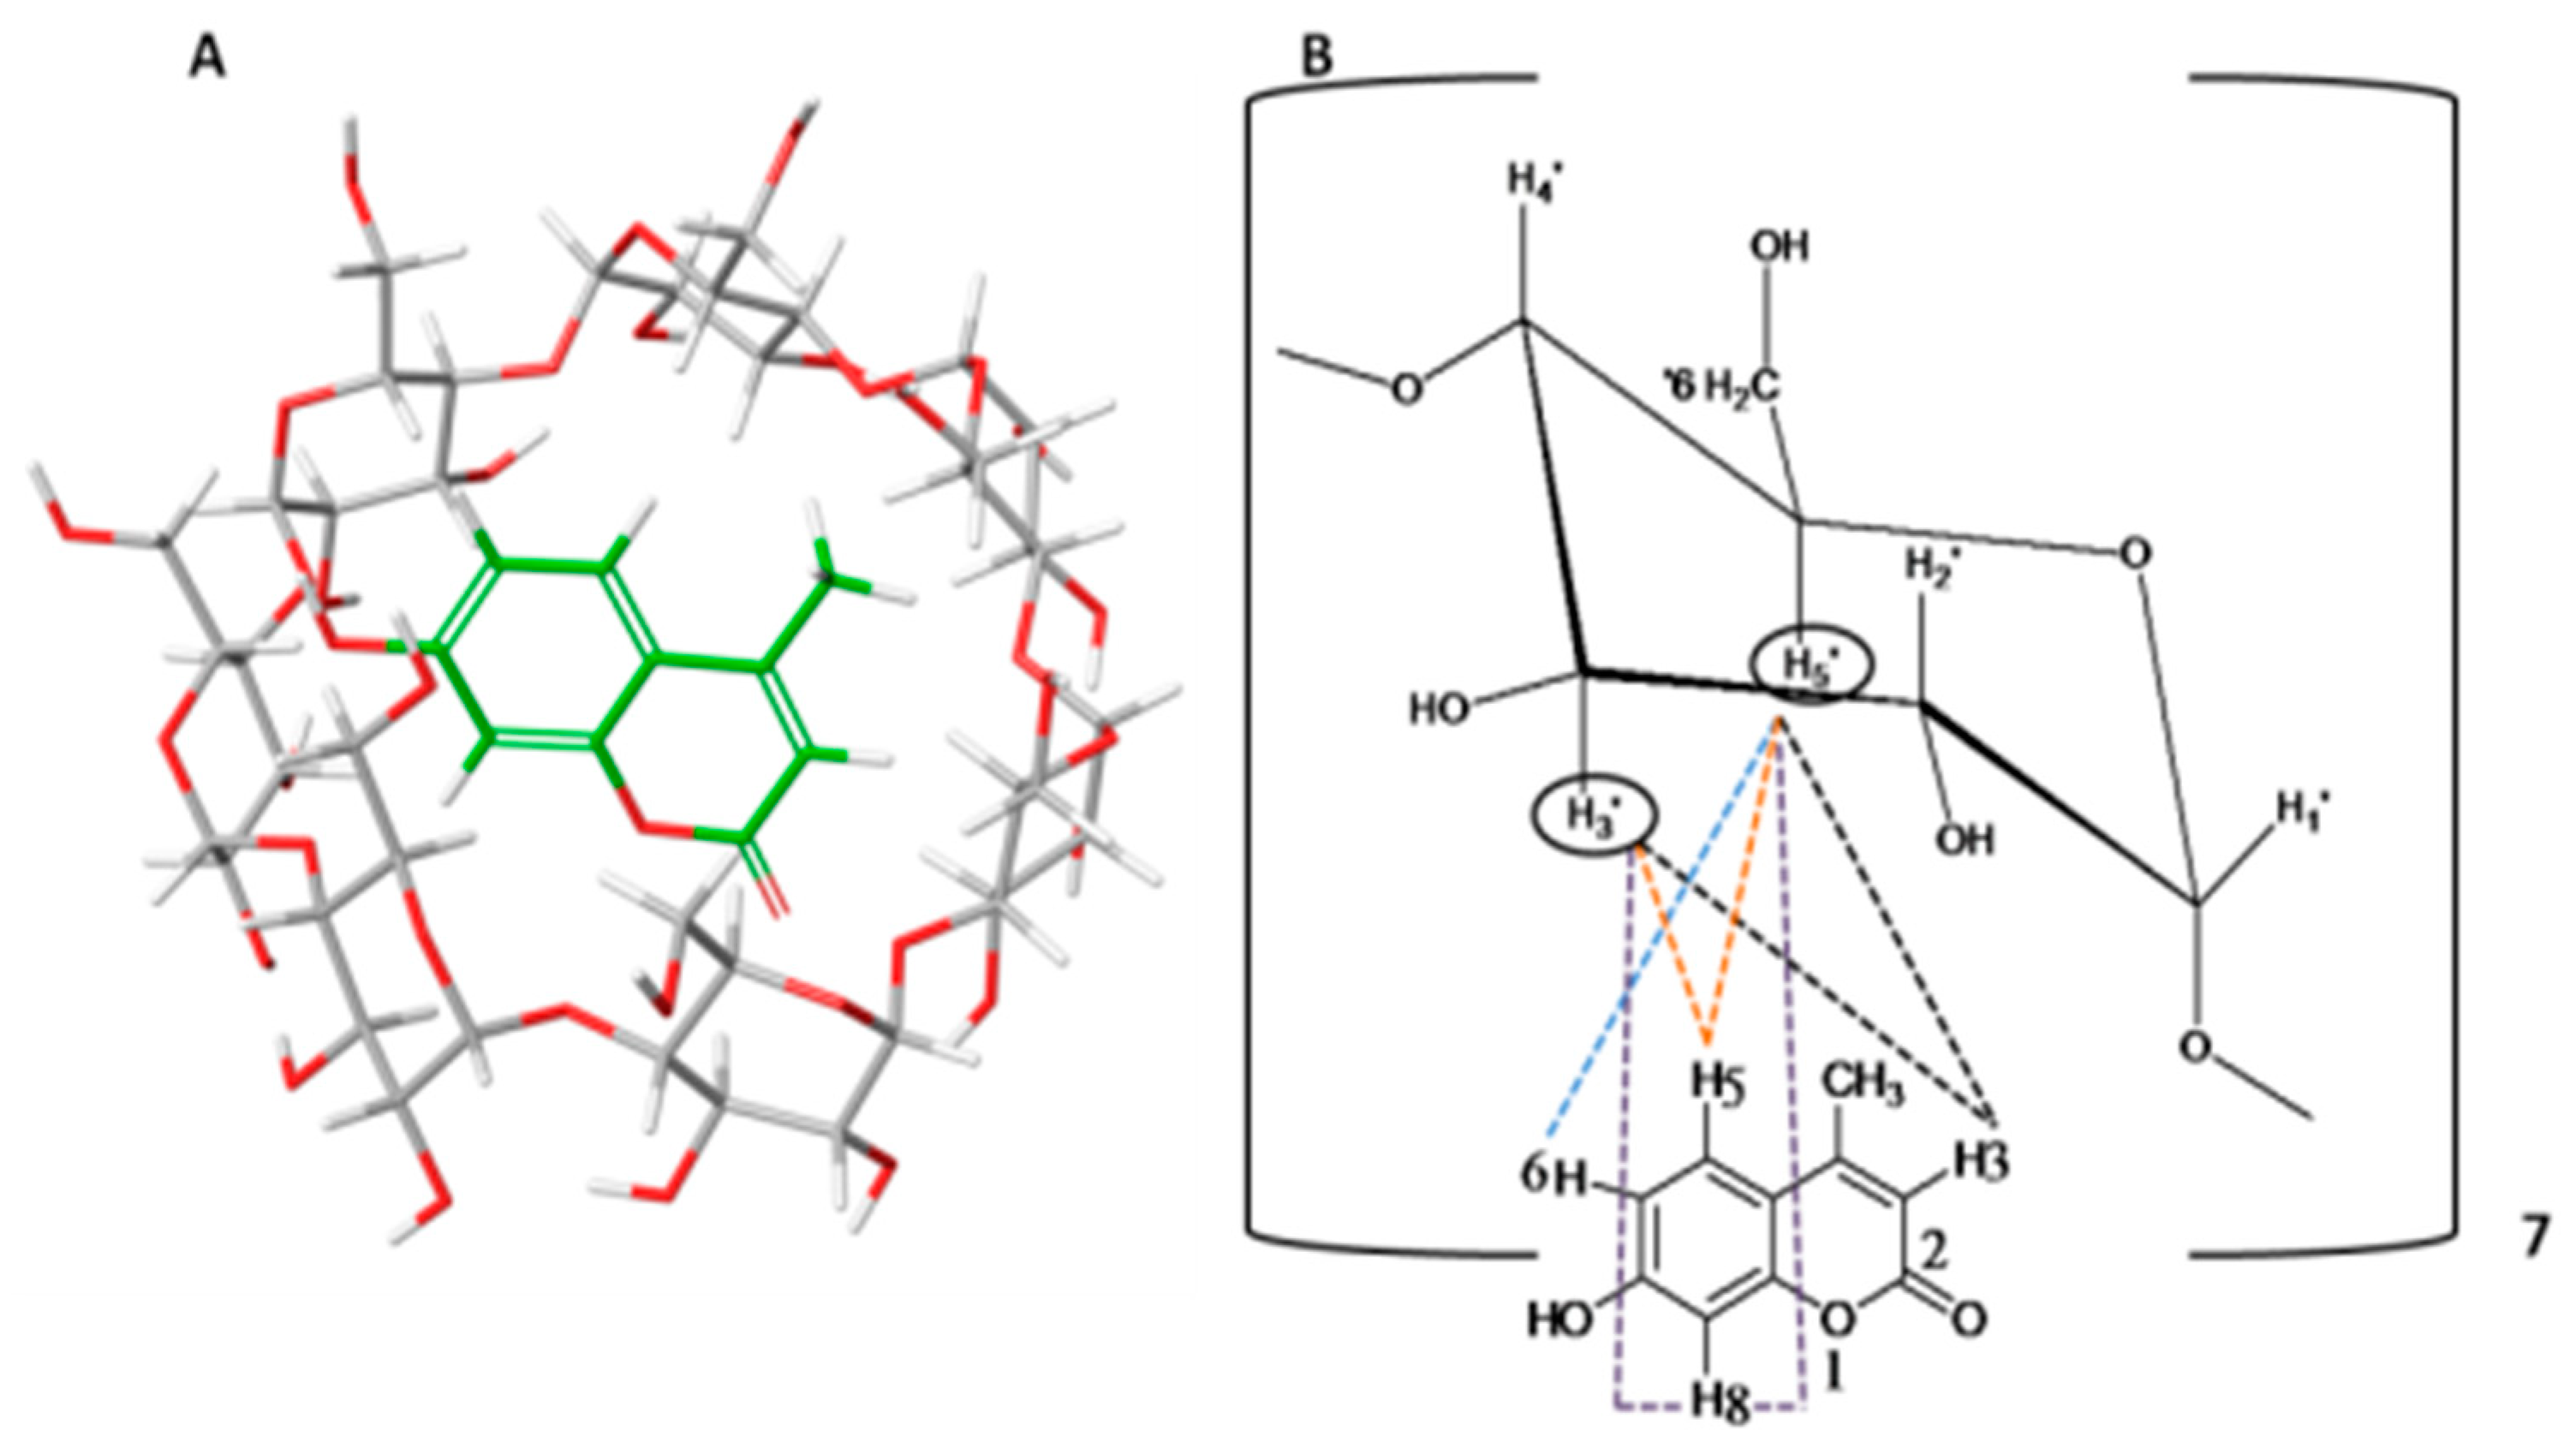
3.1.2. Nuclear Magnetic Resonance Spectroscopy (NMR Spectroscopy)

The 1H NMR analysis of the β-CD-4-MU inclusion complex in comparison with the pure β-CD was carried out in deuterium oxide. The obtained spectra are presented in Figure 2, while the observed differences in proton chemical shifts of β-CD are presented in Table 5.
The differences in the chemical shifts of the β-CD protons in pure form and in the inclusion complex were determined. More specifically, significant upfield shifts were observed mainly for the protons 3′ and 5′ which are located in the internal cavity of the β-CD. In particular, the H-3′ are situated near the wider rim while the H-5′ are placed near the narrower rim of the cavity (Figure 3). The upfield shift of H-3′ and H-5′ has been attributed to the magnetic anisotropy effect in the β-CD cavity due to the inclusion of groups rich in π-electrons [27]. Τhe Δδ of H-3′ is significantly lower than that of H-5′, indicating that a total inclusion takes place. All the above in combination with the displacement of the H-5′ signal, which allowed the appearance of peak multiplication (double peak), indicate the formation of β-CD-4-MU inclusion complexes.
Two-dimensional NMR ROESY of β-CD-4-MU (1:1) ICs was used to identify the intermolecular distances and the cross peaks intensities between the host (β-CD) and the guest (4-MU) molecules. Particularly, ROE correlations (Figure 4) were observed between the H-3 proton of 4-MU and the internal H-3′ and H-5′ β-CD protons. Also, the ROESY spectra indicate an appreciable correlation of the H-6 proton of 4-MU with the internal H-5′ proton of β-CD. Finally, the NMR data demonstrate the spatial proximity of the H-5 and H-8 protons of 4-MU with the H-3′ and H-5′ protons of β-CD. The correlations mentioned above confirm the encapsulation of the 4-MU molecule within the cavity of β-CD. This fact is enforced by the absence of any cross peak into the guest protons and the external protons (H-2′ and H-4′) of β-CD, as it was indicated by the 3D representation of the 4-MU molecule within the cavity of β-CD (Figure 5), obtained using Schrödinger Platform (Schrödinger Release 2020-3: Maestro, Schrödinger, LLC, New York, NY, USA, 2020).

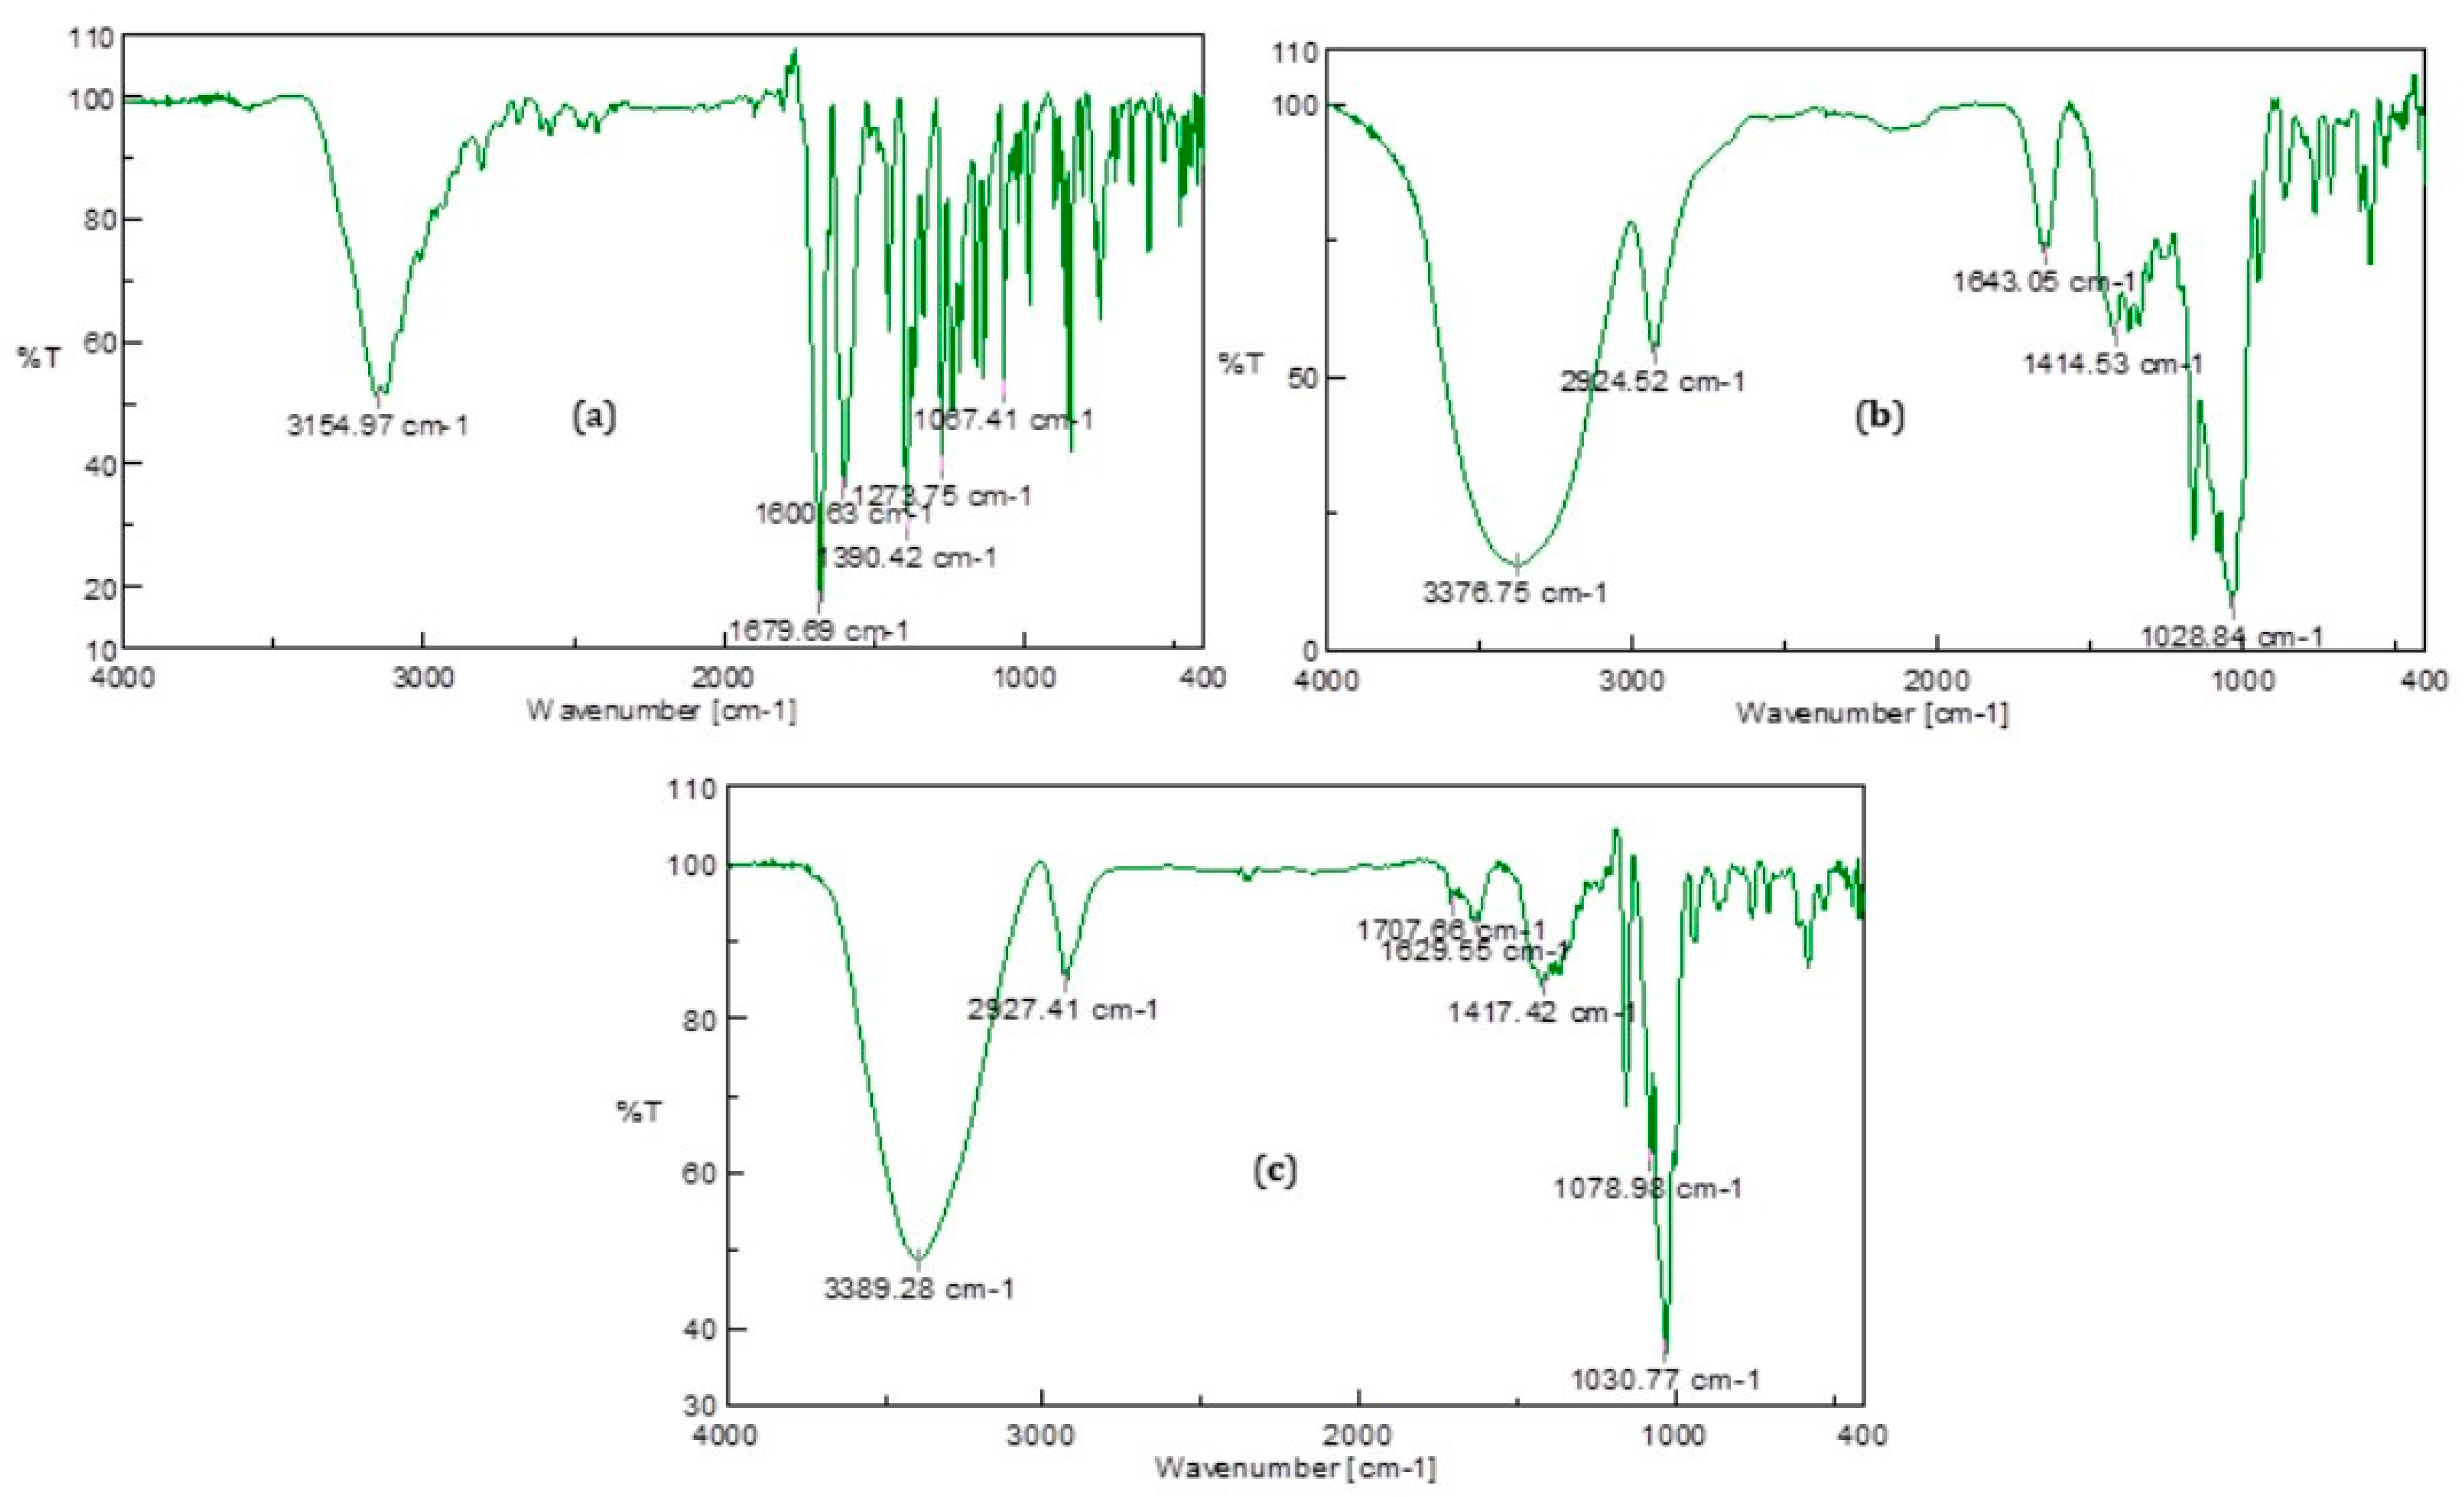
3.1.3. FT-IR Spectroscopy

FT-IR spectroscopy was used to investigate the host-guest interactions in β-CD-4-MU inclusion complex. In the FT-IR spectrum of 4-methyl-umbelliferone (Figure 6a), the most characteristic absorption bands appear at 3156, 1680, 1601, 1390, 1274, and 1067 cm−1. Specifically, the band at 3156 cm−1 is attributed to the C–H stretching vibration of the aromatic ring, and the band at 1680 cm−1 is attributed to the C=O stretching vibration of coumarin. At 1601 cm−1 is located the band corresponding to the C=C stretching vibration of the aromatic ring, and at 1390 cm−1 the absorption due to the O–H bending vibration. Finally, at 1274 cm−1 appears the band corresponding to the in-plane C–H bending vibration of the aromatic ring, while the characteristic absorption of the C–O stretching vibration of phenol appears at 1067 cm−1.
In the FT-IR spectrum of β-CD (Figure 6b), the most characteristic absorption bands appear at 3376 cm−1 due to the O–H stretching vibrations, at 2925 cm−1 attributed to the C–H stretching vibration, at 1643 cm−1 due to the asymmetric stretching vibration of -CH2, as well as at 1415 cm−1 due to the O–H bending vibration. Finally, the characteristic band at 1029 cm−1 is attributed to the stretching vibration of the C–O bonds of the secondary alcohols presented in the β-CD molecule.
The FT-IR spectrum of the inclusion complex differs significantly from that of 4-methyl-umbelliferone and β-CD (Figure 6). More specifically, the observed shifts of the characteristic absorption band of β-CD and 4-MU (Table 6) indicate the interaction between β-CD and 4-MU and the formation of inclusion complexes. Noticeably, there is a shift of the absorption band due to the O–H stretching vibration of β-CD from 3377 cm−1 to 3389 cm−1, and the absorption band due to the C=O bond stretching vibration of 4-MU from 1680 cm−1 to 1708 cm−1.

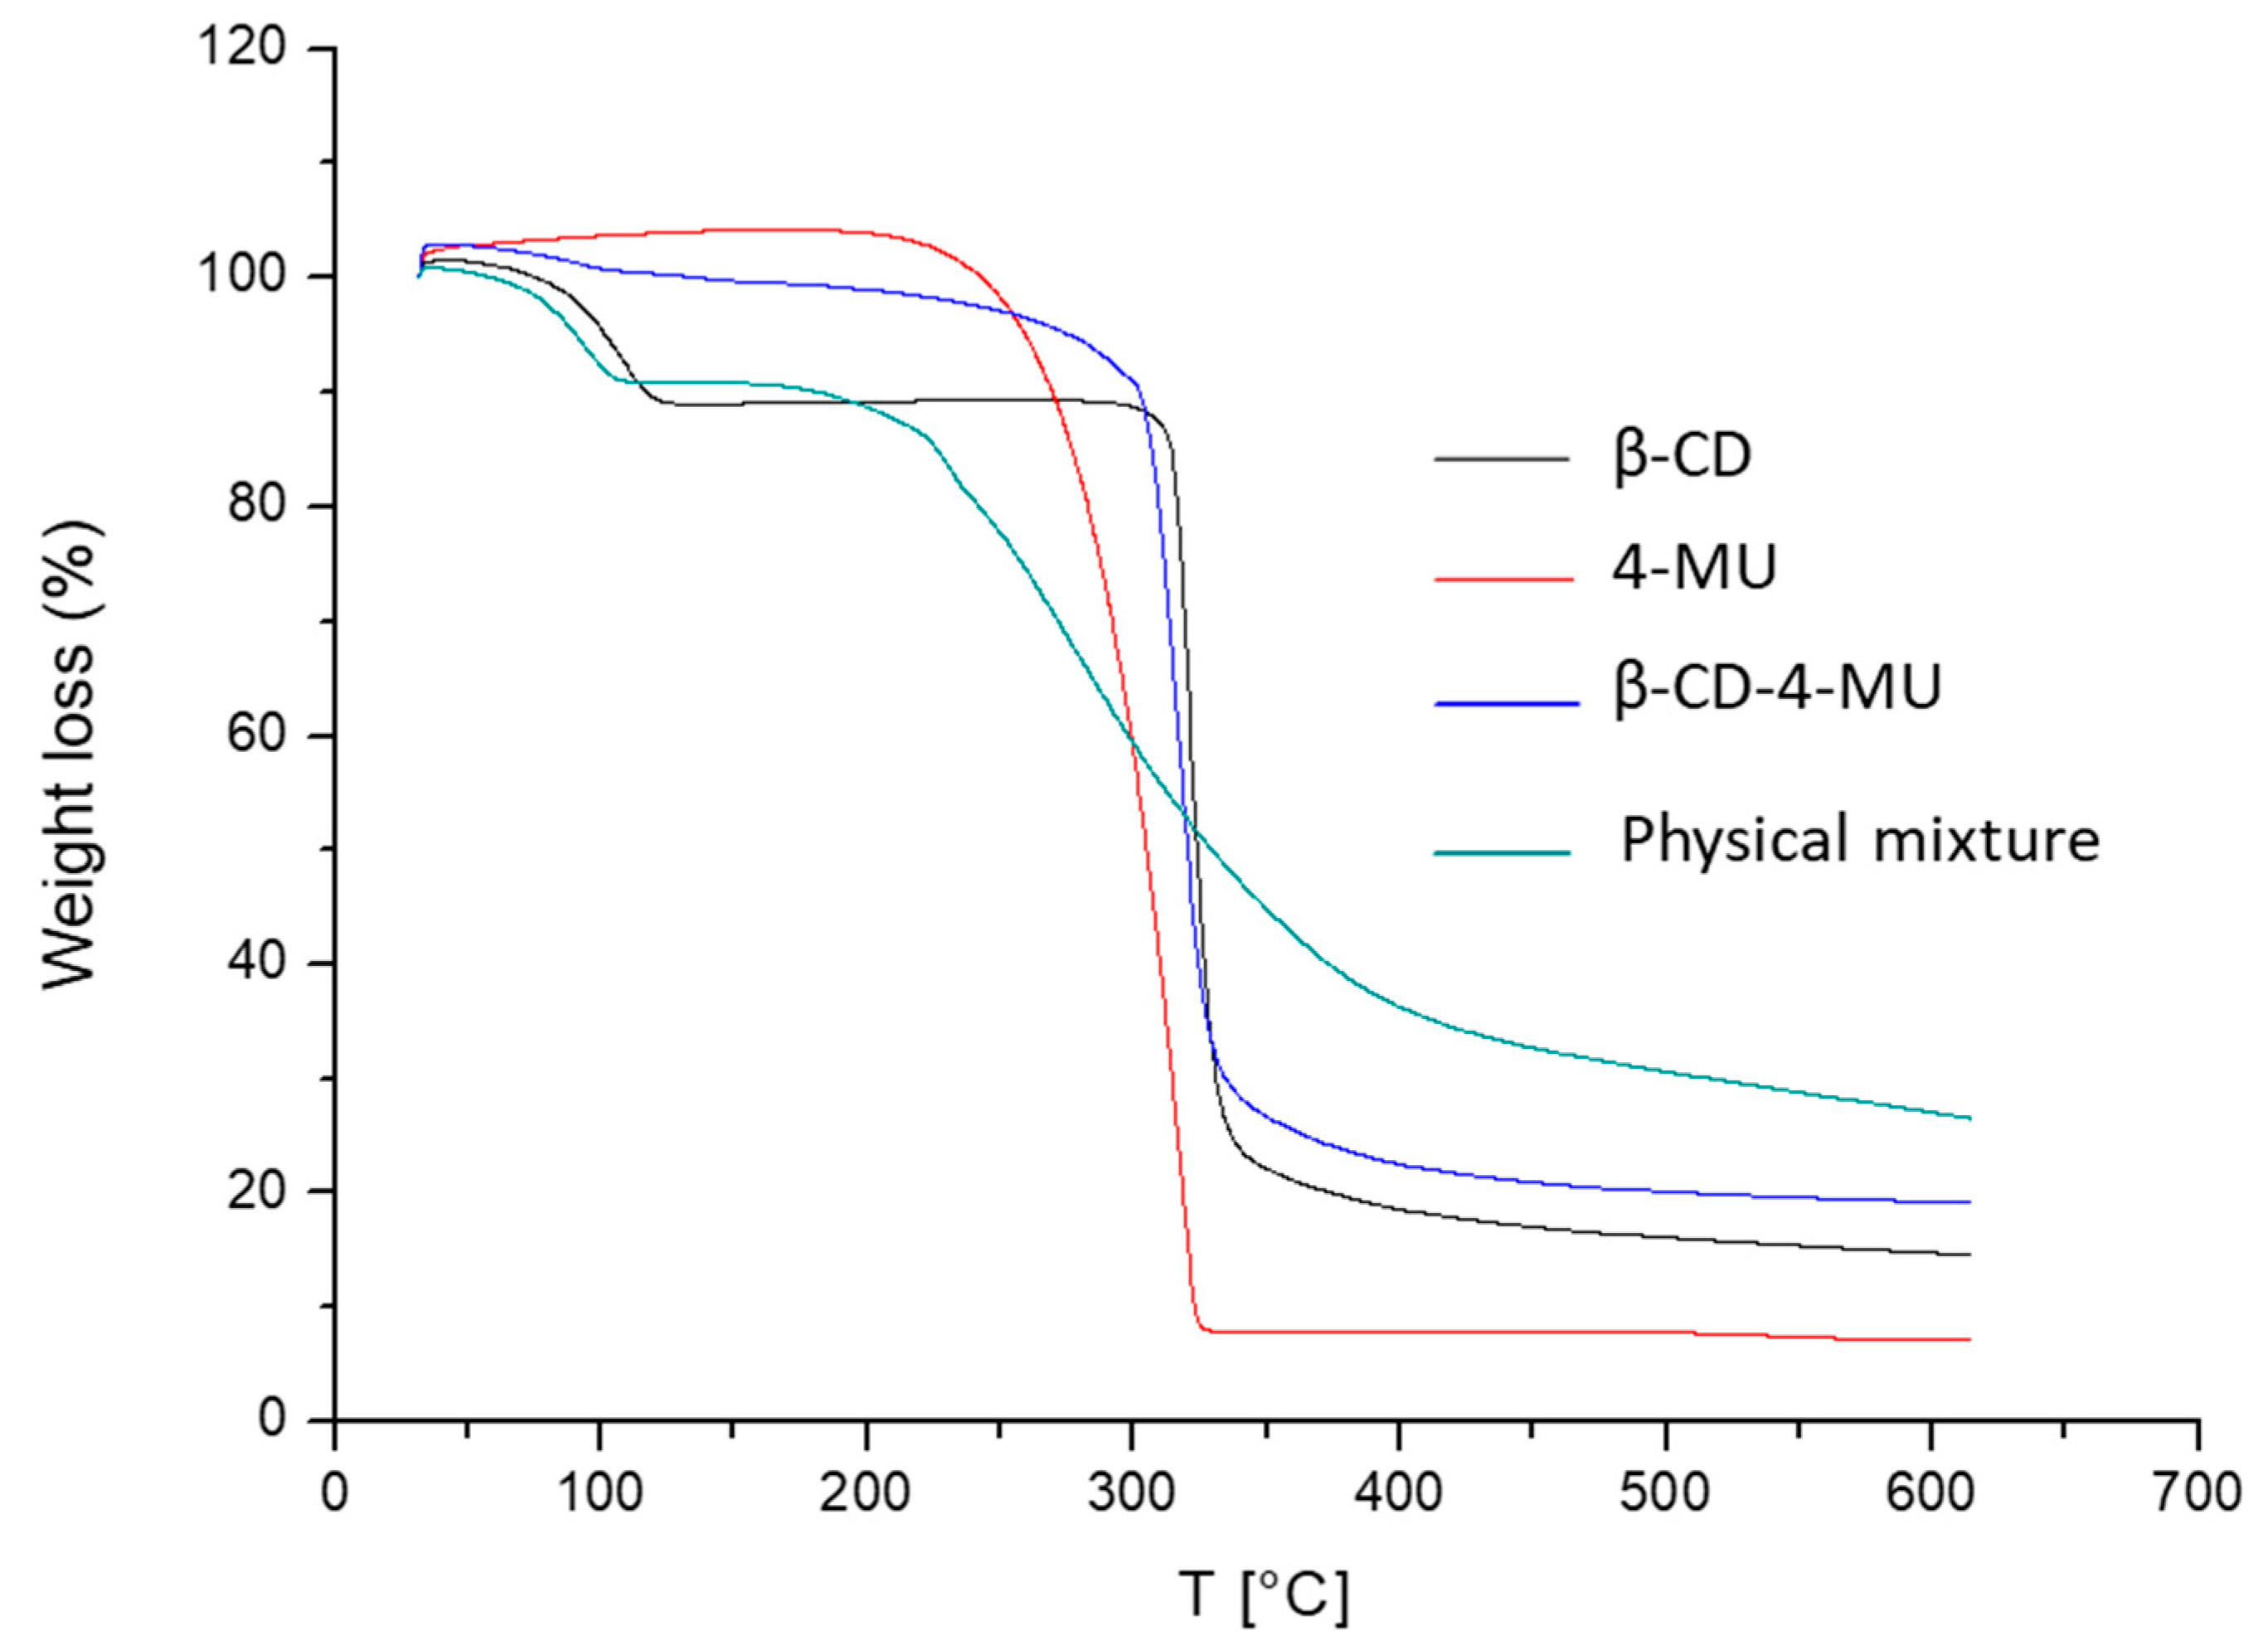
3.1.4. Thermogravimetric Analysis (TGA)

The thermal properties of the inclusion complex and the pure compounds were studied using thermogravimetric analysis (TGA). The TGA comparative diagram of β-CD-4-MU IC, pure β-CD, 4-MU, and their physical mixture is shown in Figure 7.
The TGA curve of free β-CD showed mass loss in two stages. The first weight loss appeared at the temperature range of 60–120 °C and is attributed to the water evaporation from the β-CD cavity, which was also suggested in the work of Gao et al. [28] and Kotronia et.al. [12]. The second weight loss appeared at the temperature range of 310–380 °C and is attributed to the decomposition of β-CD. Furthermore, it is worth mentioning that the first weight loss of inclusion complex was significantly lower (3%) than that noticed in β-CD (13%) and the physical mixture of β-CD-4-MU (11%) curves, indicating the presence of guest–host interactions and the displacement of water molecules by guest molecules. Calculations based on water weight loss during the dehydration of β-CD reveal a molecular formula of β–CD.10H2O for β-cyclodextrin and β–CD.2H2O-4MU for the inclusion complex. The TGA curve of the physical mixture is completely different from that of the β-CD-4-MU inclusion complex, suggesting the complexation of 4-MU with β-CD. Finally, the thermal degradation of the β-CD-4-MU inclusion complex occurred at a higher temperature than that observed for pure 4-MU, indicating an increased thermal stability of the compound [28].

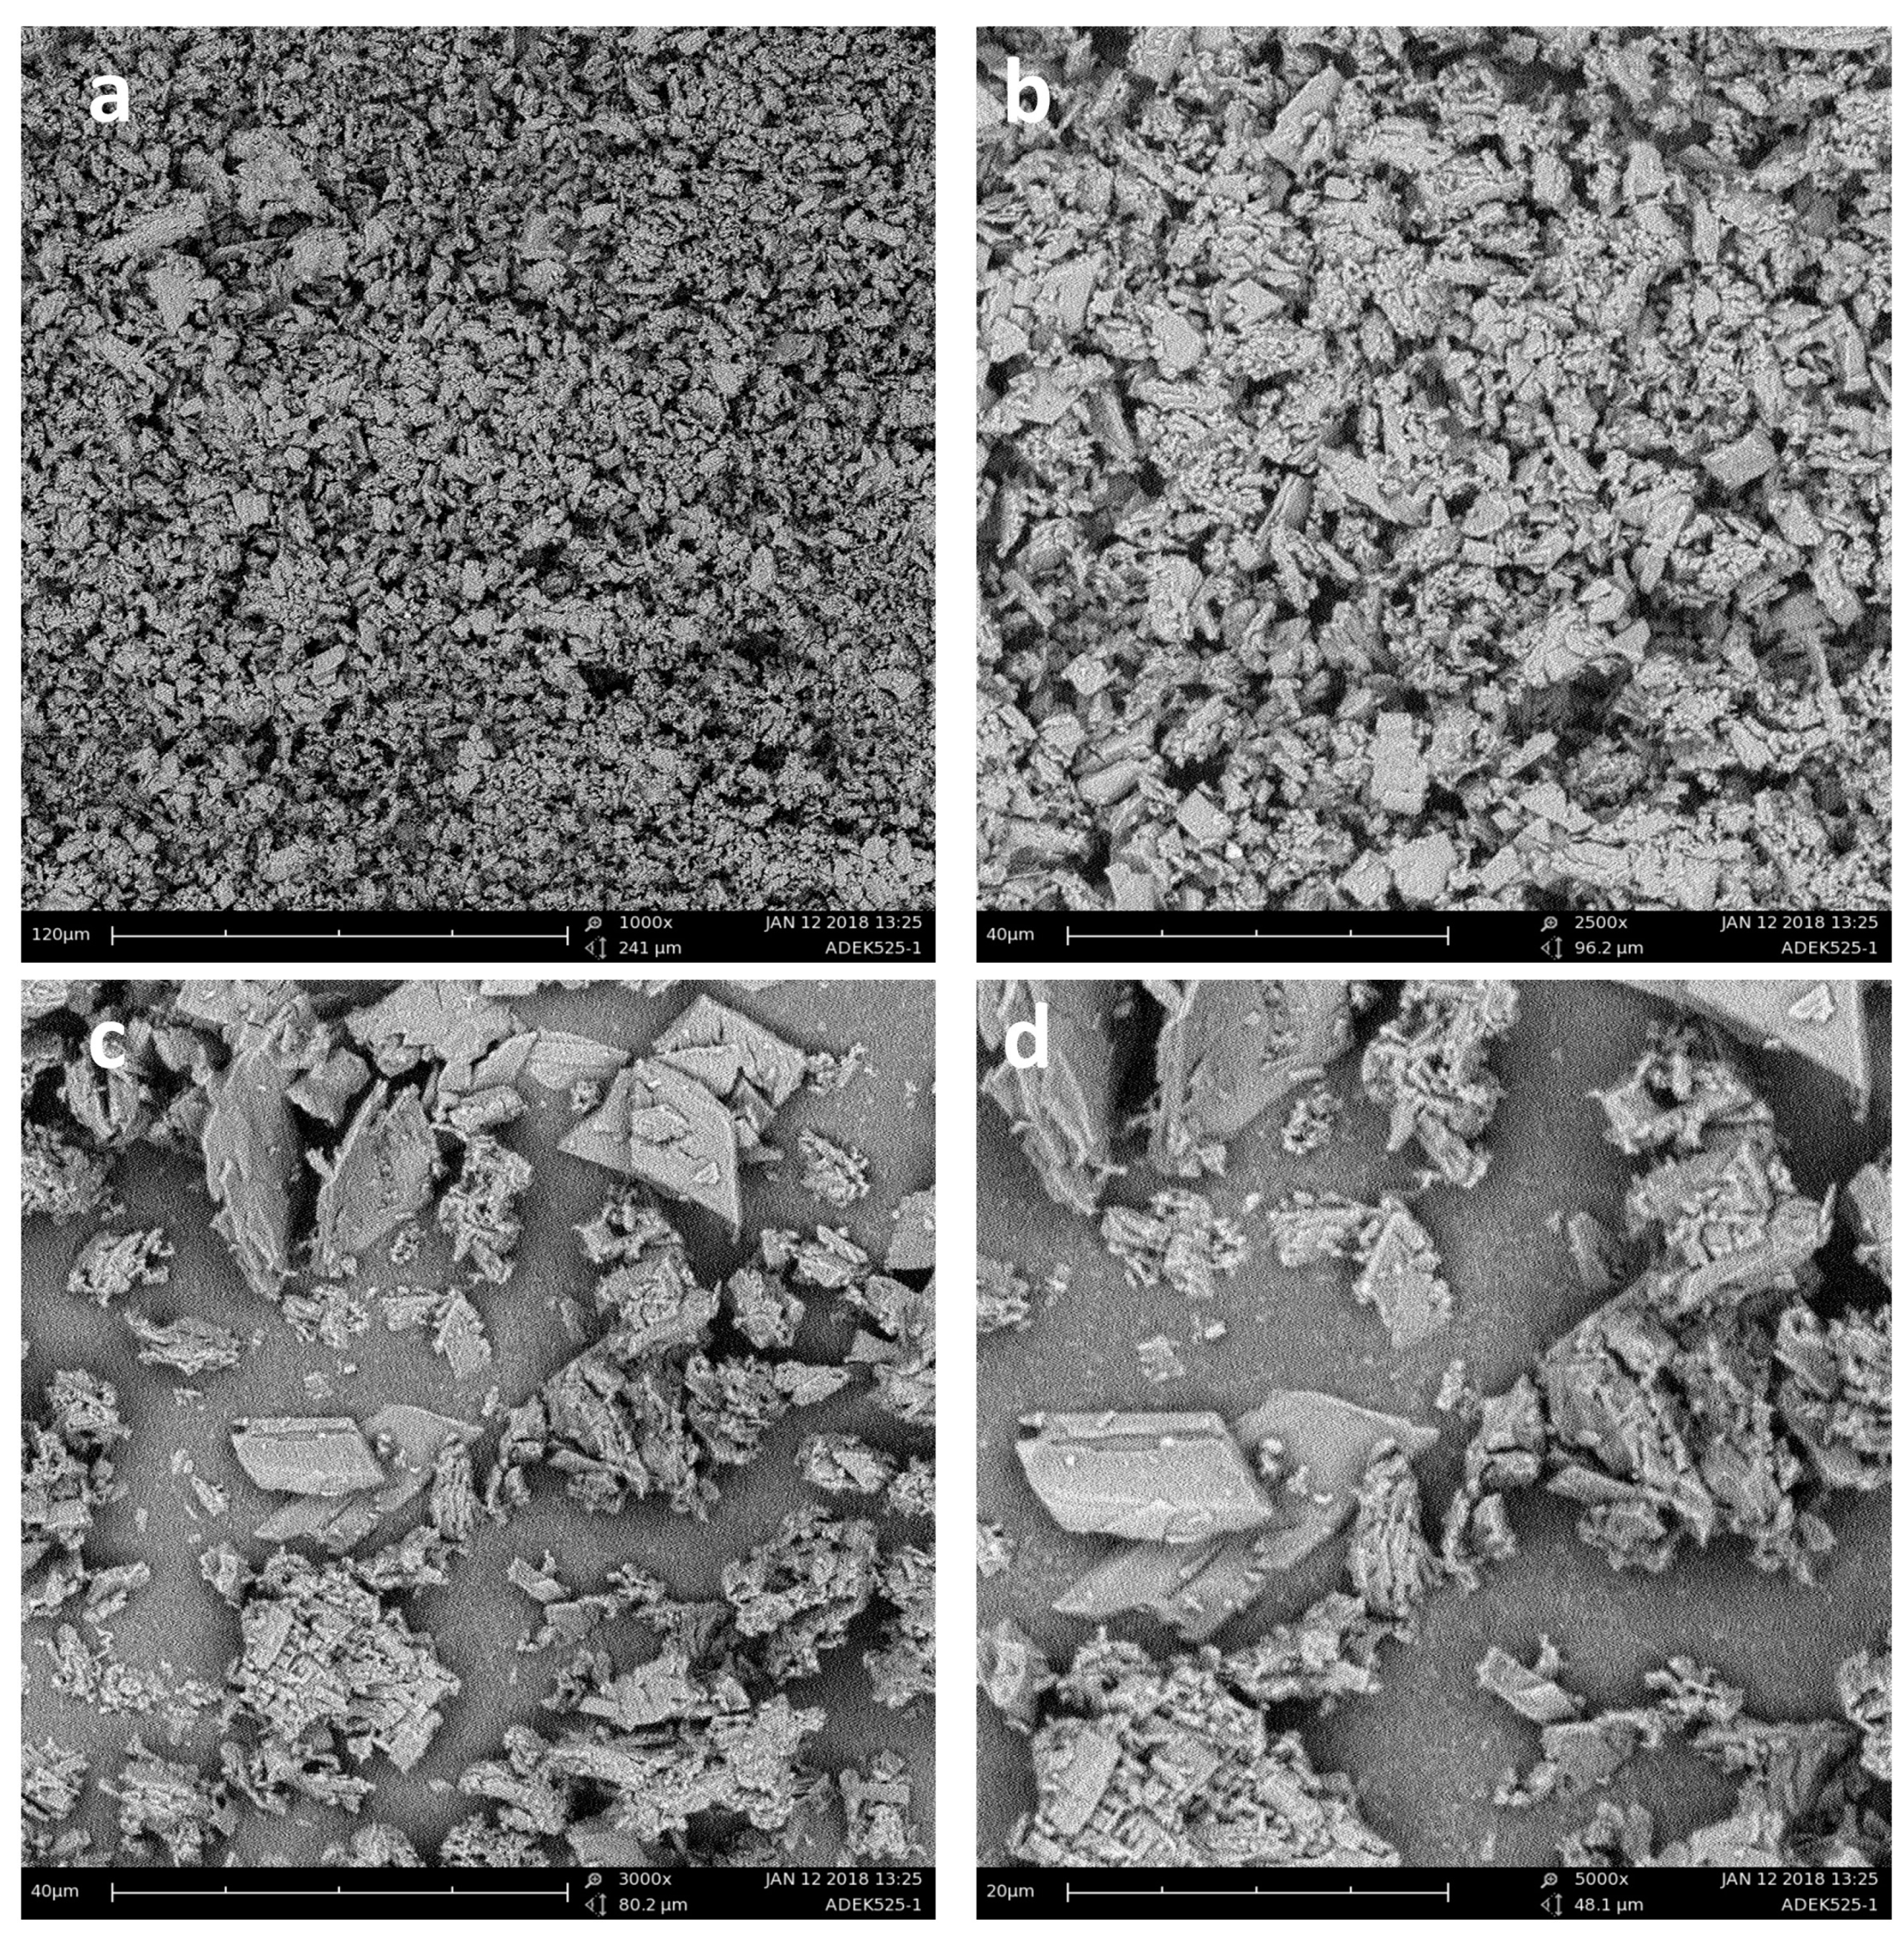
3.1.5. Scanning Electron Microscopy (SEM)

As can be seen from the SEM images (Figure 8), the inclusion complex formed particles of different sizes with a rock-like morphology resembling the shape of a prism with parallel and smooth sides. The particles were randomly distributed in complexes of various sizes, in which smaller particles were attached to larger ones, indicating, in agreement with the literature, the tendency of cyclodextrins to form aggregates [12,28].

3.2. Biological Activity Evaluation

The evaluation of the in vitro antioxidant and soybean lipoxygenase inhibitory activities of the β-CD-4-MU inclusion complex and of the pure compounds is presented in Table 7. Trolox and NDGA were used as the reference compounds.
The results reveal that the inclusion complex shows a satisfactory DPPH scavenging ability, whereas 4-MU was inactive in its free form. Similar observations have been previously reported by Wang et al. and Rocha Ferreira et al. [29]. Moreover, the inclusion complex exhibited 100% inhibition of lipid peroxidation induced by the AAPH free radical initiator, whereas the pure 4-MU showed a slightly lower activity (93%). 4-MU did not show any inhibitory activity against soybean lipoxygenase, whereas pure β-CD showed IC50 51.5 μΜ. The inclusion complex was found to have significant LOX inhibitory activity (IC50 10 μM). Overall, the encapsulation of 4-MU in the β-CD cavity resulted in a system with a combined antioxidant and lipoxygenase inhibitory activity, clearly improved as compared to the pure 4-MU. These findings set the basis for the further utilization of the complex in pharmaceutical applications [15,30].

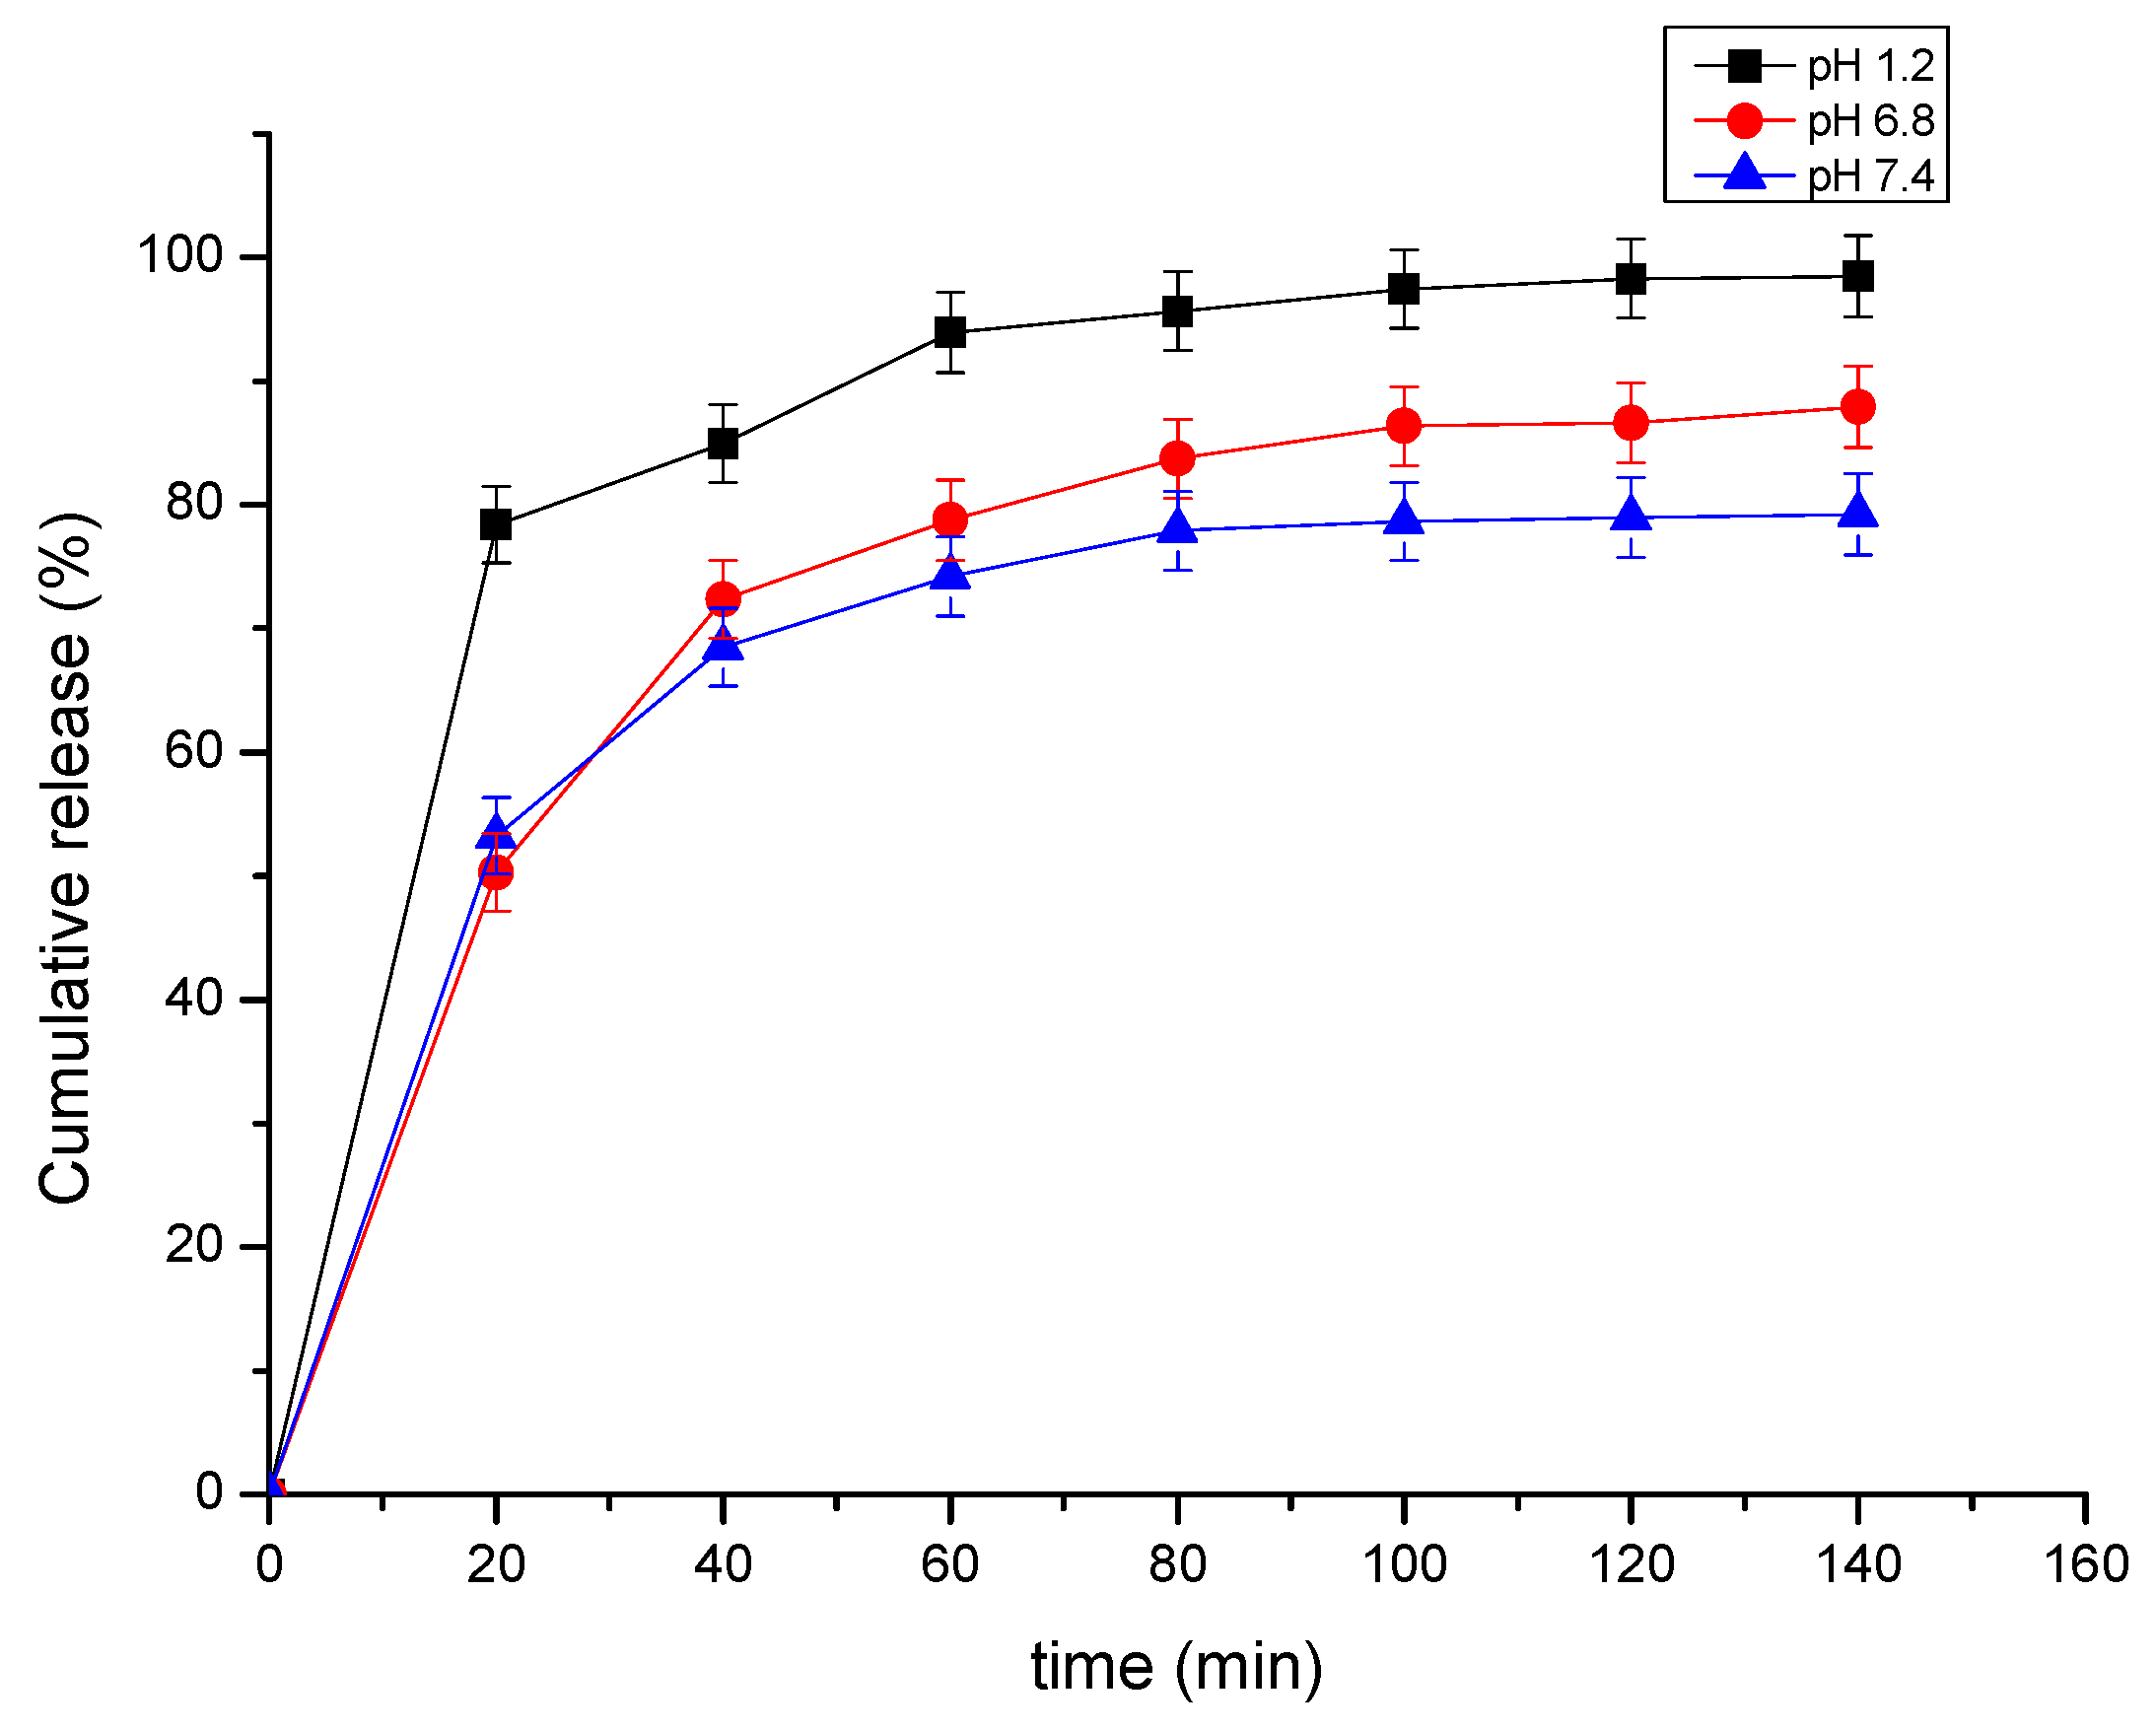
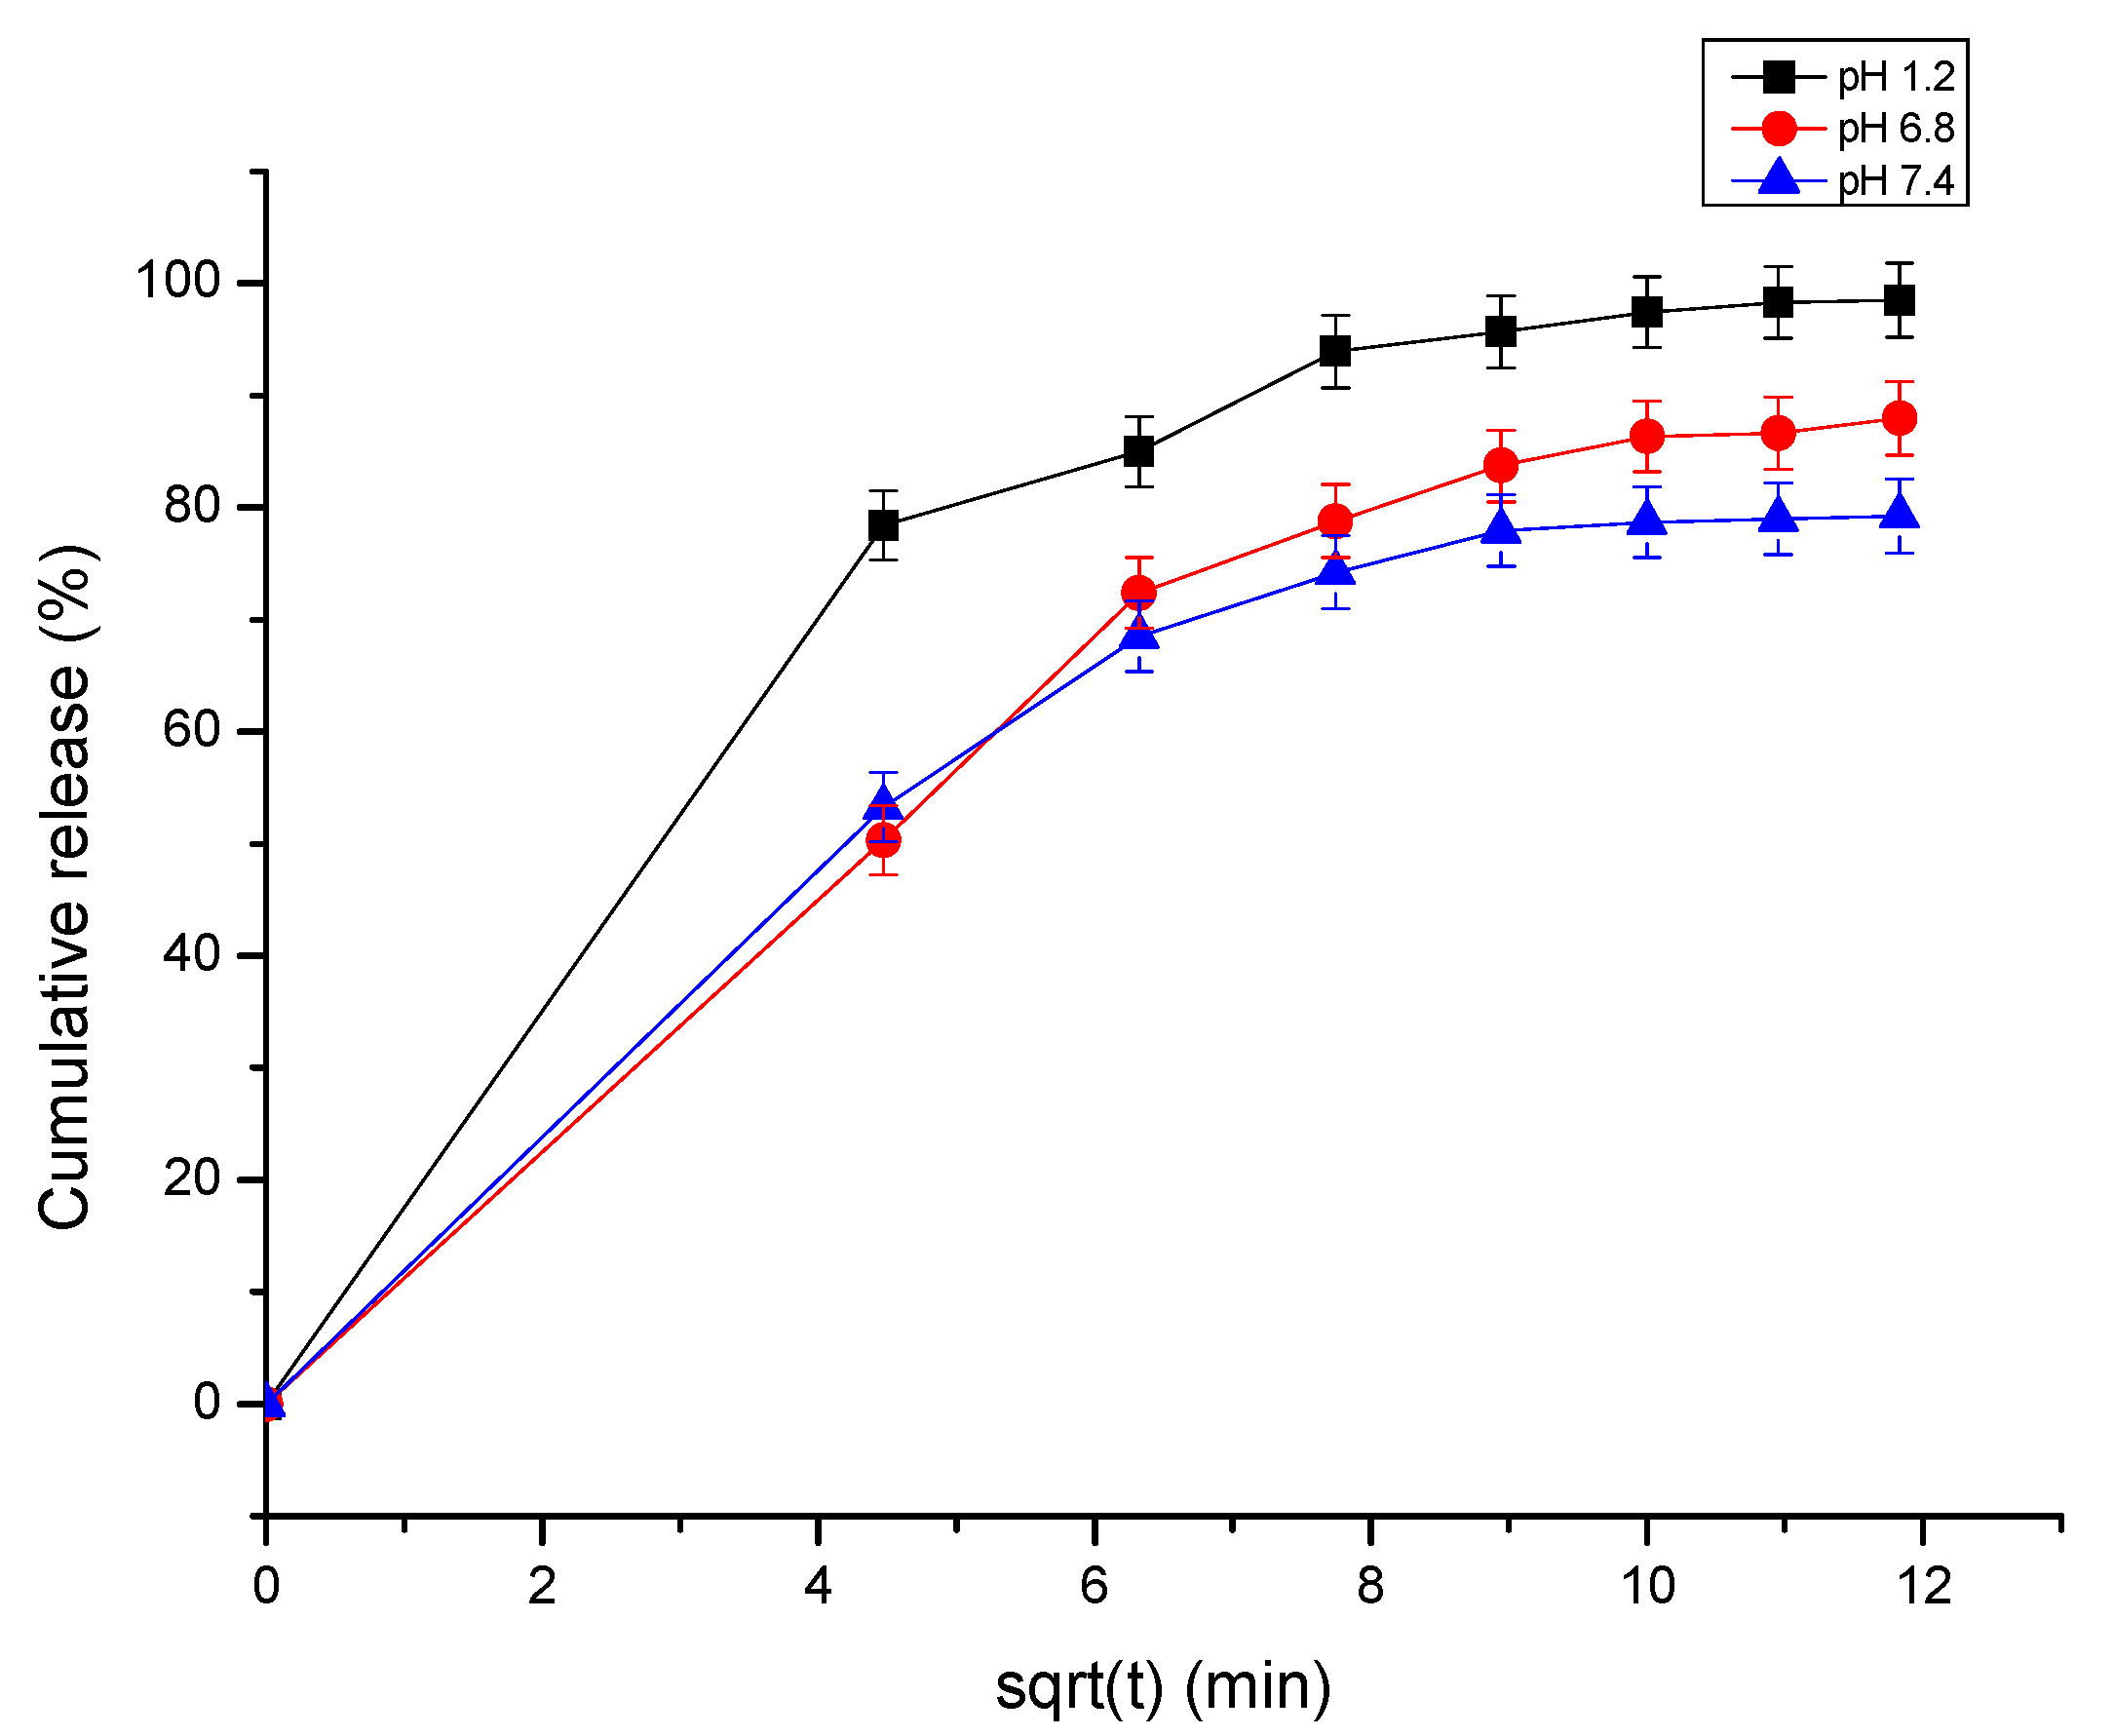
3.3. In Vitro Release Studies of the 4-MU from β-CD—4-Methyl-Umbelliferone ICs

The release of 4-MU from the β-CD-4-methyl-umbelliferone IC was studied at 37 ± 0.5 °C and at three different pH simulating gastric fluids (pH 1.2), intestinal fluids (pH 6.8), and the pH of the human body (pH 7.4). The release profiles of the β-CD-4MU inclusion complex showed a burst release effect at 20 min, with release rates between 50 and 55% at pH 6.8 and pH 7.4, while at pH 1.2, a 70% release rate was achieved. This could be attributed to the release of molecules of the active compound that were weakly bound to the surface of the cyclodextrin. A rapid rise was gradually reduced to 120 min and followed by a stable “plateau” profile.
The results of the in vitro release experiments showed that the 4-MU’s release at three different pH values had a similar profile (Figure 9). However, it is worth mentioning that a slightly higher drug release rate of 4-MU was observed at pH 1.2 (90%) compared to that at pH 6.8 and 7.4 (ranging from 70 to 80%), which could be attributed to the partial protonation of the hydroxyl group of the active compound at pH 1.2 (pKa 7.79), which renders the molecule more polar with a lower affinity with the cyclodextrin cavity.
The kinetic models for the release of the β-CD-4-MU complex at pH 1.2, pH 7.4, and pH 6.8 are shown in Table 8. The results reveal that the kinetic model that best describes the release profile of 4-MU from the ICs is the Higuchi model (Figure 10), while the release mechanism is swelling and diffusion, as was indicated by the Kosmeyer–Peppas model.

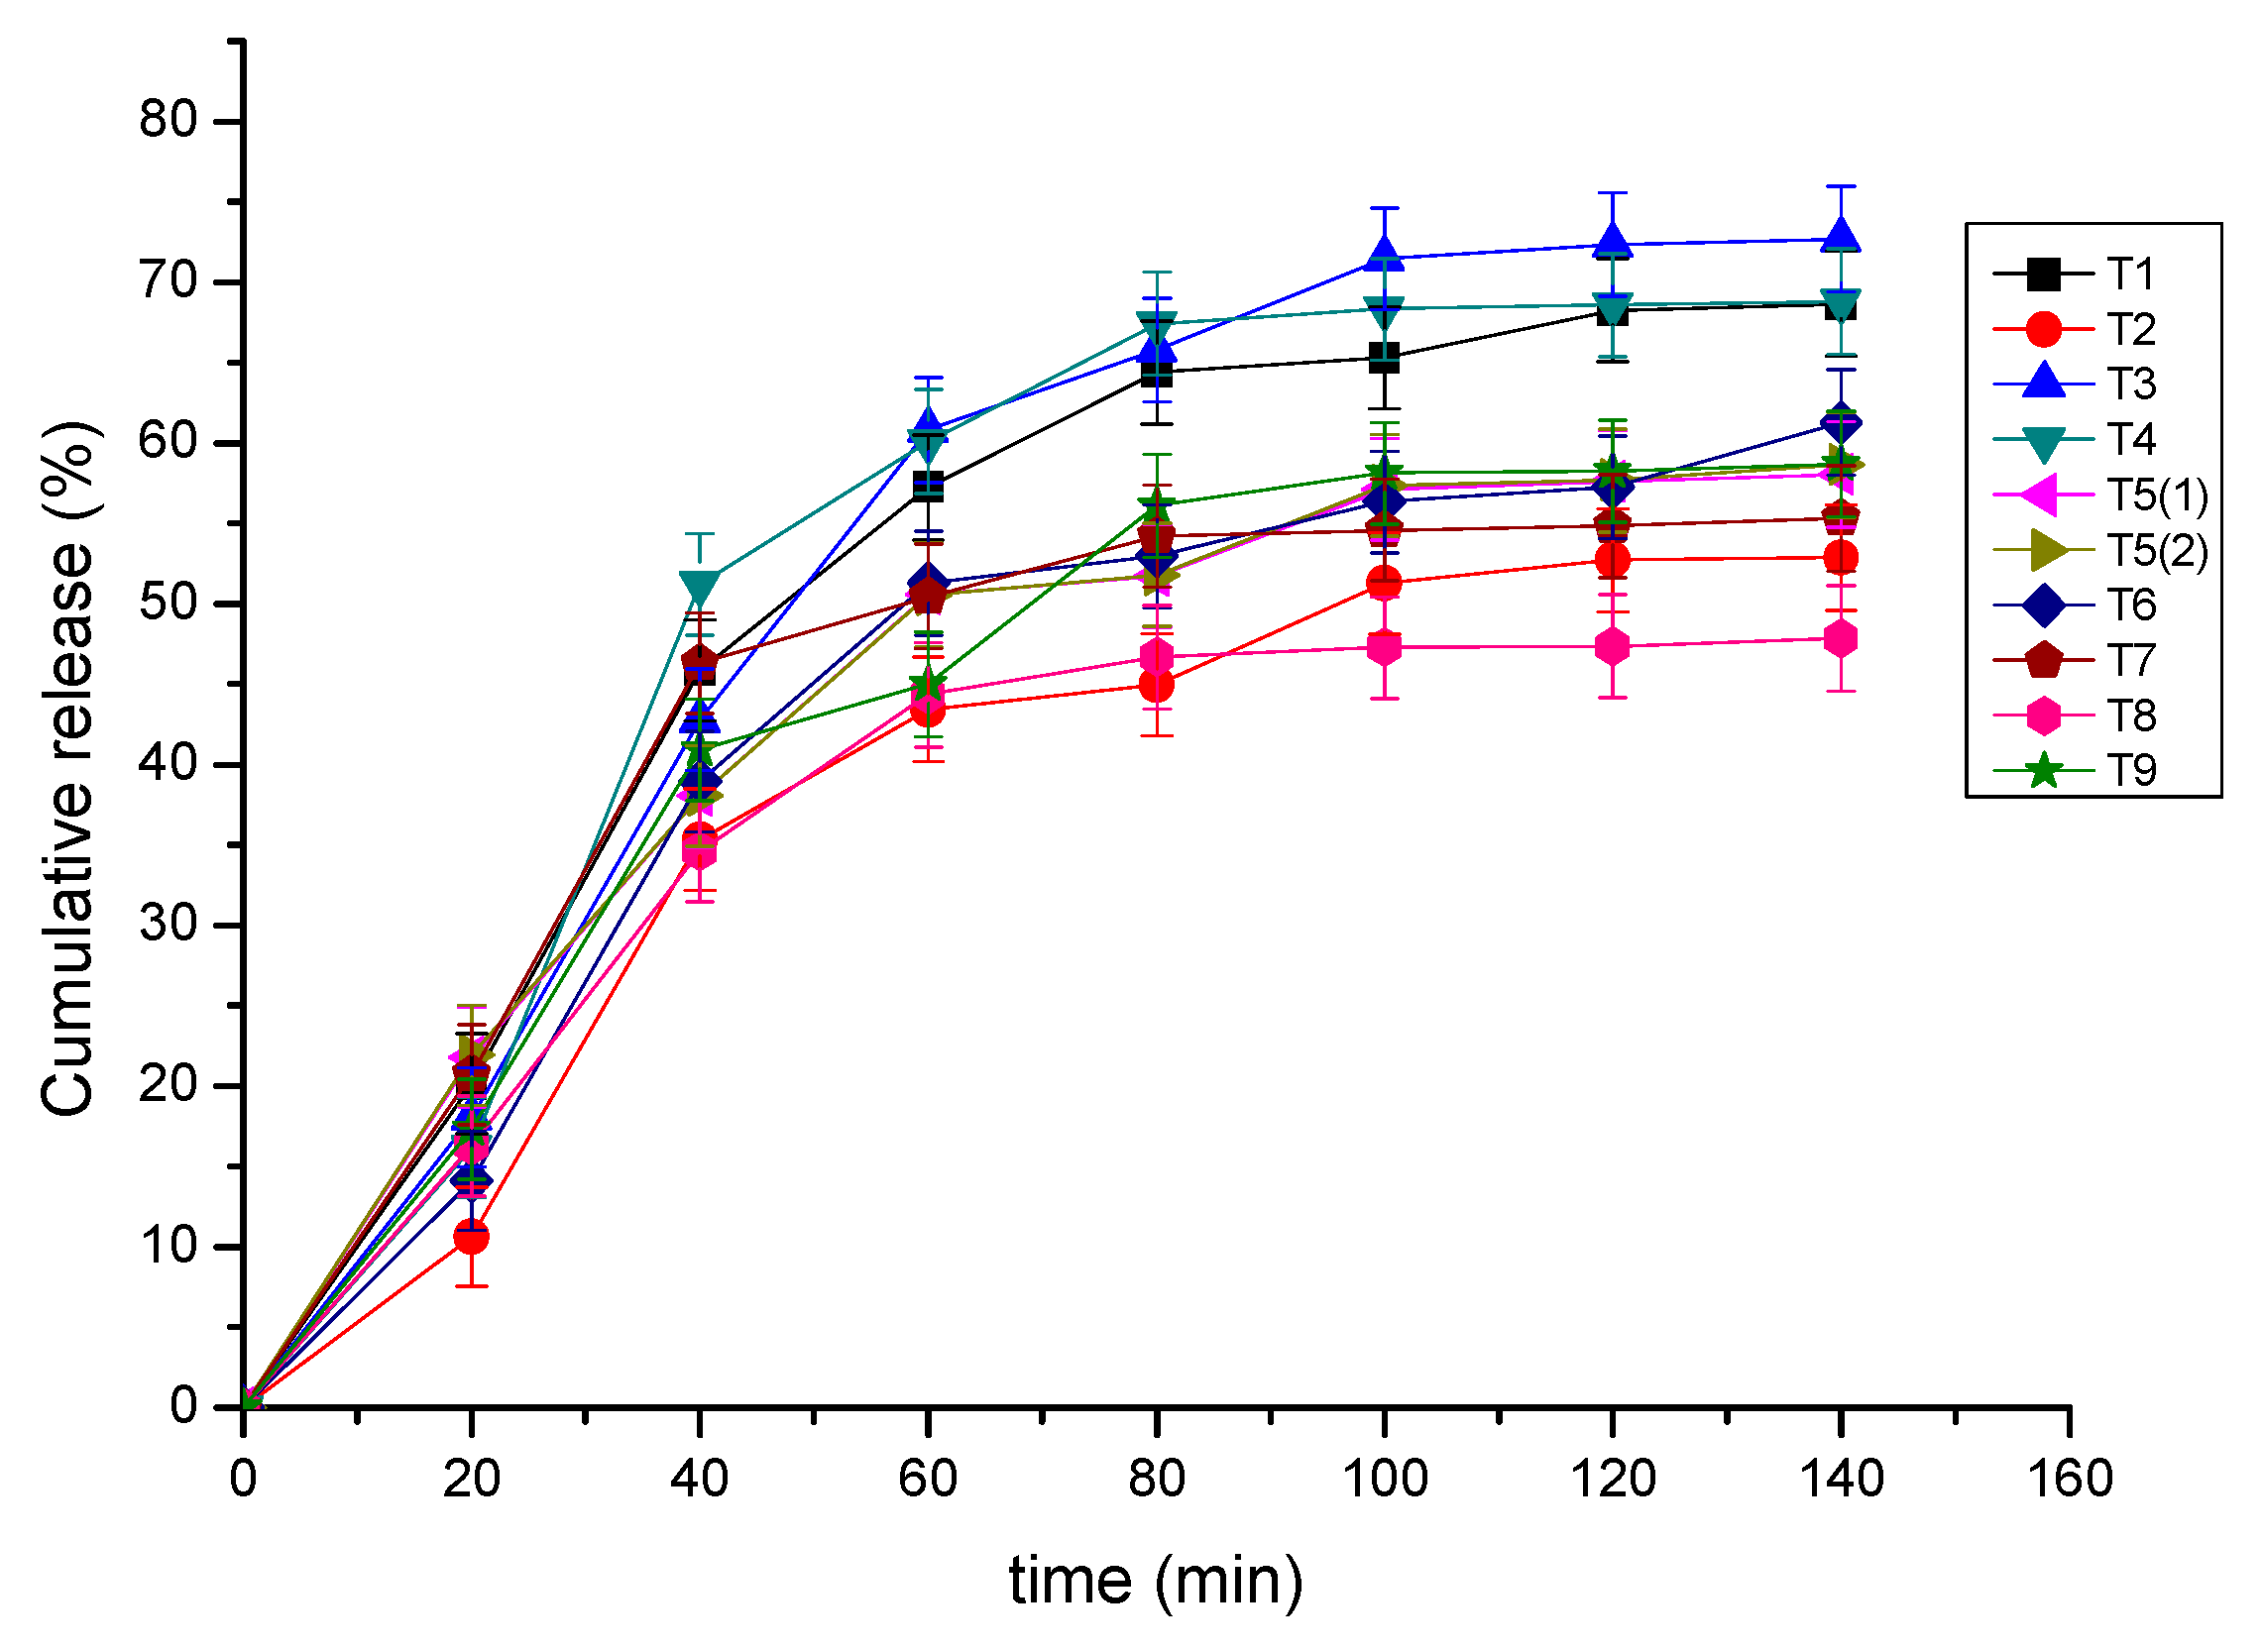
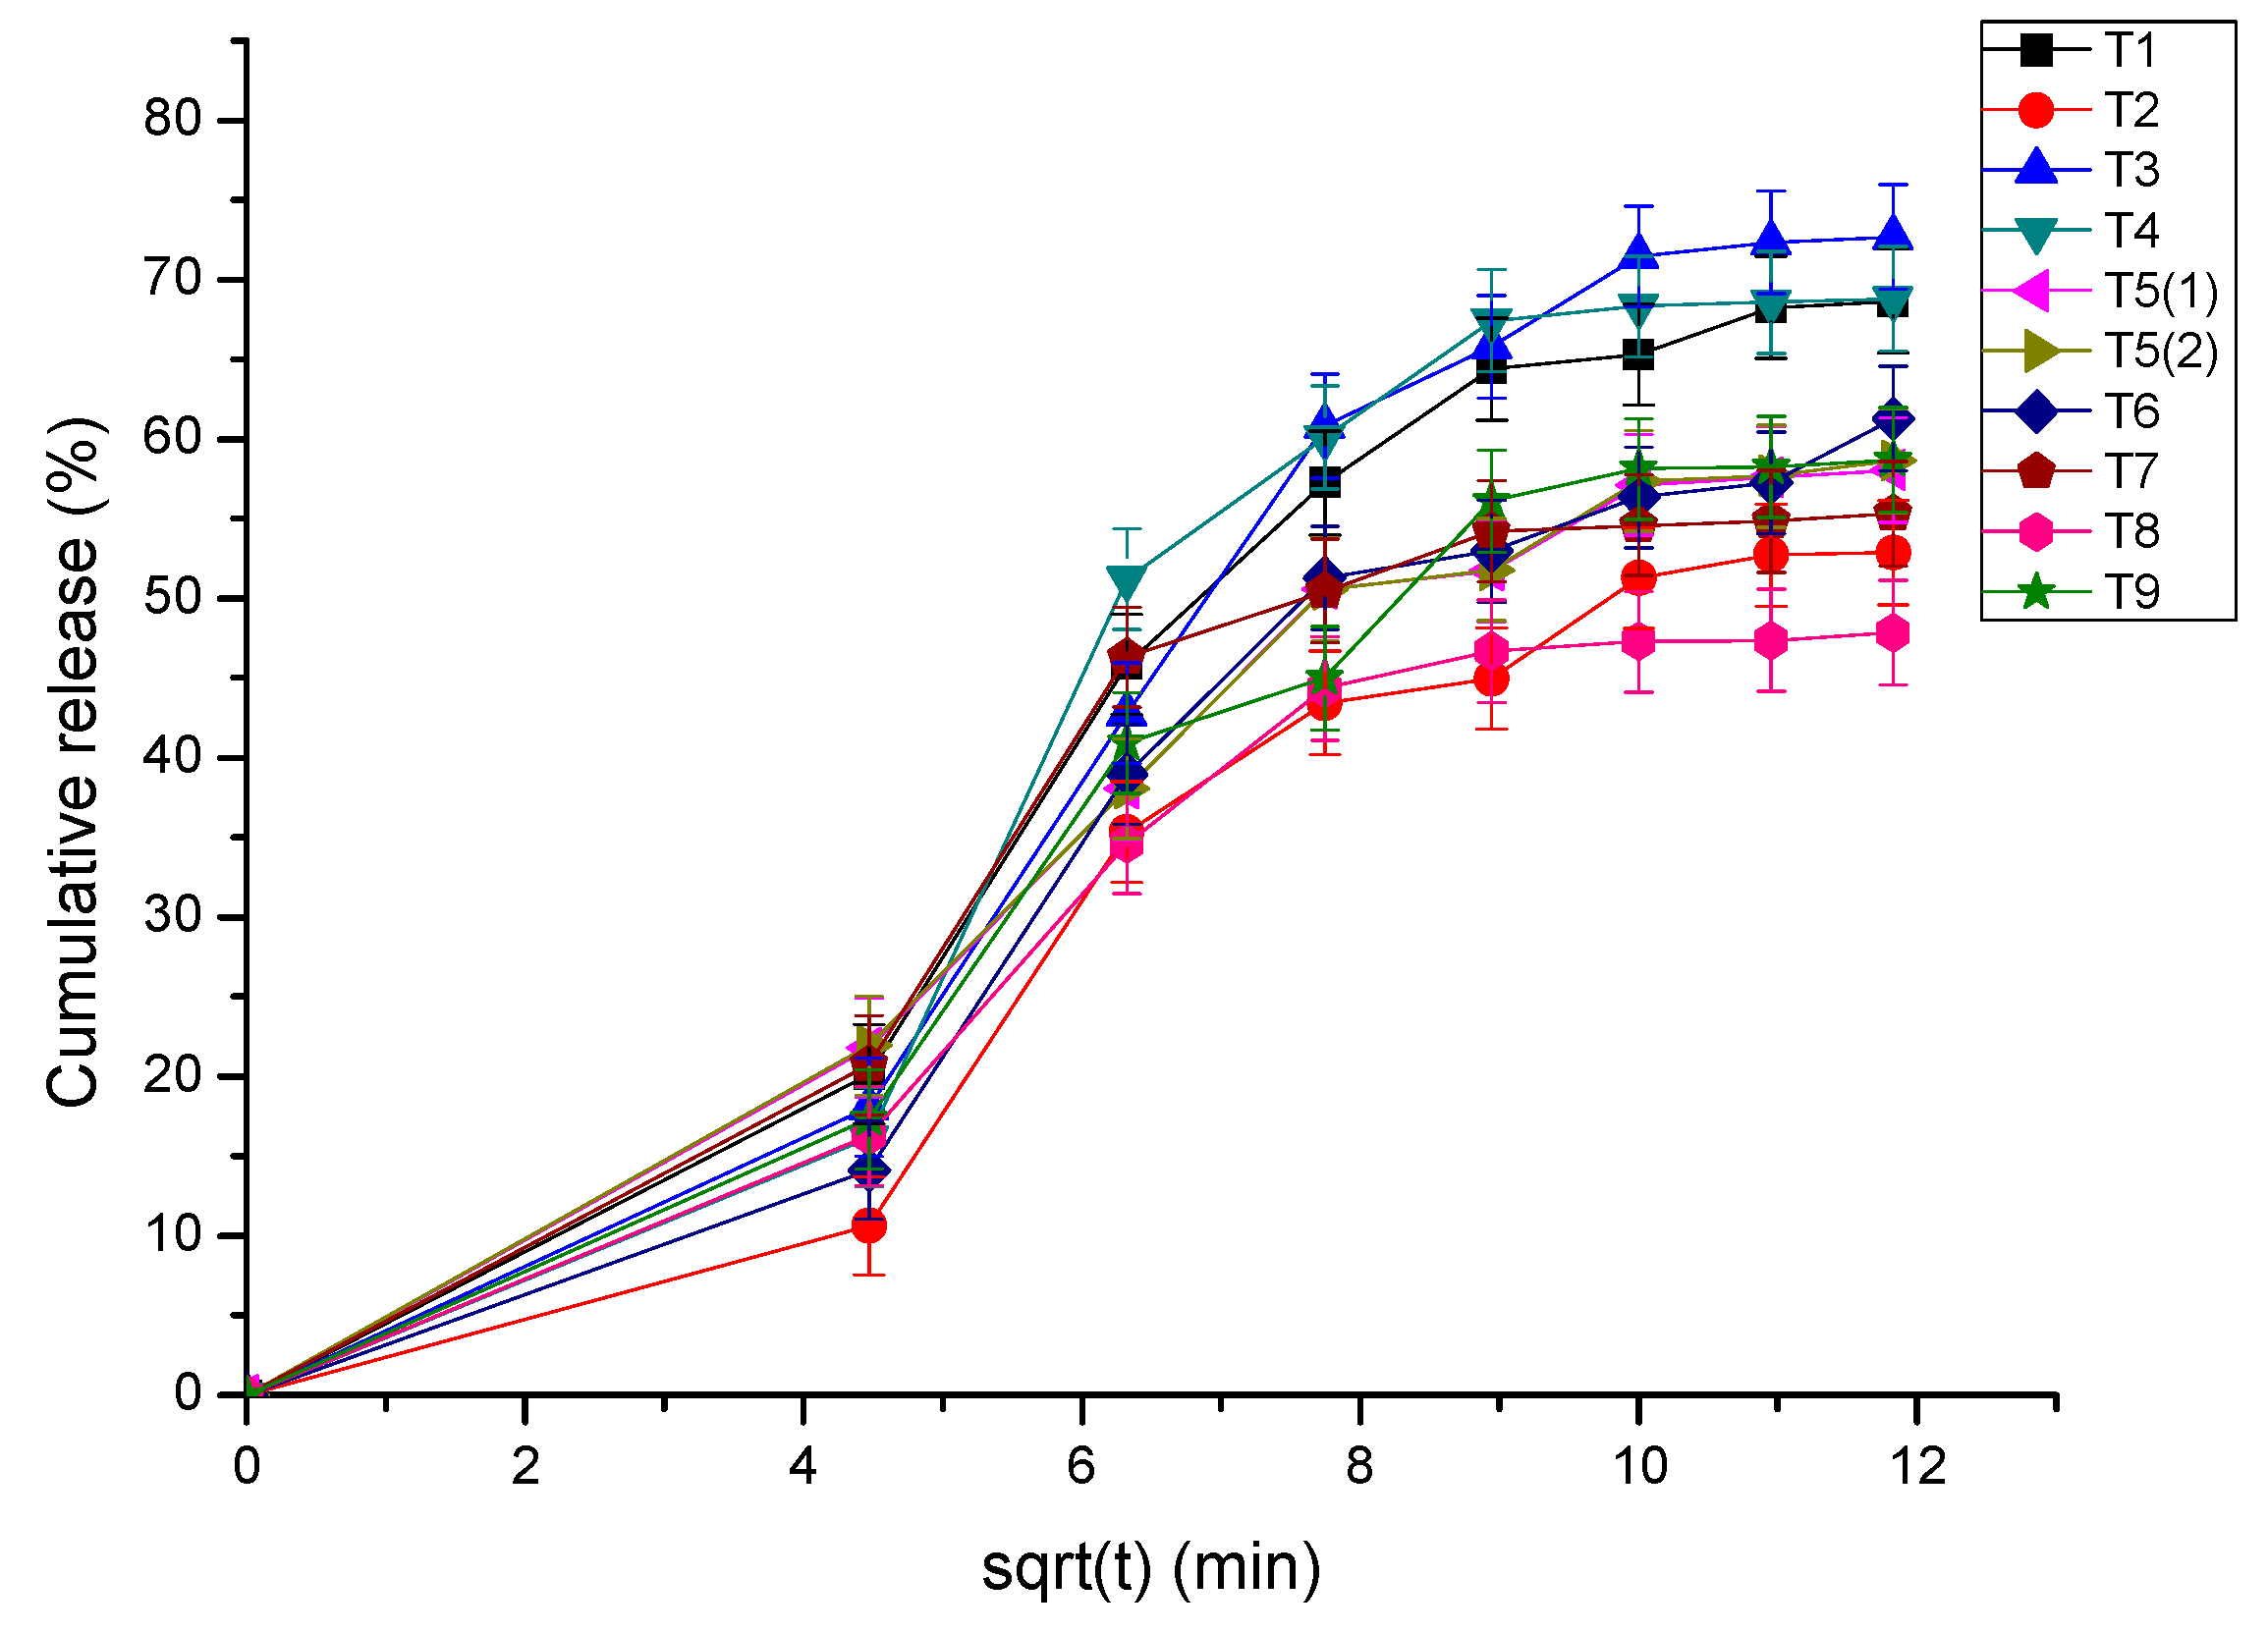
3.4. Dissolution Testing

In the present work, tablet dissolution testing, a crucial test during the development and the manufacturing of pharmaceutical tablets, was performed using the PHARMATEST-DT 70 apparatus. The sustained release profile of the pharmaceutical tablets at 37 ± 0.5 °C and at pH 1.2 showed a delayed burst release effect at 20 min (20% drug release) compared to that of the inclusion complex at the same time interval (70%). This fact indicates that the combination of the excipients led to the retardation of active ingredient release. The rapid rise was gradually reduced at 120 min and followed by a stable “plateau” (Figure 11). It is observed that T3 presents the highest release rate while T8, which contains the same amount of CaP but a higher amount of β-CD-4-MU ICs and a lower amount of microcrystalline cellulose, presents the lowest drug release rate.
The kinetic models for the release profile of 4-methyl-umbelliferone from tablets at pH 1.2 at 37 ± 0.5 °C are shown in Table 9.
The kinetic modeling revealed that the release profile is best described by the Higuchi model (Figure 12). In particular, the diffusion exhibitor n is very close to 1 indicating swelling and diffusion as the release mechanism. It is noted that during the experimental process of release, initially there was swelling of the tablet and a gradual diffusion of the compound into the aqueous medium.

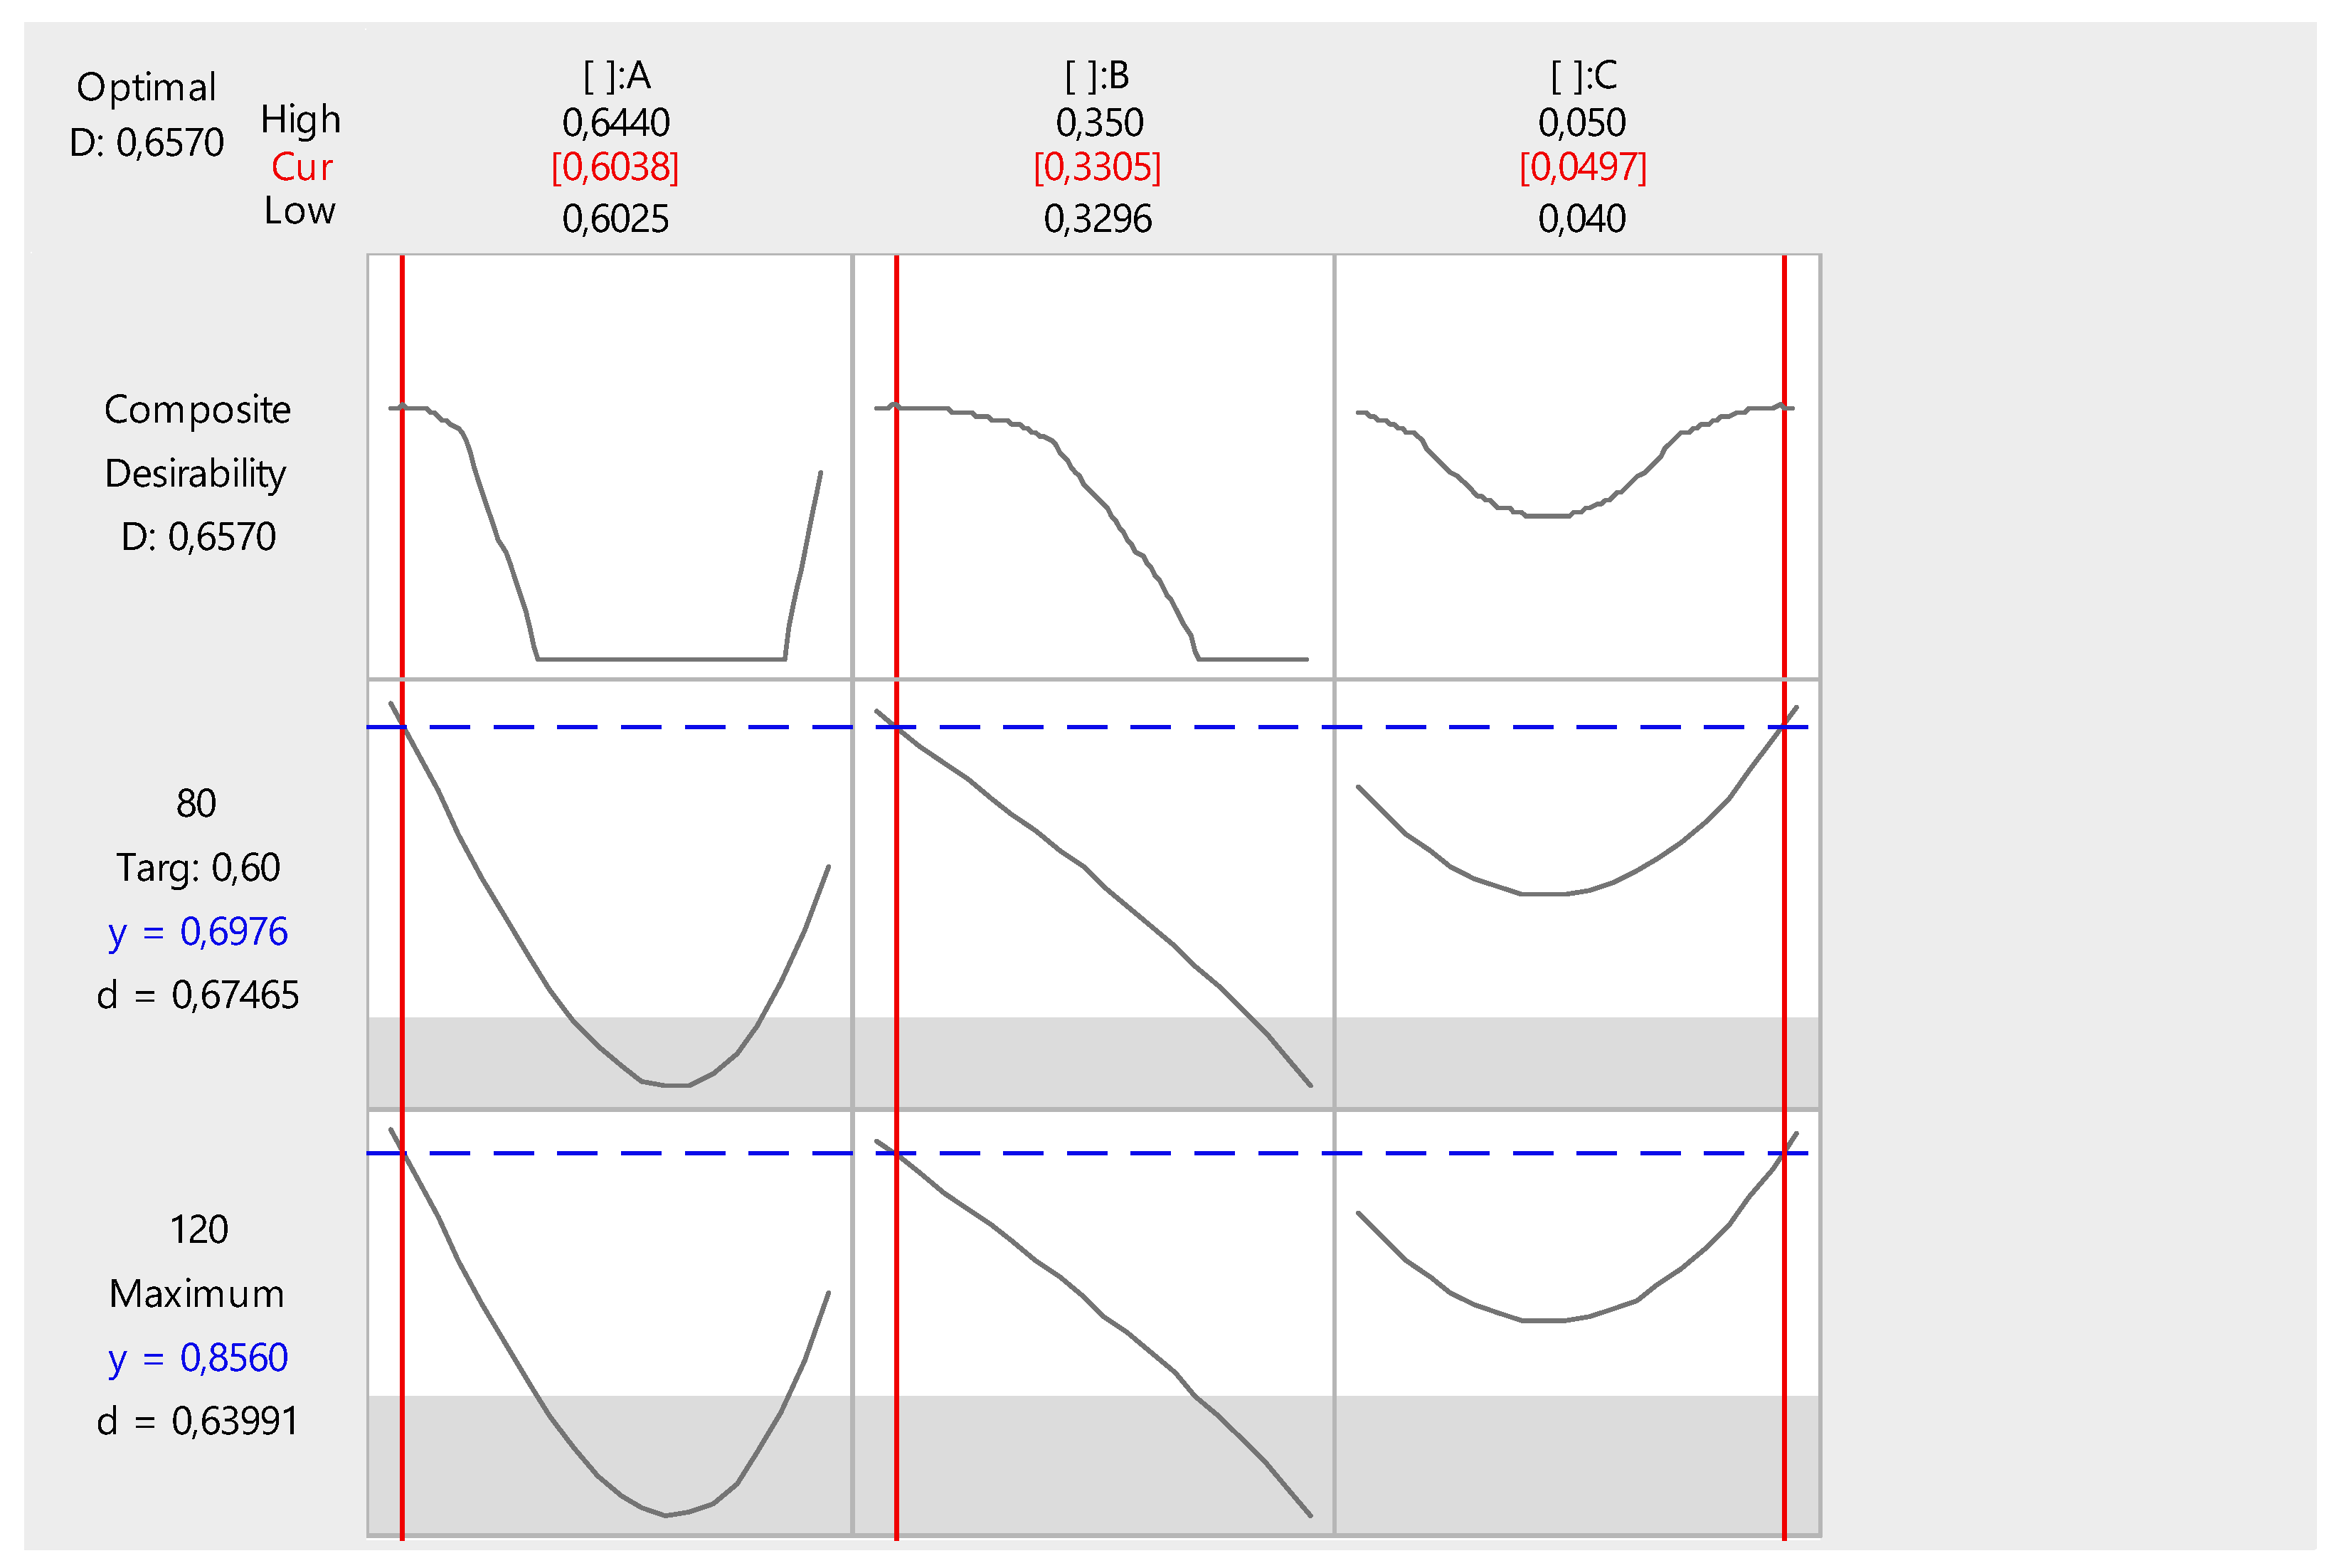
3.5. Formulation Optimization by Means of Extreme Vertices Mixture Design

The results indicate that the point t = 80 min marks the boundary between two areas of dissolution: one of rapid change and one of slow change. The dissolved fractions at times 80 and 120 min are presented in Table 10.
With the response variables for the dissolution profile in an extreme vertices mixture design (EVMD) selected as f80 and f120, the following model is generated:
𝛶80 = 645.69x1 − 4107.58x2 + 4926.79x3 + 6872.55x1x2 − 7563.73x1x3 − 7718.50x1x2(x1x2)
𝛶120 = 809.42x1 − 5151.98x2 + 6160.96x3 + 8621.45x1x2 − 9455.16x1x3 − 9682.48x1x2(x1x2)
where x1, x2, and x3 are the mass fractions of the β-CD-4-MU inclusion complex, the microcrystalline cellulose (MCC), and the calcium phosphate (CaP), respectively. The quadratic model plus a full cubic term is selected based on the multiple correlation coefficient (R2 > 94%) and the adjusted multiple correlation coefficient (adj-R2 > 88%). The interaction term x2x3 is not included as it corresponds to a p > 0.05.
The coefficient of x2 is negative, as MCC improves the compatibility of the compression mix at high proportions (x2 > 0.2). On the contrary, the coefficient of the term x1x2 is positive, indicating the positive effect on dissolution, meaning that the interaction of the complex and MCC produces higher quantities of dissolved 4-MU.
The optimization plot for the response variables and desirability is given in Figure 13. The optimization analysis revealed that an optimum exists for x1 = 150.95 mg (0.6038 coded), x2 = 82.65 mg (0.3305 coded), and x3 = 12.40 mg (0.0497 coded). It is worth mentioning that the value of composite desirability is obtained by setting the target values f80 and f120 to 0.6 and 1 (maximum), respectively.

4. Conclusions

In the present work, the natural product 4-methyl-umbelliferone was encapsulated in the β-CD cavity, forming β-CD-4-MU ICs, via the co-precipitation method. The obtained ICs presented significant and improved LOX inhibitory activity (IC50 10 μM) compared to the pure 4-MU. The ICs were successfully incorporated for the first time into pharmaceutical tablets, in which the β-cyclodextrin of the ICs also served as an excipient. The in vitro dissolution studies of the natural product 4-MU from the pharmaceutical tablets (studied at pH 1.2) showed a delayed burst release effect at 20 min (70% drug release) compared to that of the inclusion complex at the same time interval (20%), attributed to the influence of the excipients’ combination on the dissolution of 4-MU as well as its release in the aqueous medium. The release kinetics study indicated that the kinetic model that describes best the release profile of 4-MU from both the ICs and the tablets is the Higuchi model, while the Kosmeyer–Peppas model postulated that the release mechanism is swelling and diffusion. The study of the effect of the excipient composition on the release of 4-MU from the tablets and the optimization of the pharmaceutical tablet formulation using design of experiment (DoE) revealed that an optimum composition of the pharmaceutical tablets exists for x1 = 150.95 mg β-CD-4-MU ICs, x2 = 82.65 mg MCC, and x3 = 12.40 mg CaP.

Author Contributions

Conceptualization, A.D. and E.K. (Eleni Kavetsou); methodology, E.K. (Eleni Kavetsou), I.P., N.G.D., S.K., E.K. (Eftichia Kritsi) and E.P.; software, E.K. (Eleni Kavetsou), I.P. and N.G.D.; resources, A.D.; writing—original draft preparation, E.K. (Eleni Kavetsou), I.P., N.G.D., S.K. and E.K. (Eftichia Kritsi); writing—review and editing, E.K. (Eleni Kavetsou), P.Z., E.P., D.H.-L., D.T.H. and A.D.; supervision, A.D.; project administration, A.D. All authors have read and agreed to the published version of the manuscript.

Funding

This research received no external funding.

Institutional Review Board Statement

Not applicable.

Informed Consent Statement

Not applicable.

Data Availability Statement

All data generated or analyzed during this study are included in this published article.

Acknowledgments

I.P. would like to acknowledge financial support from the Leventis Foundation (Scholarship for PhD studies).

Conflicts of Interest

The authors declare no conflict of interest.

References

  1. Mantri, R.V.; Sanghvi, R.; Zhu, H.J. Chapter 1-Solubility of Pharmaceutical Solids. In Developing Solid Oral Dosage Forms, 2nd ed.; Qiu, Y., Chen, Y., Zhang, G.G., Yu, L., Mantri, R.V., Eds.; Academic Press: Cambridge, MA, USA, 2017; pp. 3–22. [Google Scholar] [CrossRef]
  2. Abaci, A.; Gedeon, C.; Kuna, A.; Guvendiren, M. Additive Manufacturing of Oral Tablets: Technologies, Materials and Printed Tablets. Pharmaceutics 2021, 13, 156. [Google Scholar] [CrossRef] [PubMed]
  3. Kavetsou, E.; Gkionis, L.; Galani, G.; Gkolfinopoulou, C.; Argyri, L.; Pontiki, E.; Chroni, A.; Hadjipavlou-Litina, D.; Detsi, A. Synthesis of prenyloxy coumarin analogues and evaluation of their antioxidant, lipoxygenase (LOX) inhibitory and cytotoxic activity. Med. Chem. Res. 2017, 26, 856–866. [Google Scholar] [CrossRef]
  4. Tamura, R.; Yokoyama, Y.; Yoshida, H.; Imaizumi, T.; Mizunuma, H. 4-Methylumbelliferone inhibits ovarian cancer growth by suppressing thymidine phosphorylase expression. J. Ovarian Res. 2014, 7, 94. [Google Scholar] [CrossRef] [PubMed]
  5. Fang, Y.; Wang, H.; Zhu, W.; Wang, L.; Liu, H.; Xu, X.; Yin, W.; Sima, Y.; Xu, S. Antioxidative properties of 4-methylumbelliferone are related to antibacterial activity in the silkworm (Bombyx mori) digestive tract. J. Comp. Physiol. B 2014, 184, 699–708. [Google Scholar] [CrossRef]
  6. Šarkanj, B.; Molnar, M.; Čačić, M.; Gille, L. 4-Methyl-7-hydroxycoumarin antifungal and antioxidant activity enhancement by substitution with thiosemicarbazide and thiazolidinone moieties. Food Chem. 2013, 139, 488–495. [Google Scholar] [CrossRef] [PubMed]
  7. Maynard, R. The Merck Index: 12th edition 1996. Occup. Environ. Med. 1997, 54, 288. [Google Scholar] [CrossRef]
  8. Kesente, M.; Kavetsou, E.; Roussaki, M.; Blidi, S.; Loupassaki, S.; Chanioti, S.; Siamandoura, P.; Stamatogianni, C.; Philippou, E.; Papaspyrides, C.J.B.; et al. Encapsulation of olive leaves extracts in biodegradable PLA nanoparticles for use in cosmetic formulation. Bioengineering 2017, 4, 75. [Google Scholar] [CrossRef]
  9. Roy, N.; Ghosh, B.; Roy, D.; Bhaumik, B.; Roy, M.N. Exploring the Inclusion Complex of a Drug (Umbelliferone) with α-Cyclodextrin Optimized by Molecular Docking and Increasing Bioavailability with Minimizing the Doses in Human Body. ACS Omega 2020, 5, 30243–30251. [Google Scholar] [CrossRef] [PubMed]
  10. Halahlah, A.; Kavetsou, E.; Pitterou, I.; Grigorakis, S.; Loupassaki, S.; Tziveleka, L.-A.; Kikionis, S.; Ioannou, E.; Detsi, A. Synthesis and characterization of inclusion complexes of rosemary essential oil with various β-cyclodextrins and evaluation of their antibacterial activity against Staphylococcus aureus. J. Drug Deliv. Sci. Technol. 2021, 65, 102660. [Google Scholar] [CrossRef]
  11. Kavetsou, E.; Pitterou, I.; Katopodi, A.; Petridou, G.; Adjali, A.; Grigorakis, S.; Detsi, A. Preparation, Characterization, and Acetylcholinesterase Inhibitory Ability of the Inclusion Complex of β-Cyclodextrin–Cedar (Juniperus phoenicea) Essential Oil. Micro 2021, 1, 250–266. [Google Scholar] [CrossRef]
  12. Kotronia, M.; Kavetsou, E.; Loupassaki, S.; Kikionis, S.; Vouyiouka, S.; Detsi, A. Encapsulation of oregano (Origanum onites L.) essential oil in β-cyclodextrin (β-CD): Synthesis and characterization of the inclusion complexes. Bioengineering 2017, 4, 74. [Google Scholar] [CrossRef]
  13. Saokham, P.; Muankaew, C.; Jansook, P.; Loftsson, T. Solubility of Cyclodextrins and Drug/Cyclodextrin Complexes. Molecules 2018, 23, 1161. [Google Scholar] [CrossRef]
  14. Conceição, J.; Adeoye, O.; Cabral-Marques, H.M.; Lobo, J.M.S. Cyclodextrins as excipients in tablet formulations. Drug Discov. Today 2018, 23, 1274–1284. [Google Scholar] [CrossRef] [PubMed]
  15. Carneiro, S.B.; Costa Duarte, F.Í.; Heimfarth, L.; Siqueira Quintans, J.D.S.; Quintans-Júnior, L.J.; Veiga Júnior, V.F.D.; De Lima, A.N. Cyclodextrin-drug inclusion complexes: In vivo and in vitro approaches. Int. J. Mol. Sci. 2019, 20, 642. [Google Scholar] [CrossRef]
  16. Novac, M.; Musuc, A.M.; Ozon, E.A.; Sarbu, I.; Mitu, M.A.; Rusu, A.; Gheorghe, D.; Petrescu, S.; Atkinson, I.; Lupuliasa, D. Manufacturing and Assessing the New Orally Disintegrating Tablets, Containing Nimodipine-hydroxypropyl-β-cyclodextrin and Nimodipine-methyl-β-cyclodextrin Inclusion Complexes. Molecules 2022, 27, 2012. [Google Scholar] [CrossRef] [PubMed]
  17. Maestrelli, F.; Cirri, M.; De Luca, E.; Biagi, D.; Mura, P. Role of Cyclodextrins and Drug Solid State Properties on Flufenamic Acid Dissolution Performance from Tablets. Pharmaceutics 2022, 14, 284. [Google Scholar] [CrossRef] [PubMed]
  18. Rincón-López, J.; Almanza-Arjona, Y.C.; Riascos, A.P.; Rojas-Aguirre, Y. When Cyclodextrins Met Data Science: Unveiling Their Pharmaceutical Applications through Network Science and Text-Mining. Pharmaceutics 2021, 13, 1297. [Google Scholar] [CrossRef]
  19. Kiskan, B.; Yagci, Y. Thermally curable benzoxazine monomer with a photodimerizable coumarin group. J. Polym. Sci. Part A Polym. Chem. 2007, 45, 1670–1676. [Google Scholar] [CrossRef]
  20. Roussaki, M.; Zelianaios, K.; Kavetsou, E.; Hamilakis, S.; Hadjipavlou-Litina, D.; Kontogiorgis, C.; Liargkova, T.; Detsi, A. Structural modifications of coumarin derivatives: Determination of antioxidant and lipoxygenase (LOX) inhibitory activity. Bioorg. Med. Chem. 2014, 22, 6586–6594. [Google Scholar] [CrossRef]
  21. Mircioiu, C.; Voicu, V.; Anuta, V.; Tudose, A.; Celia, C.; Paolino, D.; Fresta, M.; Sandulovici, R.; Mircioiu, I. Mathematical Modeling of Release Kinetics from Supramolecular Drug Delivery Systems. Pharmaceutics 2019, 11, 140. [Google Scholar] [CrossRef] [PubMed]
  22. Wu, I.Y.; Bala, S.; Škalko-Basnet, N.; di Cagno, M.P. Interpreting non-linear drug diffusion data: Utilizing Korsmeyer-Peppas model to study drug release from liposomes. Eur. J. Pharm. Sci. 2019, 138, 105026. [Google Scholar] [CrossRef]
  23. Kamaly, N.; Yameen, B.; Wu, J.; Farokhzad, O.C. Degradable Controlled-Release Polymers and Polymeric Nanoparticles: Mechanisms of Controlling Drug Release. Chem. Rev. 2016, 116, 2602–2663. [Google Scholar] [CrossRef] [PubMed]
  24. Uddin, S.; Al Mamun, A.; Hossain, S.; Asaduzzaman; Sarwar, S.; Rashid, M.; Herrera-Calderon, O. In vitro quality evaluation of leading brands of ciprofloxacin tablets available in Bangladesh. BMC Res. Notes 2017, 10, 185. [Google Scholar] [CrossRef] [PubMed]
  25. Martinello, T.; Kaneko, T.M.; Velasco, M.V.R.; Taqueda, M.E.S.; Consiglieri, V.O. Optimization of poorly compactable drug tablets manufactured by direct compression using the mixture experimental design. Int. J. Pharm. 2006, 322, 87–95. [Google Scholar] [CrossRef] [PubMed]
  26. Thoorens, G.; Krier, F.; Leclercq, B.; Carlin, B.; Evrard, B. Microcrystalline cellulose, a direct compression binder in a quality by design environment-A review. Int. J. Pharm. 2014, 473, 64–72. [Google Scholar] [CrossRef]
  27. Upadhyay, S.K.; Ali, S.M. Molecular recognition of flunarizine dihydrochloride and β-cyclodextrin inclusion complex by NMR and computational approaches. Chem. Cent. J. 2018, 12, 33. [Google Scholar] [CrossRef]
  28. Gao, S.; Jiang, J.-Y.; Liu, Y.-Y.; Fu, Y.; Zhao, L.-X.; Li, C.-Y.; Ye, F. Enhanced Solubility, Stability, and Herbicidal Activity of the Herbicide Diuron by Complex Formation with β-Cyclodextrin. Polymers 2019, 11, 1396. [Google Scholar] [CrossRef]
  29. Da Rocha Ferreira, F.; Valentim, I.B.; Ramones, E.L.C.; Trevisan, M.T.S.; Olea-Azar, C.; Perez-Cruz, F.; de Abreu, F.C.; Goulart, M.O.F. Antioxidant activity of the mangiferin inclusion complex with β-cyclodextrin. LWT-Food Sci. Technol. 2013, 51, 129–134. [Google Scholar] [CrossRef]
  30. Dos Santos Lima, B.; Shanmugam, S.; de Souza Siqueira Quintans, J.; Quintans-Júnior, L.J.; de Souza Araújo, A.A. Inclusion complex with cyclodextrins enhances the bioavailability of flavonoid compounds: A systematic review. Phytochem. Rev. 2019, 18, 1337–1359. [Google Scholar] [CrossRef]
Figure 1. Chemical structure of 4-methyl-umbelliferone.
Micro 03 00061 g001
Figure 2. 1H NMR spectrum (600 MHz, D2O): (a) β-CD in the range of 3.5–5.2 ppm, and (b) β-CD-4-MU in the 3.5–5.3 ppm range.
Micro 03 00061 g002aMicro 03 00061 g002b
Figure 3. Truncated conical structure of β-cyclodextrin (host) with the interior and exterior protons.
Micro 03 00061 g003
Figure 4. Expansion of the 2D ROESY spectrum of 4-MU/β-CD (1:1) in D2O. The correlation signals are depicted with red circles.
Micro 03 00061 g004
Figure 5. (A) Encapsulation of the 4-MU molecule within the cavity of β-CD in 3D representation and (B) proton correlations among the host and the guest molecules.
Micro 03 00061 g005
Figure 6. FT-IR (KBr) spectra of (a) 4-MU, (b) β-CD, and (c) the β-CD-4-MU inclusion complex.
Micro 03 00061 g006
Figure 7. The comparative TGA graphs of the free β-CD (black line), 4-MU (red line), β-CD-4-MU complex (blue line), and physical mixture β-CD-4-MU (green line).
Micro 03 00061 g007
Figure 8. SEM images of the β-CD-4-MU inclusion complex at (a) ×1000, (b) ×2500, (c) ×3000, and (d) ×5000 magnification.
Micro 03 00061 g008
Figure 9. Cumulative release of 4-methyl-umbelliferone from β-CD-4-MU ICs at pH 1.2, pH 6.8, and pH 7.4 at 37 ± 0.5 °C.
Micro 03 00061 g009
Figure 10. Higuchi release profile of 4-methyl-umbelliferone from β-CD—4-methyl-umbelliferone Ics in pH 1.2, pH 7.4, and pH 6.8 at 37 ± 0.5 °C.
Micro 03 00061 g010
Figure 11. Cumulative release of 4-methyl-umbelliferone from pharmaceutical tablets at pH 1.2 at 37 ± 0.5 °C.
Micro 03 00061 g011
Figure 12. Higuchi release profile of 4-methyl-umbelliferone from tablets in pH 1.2 at 37 ± 0.5 °C.
Micro 03 00061 g012
Figure 13. Mixture design optimization plot for the response variables and desirability. The value of composite desirability is obtained by setting the target values f80 and f120 to 0.6 and 1 (maximum), respectively.
Micro 03 00061 g013
Table 1. Quantities of the excipients and of the active ingredient in the tested tablets TT1-TT10 for determining the critical quality attributes (CQA).
Tablet β-CD-4-MU IC (mg)β-CD
(mg)
4-MU (mg)Lactose (mg)Microcrystalline Cellulose (MCC) (mg)Calcium Phosphate (CaP)
(mg)
Magnesium Stearate (Mg-St)
(mg)
Starch
(St)
(mg)
Total Tablet Mass (mg)Hardness (N)
TT1-150-3040262225019
TT2-150-3040262225069
TT3-150-3040262225073
TT4-150-2460122225077
TT5-150--841222250110
TT6-150--84122225083
TT7-150--841222250110
TT8150---841222250156
TT9-13515-841222250108
TT10150---841222250149
Table 2. Factor variables and ranges applied for tablet formulation.
IngredientFactorLowHigh
β-CDx10.550.65
MCCx20.300.35
CaPx30.040.05
Table 3. Quantities of the excipients in the pharmaceutical tablets.
Tabletβ-CD-4-MU Inclusion Complex
X1 (mg)
Microcrystalline
Cellulose (MCC)
X2 (mg)
Calcium Phosphate (CaP)
X3 (mg)
Starch
(St)
X4 (mg)
Magnesium Stearate (Mg-St)
X5 (mg)
Τ1161.0075.0010.002.002.00
Τ2156.00078.1311.872.002.00
Τ3151.00084.3710.632.002.00
Τ4149.7584.3811.872.002.00
Τ5 (i, ii) *153.5081.2511.252.002.00
Τ6158.5075.0012.502.002.00
Τ7146.0087.5012.502.002.00
Τ8157.2578.1210.632.002.00
Τ9148.5087.5010.002.002.00
* This experimental design includes 2 experimental runs at the center point.
Table 4. Characterization of the β-CD-4-MU inclusion complexes: size, size distribution (PdI), zeta-potential, inclusion efficiency, and process yield.
Molar ratio β-CD:4-MU (mol)β-CD (gr)Size (nm)Polydispersity Index (PdI)Zeta-Potential (mV)Process
Yield %
Inclusion
Efficiency (IE) %
2:10.5917.9 ± 127.50.709 ± 0.087−16.8 ± 2.66957
1:10.5145.6 ± 52.00.370 ± 0.025−29.5 ± 1.47875
1:14271.0 ± 20.50.367 ± 0.065−29.1 ± 0.98277
Table 5. Chemical shift changes of 1H-NMR signals of β-CD and β-CD–4-MU ICs in deuterium oxide (D2O).
ProtonChemical Shifts (δ1) of
β-CD Protons (ppm)
Chemical Shifts (δ2) of β-CD Protons in β-CD—ICs (ppm)Δδ = δ2 − δ1 (ppm)
H-1′5.0855.076−0.009
H-2′3.6643.652−0.012
H-3′3.9803.965−0.015
H-4′3.5993.595−0.004
H-5′3.8933.845−0.048
H-6′3.8933.884−0.009
Table 6. Characteristic absorption bands of the pure β-CD and 4-MU as well as of the inclusion complex.
SampleO–H Stretching VibrationC–H Stretching Vibration (Aromatic Ring)C–H Stretching VibrationC=O
Stretching Vibration
Asymmetric
C–H Stretching (-CH2)
C=C
Stretching Vibration
(Aromatic Ring)
O–H Bending VibrationC–H in Plane Bending Vibration
(Aromatic Ring)
C-O Stretching Vibration of the Secondary AlcoholC–O Stretching Vibration of Phenols
4-MU-3155-1680-160113901274-1067
β-CD3377-2925-1643-1415-1029-
β-CD-4-MU3389-292717081630-1417-10301079
Table 7. Results of the in vitro assessment of the bioactivity of 4-MU, β-CD, and β-CD-4-MU.
%DPPH Scavenging
Ability ± SD #
(100 μM)
20/60 min
% Lipid Peroxidation Inhibition
(AAPH) ± SD #
(100 μM)
Inhibition of Soybean Lipoxygenase Enzyme
(LOX)
IC50 (μΜ) ± SD #
4-MUNo/No93 ± 1.5No
β-CDNo/No18 ± 0.651.5 ± 1.7
β-CD-4-MU63 (±2.2)/78 (±3.1)100 ± 2.610.0 ± 0.2
Trolox-88 ± 0.8-
NDGA84 (±1.6)/83 (±1.8)-0.45 ± 0.1
SD # standard deviation.
Table 8. The values of R2 for each kinetic release model, the transport exponent (n), and the equation of the Higuchi kinetic model of the release of the β-CD-4-MU complex at pH 1.2, pH 7.4, and pH 6.8 at 37 ± 0.5 °C.
pHZero-OrderFirst-OrderHiguchiKorsmeyer–PeppasHiguchi
R2R2R2R2R2nEquation
1.20.8080.3410.9410.8720.9151y = 2.003x + 78.58
7.40.5390.3650.8230.8930.8787y = 6.142x + 16.95
6.80.6630.4270.8990.9170.9144y = 7.369x + 12.73
Table 9. R2 values for each kinetic release model, the transport exponent (n), and the equation of the Higuchi kinetic model at pH 1.2 at 37 ± 0.5 °C.
TabletZero-OrderFirst-OrderHiguchiKorsmeyer–PeppasHiguchi
R2R2R2R2nEquation
10.7750.5360.9250.9680.8865y = 6.377x + 0.6819
20.7990.5940.9150.9710.8454y = 4.9163x − 0.9497
30.8700.5890.9570.9820.9047y = 6.8621x − 1.4428
40.6990.540.8590.9610.9003y = 6.358x + 1.6102
5 i0.7990.5230.9530.9650.8442y = 5.2721x + 2.1428
5 ii *0.9170.6480.9320.9900.845y = 5.3008x + 2.0575
60.8140.5770.9320.9750.8644y = 5.6027x − 0.6935
70.6940.4930.8900.9510.8393y = 5.004x + 4.4583
80.7950.5360.9460.9670.814y = 4.3748x + 2.4986
90.6780.5150.8570.9580.8556y = 5.4429x + 0.7738
* This experimental design includes 2 experimental runs at the center point.
Table 10. Experimental values of dissolved 4-MU.
Runx1x2x3f80f120
10.64400.30000.04000.57720.7054
20.62400.31250.04750.43470.5355
30.60400.33750.04250.60230.7421
40.59900.33750.04750.59320.7251
5 i0.61400.32500.04500.49290.5989
5 ii0.61400.32500.04500.494620.60116
60.63400.30000.05000.49410.6067
70.58400.35000.05000.49070.5908
80.62900.31250.04250.41780.5066
90.59400.35000.04000.49530.6055
Disclaimer/Publisher’s Note: The statements, opinions and data contained in all publications are solely those of the individual author(s) and contributor(s) and not of MDPI and/or the editor(s). MDPI and/or the editor(s) disclaim responsibility for any injury to people or property resulting from any ideas, methods, instructions or products referred to in the content.

