Article

Photodegradation of Tropaeolin O in the Presence of Ag-Doped ZnO Nanoparticles

by
Sonia J. Bailon-Ruiz
1,
Yarilyn Cedeño-Mattei
1,
Kerianys Torres-Torres
2 and
Luis Alamo-Nole
3,*
1
Department of Chemistry and Physics, University of Puerto Rico at Ponce, Ponce, PR 00716, USA
2
Department of Biology, University of Puerto Rico at Ponce, Ponce, PR 00716, USA
3
Department of Natural Sciences, Pontifical Catholic University of Puerto Rico, Ponce, PR 00717, USA
*
Author to whom correspondence should be addressed.
Micro 2023, 3(3), 643-652; https://doi.org/10.3390/micro3030045
Submission received: 18 July 2023 / Revised: 24 July 2023 / Accepted: 26 July 2023 / Published: 28 July 2023
(This article belongs to the Section Microscale Materials Science)

Abstract

:
Azo dyes such as Tropaeolin O have diverse applications in the textile, food, and biomedical industries. However, their recalcitrant properties make them toxic substances in surface waters. Nanocatalysts are photoactive nanoparticles that generate reactive oxygen species to destroy organic compounds. Moreover, the presence of dopant agents in the nanoparticles’ crystalline structure efficiently enhances photocatalytic activity. Ag-doped ZnO nanoparticles were prepared in ethylene glycol at 197 °C and characterized by UV-Vis absorption, photoluminescence, high-resolution transmission electron microscopy (HRTEM), energy dispersive X-ray spectroscopy (EDX), and electron diffraction (ED). The particles were mainly spherical with a size of ~10 nm, a hexagonal structure, and an elemental composition of 56.2% Zn, 37.8% O, and 5.9% Ag. The particles evidenced a broad absorption peak in the UV region and two emission peaks. Absorption analysis indicates that 92% and 58% of Tropaeolin O were degraded using 100 and 50 ppm of Ag-doped ZnO nanoparticles, respectively, during the first 550 min. Ion chromatograms selected using quadrupole time-of-flight liquid chromatography-mass spectrometry (QTOF-LC-MS) indicate a complete Tropaeolin O degradation (295.04 m/z) during the first 330 min. Initially, the nanocatalyst attacks the electron-rich groups (-OH and -NH), generating the 277.03 m/z [M-OH]+ and 174.02 m/z (molecule rupture on the azo group). In addition, small oxidized fragments 167.03 m/z and 114.03 m/z confirm the nanoparticles’ photocatalytic capacity, and oxidized chains indicate the tropaeolin’s opening rings (including phtalic acids) and mineralization.

1. Introduction

Tropaeolin O dye, a versatile and vibrant organic compound, has wide-ranging uses and applications across various industries, including textile, food, and biomedical industries. Its intense orange-red color makes it popular as a dye in the textile industry, where it is employed for fabric dyeing and printing. Additionally, Tropaeolin O dye is used as a pH indicator in laboratories, changing color based on the acidity or alkalinity of a solution and aiding in chemical analysis and titration [1]. In the food industry, this dye is a coloring agent in certain products, such as beverages and candies, enhancing their visual appeal [2]. Furthermore, its distinctive properties make Tropaeolin O dye valuable in biomedical research, where it has been employed as a staining agent to visualize and differentiate various cellular components under a microscope for several decades [3].
Tropaeolin O belongs to the azo dyes, characterized by the presence of one or more azo (-N=N-) chromophores, giving them their vibrant colors. The azo bonds in these dyes are relatively stable and not easily broken down. As a result, many azo dyes, including Tropaeolin O, persist in the environment for long periods of time. One of the concerns associated with Tropaeolin O dye is its potential to contaminate water bodies, as its use in various industries may result in its discharge into rivers, lakes, or groundwater, posing a threat to aquatic ecosystems and potentially compromising the quality of drinking water supplies.
There are several methods that can be employed to degrade dyes and mitigate their potential environmental impact. These methods include: biological degradation—utilizing microorganisms or enzymes to break down dye molecules [4,5]; chemical degradation—employing chemical agents or reactions to degrade the dye; and advanced oxidation processes (AOPs), such as ozonation, photocatalysis, or Fenton’s reagent (a mixture of hydrogen peroxide and iron salts) [6,7,8]. Furthermore, other methods involve adsorption—using adsorbents, such as activated carbon, zeolites, or clay minerals, to trap and remove the dye molecules from water [9,10]; electrochemical degradation—applying an electric current to facilitate the degradation of the dye [11]; and photodegradation—harnessing the power of sunlight or ultraviolet (UV) radiation to degrade the dye [12,13]. It is important to note that the choice of the degradation method depends on various factors, such as the specific dye concentration, the presence of other contaminants, and the available resources and infrastructure for treatment. Additionally, a combination of different methods might be necessary for more efficient and complete dye degradation.
Photodegradation using photoactive nanomaterials such as quantum dots (QDs) and metal oxides [14,15] offers several advantages as a method for degrading dyes such as Tropaeolin O. Some of the advantages of using nanomaterials for photodegradation include high photocatalytic efficiency, broad absorption spectrum, tunable properties, long-term stability, reusability, and reduced environmental impact as it does not require the use of harsh chemicals or generate harmful byproducts, contributing to a more environmentally friendly degradation process. Overall, the advantages of photodegradation using quantum dots make it a promising method for efficiently degrading dyes. However, most quantum dots are synthesized using cadmium ions (i.e., CdSe. CdS), limiting their applicability in photocatalytic processes.
The incorporation of metal ions into non-toxic metal-oxides nanoparticles such as ZnO imparts unique properties. It enables a range of applications ranging from antimicrobial, nanomedicine, photocatalysis, optoelectronic devices, and sensors. It is important to note that the specific properties and applications of metal-doped ZnO nanoparticles can vary depending on factors such as the dopant, doping concentration, and synthesis method employed [16,17,18,19].
The objective of this research was to evaluate the photocatalytic degradation of Tropaeolin O dye using photoactive silver-doped zinc oxide (Ag-doped ZnO) nanoparticles. The presence of silver ions in ZnO crystals can cause a change in the electronic characteristic of ZnO, enhancing its catalytic capacity. Moreover, the photodegradation pathway of Tropaeolin O is monitored by analyzing degradation fragments using liquid chromatography coupled to high-resolution mass spectrometry, indicating the mineralization of the organic dye.

2. Materials and Methods

2.1. Materials

Zinc acetate dihydrate (Zn(C2H3O2)2.2H2O, ACS reagent ≥ 98%, Sigma Aldrich, St. Louis, MO, USA), sodium hydroxide (NaOH, purity 95–100.5%, Spectrum Chemical, New Brunswick, NJ, USA), polyvinylpyrrolidone (PVP, Mw: 360,000 g/mol, Sigma Aldrich, St. Louis, MO, USA), silver nitrate (AgNO3, ACS reagent, Spectrum Chemical, New Brunswick, NJ, USA), and ethylene glycol (spectrophotometric grade ≥ 99%, Sigma Aldrich, St. Louis, MO, USA) were employed in the nanocatalysts’ synthesis. Tropaeolin O (C12H9N2NaO5S, Spectrum Chemical, New Brunswick, NJ, USA) was used for the photocatalysis experiments. Methanol (CH3O, ≥LC-MS grade ≥ 99.9% Baker analyzed, Phillipsburg, NJ, USA), 2-propanol ((CH3)2CHOH, ≥ LC-MS hypergrade ≥ 99.9%, Supelco, St. Louis, MO, USA), and formic acid (CH2O2, LC-MS grade ≥ 97.5–98.5% Supelco, St. Louis, MO, USA) were acquired for chromatographic analyses. Ultrapure water was used in all the experiments. The reagents were used without further purification.

2.2. Synthesis/Preparation of Ag-Doped ZnO Nanoparticles

In previous works, ZnO was synthesized in the presence of ethylene glycol under two precursors (zinc (II) acetate dihydrate and zinc (II) sulphate heptahydrate). These samples were refluxed at a temperature of 197 °C, and the reaction times were 2, 3, 4, and 6 h. Samples synthesized in the presence of zinc acetate at a reaction time of 3 h were selected for future studies based on their better optical properties [14]. Ag-doped ZnO nanoparticles were produced in the presence of 0.5 M zinc (II) acetate dihydrate, 1.0 M sodium hydroxide (NaOH), 0.015 g of Polyvinylpyrrolidone (PVP), 0.054875 g of silver nitrate (5% of dopant agent), and 20 mL of ethylene glycol. The synthesis was performed in a three-neck round bottom flask at 197 °C and three hours of reaction time. A dopant agent at 5% was used because preliminary studies using concentrations of 1% and 3% of silver ions did not evidence the generation of doped nanomaterials. As-synthesized colloidal doped nanoparticles were washed with deionized water and centrifugated at 5000 rpm for 15 min using Millipore centrifugal filters (50,000 MWCO). Nanoparticles were dried overnight at 100 °C and saved for further characterization.

2.3. Characterization of Ag-Doped ZnO Nanoparticles

The UV-visible absorption spectra of Ag-doped ZnO nanoparticles were monitored in the spectral range of 200–900 nm using a UV-2700i spectrophotometer (Shimadzu, Columbia, MD, USA). Additionally, photoluminescence properties were studied using an RF-6000 spectrofluorometer (Shimadzu, Columbia, MD, USA). The morphology was analyzed by high-resolution transmission electron microscopy (HRTEM) using a JEM-ARM200cF (JEOL) microscope at 200 kV. The instrument is equipped with an Oxford Aztec energy-dispersive X-ray spectrometer. The Ag-doped ZnO crystalline structure was determined by electron diffraction (ED). Energy dispersive X-ray spectroscopy (EDX) quantification was based on the Cliff–Lorimer factor (k-factor) and the calibration was performed using a standard pure copper sample.

2.4. Photocatalytic Experiments of Tropaeolin O

The photocatalytic degradation of Tropaeolin O was realized in the presence of light-activated Ag-doped ZnO nanoparticles, and the remanent concentration was monitored using a UV-Vis spectrophotometer 2700i and a 6530 accurate-mass QTOF-LC-MS (Agilent, Santa Clara, CA, USA). Standard solutions (1 μM, 5 μM, 10 μM, 20 μM, 30 μM, 35 μM, and 40 μM) were prepared from a 500 μM stock solution.
For the absorbance analyses, the calibration curve and the Tropaeolin O concentration were performed at 492 nm. The initial concentration of Tropaeolin O was 35 μM, and the concentrations of the nanoparticles were 50 mg/L and 100 mg/L. The experimental solutions were prepared in an aqueous medium and tripled for each concentration. Additionally, control solutions were prepared, containing only the specified concentration of the dye (35 μM) and deionized water, and were labeled as UV controls and darkness controls.
For the QTOF-LC-MS, a Zorbax CN column (Agilent Technologies, Santa Clara, CA, USA) and a mobile phase of 68% methanol and 32% formic acid (0.1%) were used for separation. A total ion chromatogram (TIC) and extracted ion analysis were used to determine the Tropaeolin O concentration and the presence of degradation fragments. The photocatalytic experiments were performed using a 35 μM aqueous solution of Tropaeolin O and 100 mg/L of the Ag-doped ZnO nanoparticles.
The solutions (for both experiments) were placed at room temperature in a rotamix at 20–25 rpm under an 8-watt UV Lamp (302 nm) with power irradiation of 10 mW cm−2 and were irradiated for specific intervals. The darkness controls were placed in an unlit space under the same conditions. After each interval, all samples were collected and analyzed using the UV–Vis Spectrophotometer at 492 nm and the QTOF-LC-MS to track the degradation progress of the dye. The decrease in the concentration of Tropaeolin O over time was estimated from calibration curves.

3. Results and Discussion

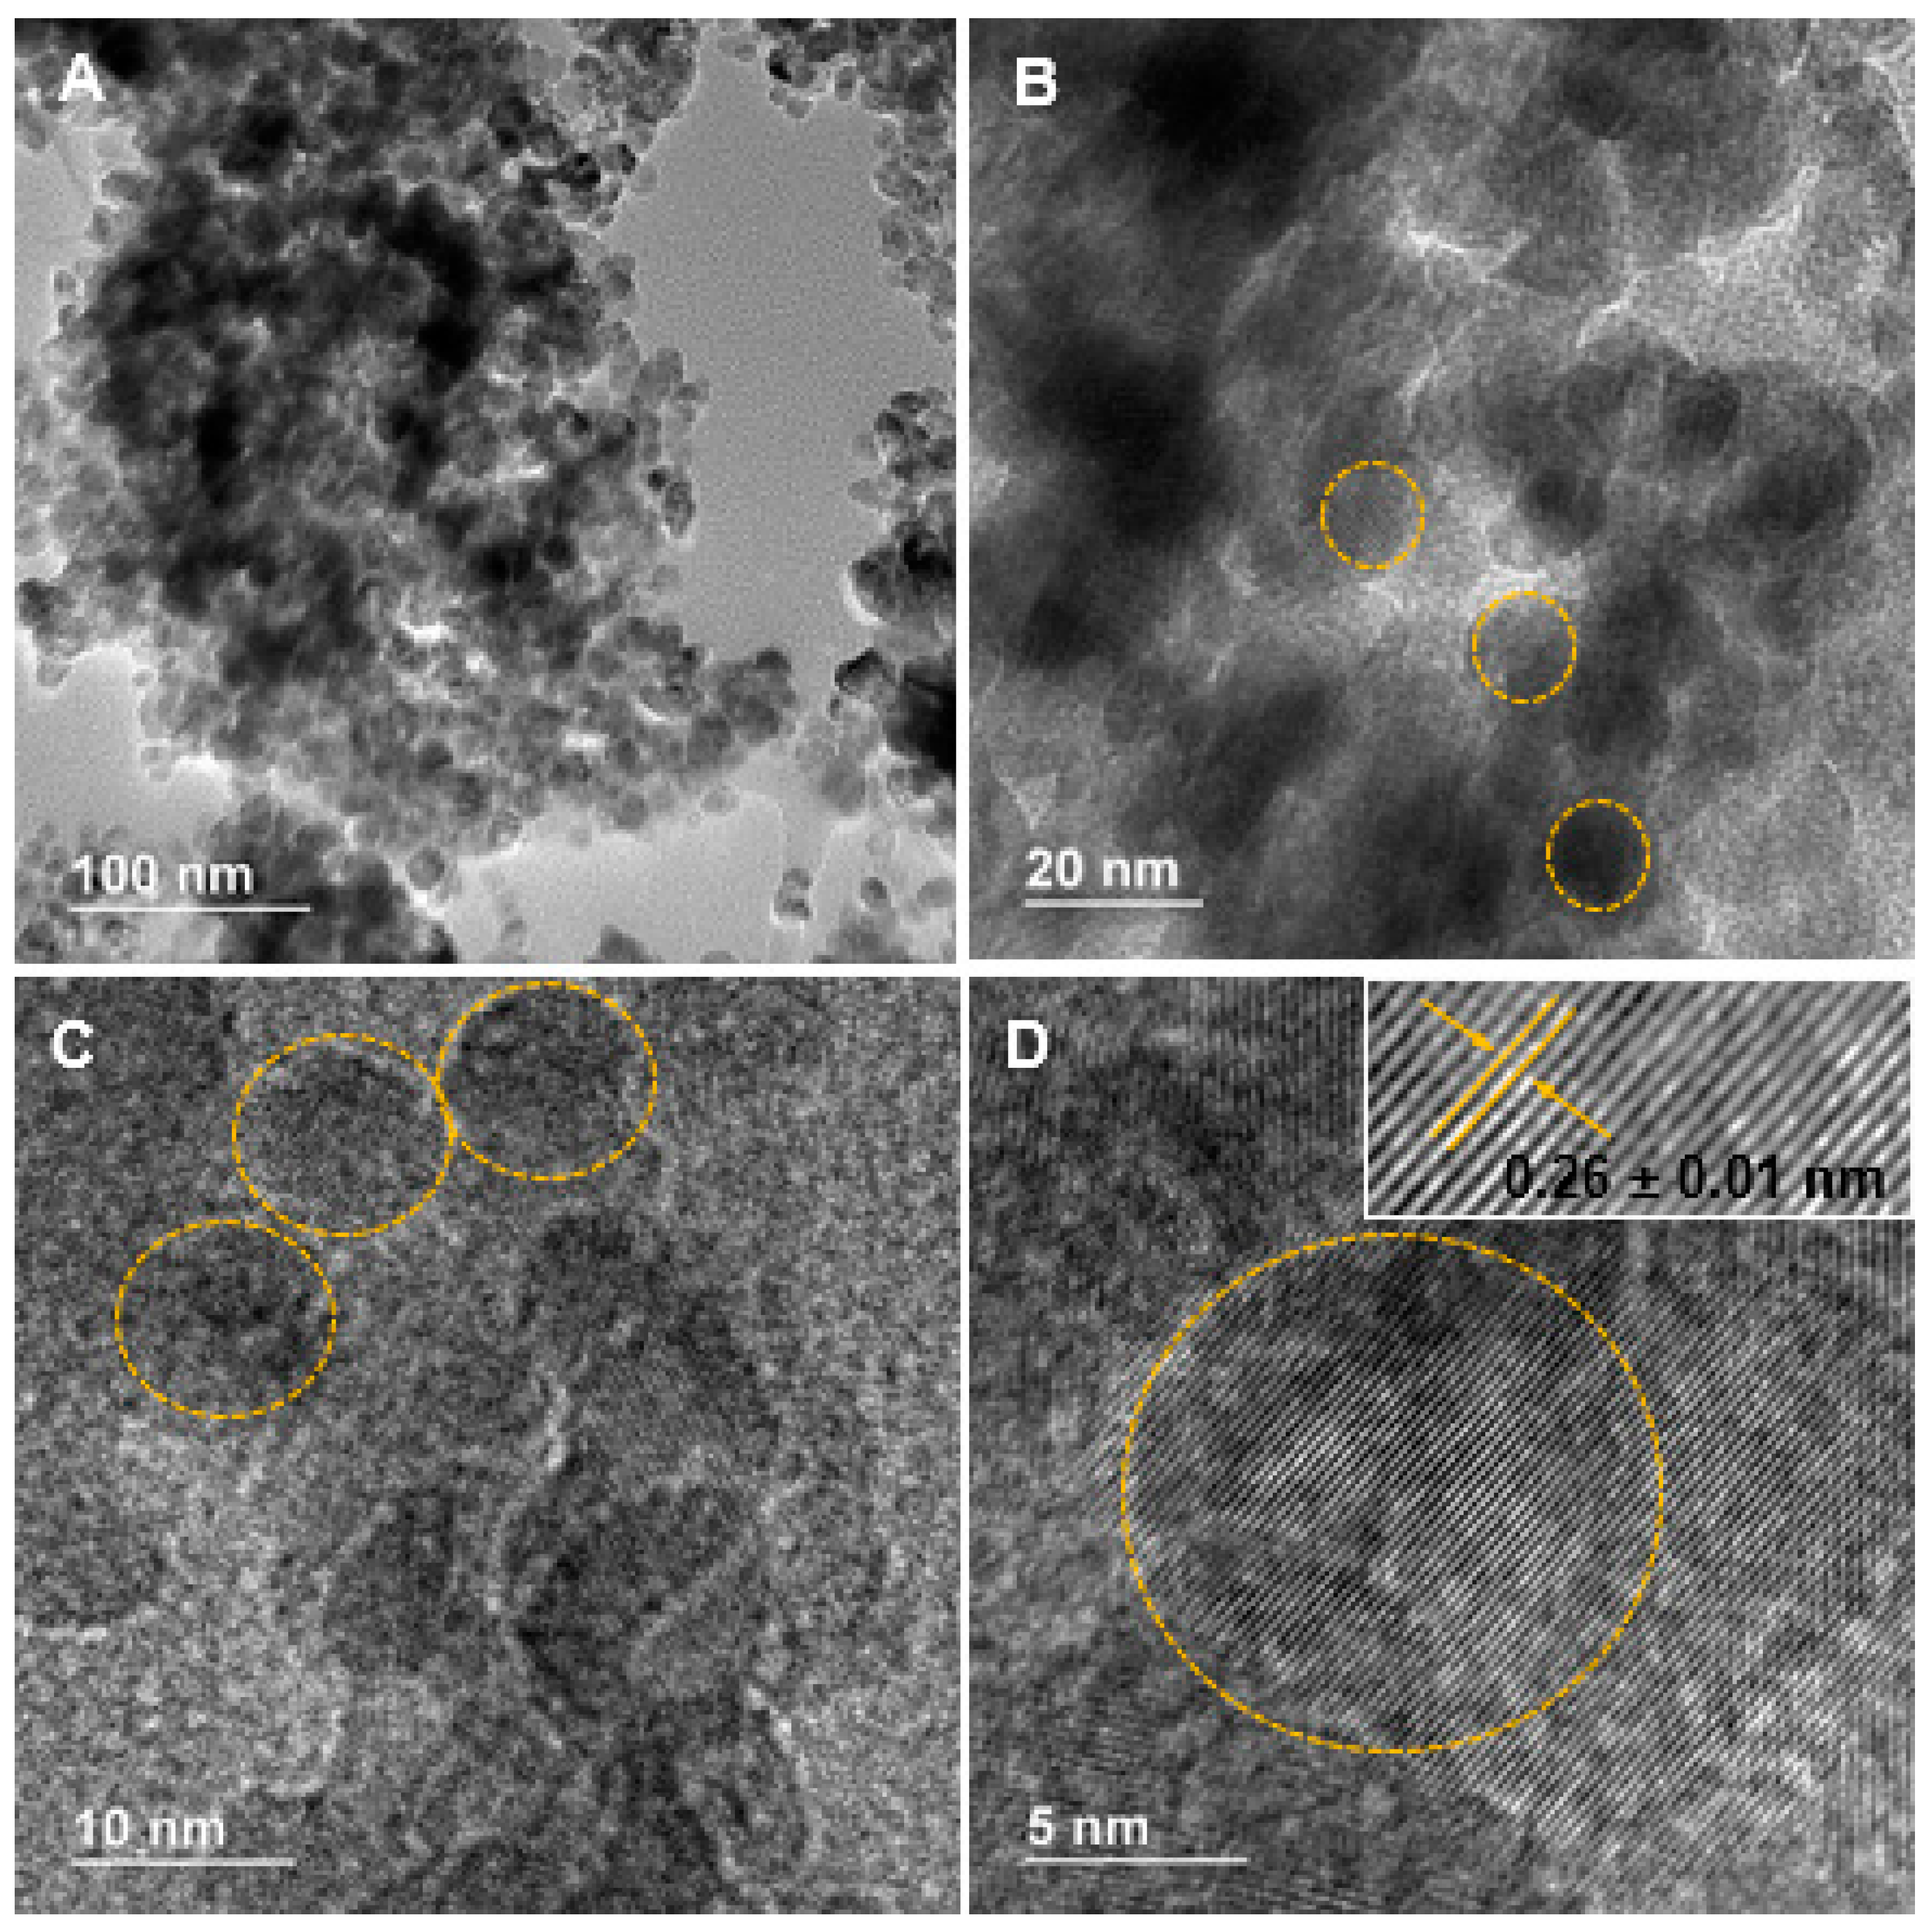
3.1. Morphological, Compositional, and Optical Characterization

High-resolution transmission electron microscopy (HRTEM) was used to examine the shape and size of synthesized nanoparticles. Ag-doped ZnO agglomerated nanoparticles are shown in Figure 1A–D. These images evidence the nanometric nature (~10 nm) of these crystalline structures with mainly spherical morphology. The lattice spacing for the nanomaterials in the inset (Figure 1D) was about 0.26 ± 0.01 nm, corresponding to the (002) plane of a hexagonal structure [20,21,22]. This average was obtained from ten measurements using the software ImageJ.
Electron diffraction (ED) patterns (Figure 2A) evidence the high crystallinity of the nanoparticles, and characteristic Miller indexes (100), (002), and (101) suggest a hexagonal wurtzite structure. An elemental composition (Figure 2B) of 56.2% Zn, 37.8% O, and 5.9% Ag for Ag-doped ZnO nanoparticles was confirmed by energy dispersive X-ray spectroscopy (EDX).
Figure 3A shows the UV-absorption spectrum of Ag-doped ZnO nanoparticles in a colloidal solution. A characteristic peak in the UV region (350–400 nm) due to intrinsic absorption when electrons from the valence band jump to the conduction band [23,24] is observed. The band gap energy was estimated at 3.20 eV, following the Tauc equation. Additionally, Figure 4A shows the UV -absorption spectrum of non-doped ZnO nanoparticles for comparison purposes. The band gap value was the same as for the doped nanoparticles (3.20 eV). The band gap values for doped and non-doped ZnO are slightly lower than those for the bulk ZnO (3.30 eV), which could be attributed to the presence of surface defects in ZnO [25,26].
Figure 3B shows the photoluminescence spectrum of Ag-doped ZnO nanoparticles, which were recorded at an excitation wavelength of 300 nm. A main peak (band gap emission peak) was observed at around 395 nm and attributed to the exciton recombination in ZnO. A secondary peak (trap peak) in the visible range near 630 nm is attributed to the presence of structural defects in the crystal. These defects, such as oxygen vacancies and zinc interstitials, promote the radiative recombination of electrons and photogenerated holes in the crystals. Silver doping can promote excessive cations and, consequently, more anion vacancies (O2) might appear in the crystal conducting to tune the structure of the energy level of ZnO. The doping of ZnO induces the replacement of Zn2+ ions by Ag+ ions in the crystals, which was evidenced by the presence of low concentrations of silver ions (5.9%) in the nanoparticles. The presence of Ag+ ions in the crystals should have promoted the charge transfer from a donor-derived impurity band to unoccupied 3D states at the ZnO Fermi level [27,28,29]. Figure 4B shows the fluorescence spectrum for non-doped ZnO nanoparticles for comparison purposes. The absence of the trap peak near to 630 nm is evident in the doped particles. The main peak is observed in the region between 395 nm and 470 nm.

3.2. Photodegradation of Tropaeolin O

The photodegradation mechanisms of Ag-doped ZnO nanoparticles involve several processes that contribute to the degradation of organic compounds or pollutants. Some mechanisms associated with the photodegradation using these particles include the photocatalytic generation of reactive oxygen species (ROS) [30,31,32], charge transfer processes [33], direct interaction with adsorbed molecules, and surface plasmon resonance [34,35,36], among others. The specific mechanisms involved in the photodegradation using Ag-doped ZnO nanoparticles can depend on factors such as the nanoparticle size, doping concentration, morphology [37,38], and the nature of the organic compounds being degraded [39,40]. Additionally, parameters like light intensity, wavelength, and the presence of co-catalysts or electron donors in the system can influence degradation efficiency. In this research, the small sizes of doped nanoparticles (around 10 nm) and the subsequent high surface area should have enabled a larger catalytic site to destroy azo dyes.
The photodegradation of Tropaeolin O can be explained by the generation of reactive oxygen species (ROS) promoted by the presence of light-activated Ag-doped ZnO nanoparticles, which act as nanocatalysts. When Ag-doped ZnO nanoparticles are irradiated by electromagnetic radiation (i.e., 302 nm), the electrons from the valence band (VB) are excited and suffer electronic transitions to the conduction band (CB). Silver ions (Ag+) in the ZnO crystals act as an electron sink, trapping the electrons from the CB of the host and promoting interfacial charge-transfer kinetics that prevent electron–hole recombination. Then, VB holes and CB electrons react with water and oxygen molecules to generate hydroxyl and superoxide anion radicals, which promote the destruction of Tropaeolin O in the aqueous phase [41,42].
Figure 5A shows the degradation pattern of Tropaeolin O analyzed by absorption at 492 nm using two different concentrations of the Ag-doped ZnO nanocatalyst. The control solution in a dark environment (black line) indicates that none of the Tropaeolin O is adsorbed on the nanocatalyst, and the irradiated control solution (yellow line) confirms the recalcitrant property of the molecule, which is not affected by the UV-irradiation. Azo dyes are synthetic molecules that have high photolytic stability and low biodegradability [43]. The degradation is dependent on the nanocatalyst concentration and irradiation time. Around 58% of the Tropaeolin O was degraded using 50 ppm of the Ag-doped ZnO nanocatalyst, which was increased to 92% using 100 ppm during the first 550 min. In previous studies using 500 ppm of non-doped ZnO nanoparticles, 81% of the destruction of Tropaeolin O was achieved during the first 420 min, and no more degradation was observed after this time [14]. These findings suggest that the presence of silver ions at low concentrations in the ZnO crystals enhances the photocatalytic capacity of these nanoparticles. The results suggests the capacity of the nanocatalyst to produce ROS or interact directly with the Tropaeolin O molecule through the electron–hole pair, producing its degradation. The degradation efficiency of a nanocatalyst can also be explained by the point of zero charge (PZC) of the particle. The PZC is a significant parameter for determining the point where the positive charge and negative charge sites on the surface of the nanoparticles are equal. Based on the synthesis method, ZnO nanoparticles should have basic PZC values (PZC > 7.0) [44]. Tropaeolin O is considered an anionic dye because of the sulfonic group in its structure. This characteristic generates negatively charged tropaeolin O molecules after its dissolution in water with a high affinity to positively charged nanostructures.
Figure 5B shows the degradation pattern for the Tropaeolin O (C12H9N2O5SH+) molecule (295.04 m/z) analyzed by extracted ion chromatogram on QTOF-LC-MS using 100 ppm of Ag-doped ZnO nanocatalyst. Also, the figure shows the pattern of two additional peaks corresponding to Tropaeolin O fragments with sodium (C12H9N2O5SNa+ and C12H9N2O5SNaH+). Evidently, the Tropaeolin O (C12H9N2O5SH+) degradation time in this analysis is shorter and more complete than the absorption analysis. The spectrophotometric analysis measures the absorbance of all species in the solution at 492 nm, including the two fragments in Figure 5B and some small fragments in Figure 6B. In contrast, the chromatographic column of the QTOF-LC-MS allows the separation of the components based on their polarity, and the extracted ion analysis allows the fragment separation by their m/z rate.
Figure 6 shows the chromatogram and the pattern of degradation and production of fragments shorter than the Tropaeolin O during the degradation. The larger fragment (277.03 m/z) appears around 6.4 min in the chromatograms because it is the more non-polar compound. The other compounds with low m/z and more polarity appear between 4.5 and 5.0 min (Figure 6A). A selected ion analysis allowed their identification and integration. It is evident that traces of these compounds are initially present in the pure Tropaeolin O reagent. The increase and decrease of their concentration during the exposure time indicate that they are products related to the photodegradation process. The 174.02 m/z fragment indicates that the diazo group of the Tropaeolin O is an important key and an initial step of the degradation path. The ROS species and the electrons around the nitrogens in the diazo group should generate radicals on the molecule, producing a reorganization and rupture of the molecule between the nitrogens. A parallel step is the loss of an -OH of the sulfonic group on Tropaeolin O, generating the 277.03 m/z fragment. Some authors have suggested mechanisms by which the ROS affects functional groups with electronegative elements like N and O [45]. The 167.03 m/z fragment confirms the oxidative effect of the ROS on the degradation route. The 114.03 m/z fragment shows the capacity of the Ag-doped ZnO nanocatalyst to break the phthalic acid (167.03 m/z fragment) and the opening of the aromatic ring, which suggests the mineralization of the Tropaeolin O.

4. Conclusions

The optical characterization of Ag-doped ZnO nanoparticles evidenced a broad absorption peak in the UV region and two emission peaks at 395 nm and 630 nm. The presence of silver ions in the ZnO crystals acts as a sink of electrons and enhances the nanoparticles’ photocatalytic capacity. Around 92% of Tropaeolin O was degraded by Ag-doped ZnO nanoparticles under UV irradiation. Selected ion MS analysis confirmed that the degradation of Tropaeolin O occurs by photooxidation and subsequent mineralization.

Author Contributions

Conceptualization, S.J.B.-R. and L.A.-N.; Funding acquisition, S.J.B.-R. and Y.C.-M.; Methodology, S.J.B.-R., K.T.-T. and L.A.-N.; Writing—original draft, S.J.B.-R., Y.C.-M. and L.A.-N.; Writing—review & editing, Y.C.-M. All authors have read and agreed to the published version of the manuscript.

Funding

This research was funded by the United States Department of Defense (DOD), Army Research Office, Grant No. W911NF-21-1-0206.

Institutional Review Board Statement

Not applicable.

Informed Consent Statement

Not applicable.

Data Availability Statement

The data related to this work are not publicly available but can be obtained from the corresponding author upon reasonable request.

Acknowledgments

T.E.M. analyses were performed at the National High Magnetic Field Laboratory, supported by National Science Foundation Cooperative Agreement No. DMR-2128556 and the State of Florida.

Conflicts of Interest

The authors declare no conflict of interest.

References

  1. Hemdan, S.; Mansour, A.; Ali, F. The Behavior and Properties of Some Acid-Base Indicators: A Review. J. Sci. Hum. Stu. 2020, 66, 1–22. [Google Scholar]
  2. Heydari, R.; Bastami, F.; Hosseini, M.; Alimoradi, M. Simultaneous Determination of Tropaeolin O and Brilliant Blue in Food Samples after Cloud Point Extraction. Iran. Chem. Commun. 2017, 5, 242–251. [Google Scholar]
  3. Tarao, S. On the Nature of Cytoplasmic Constituents in Amoeba Diploidea Examined by Means of Staining and Chemical Reactions. Hokkaido Univ. Collect. Sch. Acad. Pap. 1942, 8, 9–30. [Google Scholar]
  4. Bumpus, J.A. Microbial Degradation of Azo Dyes. In Progress in Industrial Microbiology; Biotransformations; Singh, V.P., Ed.; Elsevier: Amsterdam, The Netherlands, 1995; Volume 32, pp. 157–176. [Google Scholar]
  5. Kumar, L.; Bharadvaja, N. 12—Microorganisms: A Remedial Source for Dye Pollution. In Removal of Toxic Pollutants through Microbiological and Tertiary Treatment; Shah, M.P., Ed.; Elsevier: Amsterdam, The Netherlands, 2020; pp. 309–333. ISBN 978-0-12-821014-7. [Google Scholar]
  6. Alaton, I.A.; Teksoy, S. Acid Dyebath Effluent Pretreatment Using Fenton’s Reagent: Process Optimization, Reaction Kinetics and Effects on Acute Toxicity. Dye. Pigment. 2007, 73, 31–39. [Google Scholar] [CrossRef]
  7. Amat, A.M.; Arques, A.; Miranda, M.A.; Seguí, S.; Vercher, R.F. Degradation of Rosolic Acid by Advanced Oxidation Processes: Ozonation vs. Solar Photocatalysis. Desalination 2007, 212, 114–122. [Google Scholar] [CrossRef]
  8. Hama Aziz, K.H.; Mahyar, A.; Miessner, H.; Mueller, S.; Kalass, D.; Moeller, D.; Khorshid, I.; Rashid, M.A.M. Application of a Planar Falling Film Reactor for Decomposition and Mineralization of Methylene Blue in the Aqueous Media via Ozonation, Fenton, Photocatalysis and Non-Thermal Plasma: A Comparative Study. Process Saf. Environ. Prot. 2018, 113, 319–329. [Google Scholar] [CrossRef]
  9. Bal, G.; Thakur, A. Distinct Approaches of Removal of Dyes from Wastewater: A Review. Mater. Today Proc. 2022, 50, 1575–1579. [Google Scholar] [CrossRef]
  10. Wazir, M.B.; Daud, M.; Ali, F.; Al-Harthi, M.A. Dendrimer Assisted Dye-Removal: A Critical Review of Adsorption and Catalytic Degradation for Wastewater Treatment. J. Mol. Liq. 2020, 315, 113775. [Google Scholar] [CrossRef]
  11. Fan, L.; Zhou, Y.; Yang, W.; Chen, G.; Yang, F. Electrochemical Degradation of Aqueous Solution of Amaranth Azo Dye on ACF under Potentiostatic Model. Dye. Pigment. 2008, 76, 440–446. [Google Scholar] [CrossRef]
  12. Reza, K.M.; Kurny, A.; Gulshan, F. Parameters Affecting the Photocatalytic Degradation of Dyes Using TiO2: A Review. Appl. Water Sci. 2017, 7, 1569–1578. [Google Scholar] [CrossRef] [Green Version]
  13. Saeed, M.; Muneer, M.; Haq, A.U.; Akram, N. Photocatalysis: An Effective Tool for Photodegradation of Dyes—A Review. Environ. Sci. Pollut. Res. 2022, 29, 293–311. [Google Scholar] [CrossRef] [PubMed]
  14. Torres-Torres, K.; Nash-Montes, V.I.; Luciano-Velázquez, J.; Bailón-Ruiz, S.J. Degradation of Amaranth and Tropaeolin O in the Presence of ZnO Nanoparticles. Int. Nano Lett. 2022, 12, 295–300. [Google Scholar] [CrossRef]
  15. Luciano-Velázquez, J.; Xin, Y.; Su, Y.; Quiles-Vélez, C.I.; Cruz-Romero, S.A.; Torres-Mejías, G.E.; Rivera-De Jesús, J.; Bailón-Ruiz, S.J. Synthesis, Characterization, and Photocatalytic Activity of ZnS and Mn-Doped ZnS Nanostructures. MRS Adv. 2021, 6, 252–258. [Google Scholar] [CrossRef]
  16. Singh, P.; Kumar, R.; Singh, R.K. Progress on Transition Metal-Doped ZnO Nanoparticles and Its Application. Ind. Eng. Chem. Res. 2019, 58, 17130–17163. [Google Scholar] [CrossRef]
  17. Saleh, R.; Djaja, N.F. Transition-Metal-Doped ZnO Nanoparticles: Synthesis, Characterization and Photocatalytic Activity under UV Light. Spectrochim. Acta Part A Mol. Biomol. Spectrosc. 2014, 130, 581–590. [Google Scholar] [CrossRef] [PubMed]
  18. Gopal, P.; Spaldin, N.A. Magnetic Interactions in Transition-Metal-Doped ZnO: An Ab Initio Study. Phys. Rev. B 2006, 74, 094418. [Google Scholar] [CrossRef] [Green Version]
  19. Sanakousar, F.M.; Vidyasagar, C.C.; Jiménez-Pérez, V.M.; Prakash, K. Recent Progress on Visible-Light-Driven Metal and Non-Metal Doped ZnO Nanostructures for Photocatalytic Degradation of Organic Pollutants. Mater. Sci. Semicond. Process 2022, 140, 106390. [Google Scholar] [CrossRef]
  20. Dutta, R.K.; Nenavathu, B.P.; Talukdar, S. Anomalous Antibacterial Activity and Dye Degradation by Selenium Doped ZnO Nanoparticles. Colloids Surf. B Biointerfaces 2014, 114, 218–224. [Google Scholar] [CrossRef]
  21. Ismail, A.F.M.; Ali, M.M.; Ismail, L.F.M. Photodynamic Therapy Mediated Antiproliferative Activity of Some Metal-Doped ZnO Nanoparticles in Human Liver Adenocarcinoma HepG2 Cells under UV Irradiation. J. Photochem. Photobiol. B 2014, 138, 99–108. [Google Scholar] [CrossRef]
  22. Singh, P.; Kumar Singh, R.; Kumar, R. Journey of ZnO Quantum Dots from Undoped to Rare-Earth and Transition Metal-Doped and Their Applications. RSC Adv. 2021, 11, 2512–2545. [Google Scholar] [CrossRef]
  23. Cerrato, E.; Zickler, G.A.; Paganini, M.C. The Role of Yb Doped ZnO in the Charge Transfer Process and Stabilization. J. Alloys Compd. 2020, 816, 152555. [Google Scholar] [CrossRef]
  24. Yibi, Y.; Chen, J.; Xue, J.; Song, J.; Zeng, H. Enhancement of Adjustable Localized Surface Plasmon Resonance in ZnO Nanocrystals via a Dual Doping Approach. Sci. Bull. 2017, 62, 693–699. [Google Scholar] [CrossRef]
  25. Pathak, T.K.; Swart, H.C.; Kroon, R.E. Structural and Plasmonic Properties of Noble Metal Doped ZnO Nanomaterials. Phys. B Condens. Matter 2018, 535, 114–118. [Google Scholar] [CrossRef]
  26. Lee, G.J.; Deshpande, N.G.; Lee, Y.P.; Cheong, H.; Swami, N.; Bhat, J.S. Optical and Structural Properties of Al-ZnO Nanocomposites. J. Nanosci. Nanotechnol. 2014, 14, 3661–3666. [Google Scholar] [CrossRef]
  27. Ersöz, E.; Altintas Yildirim, O. Green Synthesis and Characterization of Ag-Doped ZnO Nanofibers for Photodegradation of MB, RhB and MO Dye Molecules. J. Korean Ceram. Soc. 2022, 59, 655–670. [Google Scholar] [CrossRef]
  28. Aydin, E.B. Preparation, Characterization and Immobilization of Ag-Doped ZnO-Nanorods into Ca and Cu Alginate Beads and Their Application in the Photodegradation of Methylene Blue. ChemistrySelect 2021, 6, 11653–11663. [Google Scholar] [CrossRef]
  29. Vallejo, W.; Cantillo, A.; Díaz-Uribe, C. Methylene Blue Photodegradation under Visible Irradiation on Ag-Doped ZnO Thin Films. Int. J. Photoenergy 2020, 2020, e1627498. [Google Scholar] [CrossRef] [Green Version]
  30. Babu, A.T.; Antony, R. Green Synthesis of Silver Doped Nano Metal Oxides of Zinc & Copper for Antibacterial Properties, Adsorption, Catalytic Hydrogenation & Photodegradation of Aromatics. J. Environ. Chem. Eng. 2019, 7, 102840. [Google Scholar] [CrossRef]
  31. Al-Ariki, S.; Yahya, N.A.A.; Al-A’nsi, S.A.; Jumali, M.H.H.; Jannah, A.N.; Abd-Shukor, R. Synthesis and Comparative Study on the Structural and Optical Properties of ZnO Doped with Ni and Ag Nanopowders Fabricated by Sol Gel Technique. Sci. Rep. 2021, 11, 11948. [Google Scholar] [CrossRef]
  32. Shabaaz Begum, J.P.; Manjunath, K.; Pratibha, S.; Dhananjaya, N.; Sahu, P.; Kashaw, S. Bioreduction Synthesis of Zinc Oxide Nanoparticles Using Delonix Regia Leaf Extract (Gul Mohar) and Its Agromedicinal Applications. J. Sci. Adv. Mater. Devices 2020, 5, 468–475. [Google Scholar] [CrossRef]
  33. Bagabas, A.; Alshammari, A.; Aboud, M.F.; Kosslick, H. Room-Temperature Synthesis of Zinc Oxide Nanoparticles in Different Media and Their Application in Cyanide Photodegradation. Nanoscale Res. Lett. 2013, 8, 516. [Google Scholar] [CrossRef] [PubMed] [Green Version]
  34. Mintcheva, N.; Aljulaih, A.A.; Wunderlich, W.; Kulinich, S.A.; Iwamori, S. Laser-Ablated ZnO Nanoparticles and Their Photocatalytic Activity toward Organic Pollutants. Materials 2018, 11, 1127. [Google Scholar] [CrossRef] [PubMed] [Green Version]
  35. Zhang, X.; Qin, J.; Xue, Y.; Yu, P.; Zhang, B.; Wang, L.; Liu, R. Effect of Aspect Ratio and Surface Defects on the Photocatalytic Activity of ZnO Nanorods. Sci. Rep. 2014, 4, 4596. [Google Scholar] [CrossRef] [Green Version]
  36. Herzi, A.; Sebais, M.; Boudine, B.; Halimi, O.; Rahal, B.; Guerbous, L. Fabrication and Characterization of Highly Textured Thin Films of Undoped and Ag-Doped ZnO. Acta Phys. Pol. A 2019, 135, 526–531. [Google Scholar] [CrossRef]
  37. Arunachalam, A.; Dhanapandian, S.; Rajasekaran, M. Morphology Controllable Flower like Nanostructures of Ag Doped ZnO Thin Films and Its Application as Photovoltaic Material. J. Anal. Appl. Pyrolysis 2017, 123, 107–117. [Google Scholar] [CrossRef]
  38. Kumar, S.; Singh, V.; Tanwar, A. Structural, Morphological, Optical and Photocatalytic Properties of Ag-Doped ZnO Nanoparticles. J. Mater. Sci. Mater. Electron. 2016, 27, 2166–2173. [Google Scholar] [CrossRef]
  39. Tsai, Y.-T.; Chang, S.-J.; Ji, L.-W.; Hsiao, Y.-J.; Tang, I.-T.; Lu, H.-Y.; Chu, Y.-L. High Sensitivity of NO Gas Sensors Based on Novel Ag-Doped ZnO Nanoflowers Enhanced with a UV Light-Emitting Diode. ACS Omega 2018, 3, 13798–13807. [Google Scholar] [CrossRef] [Green Version]
  40. Ortega, Y.; Fernández, P.; Piqueras, J. Growth and Luminescence of Oriented Nanoplate Arrays in Tin Doped ZnO. Nanotechnology 2007, 18, 115606. [Google Scholar] [CrossRef]
  41. Kareem, M.A.; Bello, I.T.; Shittu, H.A.; Sivaprakash, P.; Adedokun, O.; Arumugam, S. Synthesis, Characterization, and Photocatalytic Application of Silver Doped Zinc Oxide Nanoparticles. Clean. Mater. 2022, 3, 100041. [Google Scholar] [CrossRef]
  42. Joe, A.; Park, S.-H.; Kim, D.-J.; Lee, Y.-J.; Jhee, K.-H.; Sohn, Y.; Jang, E.-S. Antimicrobial Activity of ZnO Nanoplates and Its Ag Nanocomposites: Insight into an ROS-Mediated Antibacterial Mechanism under UV Light. J. Solid State Chem. 2018, 267, 124–133. [Google Scholar] [CrossRef]
  43. Si, J.; Yang, X.; Luan, H.; Shao, Y.; Yao, K. Cheap, Fast and Durable Degradation of Azo Dye Wastewater by Zero-Valent Iron Structural Composites. J. Environ. Chem. Eng. 2021, 9, 106314. [Google Scholar] [CrossRef]
  44. Zyoud, A.; Zubi, A.; Zyoud, S.; Hilal, M.; Zyoud, S.; Qamhieh, N.; Hajamohideen, A.; Hilal, H. Kaolin-supported ZnO nanoparticle catalysts in self-sensitized tetracycline photodegradation: Zero-point charge and pH effects. Appl. Clay Sci. 2019, 182, 105294. [Google Scholar] [CrossRef]
  45. Alamo-Nole, L.; Bailon-Ruiz, S.; Luna-Pineda, T.; Perales-Perez, O.; Roman, F.R. Photocatalytic Activity of Quantum Dot–Magnetite Nanocomposites to Degrade Organic Dyes in the Aqueous Phase. J. Mater. Chem. A 2013, 1, 5509–5516. [Google Scholar] [CrossRef]
Figure 1. (A,B) Low magnification; and (C,D) high magnification transmission electron microscopy micrographs of Ag-doped ZnO nanoparticles.
Micro 03 00045 g001
Figure 2. (A) Electron diffraction pattern; (B) energy dispersive X-ray spectroscopy measurement of Ag-doped ZnO nanoparticles.
Micro 03 00045 g002
Figure 3. (A) Absorbance spectrum and band gap estimation (inset); (B) Photoluminescence spectrum of Ag-doped ZnO nanoparticles.
Micro 03 00045 g003
Figure 4. (A) Absorbance spectrum and band gap estimation (inset); (B) Photoluminescence spectrum of non-doped ZnO nanoparticles.
Micro 03 00045 g004
Figure 5. (A) Photodegradation of Tropaeolin O measured by spectrophotometry at 492 nm and (B) selected ion chromatogram (fragment 295.04 m/z).
Micro 03 00045 g005
Figure 6. (A) Selected ion chromatograms and (B) photodegradation patterns of the degradation products of Tropaeolin O.
Micro 03 00045 g006
Disclaimer/Publisher’s Note: The statements, opinions and data contained in all publications are solely those of the individual author(s) and contributor(s) and not of MDPI and/or the editor(s). MDPI and/or the editor(s) disclaim responsibility for any injury to people or property resulting from any ideas, methods, instructions or products referred to in the content.

